El Camino College Annual. Fact Book. Institutional Research & Planning
|
|
|
- Madeline Lindsey
- 6 years ago
- Views:
Transcription


1 El Camino College 2014 Annual Fact Book Institutional Research & Planning

2 Table of Contents Introduction.2 El Camino College Service Area.3 Student and Enrollment Trends..8 Special Programs...14 Success and Retention.. 25 Student Outcomes. 29 Appendix.35 Institutional Research & Planning Irene Graff, Director Marci Myers, Research Analyst Compton Center Carolyn Pineda, Research Analyst Joshua Rosales, Research Analyst Mike Wilson, Research Analyst
3 Introduction The ECC Annual Fact Book is a reference source containing trend data about students, student outcomes, and instructional programs and services. The data and analysis in the fact book provide background information to facilitate policy analysis and decision making. It should be a useful tool in college and departmental planning, grant preparation, and in the accreditation process. It is our hope that the information provided is used to objectively evaluate programs and practices as well as visualize the trends that affect El Camino College s current and future operations. Demographic and enrollment data on ECC students was provided by the Chancellor s Office. Some of the data in the Special Programs section was extracted from the college s student database. In addition, data from the National Student Clearinghouse was used to provide transfer destination information. The National Student Clearinghouse is a national, non-profit organization that offers access to enrollment and degree records. The Fact Book was composed and assembled by Carolyn Pineda, Research Analyst and Esthela Chavez, Research Intern. Special acknowledgement goes to Public Relations and Marketing for providing the photographs used in this publication and Marci Myers, ECC Compton Center Research Analyst, for creating the cover page. Please send any comments or feedback to Institutional Research & Planning. 2

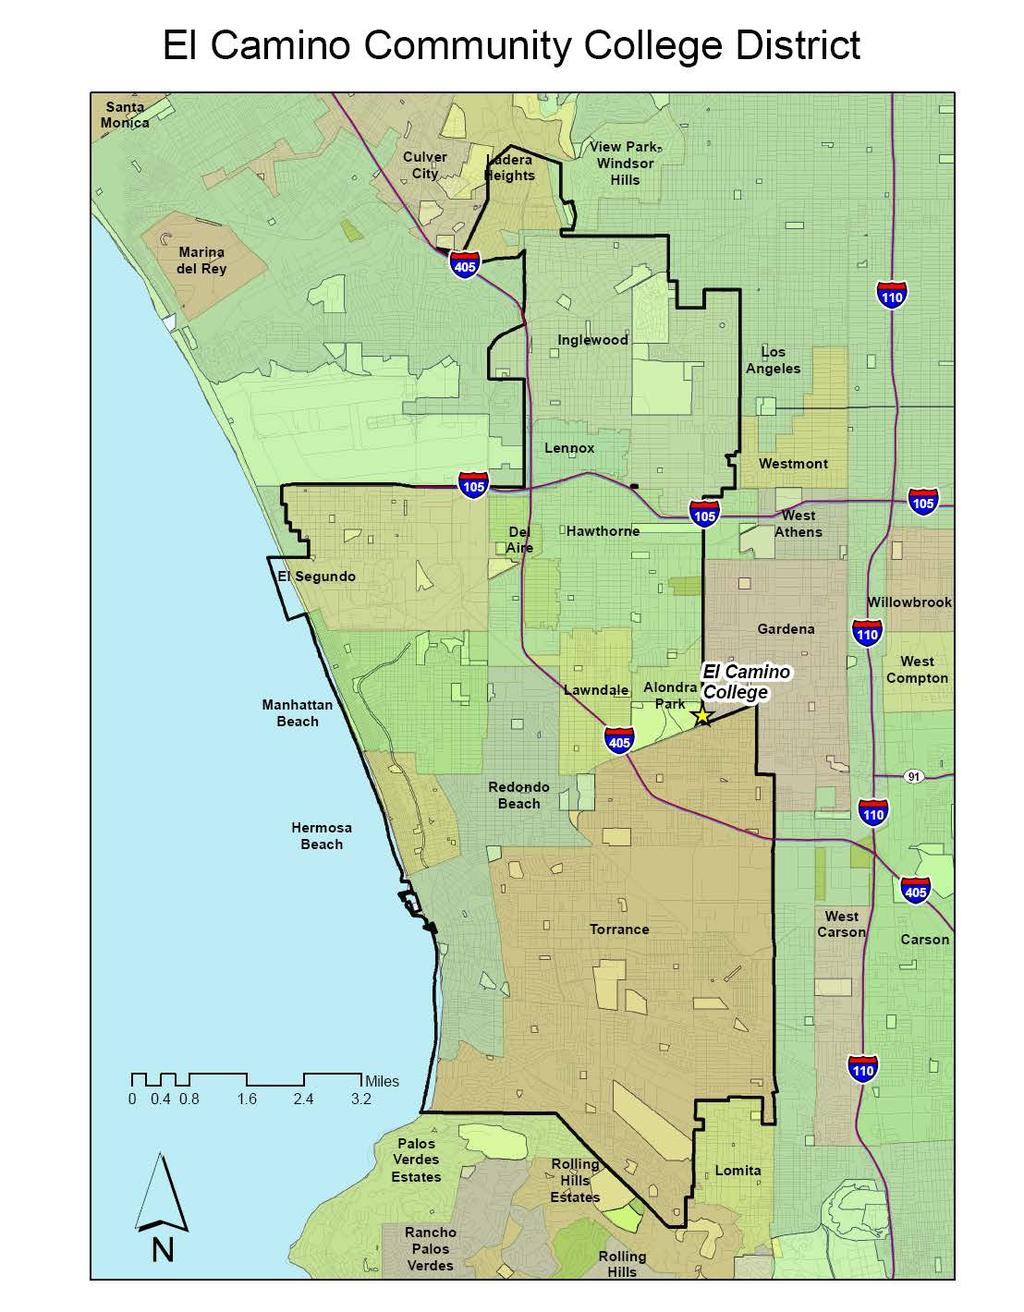
4 El Camino College Service Area 3
5 4

6 Enrollment by Residence On average, approximately half of students enrolled at El Camino College lived within the El Camino Community College District (ECCCD). In , 33% of students reside within 7.5 miles of the college while 22% live beyond a 7.5 mile radius of El Camino College. Although modest, the number of students coming from within the District has declined by four percentage points in the last five years. El Camino College Enrollment by Residency to % 50% 40% 30% 20% 10% 0% In District Out of District (within 7.5 miles radius) Out of District (beyond 7.5 miles radius) % 29% 22% % 29% 22% % 31% 21% % 32% 22% % 33% 22% 5
7 Enrollment by Zip Code (7.5 Mile Radius) In the academic year, nearly 5,700 students resided in Torrance while another 3,095 students resided in Hawthorne, the two largest feeder cities within the College district. Students who resided outside the district were primarily from Los Angeles and Gardena with 3,923 and 3,010 students, respectively. 6 City Zip Code Enrollment Percent of Enrollment Grand Total 32, Carson Carson Total 1, Compton Compton Total 1, El Segundo Total 90245* Gardena , , Gardena Total 3, Harbor City Total Hawthorne 90250* 3, Hawthorne Total 3, Hermosa Beach Total 90254* Inglewood 90301* * * Inglewood Total 1, Lawndale Total 90260* 1, Lennox 90303* * Lennox Total 1,
8 City Zip Code Enrollment Percent of Enrollment Lomita Total Los Angeles , * Los Angeles Total 3, Manhattan Beach 90266* Manhattan Beach Total Redondo Beach 90277* * 1, Redondo Beach Total 1, Torrance 90501* 1, * 1, * 1, * * Torrance Total 5, ECC District Total 14, Out of District Total 10, Total Students in 7.5 Mile Radius *Zip codes located within the district 25,

9 Student and Enrollment Trends 8
10 Total Enrollment After enrolling nearly 40,000 students in , student enrollment has steadily decreased in the last four years with a slight increase in the year. There was a 23% decrease in enrollment from the to academic year. These declines are primarily due to budgetary constraints that lead to reduction in sections offered. 42,000 40,000 38,000 39,765 Total College Enrollment 36,000 34,000 32,000 30,000 Enrollment by Gender 35,418 32,910 31,713 32, Overall, about 11% more women than men have attended ECC in the last 5 years. The greatest difference was found in when 13% more women than men attending ECC. The gender gap narrowed in when 8% more women than men attended ECC. Enrollment by Gender Female Male 21,120 18,633 18,453 16,940 17,342 16,713 16,724 15,560 14,997 15,

11 Enrollment by Age In the last five years, 66% of enrolled students were less than 19 to 24 years of age. Working adults ages comprised 27% of enrolled student while 7% of students are ages 45 and older. From to , there was a 13% decrease in students ages Enrollment among this age group continued to decrease slightly through Additionally, in , enrollment among students ages 19 or younger increased by 2% shifting from the declining trend of the previous four years. Enrollment by Age 16,000 14,000 12,000 10,000 8,000 6,000 4,000 2, or less Age or less 11,421 10,784 9,588 9,155 9, ,310 12,394 12,369 12,223 12, ,822 6,923 6,563 6,278 6, ,023 2,635 2,171 1,963 1, ,086 1,749 1,354 1,274 1, , Unknown Age or less 28.7% 30.4% 29.1% 32.8% 29.1% % 35.0% 37.6% 30.9% 39.4% % 19.5% 19.9% 18.5% 19.8% % 7.4% 6.6% 8.9% 5.9% % 4.9% 4.1% 5.6% 3.4% % 2.6% 2.6% 3.2% 2.4% Unknown 0.0% 0.0% 0.0% 0.0% 0.0%

12 Enrollment by Ethnicity Latinos represent the largest ethnic group on campus comprising 48% of the student population, an 11% increase in 5 years. This may be partially a reflection of the changes in ethnic coding that the California Community Colleges Chancellor s Office adopted in Fall Other groups have remained fairly stable, with the exception of White students, whose representation has declined by about four percentage points, likely due to general aging of the District population. Enrollment by Ethnicity Percent of Total Population African-American Amer. Ind. or Alask. Native Asian Latino Pacific Islander Two or more races Unknown or Decline White 0% 10% 20% 30% 40% 50% Ethnic Group African-American 18.2% 18.5% 19.0% 18.4% 17.8% Amer. Ind. or Alask. Native 0.3% 0.3% 0.3% 0.2% 0.2% Asian 17.6% 16.8% 16.6% 15.7% 15.3% Latino 34.1% 38.1% 40.1% 43.8% 46.7% Pacific Islander 0.9% 0.7% 0.6% 0.6% 0.6% Two or more races 2.1% 2.9% 3.4% 3.9% 4.0% Unknown or Decline 8.1% 5.0% 3.2% 1.8% 1.1% White 18.6% 17.8% 16.7% 15.6% 14.2% 11

13 Enrollment by Day and Evening Approximately 81% of students enroll in at least one daytime course in Fall 2013 while 15% were exclusively in evening courses. Daytime increased in the last year while evening enrollments decreased slightly. Distance education enrollments increased by 17% in the last year. 20,000 18,000 16,000 14,000 12,000 Enrollment by Day and Evening 10,000 8,000 6,000 4,000 2,000 0 Fall 2009 Fall 2010 Fall 2011 Fall 2012 Fall 2013 Daytime 19,815 18,772 18,985 18,844 19,342 Evening 5,370 4,432 4,343 3,732 3,702 Irregular* *Irregular meeting times, including distance education. 12
14 Enrollment by High School The majority of enrolled students attended local high schools throughout the South Bay area in the past. The top five high schools include all of the Torrance area high schools (North High, West High, South High and Torrance High) and Redondo High. El Camino Feeder High Schools High School Banning Senior High School* Bishop Montgomery High School Carson Senior High School* El Segundo Senior High School Gardena Senior High School* Hawthorne High School Inglewood High School Lawndale High School Leuzinger High School Mira Costa High School Morningside High School Narbonne Senior High School* North High School Palos Verdes High School* Palos Verdes Peninsula High School* Redondo High School San Pedro Senior High School* South High School Torrance High School Washington High School* West High School *High schools outside El Camino College district boundaries Other Non-District High Schools High School Non District High School 3,333 2,742 2,421 2,961 3,203 13

15 Special Programs 14

16 Athletics El Camino College offers a variety of intercollegiate sports teams. Approximately 2% of the student population participates in intercollegiate sports. The largest male sport is football, with an average of 88 players per year. Track and Field is the largest female sport with an average of 38 players per year. The number of males participating in sports teams decreased while females increased for the academic year when compared to the previous year. Female athletic participation increased by 33%. Male Student-Athletes by Sport Baseball Basketball Cross Country Football Soccer Swimming Tennis Track & Field Volleyball Water Polo

17 Female Student-Athletes by Sport Badminton Basketball Cross Country Soccer Softball Swimming Tennis Track & Field Volleyball Water Polo
18 CalWORKs CalWORKs is the community portion of the California Work Opportunity and Responsibility to Kids Act. CalWORKs funds assist single parents who are receiving Temporary Assistance for Needy Families (TANF), and those in transitioning off of welfare. It helps students achieve long-term self-sufficiency through coordinated student services. Approximately 2% of the student population participated in CalWORKs. Since , the number of CalWORKs participants has remained stable. In the last year, the number of CalWORKs participants has decreased by 6%. CalWORKS Participants County Referral Program Participant. Self-Initiated Program participant (SIP)

19 Disabled Student Program and Services (DSP&S) In 1972, El Camino College established a special program to assist students with disabilities in their pursuit of a post-secondary education. The purpose of this program is to assist disabled students to perform on an equal basis with nondisabled students in an integrated campus setting. About 4% of ECC students have a registered disability. The most common disability is mobility impairment followed by psychological disabilities. The number of learning disabled students has decreased in the last five years while the Other disability category has increased. This is due to changes in practices and consensus in the state of how to categorize certain disabilities. Disabled Students Programs & Services Acquired Brain Injury Developmentally Delayed Learner Hearing Impaired Learning Disabled Mobility Impaired Other Disability Psychological Disability Speech/Language Impaired Visually Impaired Primary Disability Acquired Brain Injury Developmentally Delayed Learner Hearing Impaired Learning Disabled Mobility Impaired Other Disability Psychological Disability Speech/Language Impaired Visually Impaired Total 1,696 1,855 1,974 1,968 1,967
20 Extended Opportunity Program and Services (EOP&S) Extended Opportunity Program and Services (EOP&S) is designed to assist low income and educationally disadvantaged students achieve their educational goals at El Camino College. It provides eligible students with support services in the areas of counseling, peer support, financial assistance, transferring and tutorial services. Approximately 4% of ECC students are in EOP&S and CARE, a single parent support program for EOP&S. In , the number of students who participated in EOP&S and CARE increased by 25%. Extended Opportunity Programs & Services (EOP&S) EOPS and CARE participant EOPS participant 1,219 1,260 1,
21 Financial Aid Fifty percent of El Camino College students received financial aid in , a three percent decrease from the previous year. The largest Financial Aid program is the Board of Governor s Fee Waiver (BOGW). In , there was a 5% decrease in BOG Fee Waiver recipients. The second largest program is the Federal Pell Grant. The total number of Pell Grant recipients increased from 7,541 in to 8,171 in The next largest program is the Cal Grant B (CGB) and Federal Supplemental Educational Opportunity Grant (SEOG). In , the number of CGB recipients increased by 26% while SEOG recipients increased by 18%. In the last four years, there was no Stafford Loan reported. As of , Stafford Loans are part of the Direct Loan program and now fall under the category of Federal Direct Student Loans. As of August 2013, El Camino College no longer participates in the Federal Direct Loan Program which includes subsidized, unsubsidized, and Parent PLUS loans. However, the college does assist students who are interested in alternative loan programs (El Camino College Financial Aid Website). Also there are no Academic Competitiveness Grant recipients reported in , due to the fact that this federal grant is no longer being awarded. Financial Aid Students Percent of Student Enrollment 47.6% 52.4% 50.3% 34.1% 39.1%
22 Financial Aid Headcount Financial Aid Federal Work Study Percent of Student Enrollment 0.6% 0.5% 0.6% 0.7% 0.7% Osher Scholarship Scholarship: institutional Scholarship: non-institutional Scholarship Total Percent of Student Enrollment 0.8% 0.8% 0.7% 0.7% 1.1% Stafford Loan, subsidized Stafford Loan, unsubsidized Federal Direct Student Loan, subsidized Federal Direct Student Loan, unsubsidized PLUS loan: parent loan for undergraduate student Other loan: non-institutional source Loan Total Percent of Student Enrollment 1.9% 1.9% 2.4% 1.8% 0.1% BOGW, Part A 1,131 1,134 1, BOGW, Part B 10,909 12,333 12,590 13,094 12,272 BOGW, Part C 4,541 4,598 4,815 5,252 5,168 Fee Waiver BOGW Total 16,614 18,103 18,495 19,222 18,218 Percent of Student Enrollment 41.8% 51.1% 56.2% 60.6% 56.5% Academic Competitiveness Grant Cal Grant B ,069 1,176 1,477 Cal Grant C EOPS Grant CARE Grant Chafee Grant Pell Grant 5,695 6,160 7,561 7,541 8,171 SEOG (Supplemental Educational Opportunity Grant) ,059 1,007 1,189 Grant Total 8,005 8,492 10,354 10,479 11,611 Percent of Student Enrollment 20.1% 24.0% 31.5% 33.0% 36.0% Grand Total 25,899 27,741 30,080 30,688 30, Unduplicated Student Total 13,542 13,846 15,661 16,623 16,192 Percent of Student Enrollment 34.1% 39.1% 47.6% 52.4% 50.3%

23 70.0% Financial Aid Recepients Percent of Enrollment 60.0% 50.0% 40.0% 30.0% 20.0% 10.0% BOGW Grant Loan Work Study Scholarship 0.0% $28,554,983 $30,901,899 Financial Aid and Scholarship Award Amounts $38,200,412 $42,083,438 $44,023, Average Financial Aid Amount Awarded to Students 22 Financial Aid Federal Work Study $1, $2, $2, $1, $1, Scholarships $ $ $ $ $ Loans $3, $3, $3, $3, $6, BOGW $ $ $ $ $ Grants $2, $2, $2, $2, $2, Overall Average $1, $1, $1, $1, $1,446.13
24 Financial Aid Amount Awarded Financial Aid Federal Work Study $440,426 $414,582 $453,432 $393,042 $438,474 Osher Scholarship $16,250 $24,000 $28,000 $6,912 $112,219 Scholarship: institutional $187,637 $124,530 $97,500 $8,250 $23,312 Scholarship: noninstitutional $58,488 $99,009 $93,086 $183,069 $221,794 Scholarship Total $262,375 $247,539 $218,586 $191,319 $357,325 Stafford Loan, subsidized $1,507,139 $0 $0 $0 0 Stafford Loan, unsubsidized $996,068 $0 $0 $0 $0 Federal Direct Student Loan, $7,629 $1,372,015 $1,052,191 $1,077,868 $0 subsidized Federal Direct Student Loan, $865,759 $1,472,739 $777,431 $0 unsubsidized PLUS loan: $6,870 $0 $0 $0 $0 Other loan: noninstitutional source $37,063 $43,200 $64,221 $1445,098 Loan Total $2,517,706 $2,274,837 $2,568,130 $1,919,520 $145,098 BOGW, Part A $449,357 $464,113 $640,960 $1,148,044 $553,772 BOGW, Part B $3,937,828 $4,586,556 $6,830,524 $9,116,740 $9,277,349 BOGW, Part C $1,583,844 $1,710,224 $2,563,303 $3,659,921 $3,859,147 Fee Waiver $21,467 $25,116 $35,784 $6,000 $33,672 BOGW Total $5,992,496 $6,786,009 $10,070,571 $13,930,705 $13,723,940 Academic Competitiveness $359,815 $366,540 $0 $0 $0 Grant Cal Grant B $1,078,633 $1,014,005 $1,218,713 $1,297,336 $1,686,250 Cal Grant C $18,216 $20,808 $18,648 $19,714 $29,150 EOPS Grant $202,215 $110,104 $171,867 $212,377 $196,287 CARE Grant $83,761 $78,500 $53,140 $58,223 $62,682 Chafee Grant $162,302 $203,594 $162,783 $136,750 $126,000 Pell Grant $17,445,253 $19,314,353 $22,800,142 $23,421,052 $26,743,073 SEOG (Supplemental Educational $351,600 $437,568 $464,400 $503,400 $514,800 Opportunity Grant) Grant Total $19,341,980 $21,178,932 $24,889,693 $25,648,852 $29,358,242 Grand Total $28,554,983 $30,901,899 $38,200,412 $42,083,438 $44,023,079 23


25 International Students El Camino College s International Student Program enrolls students originating from more than 65 different countries in Latin America, Europe, Africa, and the Pacific Rim. The number of international students decreased from 848 in to 780 in to 751 in International Students to Veterans El Camino College is an approved institution of higher learning for veterans. Assistance is provided to veterans in planning educational programs and maintaining compliance with Veterans Administration regulations. There were 559 veterans enrolled in and that increased to 612 in Veteran student enrollments decreased in to 560. In , veteran student enrollment increased to 613 and most recently decreased by 8% in the academic year. Veteran Students to


26 Success and Retention 25
27 Overall Success and Retention Looking at all courses across the curriculum; there is an average success rate of 69% and retention rate of 83%. The success rate in was 69%, which is above the institution-set standard of 65%. 90.0% 85.0% 80.0% 75.0% 70.0% 65.0% 60.0% 55.0% 50.0% Success 68.3% 68.5% 68.8% 70.2% 68.6% Retention 82.4% 82.3% 82.6% 84.1% 83.4% Basic Skills Success and Retention Overall Success and Retention Students who take basic skills courses have an average success rate 59% and retention rate of 82%. In the last year, the success and retention rates have remained relatively the same at 60% and 82%, respectively. Compared to the overall success and retention rates, the basic skills success and retention rates are 9 percentage points and 1 percentage point lower, respectively % 85.0% 80.0% 75.0% 70.0% 65.0% 60.0% 55.0% 50.0% Basic Skills Course Success and Retention Success 57.7% 57.9% 60.5% 61.4% 59.8% Retention 81.0% 79.9% 81.6% 83.4% 82.3%
28 Transferable Success and Retention The success rate for transfer level courses averages 71%, slightly higher than the overall and basic skills success rates. The average retention rate for transfer level courses is about 83%, the same as the overall success and retention rates and the basic skills rates. In , the success rate decreased and the retention rate remained the same from the previous year (70% and 84%, respectively). 90.0% 85.0% 80.0% 75.0% 70.0% 65.0% 60.0% 55.0% 50.0% Success 70.3% 70.3% 70.5% 72.0% 70.2% Retention 82.9% 82.8% 82.9% 84.3% 83.8% Credit/Degree Success and Retention Transferable Courses Success and Retention The average success rate for non-basic skills, non-transfer courses is the lowest and the average retention rate is the second lowest in comparison to the three previous course types. Over the last five years, credit/degree applicable courses average a 62% success rate and 81% retention rate. In the , the success and retention rate decreased slightly to 61% and 82%, respectively. 90.0% 85.0% 80.0% 75.0% 70.0% 65.0% 60.0% 55.0% 50.0% Credit/Degreee Applicable Courses Success and Retention Success 60.9% 62.1% 61.4% 62.2% 61.1% Retention 80.2% 79.7% 80.6% 82.5% 81.8% 27
29 Career and Technical Education (CTE) Success and Retention The average success and retention rates for CTE courses are higher in comparison to the four previous course types. Over the last five years, career and technical education courses average a 74% success rate and 85% retention rate. In , success and retention rates increased slightly in the last year to 75% and 87%, respectively. Career and Technical Education Courses Success and Retention 90.0% 85.0% 80.0% 75.0% 70.0% 65.0% 60.0% 55.0% 50.0% Success 73.1% 73.0% 72.9% 74.7% 75.1% Retention 84.9% 85.0% 84.7% 86.0% 86.6% 28

30 Student Outcomes 29
31 Basic Skills Successful Course Completion The success rates for basic skills math, reading and ESL decreased slightly while there was a slight increase in writing success rates. Math and reading success rates decreased by 1%, from Fall 2012 to Fall The ESL success rate decreased by 12 percentage points from 81% to 69% between Fall 2012 and Fall Additionally, writing success rates increased by two points. 85.0% Basic Skills Successful Course Completion by Subject 80.0% 75.0% 70.0% 65.0% 60.0% 55.0% 50.0% Fall 2009 Fall 2010 Fall 2011 Fall 2012 Fall 2013 Math 52.3% 52.0% 54.0% 55.8% 54.2% Reading 57.9% 57.7% 63.4% 60.3% 59.4% Writing 59.3% 63.8% 61.7% 65.5% 67.7% ESL 71.8% 81.0% 71.1% 81.4% 68.6% 30
32 Persistence Rates Student persistence refers to the tracking of students over several terms. Persistence rates are based on five fall cohorts over four semesters, looking only at fall and spring enrollment. For the Fall 2013 cohort, the 2 nd semester persistence rate stayed the same compared to the previous cohort. Fifty percent of Fall 2012 students persisted to the 3 rd semester (Fall 2013). This is higher than the institution-set standard of 47%. The Fall 2013 first-time, full-time cohort 2 nd semester persistence rate also stayed relatively the same compared to last year s cohort. First-time, full-time cohorts typically have a higher persistence rate than overall fall cohorts. Student Persistence over Four Semesters Fall 2009 to Fall 2013 Cohorts 100% 90% 80% 70% 60% 50% 40% 30% 20% 10% 0% 1st semester 2nd semester 3rd semester 4th semester Fall % 64% 47% 41% Fall % 70% 50% 42% Fall % 69% 50% 43% Fall % 71% 52% 44% Fall % 71% 31

33 First Time, Full Time Student Persistence over Four Semesters Fall 2009 to Fall 2013 Cohorts 100% 90% 80% 70% 60% 50% 40% 30% 20% 10% 0% 1st semester 2nd semester 3rd semester 4th semester Fall % 84% 71% 65% Fall % 86% 72% 65% Fall % 86% 72% 66% Fall % 89% 78% 71% Fall % 90% Degrees Awarded In , 1,962 degrees and 472 certificates were awarded at El Camino College. This exceeds the institution-set standards for degree and certificates of 1,463 and 435, respectively. During this five year period, there has been a moderate increase in the number of degrees awarded that averages to 9% per year. There was a 7% decrease in degrees awarded from the to academic years. The gap between the number of Associate of Arts and Associate of Science degrees awarded has increased. In there were 264 more AA degrees than AS degrees awarded. In , however, there were 362 more AA degrees than AS degrees awarded. For certificates, there was a 20% decrease in the number awarded from the to academic years. 32 Beginning , Associate Degrees for Transfer (AA-T or AS-T) are included in Associate of Art and Associate of Science totals. An Associate Degree for Transfer allows students to earn an Associate Degree while concurrently satisfying lower division general education and major requirements for transfer and guarantees admission to the California State University System.

34 Degrees and Certificates Awarded to Degrees and Certificates Associate in Arts ,091 1,289 1,162 Associate in Science Certificates *Source: California Community College Chancellor s Office, ECC Admissions & Records. Figures prior to were from the Chancellor s Office Data Mart. Degrees and Certificates Awarded ,296 1,091 1, Transfer Destinations Associate in Arts Associate in Science Certificates In , 1,584 El Camino College students transferred to a 4 year university which is higher than the institution-set standard of 1,299. Transfers to the Cal State system remained stable in The largest CSU destinations were Dominguez Hills and Long Beach with 386 and 222 transfers, respectively. The largest University of California transfer destinations for ECC students were UCLA and UC Irvinve. In , there were 151 ECC students who transferred to an in-state private institution while 233 students transferred to an out of state institution. Cal State System Name Cal State Poly. University, Pomona Cal State University, Dominguez Hills Cal State University, Fullerton Cal State University, Long Beach Cal State University, Los Angeles Cal State University, Northridge San Diego State University Other Cal States Total Cal State Transfers
35 UC System Name University of California, Berkeley University of California, Davis University of California, Irvine University of California, Los Angeles University of California, Merced University of California, Riverside University of California, San Diego University of California, Santa Barbara University of California, Santa Cruz Total UC Transfers Private Institutions Name Biola University Chapman University Devry University Loyola Marymount University Mount St. Mary's College National University Otis College of Art and Design Pepperdine University University of Phoenix University of Southern California Other Private Institutions Total Private Transfers Out of State Transfers Name Total Out of State Transfers Source: National Student Clearinghouse Beginning in , the California Postsecondary Education Commission (CPEC) is no longer used to report UC and Cal State transfers. National Student Clearinghouse (NSC) data is now the source for all transfer counts in this report. More details on transfer data methodology can be found in the UC and CSU Transfer Counts: CPEC vs. NSC Research Brief.

36 Appendix 35

37 10 year Enrollment History El Camino College Enrollment History to ,752 36,168 35,640 39, ,700 39,765 35,418 32,910 31,713 32,220 36
University of Utah. 1. Graduation-Rates Data a. All Students. b. Student-Athletes
 University of Utah FRESHMAN-COHORT GRADUATION RATES All Students Student-Athletes # 2009-10 Graduation Rate 64% 64% Four-Class Average 61% 64% Student-Athlete Graduation Success Rate 87% 1. Graduation-Rates
St. John Fisher College Rochester, NY
 C O L L E G E P R O F I L E - O V E R V I E W St. John Fisher College Rochester, NY St. John Fisher is a church-affiliated, liberal arts college. Founded in 1948 as a men's college, it adopted coeducation
PUBLIC INFORMATION POLICY
 CALIFORNIA STATE POLYTECHNIC UNIVERSITY, POMONA Landscape Architecture College of Environmental Design PUBLIC INFORMATION POLICY Landscape Architecture Accreditation Board (LAAB) accredited programs are
CAMPUS PROFILE MEET OUR STUDENTS UNDERGRADUATE ADMISSIONS. The average age of undergraduates is 21; 78% are 22 years or younger.
 CAMPUS PROFILE MEET OUR STUDENTS Freshmen are defined here as all domestic students entering in fall quarter from high school. These statistics include information drawn from records available at UC Davis.
Los Angeles City College Student Equity Plan. Signature Page
 Los Angeles City College Student Equity Plan Signature Page Los Angeles Community College Los Angeles City College President, Board of Trustees Date District Chancellor: College President: Academic Senate
UCLA Affordability. Ronald W. Johnson Director, Financial Aid Office. May 30, 2012
 UCLA Affordability Ronald W. Johnson Director, Financial Aid Office May 30, 2012 1 UC is affordable First, Students must: Apply for admission in November File FAFSA and GPA Verification Form between January
Basic Skills Initiative Project Proposal Date Submitted: March 14, Budget Control Number: (if project is continuing)
") Basic Skills Initiative Project Proposal 2016-2017 Date Submitted: March 14, 2016 Check One: New Proposal: Continuing Project: X Budget Control Number: (if project is continuing) Control # 87-413 - EOPS
Basic Skills Initiative Project Proposal 2016-2017 Date Submitted: March 14, 2016 Check One: New Proposal: Continuing Project: X Budget Control Number: (if project is continuing) Control # 87-413 - EOPS
University of Arkansas at Little Rock Little Rock, AR
 University of Arkansas at Little Rock Little Rock, AR C O L L E G E P R O F I L E - O V E R V I E W U Arkansas at Little Rock is a public institution. It was founded as a junior college in 1927, became
University of Maine at Augusta Augusta, ME
 C O L L E G E P R O F I L E - O V E R V I E W University of Maine at Augusta Augusta, ME U Maine at Augusta, founded in 1965, is a public university. Its 165-acre campus is located in Augusta, 50 miles
LIM College New York, NY
 C O L L E G E P R O F I L E - O V E R V I E W LIM College New York, NY The Laboratory Institute of Merchandising, founded in 1939, is a private institute. Its facilities are located in Manhattan. Web Site
College of William and Mary Williamsburg, VA
 C O L L E G E P R O F I L E - O V E R V I E W College of William and Mary Williamsburg, VA The College of William and Mary, founded in 1693, is a public institution. Since its founding in 1693, it has
Status of Women of Color in Science, Engineering, and Medicine
 Status of Women of Color in Science, Engineering, and Medicine The figures and tables below are based upon the latest publicly available data from AAMC, NSF, Department of Education and the US Census Bureau.
Azusa Pacific University Azusa, CA
 C O L L E G E P R O F I L E - O V E R V I E W Azusa Pacific University Azusa, CA Founded in 1899 as the Training School for Christian Workers, Azusa Pacific is a comprehensive Christian, evangelical university
STEM Academy Workshops Evaluation
 OFFICE OF INSTITUTIONAL RESEARCH RESEARCH BRIEF #882 August 2015 STEM Academy Workshops Evaluation By Daniel Berumen, MPA Introduction The current report summarizes the results of the research activities
NATIONAL CENTER FOR EDUCATION STATISTICS
 NATIONAL CENTER FOR EDUCATION STATISTICS Palm Desert, CA The Integrated Postsecondary Education Data System (IPEDS) is the nation s core postsecondary education data collection program. It is a single,
Financial aid: Degree-seeking undergraduates, FY15-16 CU-Boulder Office of Data Analytics, Institutional Research March 2017
 CU-Boulder financial aid, degree-seeking undergraduates, FY15-16 Page 1 Financial aid: Degree-seeking undergraduates, FY15-16 CU-Boulder Office of Data Analytics, Institutional Research March 2017 Contents
University of Michigan - Flint Flint, MI
 C O L L E G E P R O F I L E - O V E R V I E W University of Michigan - Flint Flint, MI University of Michigan - Flint, founded in 1956, is a comprehensive, public institution. Its 70-acre campus is located
Institution-Set Standards: CTE Job Placement Resources. February 17, 2016 Danielle Pearson, Institutional Research
 Institution-Set Standards: CTE Job Placement Resources February 17, 2016 Danielle Pearson, Institutional Research Standard 1.B.3 states: The institution establishes institution-set standards for student
Transportation Equity Analysis
 2015-16 Transportation Equity Analysis Each year the Seattle Public Schools updates the Transportation Service Standards and bus walk zone boundaries for use in the upcoming school year. For the 2014-15
Presentation Team. Dr. Tony Ross, Vice President for Student Affairs, CSU Los Angeles
 California State University African American Initiative A Dream Deferred: The Future of African American Education Presentation at the College Board Diversity Conference April 27, 2012 Presentation Team
Graduate Division Annual Report Key Findings
 Graduate Division 2010 2011 Annual Report Key Findings Trends in Admissions and Enrollment 1 Size, selectivity, yield UCLA s graduate programs are increasingly attractive and selective. Between Fall 2001
El Camino College Planning Model
 El Camino College Planning Model The El Camino College planning process integrates assessment, evaluation, and planning to promote effectiveness and student success. The mission underlies all that we do,
PHYSICAL EDUCATION AND KINESIOLOGY
 PHYSICAL EDUCATION AND KINESIOLOGY Department Chair: Dr. Jeff Moffit Department Office: Education Building, 142 Telephone: (661) 654-2187 email: lstone3@csub.edu Website: www.csub.edu/sse/peak Faculty:
Facts and Figures Office of Institutional Research and Planning
 Facts and Figures 2008-2009 Office of Institutional Research and Planning Office of Institutional Research Fall 2009 Facts at a Glance Credit Headcount Enrollments Headcount Ethnicity Headcount Percent
Best Colleges Main Survey
 Best Colleges Main Survey Date submitted 5/12/216 18::56 Introduction page 1 / 146 BEST COLLEGES Data Collection U.S. News has begun collecting data for the 217 edition of Best Colleges. The U.S. News
Access Center Assessment Report
 Access Center Assessment Report The purpose of this report is to provide a description of the demographics as well as higher education access and success of Access Center students at CSU. College access
U VA THE CHANGING FACE OF UVA STUDENTS: SSESSMENT. About The Study
 About The Study U VA SSESSMENT In 6, the University of Virginia Office of Institutional Assessment and Studies undertook a study to describe how first-year students have changed over the past four decades.
OFFICE OF ENROLLMENT MANAGEMENT. Annual Report
 2014-2015 OFFICE OF ENROLLMENT MANAGEMENT Annual Report Table of Contents 2014 2015 MESSAGE FROM THE VICE PROVOST A YEAR OF RECORDS 3 Undergraduate Enrollment 6 First-Year Students MOVING FORWARD THROUGH
12-month Enrollment
 12-month Enrollment 2016-17 Institution: Potomac State College of West Virginia University (237701) Overview 12-month Enrollment Overview The 12-Month Enrollment component collects unduplicated student
Port Graham El/High. Report Card for
 School: District: Kenai Peninsula Grades: K - 12 School Enrollment: 20 Title I School? No Title 1 Program: Accreditation: Report Card for 2008-2009 A Title 1 school receives federal money in support low-achieving
EDUCATIONAL ATTAINMENT
 EDUCATIONAL ATTAINMENT By 2030, at least 60 percent of Texans ages 25 to 34 will have a postsecondary credential or degree. Target: Increase the percent of Texans ages 25 to 34 with a postsecondary credential.
Peru State College Peru, NE
 C O L L E G E P R O F I L E - O V E R V I E W Peru State College Peru, NE Peru State is a public, multipurpose college. Founded in 1867, it is the oldest college in Nebraska. Its 103-acre campus is located
Idaho Public Schools
 Advanced Placement: Student Participation 13.5% increase in the number of students participating between 25 and 26 In 26: 3,79 Idaho Public School Students took AP Exams In 25: 3,338 Idaho Public School
READY OR NOT? CALIFORNIA'S EARLY ASSESSMENT PROGRAM AND THE TRANSITION TO COLLEGE
 READY OR NOT? CALIFORNIA'S EARLY ASSESSMENT PROGRAM AND THE TRANSITION TO COLLEGE Michal Kurlaender University of California, Davis Policy Analysis for California Education March 16, 2012 This research
https://secure.aacte.org/apps/peds/print_all_forms.php?view=report&prin...
 1 of 35 4/25/2012 9:56 AM A» 2011 PEDS» Institutional Data inst id: 3510 Institutional Data A_1 Institutional Information This information will be used in all official references to your institution. Institution
File Print Created 11/17/2017 6:16 PM 1 of 10
 Success - Key Measures Graduation Rate: 4-, 5-, and 6-Year 9. First-time, full-time entering, degree-seeking, students enrolled in a minimum of 12 SCH their first fall semester who have graduated from
Bellevue University Bellevue, NE
 C O L L E G E P R O F I L E - O V E R V I E W Bellevue University Bellevue, NE Bellevue, founded in 1966, is a private university. Its campus is located in Bellevue, in the Omaha metropolitan area. Web
WASC Special Visit Research Proposal: Phase IA. WASC views the Administration at California State University, Stanislaus (CSUS) as primarily
 as primarily") WASC Special Visit Research Proposal: Phase IA Statement of Purpose WASC views the Administration at California State University, Stanislaus (CSUS) as primarily responsible for fostering a climate of trust
WASC Special Visit Research Proposal: Phase IA Statement of Purpose WASC views the Administration at California State University, Stanislaus (CSUS) as primarily responsible for fostering a climate of trust
Journalism Department Program Review. Prepared by Professor Lori Medigovich
 Journalism Department 2008-2009 Program Review Prepared by Professor Lori Medigovich Table of Contents I. Overview A. Description of Program B. Degrees/Certificates Offered C. Status of Previous Recommendations
Frank Phillips College. Accountability Report
 Frank Phillips College Accountability Report January 2016 Accountability System, January 2016 1 of 22 Participation - Key Measures Enrollment 1. Fall Headcount (Unduplicated) Fall 2000 Fall 2014 Fall 2015
BENCHMARK TREND COMPARISON REPORT:
 National Survey of Student Engagement (NSSE) BENCHMARK TREND COMPARISON REPORT: CARNEGIE PEER INSTITUTIONS, 2003-2011 PREPARED BY: ANGEL A. SANCHEZ, DIRECTOR KELLI PAYNE, ADMINISTRATIVE ANALYST/ SPECIALIST
Adult Education ACCE Presentation. Neil Kelly February 2, 2017
 Adult Education ACCE Presentation Neil Kelly February 2, 2017 Agenda The Adult Education Universe Data and Accountability System Adult Education Funding California Dreaming Adult Education Big Picture
Student Support Services Evaluation Readiness Report. By Mandalyn R. Swanson, Ph.D., Program Evaluation Specialist. and Evaluation
 Student Support Services Evaluation Readiness Report By Mandalyn R. Swanson, Ph.D., Program Evaluation Specialist and Bethany L. McCaffrey, Ph.D., Interim Director of Research and Evaluation Evaluation
Executive Summary. Laurel County School District. Dr. Doug Bennett, Superintendent 718 N Main St London, KY
 Dr. Doug Bennett, Superintendent 718 N Main St London, KY 40741-1222 Document Generated On January 13, 2014 TABLE OF CONTENTS Introduction 1 Description of the School System 2 System's Purpose 4 Notable
Educational Attainment
 A Demographic and Socio-Economic Profile of Allen County, Indiana based on the 2010 Census and the American Community Survey Educational Attainment A Review of Census Data Related to the Educational Attainment
1) AS /AA (Rev): Recognizing the Integration of Sustainability into California State University (CSU) Academic Endeavors
 AS /AA (Rev): Recognizing the Integration of Sustainability into California State University (CSU) Academic Endeavors") Academic Affairs 401 Golden Shore, 6th Floor Long Beach, CA 90802-4210 www.calstate.edu Ronald E. Vogel Associate Vice Chancellor 562-951-4712 / Fax 562-951-4986 Email rvogel@calstate.edu Dr. Diana Guerin,
Academic Affairs 401 Golden Shore, 6th Floor Long Beach, CA 90802-4210 www.calstate.edu Ronald E. Vogel Associate Vice Chancellor 562-951-4712 / Fax 562-951-4986 Email rvogel@calstate.edu Dr. Diana Guerin,
NCEO Technical Report 27
 Home About Publications Special Topics Presentations State Policies Accommodations Bibliography Teleconferences Tools Related Sites Interpreting Trends in the Performance of Special Education Students
Higher Education. Pennsylvania State System of Higher Education. November 3, 2017
 November 3, 2017 Higher Education Pennsylvania s diverse higher education sector - consisting of many different kinds of public and private colleges and universities - helps students gain the knowledge
Enrollment Trends. Past, Present, and. Future. Presentation Topics. NCCC enrollment down from peak levels
 Presentation Topics 1. Enrollment Trends 2. Attainment Trends Past, Present, and Future Challenges & Opportunities for NC Community Colleges August 17, 217 Rebecca Tippett Director, Carolina Demography
Iowa School District Profiles. Le Mars
 Iowa School District Profiles Overview This profile describes enrollment trends, student performance, income levels, population, and other characteristics of the public school district. The report utilizes
State Budget Update February 2016
 State Budget Update February 2016 2016-17 BUDGET TRAILER BILL SUMMARY The Budget Trailer Bill Language is the implementing statute needed to effectuate the proposals in the annual Budget Bill. The Governor
EDUCATIONAL ATTAINMENT
 EDUCATIONAL ATTAINMENT By 2030, at least 60 percent of Texans ages 25 to 34 will have a postsecondary credential or degree. Target: Increase the percent of Texans ages 25 to 34 with a postsecondary credential.
Shelters Elementary School
 Shelters Elementary School August 2, 24 Dear Parents and Community Members: We are pleased to present you with the (AER) which provides key information on the 23-24 educational progress for the Shelters
(Includes a Detailed Analysis of Responses to Overall Satisfaction and Quality of Academic Advising Items) By Steve Chatman
 By Steve Chatman") Report #202-1/01 Using Item Correlation With Global Satisfaction Within Academic Division to Reduce Questionnaire Length and to Raise the Value of Results An Analysis of Results from the 1996 UC Survey
Report #202-1/01 Using Item Correlation With Global Satisfaction Within Academic Division to Reduce Questionnaire Length and to Raise the Value of Results An Analysis of Results from the 1996 UC Survey
Data Glossary. Summa Cum Laude: the top 2% of each college's distribution of cumulative GPAs for the graduating cohort. Academic Honors (Latin Honors)
") Institutional Research and Assessment Data Glossary This document is a collection of terms and variable definitions commonly used in the universities reports. The definitions were compiled from various
Institutional Research and Assessment Data Glossary This document is a collection of terms and variable definitions commonly used in the universities reports. The definitions were compiled from various
Guide to the Program in Comparative Culture Records, University of California, Irvine AS.014
 http://oac.cdlib.org/findaid/ark:/13030/kt2f59q8v9 No online items University of California, Irvine AS.014 Finding aid prepared by Processed by Mary Ellen Goddard and Michelle Light; machine-readable finding
An Empirical Analysis of the Effects of Mexican American Studies Participation on Student Achievement within Tucson Unified School District
 An Empirical Analysis of the Effects of Mexican American Studies Participation on Student Achievement within Tucson Unified School District Report Submitted June 20, 2012, to Willis D. Hawley, Ph.D., Special
National Survey of Student Engagement (NSSE) Temple University 2016 Results
 Temple University 2016 Results") Introduction The National Survey of Student Engagement (NSSE) is administered by hundreds of colleges and universities every year (560 in 2016), and is designed to measure the amount of time and effort
Introduction The National Survey of Student Engagement (NSSE) is administered by hundreds of colleges and universities every year (560 in 2016), and is designed to measure the amount of time and effort
A Guide to Finding Statistics for Students
 San Joaquin Valley Statistics http://pegasi.us/sjstats/ 1 of 2 6/12/2010 5:00 PM A Guide to Finding Statistics for Students CV Stats Home By Topic By Area About the Valley About this Site Population Agriculture
Multiple Measures Assessment Project - FAQs
 Multiple Measures Assessment Project - FAQs (This is a working document which will be expanded as additional questions arise.) Common Assessment Initiative How is MMAP research related to the Common Assessment
GRADUATE STUDENTS Academic Year
 Financial Aid Information for GRADUATE STUDENTS Academic Year 2017-2018 Your Financial Aid Award This booklet is designed to help you understand your financial aid award, policies for receiving aid and
Summary of Selected Data Charter Schools Authorized by Alameda County Board of Education
 Summary of Selected Data Charter Schools Authorized by Alameda County Board of Education Prepared for the Alameda County Board of Education November 10, 2015 Alameda County Office of Education Charter
Fruitvale Station Shopping Center > Retail
 Oakland, CA > Retail > Very rare (i.e. high barriers of entry) freeway visible, surface parked, high volume grocery anchored regional serving center. > Notable tenants include: Food Maxx, Starbucks, Office
Curriculum Vitae JOHANNA A. SOLOMON, PhD
 Curriculum Vitae JOHANNA A. SOLOMON, PhD Grinnell College Mellon Post-Doctoral Fellow Peace and Conflict Studies Department of Political Science Goodnow Hall 1118 Park St solomonj@grinnell.edu Grinnell,
The Demographic Wave: Rethinking Hispanic AP Trends
 The Demographic Wave: Rethinking Hispanic AP Trends Kelcey Edwards & Ellen Sawtell AP Annual Conference, Las Vegas, NV July 19, 2013 Exploring the Data Hispanic/Latino US public school graduates The Demographic
The following resolution is presented for approval to the Board of Trustees. RESOLUTION 16-
 1. Adoption of Wright State 2016 Campus Completion Plan The following resolution is presented for approval to the Board of Trustees. RESOLUTION 16- WHEREAS, Section 3345.81 of the Ohio Revised Code requires
ILLINOIS DISTRICT REPORT CARD
 -6-525-2- HAZEL CREST SD 52-5 HAZEL CREST SD 52-5 HAZEL CREST, ILLINOIS and federal laws require public school districts to release report cards to the public each year. 2 7 ILLINOIS DISTRICT REPORT CARD
Coming in. Coming in. Coming in
 212-213 Report Card for Glenville High School SCHOOL DISTRICT District results under review by the Ohio Department of Education based upon 211 findings by the Auditor of State. Achievement This grade combines
ILLINOIS DISTRICT REPORT CARD
 -6-525-2- Hazel Crest SD 52-5 Hazel Crest SD 52-5 Hazel Crest, ILLINOIS 2 8 ILLINOIS DISTRICT REPORT CARD and federal laws require public school districts to release report cards to the public each year.
SUNY Downstate Medical Center Brooklyn, NY
 C O L L E G E P R O F I L E - O V E R V I E W SUNY Downstate Medical Center Brooklyn, NY SUNY Health Science Center at Brooklyn, founded in 1858, is a public, upper-division institution. Its 13-acre campus
ESSEX COUNTY COLLEGE. INSTITUTIONAL PROFILE (Excellence and Accountability)
") ESSEX COUNTY COLLEGE INSTITUTIONAL PROFILE (Excellence and Accountability) Submitted to Commission on Higher Education September 28, 2009 Office of Planning, Research & Assessment Dr. J. Scott Drakulich
ESSEX COUNTY COLLEGE INSTITUTIONAL PROFILE (Excellence and Accountability) Submitted to Commission on Higher Education September 28, 2009 Office of Planning, Research & Assessment Dr. J. Scott Drakulich
Program Review
 De Anza College, Cupertino, CA 1 Description and Mission of the Program A) The Manufacturing and CNC Program (MCNC) offers broad yet in-depth curriculum that imparts a strong foundation for direct employment
Student Mobility Rates in Massachusetts Public Schools
 Student Mobility Rates in Massachusetts Public Schools Introduction The Massachusetts Department of Elementary and Secondary Education (ESE) calculates and reports mobility rates as part of its overall
Strategic Plan Dashboard Results. Office of Institutional Research and Assessment
 29-21 Strategic Plan Dashboard Results Office of Institutional Research and Assessment Binghamton University Office of Institutional Research and Assessment Definitions Fall Undergraduate and Graduate
A Diverse Student Body
 A Diverse Student Body No two diversity plans are alike, even when expressing the importance of having students from diverse backgrounds. A top-tier school that attracts outstanding students uses this
San Mateo Community College District External Trends and Implications for Strategic Planning
 San Mateo Community College District External Trends and Implications for Strategic Planning Demographic Trends United States It is estimated that by 2025, the number of Americans over 60 will increase
Paying for. Cosmetology School S C H O O L B E AU T Y. Financing your new life. beautyschoolnetwork.com pg 1
 Paying for Cosmetology School B E AU T Y S C H O O L Financing your new life. beautyschoolnetwork.com beautyschoolnetwork.com pg 1 B E AU T Y S C H O O L Table of Contents How to Pay for Cosmetology School...
Teach For America alumni 37,000+ Alumni working full-time in education or with low-income communities 86%
 About Teach For America Teach For America recruits, trains, and supports top college graduates and professionals who make an initial commitment to teach for two years in urban and rural public schools
MAINE 2011 For a strong economy, the skills gap must be closed.
 For a strong economy, the skills gap must be closed. 62% 36% 26% By 2020, jobs requiring a career certificate or college degree Skills gap Too few students make it through college. MEMBER Maine adults
2012 ACT RESULTS BACKGROUND
 Report from the Office of Student Assessment 31 November 29, 2012 2012 ACT RESULTS AUTHOR: Douglas G. Wren, Ed.D., Assessment Specialist Department of Educational Leadership and Assessment OTHER CONTACT
Undergraduates Views of K-12 Teaching as a Career Choice
 Undergraduates Views of K-12 Teaching as a Career Choice A Report Prepared for The Professional Educator Standards Board Prepared by: Ana M. Elfers Margaret L. Plecki Elise St. John Rebecca Wedel University
Application and Admission Process
 Application and Admission Process The Graziadio School seeks students with excellent academic and career potential, highly motivated self-starters who thrive on challenge. We carefully select each new
THE COLLEGE OF WILLIAM AND MARY IN VIRGINIA INTERCOLLEGIATE ATHLETICS PROGRAMS FOR THE YEAR ENDED JUNE 30, 2005
 THE COLLEGE OF WILLIAM AND MARY IN VIRGINIA INTERCOLLEGIATE ATHLETICS PROGRAMS FOR THE YEAR ENDED JUNE 30, 2005 - T A B L E O F C O N T E N T S INDEPENDENT AUDITOR S REPORT ON APPLICATION OF AGREED-UPON
Arkansas Beauty School-Little Rock Esthetics Program Consumer Packet 8521 Geyer Springs Road, Unit 30 Little Rock, AR 72209
 Arkansas Beauty School-Little Rock Esthetics Program Consumer Packet 8521 Geyer Springs Road, Unit 30 Little Rock, AR 72209 www.studyhair.org Arkansas Beauty School-LR (ABSLR) is proud of its educational
DUAL ENROLLMENT ADMISSIONS APPLICATION. You can get anywhere from here.
 DUAL ENROLLMENT ADMISSIONS APPLICATION SM You can get anywhere from here. Please print or type: DUAL ENROLLMENT APPLICATION Last Name First Name Maiden/Middle Social Security # Local Address (include apt.
African American Male Achievement Update
 Report from the Department of Research, Evaluation, and Assessment Number 8 January 16, 2009 African American Male Achievement Update AUTHOR: Hope E. White, Ph.D., Program Evaluation Specialist Department
A Guide to Adequate Yearly Progress Analyses in Nevada 2007 Nevada Department of Education
 A Guide to Adequate Yearly Progress Analyses in Nevada 2007 Nevada Department of Education Note: Additional information regarding AYP Results from 2003 through 2007 including a listing of each individual
Department of Social Work Master of Social Work Program
 Dear Interested Applicant, Thank you for your interest in the California State University, Dominguez Hills Master of Social Work (MSW) Program. On behalf of the faculty I want you to know that we are very
Fostering Equity and Student Success in Higher Education
 Fostering Equity and Student Success in Higher Education Laura I Rendón Professor Emerita University of Texas-San Antonio Presentation at NTCC 22 nd Annual Fall Leadership Conference Gainsesville, TX September
Value of Athletics in Higher Education March Prepared by Edward J. Ray, President Oregon State University
 Materials linked from the 5/12/09 OSU Faculty Senate agenda 1. Who Participates Value of Athletics in Higher Education March 2009 Prepared by Edward J. Ray, President Oregon State University Today, more
The Impacts of Regular Upward Bound on Postsecondary Outcomes 7-9 Years After Scheduled High School Graduation
 Contract No.: EA97030001 MPR Reference No.: 6130-800 The Impacts of Regular Upward Bound on Postsecondary Outcomes 7-9 Years After Scheduled High School Graduation Final Report January 2009 Neil S. Seftor
Volunteer State Community College Strategic Plan,
 Volunteer State Community College Strategic Plan, 2005-2010 Mission: Volunteer State Community College is a public, comprehensive community college offering associate degrees, certificates, continuing
Table of Contents Welcome to the Federal Work Study (FWS)/Community Service/America Reads program.
/Community Service/America Reads program.") Table of Contents Welcome........................................ 1 Basic Requirements for the Federal Work Study (FWS)/ Community Service/America Reads program............ 2 Responsibilities of All Participants
Table of Contents Welcome........................................ 1 Basic Requirements for the Federal Work Study (FWS)/ Community Service/America Reads program............ 2 Responsibilities of All Participants
EDELINA M. BURCIAGA 3151 Social Science Plaza Irvine, CA
 EDELINA M. BURCIAGA 3151 Social Science Plaza Irvine, CA 92697-5000 eburciag@uci.edu EDUCATION UNIVERSITY OF CALIFORNIA, IRVINE, Irvine, CA Doctoral candidate, Department of Sociology. Expected graduation
Kansas Adequate Yearly Progress (AYP) Revised Guidance
 Revised Guidance") Kansas State Department of Education Kansas Adequate Yearly Progress (AYP) Revised Guidance Based on Elementary & Secondary Education Act, No Child Left Behind (P.L. 107-110) Revised May 2010 Revised May
Kansas State Department of Education Kansas Adequate Yearly Progress (AYP) Revised Guidance Based on Elementary & Secondary Education Act, No Child Left Behind (P.L. 107-110) Revised May 2010 Revised May
ATHLETIC ENDOWMENT FUND MOUNTAINEER ATHLETIC CLUB
 ATHLETIC ENDOWMENT FUND MOUNTAINEER ATHLETIC CLUB The Athletic Endowment Fund provides donors with the unique opportunity to assist the West Virginia University Department of Intercollegiate Athletics
Graduation Initiative 2025 Goals San Jose State
 Graduation Initiative 2025 Goals San Jose State Metric 2025 Goal Most Recent Rate Freshman 6-Year Graduation 71% 57% Freshman 4-Year Graduation 35% 10% Transfer 2-Year Graduation 36% 24% Transfer 4-Year
Serving Country and Community: A Study of Service in AmeriCorps. A Profile of AmeriCorps Members at Baseline. June 2001
 Serving Country and Community: A Study of Service in AmeriCorps Cambridge, MA Lexington, MA Hadley, MA Bethesda, MD Washington, DC Chicago, IL Cairo, Egypt Johannesburg, South Africa A Profile of AmeriCorps
Psychometric Research Brief Office of Shared Accountability
 August 2012 Psychometric Research Brief Office of Shared Accountability Linking Measures of Academic Progress in Mathematics and Maryland School Assessment in Mathematics Huafang Zhao, Ph.D. This brief
ACHE DATA ELEMENT DICTIONARY as of October 6, 1998
 ACHE DATA ELEMENT DICTIONARY as of October 6, 1998 Element Title: Reference Numbers: Institution FICE Code FICE ST010, GR010 The identification number for each reporting institution will be the institution's