Collier County Comparative Analysis Project
|
|
|
- Cynthia Wilkerson
- 6 years ago
- Views:
Transcription

1 Johnson School of Business Collier County Comparative Analysis Project Phase III Report I April 23, 2012 Rev 04/23/12
2 Copyright 2012 by Johnson School of Business, Hodges University. All rights reserved, including the right of reproduction in whole or in part in any form. 2
3 Contact Information Dr. Aysegul Timur, Dr. Gerald Franz, Anke Stugk, MBA, Davor Pranjic, MA, 3
4 About Hodges University Hodges University, founded in 1990, has emerged as one of Florida s leading institutions of higher learning. In addition to the main campuses in Naples and Fort Myers, Hodges offers courses at several learning sites, including Immokalee, Pasco-Hernando Community College, South Florida Community College, and Florida Keys Community College. The mission of Hodges University is to offer Associate, Baccalaureate, and Graduate degrees as well as other programs, which enhance the ability of students to achieve personal or professional objectives. In addition to offering courses in 18 professional disciplines and its comprehensive English as a Second Language Program, Hodges University fulfills educational and personal enrichment needs for area seniors through facilitation of the Frances Pew Hayes Center for Lifelong Learning. For more information, call or visit us online at 4

5 Acknowledgment The Comparative County Study team would like to thank Dr. Terry McMahan, Hodges University President, Dr. Jeanette Brock, Hodges University Executive Vice President of Academic Affairs, Dr. Fred Nerone, former founding Dean of the Johnson School of Business and current Chief Investment Officer, and Dr. Nancey Wyant, Dean of the Johnson School of Business, for their support in ensuring this report was created; Dr. Aysegul Timur, Hodges University Faculty Member and Program Chair, for her time and dedication to this research; and Anke Stugk, Dr. Gerald Franz, and Davor Pranjić, for their hard work and contribution to this report. Many thanks to the Greater Naples Chamber of Commerce and the Collier County Government for the research opportunity, support, and comments. 5
6 Purpose The main goal of this report is to contribute to the Greater Naples Chamber of Commerce and the Collier County Government in their quest for economic growth/development in this region. The report provides a base line of information about the economic health of Collier County and 11 comparable Florida counties. Data and Methodology This report is mainly based on statistical data retrieved and compiled from the United States Census Bureau, the Bureau of Labor Statistics, and Sperling s BestPlaces, which provides the best combination of timeliness, relevancy, quality, and cost for the data. The data has been customized and calculated for Broward, Collier, Duval, Hillsborough, Lee, Martin, Miami-Dade, Orange, Palm Beach, Sarasota, Seminole, and St. Lucie counties. For the purpose of this report, data Tables were retrieved from: 1. The American Community Survey (the ACS ): It is a nationwide survey designed to give communities a fresh look at how they are changing. Over the past years, the ACS has been released in the form of one-year estimates. The data is based on data collected in a single calendar year and describe the average characteristics for that specific year. The ACS is also available using the American Fact Finder, which is accessible over the Census Bureau web site. 2. The Local Unemployment Statistics (LAUS) program is a Federal-State cooperative effort in in which monthly estimates of total employment and unemployment are prepared for approximately 7,300 areas. These estimates are key indicators of local economic conditions. The Bureau of Labor Statistics (BLS) of the U.S. Department of Labor is responsible for the concepts, definitions, technical procedures, validation, and publication of the estimates that state employment security agencies prepare under agreement with BLS. 3. The SRDS Local Market Audience Analyst is the next generation consumer market research tool that delivers sophisticated demographic, segmentation, and targeting data for media planners and consumer marketers. 4. Sperling s BestPlaces compiles data regarding demographics, preferences, and selection of Best Places to live, work, or retire. The website is an extension to the software Places, U.S.A., developed by Bert Sperling. The data can be reviewed at bestplaces.net, which is a Fast Forward Inc. project. 6
7 List of Tables County Demographics Table 1. County Snapshot in Table 2. Cost of Living in Table 3. Gross Regional Product for Table 4. Projected Gross Regional Product for , 2020, 2025, and Table 5. Economic Wealth Index Table 6. Population Trends Table 7. Median Age Table 8. Median Age by Sex Table 9. Race Education Table 10. Education (2010) Table 11. School Enrollment by Level of School Table 12. Educational Attainment for the Population 18 Years and Over Income Table Aggregate Household Income Table 14. Wage Distribution (2011, 2nd quarter) Table 15. Poverty Status by Education Level Table 16. Poverty Status by Sex by Employment Status Housing Table 17. Housing Occupancy and Owner Costs Table 18. Median Value by Year Structure Built Labor Force, Employment, and Economic Incentives Table 19. Population 16 Years and Over by Sex by Labor Force Participation Table 20. Percent in Labor Force, Male Table 21. Percent in Labor Force, Female Table 22. Class of Worker as a Percentage of Total Employment Table 23. Industry Employment as a Percentage of Total Employment Table 24. Unemployment Rate Table 25. Economic Development Incentives in Table 26. Total Economic Development Incentives per Capita in
8 List of Figures County Demographics Figure 1. Gross Regional Product from , with Projections for Figure 2. Total Retail Sales, Including Eating and Drinking Places Sales for Figure 3. Economic Wealth Index Figure 4. Population Trends Figure 5. Median Age Figure 6. Male Median Age Figure 7. Female Median Age Figure 8. Race in Education Income Figure Aggregate Household Income, Broward County Figure Aggregate Household Income, Collier County Figure Aggregate Household Income, Duval County Figure Aggregate Household Income, Hillsborough County Figure Aggregate Household Income, Lee County Figure Aggregate Household Income, Martin County Figure Aggregate Household Income, Miami-Dade County Figure Aggregate Household Income, Orange County Figure Aggregate Household Income, Palm Beach County Figure Aggregate Household Income, Sarasota County Figure Aggregate Household Income, Seminole County Figure Aggregate Household Income, St. Lucie County Figure 21. Percent Federal, State, Local, and Private Wages (2011, 2nd Quarter).. 49 Figure 22. Percent of Total Population 25 Years and Over with Income in the Past 12 Months Below Poverty Level Housing Figure Median Value by Year, Owner-occupied Housing Units Labor Force, Employment, and Economic Incentives Figure 24. Labor Force Figure 25. Male Labor Force Participation Figure 26. Female Labor Force Participation Figure 27. Male and Female Labor Force Participation in Figure 28. Unemployment Rate
9 Introduction In the Summer of 2010, the Johnson School of Business at Hodges University volunteered to partner with the Greater Naples Chamber of Commerce and the Collier County Government for the purpose of an economic research study. Clearly, there was tremendous economic pressure upon most county governments throughout the United States. The Chamber and County Government were looking for important evidences from other successful counties, including new ways for the County Government and the area business community to work together to stimulate economic growth. Private sector Public sector Area of opportunity for cooperation Dr. Aysegul Timur, Chair of the Business and Public Administration Programs at Hodges University, championed the cause for the Johnson School of Business, and she assembled other persons to join her in the new Collier County Comparative Analysis Project. Currently the Project members include Dr. Aysegul Timur, Davor Pranjić, Anke Stugk, and Dr. Gerald Franz. This committee has worked closely with Dr. Michael Reagen, President and CEO of The Greater Naples Chamber of Commerce, along with other important Collier County officials and volunteers. This report concludes Phase III of the Project, and includes comparative data from 11 Florida counties, including Collier. These counties, deemed important because of various similarities to Collier County, include Broward, Duval, Hillsborough, Lee, Martin, Miami-Dade, Orange, Palm Beach, Sarasota, Seminole, and St. Lucie. The Phase III Reports bring together important data for the purpose of discerning economic patterns, best practices, and perhaps even models for successful government and business partnerships. Report I introduces the demographics of each county, followed by an overview of their labor, income and other statistics. Report II of this phase is the results of the primary survey data and concludes with important quantitative and qualitative information concerning county initiatives. It is the objective of the Collier County Comparative Analysis Project that these Reports will substantially contribute to the Greater Naples Chamber of Commerce and the Collier County Government in their quest for economic growth/development and prosperity in this region. 9
10 This page was left blank intentionally. 10
11 County Demographics 11
12 TABLE 1 County Snapshot in 2011 County Total population Median age Per capita income Property tax per $1,000 home value Sales tax Broward County 1,772, , Collier County 334, , Duval County 892, , Hillsborough County 1,223, , Lee County 619, , Martin County 143, , Miami-Dade County 2,521, , Orange County 1,124, , Palm Beach County 1,302, , Sarasota County 385, , Seminole County 425, , St. Lucie County 279, , Sources: Fast Forward, Inc. (2011). Sperling's BestPlaces. Retrieved January, 2012, from SRDS. (2011). Local Market Audience Analyst: Market profiles reports. Retrieved from TABLE 2 Cost of Living in 2011 Cost of Living Index Geographic Region Overall Food Utilities Miscellaneous Broward County Collier County Duval County Hillsborough County Lee County Martin County Miami-Dade County Palm Beach County Sarasota County Seminole County St. Lucie County Florida USA Source: Fast Forward, Inc. (2010). Sperling's BestPlaces. Retrieved January, 2012, from 12
13 TABLE 3 Gross Regional Product (in millions of 2005 dollars) for County Collier County 70, , , , , , , Broward County 12, , , , , , , Duval County 46, , , , , , , Hillsborough County 58, , , , , , , Lee County 19, , , , , , , Martin County 4, , , , , , , Miami-Dade County 101, , , , , , ,859.2 Orange County 59, , , , , , , Palm Beach County 55, , , , , , , Sarasota County 13, , , , , , , Seminole County 15, , , , , , , St. Lucie County 5, , , , , , , Source: Woods & Poole Economics. (2011) state profile: Florida [CD-ROM]. Washington, DC: Author. TABLE 4 Projected Gross Regional Product (in millions of 2005 dollars) for , 2020, 2025, and 2030 County Collier County 68, , , , , , ,563.3 Broward County 10, , , , , , , Duval County 46, , , , , , , Hillsborough County 57, , , , , , , Lee County 17, , , , , , , Martin County 4, , , , , , , Miami-Dade County 106, , , , , , ,966 Orange County 61, , , , , , ,990 Palm Beach County 52, , , , , , , Sarasota County 12, , , , , , , Seminole County 15, , , , , , , St. Lucie County 5, , , , , , , Source: Woods & Poole Economics. (2011) state profile: Florida [CD-ROM]. Washington, DC: Author. 13
14 250, , , , , Figure 1. Gross regional product (in millions of 2005 dollars) from , with projections for Broward Collier Duval Hillsborough Lee Martin Miami-Dade Orange Palm Beach Sarasota Seminole St. Lucie Source: Woods & Poole Economics. (2011) state profile: Florida [CD-ROM]. Washington, DC: Author. 35, , , , , , , Figure 2. Total retail sales, including eating and drinking places sales (in millions of 2005 dollars) for Broward County Collier County Duval County Hillsborough County Lee County Martin County Miami-Dade County Orange County Palm Beach County Sarasota County Seminole County St. Lucie County Source: Woods & Poole Economics. (2011) state profile: Florida [CD-ROM]. Washington, DC: Author. 14
15 TABLE 5 Economic Wealth Index County Broward County Collier County Duval County Hillsborough County Lee County Martin County Miami-Dade County Orange County Palm Beach County Sarasota County Seminole County St. Lucie County Source: Woods & Poole Economics. (2011) state profile: Florida [CD-ROM]. Washington, DC: Author Figure 3. Economic Wealth Index Broward Collier Duval Hillsborough Lee Martin Miami-Dade Orange Palm Beach Sarasota Seminole St. Lucie 15
16 Phase III Collier County Comparative Analysis Project TABLE 6 Population Trends County Broward County 1,753,578 1,779,508 1,887,135 2,024,750 2,163,867 2,302,376 2,439,712 2,577,721 Collier County 322, , , , , , , ,992 Duval County 865, , , ,357 1,008,197 1,056,937 1,105,299 1,154,103 Hillsborough County 1,233,846 1,251,509 1,324,985 1,419,130 1,514,443 1,609,422 1,703,655 1,798,421 Lee County 620, , , , , , ,430 1,052,898 Martin County 146, , , , , , , ,322 Miami-Dade County 2,505,379 2,526,051 2,614,493 2,729,531 2,846,647 2,962,976 3,077,854 3,193,643 Orange County 1,149,500 1,170,808 1,258,553 1,370,225 1,482,893 1,595,137 1,706,551 1,818,418 Palm Beach County 1,323,394 1,350,484 1,461,716 1,603,044 1,745,537 1,887,532 2,028,539 2,170,077 Sarasota County 379, , , , , , , ,937 Seminole County 423, , , , , , , ,557 St. Lucie County 278, , , , , , , ,693 Source: SRDS. (2011). Local Market Audience Analyst: Market profiles reports. Retrieved from Woods & Poole Economics. (2011) state profile: Florida [CD-ROM]. Washington, DC: Author Figure 4. Population trends Broward County Collier County Duval County Hillsborough County Lee County Martin County Miami-Dade County Orange County Palm Beach County Sarasota County Seminole County St. Lucie County Source: Woods & Poole Economics. (2011) state profile: Florida [CD-ROM]. Washington, DC: Author. 16
17 TABLE 7 Median Age County Broward County Collier County Duval County Hillsborough County Lee County Martin County Miami-Dade County Orange County Palm Beach County Sarasota County Seminole County St. Lucie County Source: U.S. Census Bureau. ( ) American Community Survey 1-year estimates: Table B Retrieved from Figure 5. Median age Broward County Collier County Duval County Hillsborough County Lee County Martin County Miami-Dade County Orange County Palm Beach County Sarasota County Seminole County St. Lucie County 17
18 TABLE 8 Median Age by Sex County Broward County Male Female Collier County Male Female Duval County Male Female Hillsborough County Male Female Lee County Male Female Martin County Male Female Miami-Dade County Male Female Orange County Male Female Palm Beach County Male Female Sarasota County Male Female Seminole County Male Female St. Lucie County Male Female Source: U.S. Census Bureau. ( ) American Community Survey 1-year estimates: Table B Retrieved from 18
19 55 Figure 6. Male median age Broward County Collier County Duval County Hillsborough County Lee County Martin County Miami-Dade County Orange County Palm Beach County Sarasota County Seminole County St. Lucie County Figure 7. Female median age Broward County Collier County Duval County Hillsborough County Lee County Martin County Miami-Dade County Orange County Palm Beach County Sarasota County Seminole County St. Lucie County 19
20 Table 9 Race Broward County White alone 1,168,396 1,167,834 1,141,266 1,159,242 1,144,427 1,120,311 Black or African American American Indian and Alaska Native alone 425, , , , , ,234 4,040 3,981 3,527 3,299 2,621 5,639 Asian alone 51,920 54,001 51,400 52,511 56,250 57,701 Native Hawaiian and Other Pacific Islander alone 1, , ,409 1,625 Some other race alone 66,782 76,128 88,275 59,375 79,358 56,595 Two or more races 40,195 43,133 46,860 43,395 40,840 44,473 Two races including Some other race Two races excluding Some other race, and three or more races 15,035 21,436 10,150 11,356 11,491 10,936 25,160 21,697 36,710 32,039 29,349 33,537 Collier County White alone 260, , , , , ,760 Black or African American American Indian and Alaska Native alone 16,004 17,436 18,240 16,788 19,025 21,018 1, , Asian alone 2,633 3,247 3,381 2,712 3,580 3,668 Native Hawaiian and Other Pacific Islander alone Some other race alone 19,251 25,867 22,279 9,346 10,055 15,082 Two or more races 3,152 4,106 1,337 3,636 2,954 5,162 Two races including Some other race Two races excluding Some other race, and three or more races 1,194 2, ,911 1,958 1,714 1,094 2,716 2,154 3,
21 Table 9 (Continued) Duval County White alone 506, , , , , ,164 Black or African American American Indian and Alaska Native alone 240, , , , , ,220 2,546 2,880 2,228 3,167 2,971 1,872 Asian alone 28,646 27,817 28,013 30,834 33,274 34,581 Native Hawaiian and Other Pacific Islander alone Some other race alone 19,475 15,329 14,289 14,090 10,633 10,334 Two or more races 12,689 16,318 16,123 17,124 19,186 23,453 Two races including Some other race Two races excluding Some other race, and three or more races 2,787 2,204 1,715 2,651 2,911 2,118 9,902 14,114 14,408 14,473 16,275 21,335 Hillsborough County White alone 823, , , , , ,163 Black or African American American Indian and Alaska Native alone 178, , , , , ,976 4,896 3,230 2,130 2,428 5,214 13,631 Asian alone 32,978 35,111 35,793 34,931 38,303 42,861 Native Hawaiian and Other Pacific Islander alone 1, Some other race alone 49,788 53,848 51,538 21,307 28,152 36,176 Two or more races 20,742 21,836 20,558 26,017 25,619 33,363 Two races including Some other race Two races excluding Some other race, and three or more races 8,630 6,355 4,096 3,492 4,222 5,912 12,112 15,481 16,462 22,525 21,397 27,
22 Table 9 (Continued) Lee County White alone 462, , , , , ,246 Black or African American American Indian and Alaska Native alone 39,065 41,543 44,674 44,864 44,907 51,757 1,746 1,621 2,132 2,410 3,218 1,501 Asian alone 6,584 7,571 8,031 8,141 8,098 8,790 Native Hawaiian and Other Pacific Islander alone Some other race alone 24,674 31,664 33,137 24,369 22,114 27,015 Two or more races 4,500 5,275 8,514 9,129 9,822 9,791 Two races including Some other race Two races excluding Some other race, and three or more races 1,614 2,028 3,541 1,839 2,528 1,686 2,886 3,247 4,973 7,290 7,294 8,105 Martin County White alone 122, , , , , ,510 Black or African American American Indian and Alaska Native alone 7,370 8,585 9,313 7,855 9,379 8, ,765 Asian alone 1,194 1,406 1,174 1,872 1, Native Hawaiian and Other Pacific Islander alone Some other race alone 3,151 5,380 6,807 3,059 5,022 4,648 Two or more races 1, ,034 2,259 1,821 1,791 Two races including Some other race Two races excluding Some other race, and three or more races ,084 1,188 1,
23 Table 9 (Continued) Miami-Dade County White alone 1,662,089 1,716,162 1,742,280 1,810,623 1,840,765 1,868,386 Black or African American American Indian and Alaska Native alone 457, , , , , ,913 3,423 5,139 4,492 2,924 4,450 4,418 Asian alone 32,884 35,964 34,633 36,711 41,004 39,304 Native Hawaiian and Other Pacific Islander alone 1, Some other race alone 132, , ,937 58,848 94,336 90,471 Two or more races 39,225 38,173 32,745 28,572 37,034 28,777 Two races including Some other race Two races excluding Some other race, and three or more races 17,615 23,389 16,924 14,324 15,825 11,625 21,610 14,784 15,821 14,248 21,209 17,152 Orange County White alone 644, , , , , ,363 Black or African American American Indian and Alaska Native alone 198, , , , , ,509 4,074 2,479 2,490 3,806 5,127 3,960 Asian alone 44,172 44,549 46,628 46,642 49,640 50,781 Native Hawaiian and Other Pacific Islander alone 39 1,512 1, ,057 Some other race alone 90, ,142 99,996 81,868 65,095 48,132 Two or more races 21,269 25,562 22,922 27,469 22,421 37,698 Two races including Some other race Two races excluding Some other race, and three or more races 6,642 8,398 8,149 8,695 7,070 10,909 14,627 17,164 14,773 18,774 15,351 26,
24 Table 9 (Continued) Palm Beach County White alone 925, , , , ,640 1,012,795 Black or African American American Indian and Alaska Native alone 192, , , , , ,646 3,119 4,118 4,970 3,651 2,863 1,793 Asian alone 26,392 25,852 27,119 29,806 27,995 31,726 Native Hawaiian and Other Pacific Islander alone 1, Some other race alone 87,148 90, ,721 35,566 28,991 27,976 Two or more races 12,100 15,758 14,243 17,363 19,413 20,636 Two races including Some other race Two races excluding Some other race, and three or more races 4,154 5,055 4,213 3,009 3,987 4,002 7,946 10,703 10,030 14,354 15,426 16,634 Sarasota County White alone 326, , , , , ,691 Black or African American American Indian and Alaska Native alone 14,378 16,500 16,564 17,555 16,814 15, Asian alone 4,115 4,614 4,460 4,870 4,702 5,460 Native Hawaiian and Other Pacific Islander alone Some other race alone 10,100 8,665 6,239 2,998 4,786 4,275 Two or more races 3,900 3,030 4,359 3,930 5,476 8,512 Two races including Some other race Two races excluding Some other race, and three or more races 1, , ,709 2,518 3,762 2,793 4,733 7,
25 Table 9 (Continued) Seminole County White alone 319, , , , , ,364 Black or African American American Indian and Alaska Native alone 37,857 42,733 41,821 41,672 44,677 45, , , Asian alone 13,444 13,744 14,973 14,786 15,994 15,494 Native Hawaiian and Other Pacific Islander alone Some other race alone 14,312 24,424 15,068 13,104 5,261 5,672 Two or more races 12,135 8,711 10,241 9,399 10,691 12,586 Two races including Some other race Two races excluding Some other race, and three or more races 2,266 2,110 2,766 1,901 1,638 2,550 9,869 6,601 7,475 7,498 9,053 10,036 St. Lucie County White alone 185, , , , , ,827 Black or African American American Indian and Alaska Native alone 38,830 42,267 45,342 47,902 45,026 52, , ,590 2,282 Asian alone 3,401 3,950 4,779 4,572 4,602 4,340 Native Hawaiian and Other Pacific Islander alone Some other race alone 8,440 7,299 7,724 7,846 7,674 7,727 Two or more races 2,218 4,072 3,495 6,052 7,398 10,975 Two races including Some other race Two races excluding Some other race, and three or more races 440 1,736 1, ,942 4,390 1,778 2,336 2,366 5,377 5,456 6,585 Source: U.S. Census Bureau. ( ) American Community Survey 1-year estimates: Table B Retrieved from 25
26 100% 90% 80% 70% 60% 50% 40% 30% 20% 10% 0% Figure 8. Race in 2010 Some other race alone Native Hawaiian and Other Pacific Islander alone Asian alone American Indian and Alaska Native alone Black or African American White alone 26
27 Education 27
28 TABLE 10 Education (2010) County High school or GED (U.S. Index) Broward County (100) Some college (U.S. Index) (96) Associate degree (U.S. Index) 8.56 (115) Bachelor degree (U.S. Index) (110) Masters degree (U.S. Index) 6.84 (97) Professional school (U.S. Index) 2.49 (129) Doctorate degree (U.S. Index) 0.94 (82) Collier County (94) (93) 6.73 (90) (110) 7.31 (104) 3.08 (159) 1.10 (96) Duval County (106) (115) 8.48 (113) (91) 5.52 (79) 1.69 (87) 0.89 (77) Hillsborough County (96) (91) 9.62 (129) (110) 6.73 (96) 2.18 (113) 1.04 (91) Lee County (111) (110) 6.81 (91) (98) 5.83 (83) 1.74 (90) 0.86 (75) Martin County (106) (103) 8.09 (108) (109) 6.50 (92) 2.67 (138) 0.89 (78) Miami-Dade County (93) (72) 8.01 (107) (100) 5.78 (82) 2.91 (150) 1.21 (105) Orange County (97) (93) 9.99 (134) (116) 6.70 (95) 1.82 (94) 0.95 (83) Palm Beach County (93) (97) 7.54 (101) (117) 7.38 (105) 3.06 (159) 1.12 (98) Sarasota County (111) (108) 7.98 (107) (100) 6.83 (97) 2.34 (121) 1.24 (108) Seminole County (90) (113) 9.66 (129) (121) 7.56 (107) 1.77 (92) 0.91 (80) St. Lucie County (120) (107) 7.83 (105) Source: SRDS. (2011). Local Market Audience Analyst: Market profiles reports. Retrieved from (66) 4.54 (64) 1.20 (62) 0.77 (67) 28
29 This page was left blank intentionally. 29
30 TABLE 11 School Enrollment by Level of School for the Population 3 Years and Over Broward County Total 1,690,401 1,719,886 1,691,422 1,683,960 1,697,595 1,694,178 Enrolled in school 465, , , , , ,470 Enrolled in nursery school, preschool Enrolled in kindergarten Enrolled in grade 1 to grade 4 Enrolled in grade 5 to grade 8 Enrolled in grade 9 to grade 12 Enrolled in college, undergraduate years Graduate or professional school 36,633 33,097 32,347 30,399 32,689 31,140 23,265 21,956 23,600 20,009 20,294 20,142 98,844 94,683 90,883 83,150 88,882 90,008 92,987 95,909 91,057 96,663 95,910 89, , , ,965 96,945 96,553 97,931 89,422 89,631 87,511 88, , ,136 21,512 19,337 19,692 21,843 24,219 22,941 Not enrolled in school 1,124,660 1,262,825 1,244,367 1,246,814 1,235,145 1,236,708 Collier County Total 290, , , , , ,040 Enrolled in school 59,463 58,061 58,954 57,902 63,512 68,039 Enrolled in nursery school, preschool Enrolled in kindergarten Enrolled in grade 1 to grade 4 Enrolled in grade 5 to grade 8 Enrolled in grade 9 to grade 12 Enrolled in college, undergraduate years Graduate or professional school 3,241 3,914 3,616 3,094 3,455 3,511 3,556 3,714 3,633 3,342 2,543 3,272 14,573 13,778 13,940 13,374 13,960 14,359 13,062 12,621 13,369 13,823 14,780 14,969 15,352 14,314 13,912 13,009 14,397 17,929 8,340 8,343 9,117 8,911 12,529 11,493 1,339 1,377 1,367 2,349 1,848 2,506 Not enrolled in school 230, , , , , ,
31 TABLE 11 (Continued) Duval County Total 773, , , , , ,461 Enrolled in school 216, , , , , ,896 Enrolled in nursery school, preschool Enrolled in kindergarten Enrolled in grade 1 to grade 4 Enrolled in grade 5 to grade 8 Enrolled in grade 9 to grade 12 Enrolled in college, undergraduate years Graduate or professional school 18,951 17,871 18,309 18,243 15,656 14,232 10,182 12,010 15,155 11,537 11,495 8,012 47,423 45,883 47,679 49,590 46,468 45,555 50,081 49,555 44,534 48,328 45,633 47,674 45,500 44,747 43,587 49,217 42,547 42,359 37,272 42,012 42,865 43,288 51,783 68,354 7,376 6,235 8,598 8,213 10,166 11,710 Not enrolled in school 556, , , , , ,565 Hillsborough County Total 1,063,690 1,106,298 1,125,674 1,129,023 1,142,139 1,189,149 Enrolled in school 282, , , , , ,755 Enrolled in nursery school, preschool Enrolled in kindergarten Enrolled in grade 1 to grade 4 Enrolled in grade 5 to grade 8 Enrolled in grade 9 to grade 12 Enrolled in college, undergraduate years Graduate or professional school 17,362 19,402 21,838 17,857 19,186 20,897 17,187 14,333 14,802 14,717 14,452 16,237 65,336 64,372 61,428 62,997 61,373 64,777 61,705 63,228 67,746 65,136 71,326 69,402 59,532 61,875 58,558 63,141 62,197 65,321 51,297 61,811 70,025 69,650 70,369 82,898 10,295 10,927 11,947 15,786 12,356 18,223 Not enrolled in school 780, , , , , ,
32 TABLE 11 (Continued) Lee County Total 521, , , , , ,637 Enrolled in school 102, , , , , ,278 Enrolled in nursery school, preschool Enrolled in kindergarten Enrolled in grade 1 to grade 4 Enrolled in grade 5 to grade 8 Enrolled in grade 9 to grade 12 Enrolled in college, undergraduate years Graduate or professional school 6,620 6,181 9,355 7,954 6,431 8,055 5,873 6,982 6,672 6,980 7,602 6,980 25,601 25,817 26,099 27,262 30,169 27,305 23,400 23,953 28,608 26,720 22,990 27,143 24,340 25,056 26,356 24,717 26,153 27,242 14,679 19,382 16,903 21,780 20,194 27,599 2,373 3,141 4,039 5,899 3,893 4,954 Not enrolled in school 418, , , , , ,359 Martin County Total 133, , , , , ,610 Enrolled in school 27,544 27,373 27,726 27,767 25,954 30,867 Enrolled in nursery school, preschool Enrolled in kindergarten Enrolled in grade 1 to grade 4 Enrolled in grade 5 to grade 8 Enrolled in grade 9 to grade 12 Enrolled in college, undergraduate years Graduate or professional school 2,561 1,553 1,521 1,451 1,235 2,405 1,449 1,428 1, ,409 1,319 6,000 5,650 6,739 5,423 5,533 6,362 5,642 6,475 5,641 6,170 5,908 6,300 6,634 6,016 6,359 6,717 5,946 6,369 4,063 5,422 5,289 5,747 5,463 7,063 1, , ,049 Not enrolled in school 105, , , , , ,
33 TABLE 11 (Continued) Miami-Dade County Total 2,227,205 2,302,873 2,288,795 2,306,712 2,395,590 2,415,339 Enrolled in school 651, , , , , ,365 Enrolled in nursery school, preschool Enrolled in kindergarten Enrolled in grade 1 to grade 4 Enrolled in grade 5 to grade 8 Enrolled in grade 9 to grade 12 Enrolled in college, undergraduate years Graduate or professional school 41,845 45,695 42,290 44,165 42,144 38,212 31,862 30,661 30,424 29,925 28,222 31, , , , , , , , , , , , , , , , , , , , , , , , ,073 25,392 26,354 22,953 26,625 31,443 31,789 Not enrolled in school 1,575,826 1,655,617 1,663,726 1,707,084 1,769,349 1,785,974 Orange County Total 953, ,929 1,015,859 1,022,672 1,035,470 1,106,068 Enrolled in school 273, , , , , ,293 Enrolled in nursery school, preschool Enrolled in kindergarten Enrolled in grade 1 to grade 4 Enrolled in grade 5 to grade 8 Enrolled in grade 9 to grade 12 Enrolled in college, undergraduate years Graduate or professional school 18,648 17,182 20,908 20,864 19,147 22,655 16,788 16,860 14,404 15,143 14,493 14,271 57,807 56,185 59,580 58,687 58,968 59,430 55,610 52,897 58,289 58,615 54,640 61,170 56,622 56,337 54,470 54,639 54,799 65,376 57,901 62,933 64,227 71,577 74,604 98,300 10,436 11,801 10,869 14,495 14,487 20,091 Not enrolled in school 679, , , , , ,
34 TABLE 11 (Continued) Palm Beach County Total 1,203,712 1,229,039 1,222,917 1,223,379 1,233,791 1,281,011 Enrolled in school 285, , , , , ,965 Enrolled in nursery school, preschool Enrolled in kindergarten Enrolled in grade 1 to grade 4 Enrolled in grade 5 to grade 8 Enrolled in grade 9 to grade 12 Enrolled in college, undergraduate years Graduate or professional school 22,040 22,274 22,356 24,615 16,123 20,413 14,302 13,217 13,544 14,332 14,238 16,671 60,670 59,105 61,397 57,115 58,016 56,811 62,744 58,774 58,079 57,013 60,527 63,756 61,536 64,530 62,172 60,142 59,813 65,156 53,394 55,358 53,198 53,925 57,393 67,547 10,713 10,405 10,893 10,962 11,397 14,611 Not enrolled in school 918, , , , , ,046 Sarasota County Total 351, , , , , ,371 Enrolled in school 64,203 60,294 64,288 64,457 66,980 65,864 Enrolled in nursery school, preschool Enrolled in kindergarten Enrolled in grade 1 to grade 4 Enrolled in grade 5 to grade 8 Enrolled in grade 9 to grade 12 Enrolled in college, undergraduate years Graduate or professional school 4,135 4,067 5,013 4,490 5,381 4,719 3,912 2,536 2,573 2,923 2,729 2,918 12,446 12,426 15,014 12,242 12,570 12,301 15,286 13,834 12,774 15,545 15,251 15,434 15,739 13,900 15,578 15,224 14,671 14,130 11,059 10,797 10,355 11,942 14,191 13,868 1,626 2,734 2,981 2,091 2,187 2,494 Not enrolled in school 287, , , , , ,
35 TABLE 11 (Continued) Seminole County Total 383, , , , , ,060 Enrolled in school 105, , , , , ,643 Enrolled in nursery school, preschool Enrolled in kindergarten Enrolled in grade 1 to grade 4 Enrolled in grade 5 to grade 8 Enrolled in grade 9 to grade 12 Enrolled in college, undergraduate years Graduate or professional school 6,768 5,975 6,476 7,052 7,659 7,777 5,081 4,843 4,921 4,558 5,981 4,390 21,689 22,435 20,334 20,178 22,647 23,349 22,923 21,235 22,261 20,314 21,146 23,611 23,496 23,082 21,703 24,814 24,191 24,709 22,023 24,130 24,531 30,158 26,841 33,596 3,561 5,357 4,543 3,828 5,118 6,211 Not enrolled in school 277, , , , , ,417 St. Lucie County Total 229, , , , , ,821 Enrolled in school 51,853 53,831 58,467 57,439 62,303 68,632 Enrolled in nursery school, preschool Enrolled in kindergarten Enrolled in grade 1 to grade 4 Enrolled in grade 5 to grade 8 Enrolled in grade 9 to grade 12 Enrolled in college, undergraduate years Graduate or professional school 3,511 3,879 3,892 3,063 4,319 4,843 2,947 2,643 3,160 4,127 3,192 2,820 10,305 9,976 11,801 13,581 12,780 15,019 11,103 13,130 14,050 12,136 14,949 12,837 12,928 12,418 13,880 13,474 13,359 15,818 9,863 10,856 10,346 9,731 11,690 15,777 1, ,338 1,327 2,014 1,518 Not enrolled in school 178, , , , , ,189 Source: U.S. Census Bureau. ( ) American Community Survey 1-year estimates: Table B Retrieved from 35
36 TABLE 12 Educational Attainment for the Population 18 Years and Over Broward County Less than 9th grade 54,932 60,804 64,217 64,658 67,929 68,599 9th to 12th grade, no diploma 124, , , , , ,609 High school graduate or equivalent 407, , , , , ,152 Some college, no degree 275, , , , , ,095 Associate degree 110, , , , , ,545 Bachelor s degree 236, , , , , ,758 Graduate or professional degree 113, , , , , ,158 Total 1,322,545 1, ,344,292 1,345,643 1,357,996 1,361,916 Collier County Less than 9th grade 20,355 19,644 18,437 17,552 18,390 16,792 9th to 12th grade, no diploma 22,661 23,010 21,574 26,838 20,625 24,306 High school graduate or equivalent 66,962 75,912 74,640 67,111 74,862 72,441 Some college, no degree 49,128 48,872 46,142 50,329 52,094 54,209 Associate degree 11,844 15,566 15,759 16,441 14,412 16,384 Bachelor s degree 43,405 41,940 44,954 46,527 46,736 47,227 Graduate or professional degree 24,572 25,199 28,915 26,321 26,840 28,388 Total 238, , , , , ,747 Duval County Less than 9th grade 17,526 21,984 21,222 22,943 24,409 24,214 9th to 12th grade, no diploma 56,655 60,963 63,690 65,713 63,497 59,070 High school graduate or equivalent 200, , , , , ,584 Some college, no degree 130, , , , , ,664 Associate degree 49,377 48,754 52,552 54,004 53,760 57,868 Bachelor s degree 94,557 94,172 96,921 91, , ,586 Graduate or professional degree 40,779 41,455 48,090 45,790 47,471 42,427 Total 589, , , , , ,
37 TABLE 12 (Continued) Hillsborough County Less than 9th grade 39,304 43,296 42,070 46,535 44,827 47,066 9th to 12th grade, no diploma 93,536 86,910 84,668 85,490 85,652 86,744 High school graduate or equivalent 244, , , , , ,128 Some college, no degree 170, , , , , ,416 Associate degree 72,022 87,028 87,561 83,146 76,683 79,774 Bachelor s degree 137, , , , , ,790 Graduate or professional degree 66,979 69,325 78,222 80,709 78,572 78,187 Total 824, , , , , ,105 Lee County Less than 9th grade 20,728 24,094 22,654 19,403 23,741 27,661 9th to 12th grade, no diploma 48,187 46,631 45,357 39,701 39,656 47,531 High school graduate or equivalent 144, , , , , ,745 Some college, no degree 91, ,672 97, , , ,647 Associate degree 28,479 32,753 35,406 29,797 36,040 39,905 Bachelor s degree 60,981 66,866 71,324 77,903 67,025 68,486 Graduate or professional degree 33,395 36,347 35,310 36,656 40,247 39,111 Total 427, , , , , ,086 Martin County Less than 9th grade 4,159 3,944 5,568 4,091 5,745 4,555 9th to 12th grade, no diploma 10,160 9,843 9,593 8,447 8,054 11,464 High school graduate or equivalent 32,432 35,640 32,868 34,985 29,020 32,148 Some college, no degree 25,733 23,808 24,392 25,905 30,517 28,872 Associate degree 9,256 9,406 9,777 9,520 10,383 8,872 Bachelor s degree 17,722 21,192 19,638 20,299 20,179 21,779 Graduate or professional degree 10,852 10,292 11,883 10,178 9,937 12,715 Total 110, , , , , ,
38 TABLE 12 (Continued) Miami-Dade County Less than 9th grade 190, , , , , ,899 9th to 12th grade, no diploma 212, , , , , ,364 High school graduate or equivalent 492, , , , , ,462 Some college, no degree 303, , , , , ,912 Associate degree 139, , , , , ,838 Bachelor s degree 257, , , , , ,963 Graduate or professional degree 146, , , , , ,781 Total 1,742,758 1,827,443 1,842,112 1,863,350 1,925,059 1,959,219 Orange County Less than 9th grade 35,825 34,776 44,409 39,547 41,405 34,893 9th to 12th grade, no diploma 70,910 73,418 71,763 65,716 63,466 82,000 High school graduate or equivalent 208, , , , , ,439 Some college, no degree 165, , , , , ,109 Associate degree 73,609 78,949 77,599 79,733 81,604 85,436 Bachelor s degree 126, , , , , ,270 Graduate or professional degree 57,223 62,512 71,525 65,569 63,143 73,353 Total 737, , , , , ,500 Palm Beach County Less than 9th grade 51,460 60,159 52,722 62,490 58,603 60,505 9th to 12th grade, no diploma 90,521 91,692 88,361 81,929 78,660 83,661 High school graduate or equivalent 277, , , , , ,586 Some college, no degree 213, , , , , ,500 Associate degree 70,012 80,511 75,259 72,253 80,411 77,686 Bachelor s degree 170, , , , , ,120 Graduate or professional degree 98, , , , , ,308 Total 972,642 1,002, ,357 1,001,903 1,011,266 1,054,
39 TABLE 12 (Continued) Sarasota County Less than 9th grade 9,444 10,414 7,769 7,200 7,509 6,924 9th to 12th grade, no diploma 25,907 25,512 25,238 24,811 21,833 23,413 High school graduate or equivalent 94,845 98,541 99, ,223 91, ,935 Some college, no degree 65,009 70,481 69,130 72,475 77,218 71,403 Associate degree 21,968 21,750 21,764 25,277 24,452 27,025 Bachelor s degree 50,578 51,544 55,464 50,268 53,034 49,674 Graduate or professional degree 31,194 31,811 31,825 29,749 33,739 34,905 Total 298, , , , , ,279 Seminole County Less than 9th grade 8,015 8,413 8,428 8,897 9,805 10,731 9th to 12th grade, no diploma 19,638 26,098 23,649 23,015 22,999 23,558 High school graduate or equivalent 80,994 82,925 84,575 82,273 75,465 76,429 Some college, no degree 70,800 71,842 73,622 84,872 81,020 82,434 Associate degree 30,158 26,624 29,244 31,854 29,532 32,092 Bachelor s degree 62,853 66,724 65,860 59,182 66,840 66,727 Graduate or professional degree 28,356 29,024 29,725 28,170 31,763 34,001 Total 300, , , , , ,972 St. Lucie County Less than 9th grade 10,453 8,328 13,713 13,845 10,462 11,101 9th to 12th grade, no diploma 23,479 26,512 29,593 25,477 23,158 22,605 High school graduate or equivalent 65,578 66,149 73,554 71,060 72,776 79,357 Some college, no degree 39,470 46,610 38,915 48,474 49,449 53,198 Associate degree 15,542 16,673 16,034 13,765 15,459 17,180 Bachelor s degree 20,046 22,364 20,213 20,926 22,088 22,689 Graduate or professional degree 11,237 11,304 9,532 11,898 12,607 11,019 Total 185, , , , , ,149 Source: U.S. Census Bureau. ( ) American Community Survey 1-year estimates: Table B Retrieved from 39
40 This page was left blank intentionally. 40
41 Income 41
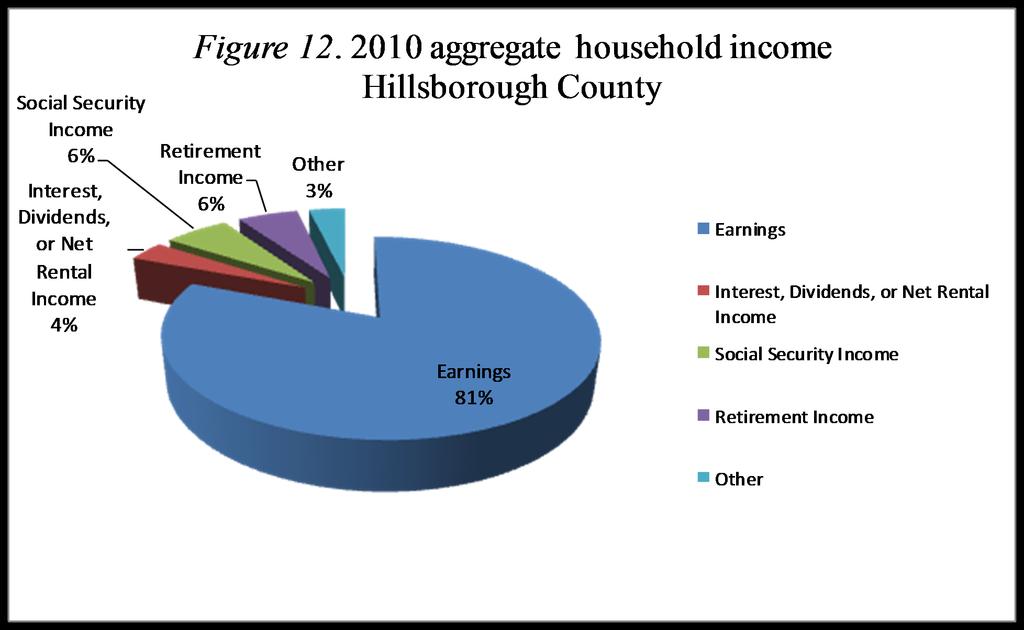
42 TABLE Aggregate Household Income County Earnings ($) Interest, dividends, or net rental income ($) Social Security income ($) Retirement income ($) Other ($) Collier County 5,086,121,100 2,188,030,900 1,070,512,200 1,099,887, ,501,500 Broward County 36,099,121,100 2,270,604,400 2,917,860,700 1,727,181,300 1,205,973,200 Duval County 15,773,863, ,773,700 1,292,643,500 1,209,225, ,409,100 Hillsborough County 24,037,711,900 1,033,036,800 1,832,642,500 1,718,143,300 1,032,272,100 Lee County 8,528,712,600 1,806,164,200 1,890,336,900 1,619,037, ,251,000 Martin County 2,581,069, ,921, ,476, ,561, ,908,400 Miami-Dade County 40,467,607,900 2,675,809,000 3,064,883,400 1,337,017,900 1,461,930,300 Orange County 21,112,274,700 1,139,447,400 1,365,036, ,791, ,159,100 Palm Beach County 26,152,584,600 5,389,668,400 3,611,830,100 2,530,182,200 1,139,630,300 St. Lucie County 3,698,722,200, 795,398, ,677, ,949, ,336,300 Sarasota County 5,719,946,400 1,342,015,600 1,497,867,000 1,285,648, ,119,500 Seminole County 8,684,934, ,755, ,790, ,616, ,044,100 Source: U.S. Census Bureau. (2011) American Community Survey: Tables B19061, B19062, B19063, B19064, B19065, B19066, B19067, B19069, and B Retrieved from 42
43 43
44 44
45 45
46 46
47 47
48 48

49 TABLE 14 Wage Distribution (2011, 2nd quarter) County Federal wages (%) State wages (%) Local wages (%) Private wages (%) Broward County Collier County Duval County Hillsborough County Lee County Martin County Miami-Dade County Orange County Palm Beach Sarasota County Seminole County St. Lucie County Source: Bureau of Labor Statistics. (2012). Quarterly Census of Employment and Wages: Series ENU , ENU , ENU , ENU , ENU , ENU , ENU , ENU , ENU , ENU , ENU , ENU , ENU , ENU , ENU , ENU , ENU , ENU , ENU , ENU , ENU , ENU , ENU , ENU , ENU , ENU , ENU , ENU , ENU , ENU , ENU , ENU , ENU , ENU , ENU , ENU , ENU , ENU , ENU , ENU , ENU , ENU , ENU , ENU , ENU , ENU , ENU , and ENU Retrieved from 49
Iowa School District Profiles. Le Mars
 Iowa School District Profiles Overview This profile describes enrollment trends, student performance, income levels, population, and other characteristics of the public school district. The report utilizes
Educational Attainment
 A Demographic and Socio-Economic Profile of Allen County, Indiana based on the 2010 Census and the American Community Survey Educational Attainment A Review of Census Data Related to the Educational Attainment
Status of Women of Color in Science, Engineering, and Medicine
 Status of Women of Color in Science, Engineering, and Medicine The figures and tables below are based upon the latest publicly available data from AAMC, NSF, Department of Education and the US Census Bureau.
Updated: December Educational Attainment
 Updated: Educational Attainment Among 25- to 29-year olds, the proportions who have attained a high school education, some college, or a bachelor s degree are all rising, according to longterm trends.
A Guide to Finding Statistics for Students
 San Joaquin Valley Statistics http://pegasi.us/sjstats/ 1 of 2 6/12/2010 5:00 PM A Guide to Finding Statistics for Students CV Stats Home By Topic By Area About the Valley About this Site Population Agriculture
San Francisco County Weekly Wages
 San Francisco County Weekly Wages Focus on Post-Recession Recovery Q 3 205 Update Produced by: Marin Economic Consulting March 6, 206 Jon Haveman, Principal 45-336-5705 or Jon@MarinEconomicConsulting.com
Suggested Citation: Institute for Research on Higher Education. (2016). College Affordability Diagnosis: Maine. Philadelphia, PA: Institute for
. College Affordability Diagnosis: Maine. Philadelphia, PA: Institute for") MAINE Suggested Citation: Institute for Research on Higher Education. (2016). College Affordability Diagnosis: Maine. Philadelphia, PA: Institute for Research on Higher Education, Graduate School of Education,
MAINE Suggested Citation: Institute for Research on Higher Education. (2016). College Affordability Diagnosis: Maine. Philadelphia, PA: Institute for Research on Higher Education, Graduate School of Education,
Cooper Upper Elementary School
 LIVONIA PUBLIC SCHOOLS http://cooper.livoniapublicschools.org 215-216 Annual Education Report BOARD OF EDUCATION 215-16 Colleen Burton, President Dianne Laura, Vice President Tammy Bonifield, Secretary
12-month Enrollment
 12-month Enrollment 2016-17 Institution: Potomac State College of West Virginia University (237701) Overview 12-month Enrollment Overview The 12-Month Enrollment component collects unduplicated student
Cooper Upper Elementary School
 LIVONIA PUBLIC SCHOOLS www.livoniapublicschools.org/cooper 213-214 BOARD OF EDUCATION 213-14 Mark Johnson, President Colleen Burton, Vice President Dianne Laura, Secretary Tammy Bonifield, Trustee Dan
EDUCATIONAL ATTAINMENT
 EDUCATIONAL ATTAINMENT By 2030, at least 60 percent of Texans ages 25 to 34 will have a postsecondary credential or degree. Target: Increase the percent of Texans ages 25 to 34 with a postsecondary credential.
File Print Created 11/17/2017 6:16 PM 1 of 10
 Success - Key Measures Graduation Rate: 4-, 5-, and 6-Year 9. First-time, full-time entering, degree-seeking, students enrolled in a minimum of 12 SCH their first fall semester who have graduated from
Lesson M4. page 1 of 2
 Lesson M4 page 1 of 2 Miniature Gulf Coast Project Math TEKS Objectives 111.22 6b.1 (A) apply mathematics to problems arising in everyday life, society, and the workplace; 6b.1 (C) select tools, including
APPLICANT INFORMATION. Area Code: Phone: Area Code: Phone:
 MARQUETTE UNIVERSITY HEALTH CAREERS OPPORTUNITY PROGRAM College Science Enrichment Program (CSEP) & Pre-Enrollment Support Program (PESP) Website: http://www.mu.edu/hcop INSTRUCTIONS: Please type or print
Serving Country and Community: A Study of Service in AmeriCorps. A Profile of AmeriCorps Members at Baseline. June 2001
 Serving Country and Community: A Study of Service in AmeriCorps Cambridge, MA Lexington, MA Hadley, MA Bethesda, MD Washington, DC Chicago, IL Cairo, Egypt Johannesburg, South Africa A Profile of AmeriCorps
Welcome. Paulo Goes Dean, Eller College of Management Welcome Our region
 Welcome. Paulo Goes Dean, Welcome. Our region Outlook for Tucson Patricia Feeney Executive Director, Southern Arizona Market Chase George W. Hammond, Ph.D. Director, University of Arizona 1 Visit the award-winning
https://secure.aacte.org/apps/peds/print_all_forms.php?view=report&prin...
 1 of 35 4/25/2012 9:56 AM A» 2011 PEDS» Institutional Data inst id: 3510 Institutional Data A_1 Institutional Information This information will be used in all official references to your institution. Institution
Like much of the country, Detroit suffered significant job losses during the Great Recession.
 36 37 POPULATION TRENDS Economy ECONOMY Like much of the country, suffered significant job losses during the Great Recession. Since bottoming out in the first quarter of 2010, however, the city has seen
46 Children s Defense Fund
 Nationally, about 1 in 15 teens ages 16 to 19 is a dropout. Fewer than two-thirds of 9 th graders in Florida, Georgia, Louisiana and Nevada graduate from high school within four years with a regular diploma.
Shelters Elementary School
 Shelters Elementary School August 2, 24 Dear Parents and Community Members: We are pleased to present you with the (AER) which provides key information on the 23-24 educational progress for the Shelters
Educational Management Corp Chef s Academy
 Educational Management Corp Chef s Academy Morrisville, North Carolina (Raleigh MSA) Exclusively Offered By: Porthaven Partners 8908 S. Yale Ave. Suite 400 Tulsa, OK 74137 Ryan Carter Partner P: 918.496.1464
The number of involuntary part-time workers,
 University of New Hampshire Carsey School of Public Policy CARSEY RESEARCH National Issue Brief #116 Spring 2017 Involuntary Part-Time Employment A Slow and Uneven Economic Recovery Rebecca Glauber The
Data Glossary. Summa Cum Laude: the top 2% of each college's distribution of cumulative GPAs for the graduating cohort. Academic Honors (Latin Honors)
") Institutional Research and Assessment Data Glossary This document is a collection of terms and variable definitions commonly used in the universities reports. The definitions were compiled from various
Institutional Research and Assessment Data Glossary This document is a collection of terms and variable definitions commonly used in the universities reports. The definitions were compiled from various
NATIONAL CENTER FOR EDUCATION STATISTICS
 NATIONAL CENTER FOR EDUCATION STATISTICS Palm Desert, CA The Integrated Postsecondary Education Data System (IPEDS) is the nation s core postsecondary education data collection program. It is a single,
Kahului Elementary School
 Kahului Elementary Code: 405 Status and Improvement Report Year 2014-15 Focus On Standards Grades K-5 Focus on Standards Description Contents Setting Student Profile Community Profile Improvement Summary
An Analysis of the El Reno Area Labor Force
 An Analysis of the El Reno Area Labor Force Summary Report for the El Reno Industrial Development Corporation and Oklahoma Department of Commerce David A. Penn and Robert C. Dauffenbach Center for Economic
EDUCATIONAL ATTAINMENT
 EDUCATIONAL ATTAINMENT By 2030, at least 60 percent of Texans ages 25 to 34 will have a postsecondary credential or degree. Target: Increase the percent of Texans ages 25 to 34 with a postsecondary credential.
Port Graham El/High. Report Card for
 School: District: Kenai Peninsula Grades: K - 12 School Enrollment: 20 Title I School? No Title 1 Program: Accreditation: Report Card for 2008-2009 A Title 1 school receives federal money in support low-achieving
Institution of Higher Education Demographic Survey
 Institution of Higher Education Demographic Survey Data from all participating institutions are aggregated for the comparative studies by various types of institutional characteristics. For that purpose,
University of Arizona
 Annual Report Submission View Questionnaire (Edit) University of Arizona Annual Report Submission for the year 2009. Report has been submitted 1 times. Report was last submitted on 11/30/2009 7:12:09 PM.
Data Diskette & CD ROM
 Data File Format Data Diskette & CD ROM Texas Assessment of Academic Skills Fall 2002 through Summer 2003 Exit Level Test Administrations Attention Macintosh Users To accommodate Macintosh systems a delimiter
Frank Phillips College. Accountability Report
 Frank Phillips College Accountability Report January 2016 Accountability System, January 2016 1 of 22 Participation - Key Measures Enrollment 1. Fall Headcount (Unduplicated) Fall 2000 Fall 2014 Fall 2015
Trends in Tuition at Idaho s Public Colleges and Universities: Critical Context for the State s Education Goals
 1 Trends in Tuition at Idaho s Public Colleges and Universities: Critical Context for the State s Education Goals June 2017 Idahoans have long valued public higher education, recognizing its importance
ILLINOIS DISTRICT REPORT CARD
 -6-525-2- HAZEL CREST SD 52-5 HAZEL CREST SD 52-5 HAZEL CREST, ILLINOIS and federal laws require public school districts to release report cards to the public each year. 2 7 ILLINOIS DISTRICT REPORT CARD
ILLINOIS DISTRICT REPORT CARD
 -6-525-2- Hazel Crest SD 52-5 Hazel Crest SD 52-5 Hazel Crest, ILLINOIS 2 8 ILLINOIS DISTRICT REPORT CARD and federal laws require public school districts to release report cards to the public each year.
2/3 9.8% 38% $0.78. The Status of Women in Missouri: 2016 ARE WOMEN 51% 22% A Comprehensive Report of Leading Indicators and Findings.
 A Missouri WOMAN WORKING FULL-TIME EARNS ONLY $0.78 FOR EACH DOLLAR A MAN EARNS 2/3 OF Missouri SENIORS LIVING IN POVERTY ARE WOMEN 9.8% The Status of Women in Missouri: 2016 A Comprehensive Report of
Why Graduate School? Deborah M. Figart, Ph.D., Dean, School of Graduate and Continuing Studies. The Degree You Need to Achieve TM
 Why Graduate School? Deborah M. Figart, Ph.D., Dean, School of Graduate and Continuing Studies Message from the Dean Prospective Graduate Students: As an economist, I want to relate how crucial it is for
Coming in. Coming in. Coming in
 212-213 Report Card for Glenville High School SCHOOL DISTRICT District results under review by the Ohio Department of Education based upon 211 findings by the Auditor of State. Achievement This grade combines
Trends in College Pricing
 Trends in College Pricing 2009 T R E N D S I N H I G H E R E D U C A T I O N S E R I E S T R E N D S I N H I G H E R E D U C A T I O N S E R I E S Highlights Published Tuition and Fee and Room and Board
The Effect of Income on Educational Attainment: Evidence from State Earned Income Tax Credit Expansions
 The Effect of Income on Educational Attainment: Evidence from State Earned Income Tax Credit Expansions Katherine Michelmore Policy Analysis and Management Cornell University km459@cornell.edu September
Charter School Performance Comparable to Other Public Schools; Stronger Accountability Needed
 April 2005 Report No. 05-21 Charter School Performance Comparable to Other Public Schools; Stronger Accountability Needed at a glance On average, charter school students are academically behind when they
Stetson University College of Law Class of 2012 Summary Report
 Stetson University College Law Class 2012 Summary Report Full-time Long-term Salaries # with Salary 25th Median 75th Mean Total = 341 Gender : Women Men Subtotal Race : Minority Nonminority Subtotal Gender
Samuel Enoka Kalama Intermediate School
 Code: 420 Samuel Enoka Kalama Intermediate Status and Improvement Report Year 2014-15 Focus On Standards Grades 6-8 Contents This Status and Improvement Report has been prepared as part of the Department's
Facts and Figures Office of Institutional Research and Planning
 Facts and Figures 2008-2009 Office of Institutional Research and Planning Office of Institutional Research Fall 2009 Facts at a Glance Credit Headcount Enrollments Headcount Ethnicity Headcount Percent
National Survey of Student Engagement The College Student Report
 The College Student Report This is a facsimile of the NSSE survey (available at nsse.iub.edu/links/surveys). The survey itself is administered online. 1. During the current school year, about how often
RETAIL SECTOR CONTINUES SLOW RECOVERY AFTER A HARSH WINTER
 RETAIL MARKET REPORT: 1Q RETAIL SECTOR CONTINUES SLOW RECOVERY AFTER A HARSH WINTER KEY INDICATORS: Key retail market indicators improved slightly this quarter. Monthly retail sales (ex: motor vehicles
PUBLIC INFORMATION POLICY
 CALIFORNIA STATE POLYTECHNIC UNIVERSITY, POMONA Landscape Architecture College of Environmental Design PUBLIC INFORMATION POLICY Landscape Architecture Accreditation Board (LAAB) accredited programs are
Student Mobility Rates in Massachusetts Public Schools
 Student Mobility Rates in Massachusetts Public Schools Introduction The Massachusetts Department of Elementary and Secondary Education (ESE) calculates and reports mobility rates as part of its overall
Women, Minorities, and Persons with Disabilities in Science and Engineering
 2017 Women, Minorities, and Persons with Disabilities in Science and Engineering Emilda B. Rivers, Deputy Director National Center for Science and Engineering Statistics National Science Foundation www.nsf.gov/statistics
HIGH SCHOOL PREP PROGRAM APPLICATION For students currently in 7th grade
 HIGH SCHOOL PREP PROGRAM APPLICATION For students currently in 7th grade APPLICATION CHECKLIST: Applications can be mailed, faxed, or dropped off to the address below. Proof of Income (Household income
Hale`iwa. Elementary School Grades K-6. School Status and Improvement Report Content. Focus On School
 Comprehensive Assessment and Accountability System Year 1999-2000 Hale`iwa Elementary Grades K-6 Focus on Description Context: Setting Student Community Process: Process: Certified Facilities Outcomes:
University of Utah. 1. Graduation-Rates Data a. All Students. b. Student-Athletes
 University of Utah FRESHMAN-COHORT GRADUATION RATES All Students Student-Athletes # 2009-10 Graduation Rate 64% 64% Four-Class Average 61% 64% Student-Athlete Graduation Success Rate 87% 1. Graduation-Rates
BARUCH RANKINGS: *Named Standout Institution by the
 THE BARUCH VALUE BARUCH RANKINGS: *#1 in CollegeNET s annual Social Mobility Index (out of over 900 colleges) for a second year in a row. *Named Standout Institution by the Baruch Background Baruch College
Executive Summary. Walker County Board of Education. Dr. Jason Adkins, Superintendent 1710 Alabama Avenue Jasper, AL 35501
 Dr. Jason Adkins, Superintendent 1710 Alabama Avenue Jasper, AL 35501 Document Generated On November 3, 2016 TABLE OF CONTENTS Introduction 1 Description of the School System 2 System's Purpose 4 Notable
Upward Bound Math & Science Program
 Upward Bound Math & Science Program A College-Prep Program sponsored by Northern Arizona University New for Program Year 2015-2016 Students participate year-round each year beginning in 2016 January May
UW-Waukesha Pre-College Program. College Bound Take Charge of Your Future!
 UW-Waukesha Pre-College Program College Bound 2017 Take Charge of Your Future! This is a great program to increase your knowledge on various subjects. Students will be engaged in workshops and hands-on
Fruitvale Station Shopping Center > Retail
 Oakland, CA > Retail > Very rare (i.e. high barriers of entry) freeway visible, surface parked, high volume grocery anchored regional serving center. > Notable tenants include: Food Maxx, Starbucks, Office
Executive Summary. Hialeah Gardens High School
 Miami-Dade County Public Schools Dr. Louis Algaze, Principal 11700 Hialeah Gardens Blvd Hialeah Gardens, FL 33018 Document Generated On March 19, 2014 TABLE OF CONTENTS Introduction 1 Description of the
HOUSE OF REPRESENTATIVES AS REVISED BY THE COMMITTEE ON EDUCATION APPROPRIATIONS ANALYSIS
 BILL #: HB 269 HOUSE OF REPRESENTATIVES AS REVISED BY THE COMMITTEE ON EDUCATION APPROPRIATIONS ANALYSIS RELATING TO: SPONSOR(S): School District Best Financial Management Practices Reviews Representatives
1.0 INTRODUCTION. The purpose of the Florida school district performance review is to identify ways that a designated school district can:
 1.0 INTRODUCTION 1.1 Overview Section 11.515, Florida Statutes, was created by the 1996 Florida Legislature for the purpose of conducting performance reviews of school districts in Florida. The statute
Executive Summary. Laurel County School District. Dr. Doug Bennett, Superintendent 718 N Main St London, KY
 Dr. Doug Bennett, Superintendent 718 N Main St London, KY 40741-1222 Document Generated On January 13, 2014 TABLE OF CONTENTS Introduction 1 Description of the School System 2 System's Purpose 4 Notable
Best Colleges Main Survey
 Best Colleges Main Survey Date submitted 5/12/216 18::56 Introduction page 1 / 146 BEST COLLEGES Data Collection U.S. News has begun collecting data for the 217 edition of Best Colleges. The U.S. News
SFY 2017 American Indian Opportunities and Industrialization Center (AIOIC) Equity Direct Appropriation
 Equity Direct Appropriation") SFY 2017 American Indian Opportunities and Industrialization Center (AIOIC) Equity Direct Appropriation Report to the Legislature as required by 2016 Minnesota Session Laws, Chapter 189, H.F. 2749, Article
SFY 2017 American Indian Opportunities and Industrialization Center (AIOIC) Equity Direct Appropriation Report to the Legislature as required by 2016 Minnesota Session Laws, Chapter 189, H.F. 2749, Article
San Mateo Community College District External Trends and Implications for Strategic Planning
 San Mateo Community College District External Trends and Implications for Strategic Planning Demographic Trends United States It is estimated that by 2025, the number of Americans over 60 will increase
SCHOOL. Wake Forest '93. Count
 Count ID 43 256 VALID N 256 Q.1A ACTIVITIES YEAR FOLLOWING GRADUATION? Primary Employed full-time 157 61.6% Employed part-time 12 4.7% Unemployed, by choice 3 1.2% Unemployed, seeking employment 7 2.7%
Financing Education In Minnesota
 Financing Education In Minnesota 2016-2017 Created with Tagul.com A Publication of the Minnesota House of Representatives Fiscal Analysis Department August 2016 Financing Education in Minnesota 2016-17
BOOM FOR WHOM? How the resurgence of the Bronx is leaving residents behind JULY 2008
 BOOM FOR WHOM? How the resurgence of the Bronx is leaving residents behind JULY 2008 A report of the Northwest Bronx Community & Clergy Coalition and the Community Development Project of the Urban Justice
Hokulani Elementary School
 Hokulani Elementary Code: 109 Status and Improvement Report Year -11 Contents Focus On Standards Grades K-5 This Status and Improvement Report has been prepared as part of the Department's education accountability
Creating Collaborative Partnerships: The Success Stories and Challenges
 Creating Collaborative Partnerships: The Success Stories and Challenges Community College Center of Excellence Building a World Class Workforce Through Community College Partnerships Cari Mallory National
The Condition of College & Career Readiness 2016
 The Condition of College and Career Readiness This report looks at the progress of the 16 ACT -tested graduating class relative to college and career readiness. This year s report shows that 64% of students
Descriptive Summary of Beginning Postsecondary Students Two Years After Entry
 NATIONAL CENTER FOR EDUCATION STATISTICS Statistical Analysis Report June 994 Descriptive Summary of 989 90 Beginning Postsecondary Students Two Years After Entry Contractor Report Robert Fitzgerald Lutz
Reaching the Hispanic Market The Arbonne Hispanic Initiative
 Reaching the Hispanic Market The Arbonne Hispanic Initiative Hispanic Initiative Overview 2002 Arbonne en Español Started 2006 Initiated Hispanic Initiative 2007 Market Study & Survey Field Support» Jael
Chapter Six The Non-Monetary Benefits of Higher Education
 Chapter Six The Non-Monetary Benefits of Higher Education This Chapter addresses the third objective of the thesis. The purpose of this chapter is to document some of the non-monetary benefits associated
Availability of Grants Largely Offset Tuition Increases for Low-Income Students, U.S. Report Says
 Wednesday, October 2, 2002 http://chronicle.com/daily/2002/10/2002100206n.htm Availability of Grants Largely Offset Tuition Increases for Low-Income Students, U.S. Report Says As the average price of attending
DUAL ENROLLMENT ADMISSIONS APPLICATION. You can get anywhere from here.
 DUAL ENROLLMENT ADMISSIONS APPLICATION SM You can get anywhere from here. Please print or type: DUAL ENROLLMENT APPLICATION Last Name First Name Maiden/Middle Social Security # Local Address (include apt.
Average Loan or Lease Term. Average
 Auto Credit For many working families and individuals, owning a car or truck is critical to economic success. For most, a car or other vehicle is their primary means of transportation to work. For those
Psychometric Research Brief Office of Shared Accountability
 August 2012 Psychometric Research Brief Office of Shared Accountability Linking Measures of Academic Progress in Mathematics and Maryland School Assessment in Mathematics Huafang Zhao, Ph.D. This brief
Annex 1: Millennium Development Goals Indicators
 Annex 1: Millennium Development Goals Indicators Millennium Development Goals (MDGs) Goals and Targets(Millennium Declaration) Indicators for monitoring progress GOAL 1: ERADICATE EXTREME POVERTY AND HUNGER
California State University, Los Angeles TRIO Upward Bound & Upward Bound Math/Science
 Application must be completed in black or blue ink only. STUDENT INFORMATION Name: Social Security # - - First Middle Last Address: Apt.# Phone: ( ) City: State: Zip Code: Date of Birth: Place of Birth:
Grant/Scholarship General Criteria CRITERIA TO APPLY FOR AN AESF GRANT/SCHOLARSHIP
 2017-2018 Grant/Scholarship General Criteria CRITERIA TO APPLY FOR AN AESF GRANT/SCHOLARSHIP 1) Student(s) must attend an AESF member Episcopal school 2) An AESF Grant/Scholarship Application and supporting
BUILDING CAPACITY FOR COLLEGE AND CAREER READINESS: LESSONS LEARNED FROM NAEP ITEM ANALYSES. Council of the Great City Schools
 1 BUILDING CAPACITY FOR COLLEGE AND CAREER READINESS: LESSONS LEARNED FROM NAEP ITEM ANALYSES Council of the Great City Schools 2 Overview This analysis explores national, state and district performance
Australia s tertiary education sector
 Australia s tertiary education sector TOM KARMEL NHI NGUYEN NATIONAL CENTRE FOR VOCATIONAL EDUCATION RESEARCH Paper presented to the Centre for the Economics of Education and Training 7 th National Conference
EMPLOYMENT APPLICATION Legislative Counsel Bureau and Nevada Legislature 401 S. Carson Street Carson City, NV Equal Opportunity Employer
 EMPLOYMENT APPLICATION Legislative Counsel Bureau and Nevada Legislature 401 S. Carson Street Carson City, NV 89701-4747 Equal Opportunity Employer Read Instructions Before Proceeding I am applying for
Supply and Demand of Instructional School Personnel
 Supply and Demand of Instructional School Personnel Presentation to the 82 nd Annual Virginia Middle and High School Principals Conference and Exposition Mrs. Patty S. Pitts Assistant Superintendent of
JD Concentrations CONCENTRATIONS. J.D. students at NUSL have the option of concentrating in one or more of the following eight areas:
 JD Concentrations CONCENTRATIONS J.D. students at NUSL have the option of concentrating in one or more of the following eight areas: Labor, Work & Income Intellectual Property and Innovation Business and
SMILE Noyce Scholars Program Application
 ONLINE POST-BABACCALAUREATE TEACHER PREPARATION PROGRAM SMILE yce Scholars Program Application Introduction: Rio Salado College is soliciting applicants for the Science and Math Innovative Learning Environments
Enrollment Trends. Past, Present, and. Future. Presentation Topics. NCCC enrollment down from peak levels
 Presentation Topics 1. Enrollment Trends 2. Attainment Trends Past, Present, and Future Challenges & Opportunities for NC Community Colleges August 17, 217 Rebecca Tippett Director, Carolina Demography
OREGON TECH ECONOMIC IMPACT ANALYSIS
 OREGON TECH ECONOMIC IMPACT ANALYSIS JANUARY 2016 PREPARED BY: This page left intentionally blank TABLE OF CONTENTS 1 Executive Summary 2 Introduction 3 Oregon Tech s Role in Oregon 4 Career Readiness
5 Programmatic. The second component area of the equity audit is programmatic. Equity
 5 Programmatic Equity It is one thing to take as a given that approximately 70 percent of an entering high school freshman class will not attend college, but to assign a particular child to a curriculum
Junior (61-90 semester hours or quarter hours) Two-year Colleges Number of Students Tested at Each Institution July 2008 through June 2013
 Two-year Colleges Number of Students Tested at Each Institution July 2008 through June 2013") Number of Students Tested at Each Institution July 2008 through June 2013 List of Institutions Number of School Name Students AIKEN TECHNICAL COLLEGE, SC 119 ARKANSAS NORTHEASTERN COLLEGE, AR 66 ASHLAND
Number of Students Tested at Each Institution July 2008 through June 2013 List of Institutions Number of School Name Students AIKEN TECHNICAL COLLEGE, SC 119 ARKANSAS NORTHEASTERN COLLEGE, AR 66 ASHLAND
Raw Data Files Instructions
 Raw Data Files Instructions Colleges will report the above information for students in the Main Cohort for each of the reporting timeframes and the system will calculate the sub cohorts and metrics based
SASKATCHEWAN MINISTRY OF ADVANCED EDUCATION
 SASKATCHEWAN MINISTRY OF ADVANCED EDUCATION Report March 2017 Report compiled by Insightrix Research Inc. 1 3223 Millar Ave. Saskatoon, Saskatchewan T: 1-866-888-5640 F: 1-306-384-5655 Table of Contents
Student Support Services Evaluation Readiness Report. By Mandalyn R. Swanson, Ph.D., Program Evaluation Specialist. and Evaluation
 Student Support Services Evaluation Readiness Report By Mandalyn R. Swanson, Ph.D., Program Evaluation Specialist and Bethany L. McCaffrey, Ph.D., Interim Director of Research and Evaluation Evaluation
Bellevue University Bellevue, NE
 C O L L E G E P R O F I L E - O V E R V I E W Bellevue University Bellevue, NE Bellevue, founded in 1966, is a private university. Its campus is located in Bellevue, in the Omaha metropolitan area. Web
Sunnyvale Middle School School Accountability Report Card Reported Using Data from the School Year Published During
 Sunnyvale Middle School School Accountability Report Card Reported Using Data from the 2014-15 School Year Published During 2015-16 By February 1 of each year, every school in California is required by
ANALYSIS: LABOUR MARKET SUCCESS OF VOCATIONAL AND HIGHER EDUCATION GRADUATES
 ANALYSIS: LABOUR MARKET SUCCESS OF VOCATIONAL AND HIGHER EDUCATION GRADUATES Authors: Ingrid Jaggo, Mart Reinhold & Aune Valk, Analysis Department of the Ministry of Education and Research I KEY CONCLUSIONS
Kansas Adequate Yearly Progress (AYP) Revised Guidance
 Revised Guidance") Kansas State Department of Education Kansas Adequate Yearly Progress (AYP) Revised Guidance Based on Elementary & Secondary Education Act, No Child Left Behind (P.L. 107-110) Revised May 2010 Revised May
Kansas State Department of Education Kansas Adequate Yearly Progress (AYP) Revised Guidance Based on Elementary & Secondary Education Act, No Child Left Behind (P.L. 107-110) Revised May 2010 Revised May
U VA THE CHANGING FACE OF UVA STUDENTS: SSESSMENT. About The Study
 About The Study U VA SSESSMENT In 6, the University of Virginia Office of Institutional Assessment and Studies undertook a study to describe how first-year students have changed over the past four decades.
DELIVERING A DEMAND LED SYSTEM IN THE U.S. THE ALAMO COMMUNITY COLLEGES APPROACH
 DELIVERING A DEMAND LED SYSTEM IN THE U.S. THE ALAMO COMMUNITY COLLEGES APPROACH LEARNING AND SKILLS DEVELOPMENT AGENCY NORTHERN IRELAND DR. BRUCE LESLIE, CHANCELLOR THE ALAMO COMMUNITY COLLEGES 40
LIM College New York, NY
 C O L L E G E P R O F I L E - O V E R V I E W LIM College New York, NY The Laboratory Institute of Merchandising, founded in 1939, is a private institute. Its facilities are located in Manhattan. Web Site