Equality Information Report 2015/16
|
|
|
- Paula Todd
- 5 years ago
- Views:
Transcription

1 Equality Information Report 2015/16 January 2017
2 Preface Nottingham Trent University is committed to sustaining highly effective learning and working environments characterised by fairness, inclusivity and equality of opportunity. This Equality Information Report provides a review of equality, diversity and inclusion data monitoring at NTU during the academic year 2015/16. It includes the statutory equality information on the University s student and staff populations. This information is analysed for trends over a number of years. Section 1 highlights some of the key findings from the in-depth analysis of the student and staff equality information reported in sections 2 and 3. In Section 2, student equality information is analysed over 5 years. Student equality information includes enrolments, progression, and attainment, and provides analysis by gender, ethnicity, disability status, age, socioeconomic group, pre-entry qualification route, home/overseas residency, and religion and belief. Contents Page Preface 1 Section 1 - Executive Summary 2 Student Data: Summary 2 Staff Data: Summary 5 Section 2 - Equality Information: Students 8 Gender 11 Ethnicity 14 Disability 17 Age 20 Widening Participation 23 Pre-entry qualification route Home/overseas residency Religion and belief 31 Section 3 Equality Information: Staff 34 Gender 35 Ethnicity 42 Disability 52 Age 60 Religion and Belief Sexual Orientation The staff equality information in Section 3 is broken down to College and School / Professional Services area, seniority level, and includes equality-related analysis of leavers, and staff disciplinaries and grievances. It includes analysis by gender, ethnicity, disability status, age, and religion and belief. It also includes an overview of the newlymonitored characteristic of sexual orientation. Overall, the report identifies the University s trends, progressions and challenges as it continues to provide an inclusive and thriving learning and working environment for all members of its community. To request an accessible version of this report please contact equality@ntu.ac.uk 1
3 Section 1 Executive Summary This section highlights the key findings following analysis of the 2014/15 staff and student equality data. In-depth analysis and details of methodology can be found in Section 2 and Section 3. Wherever possible, NTU s staff and student equality data is benchmarked against wider sector data. The Equality Challenge Unit (ECU) provides annual reports on staff and students. However, because their methodology is different to that of NTU, it is not always possible to draw direct and reliable comparisons. The ECU reports are also published late in the academic cycle. Therefore the NTU data in this report is for 2015/16 but the ECU data is for 2014/15, as the 2015/16 data is not published until November Student Data Summary Section 2 provides data and analysis of the progression and attainment of NTU s student equality and disadvantaged groups. This updates the progression and attainment trends from 2011/12 to 2015/16. When adjusting for other potential explanatory factors, including pre-entry qualifications, there remained strong evidence that some groups of students had lower rates of progression and attainment. Progression data indicates the progression of undergraduates from year 1 to year 2 of study, and focuses on full-time UCAS/GTTR students taking courses of greater than one year duration. The data analysis relating to undergraduate attainment focuses on fulltime students who have successfully completed their degree programme and received a degree classification of first class, 2:1 ( good degree ), 2:2 or 3rd Class award ( not good degree ). There has been a recent change in methodology to reflect external league tables and NTU s TEF framework (see page 8 for further details). Full details of the methodology used in the analysis of student data are given in Section 2 on page 8. Key Findings Gender There has been a consistent increase in the proportion of new first degree entrants that were female over the last five years. In 2015/16, 56.6% of these UG students were female, compared with 55.9% the previous year. The latest Equality Challenge Unit (ECU) data shows that (in 2014/15), across all UK HEIs, 57.7% of first degree UGs were female. Female students were significantly more likely to successfully progress to their second year of study than male students, which, as previous analysis testified, cannot be solely attributed to students prior attainment. The 2015/16 female/male progression gap was 9.5 percentage points. 2
4 The 2015/16 female/male good degree (1 st Class or 2:1) attainment gap was 5.8 percentage points, which was very similar to the previous year (5.9). The latest ECU published gap for the UK as a whole (for 2014/15) was 4.5 percentage points, which was lower than the NTU gap for that year. Ethnicity The proportion of new graduate entrants that identify as BME peaked at 31.2% in 2012/13. Although the proportion fell in 2014/15 to 26.9% it has risen to 29.6% in 2015/16. According to ECU data, in 2014/15, 21% of UK students identified as BME. In 2015/16 the progression rate for white students was 83.7% and 72.6% for BME students, with progression rates falling slightly for both white and BME students compared with 2014/15. The BME / white attainment gap was 18.5 percentage points. In comparison, according to the latest ECU data (for 2014/15) the ethnicity degree attainment gap in the UK was 15.3 percentage points, which was lower than the NTU gap for that year (17.5 percentage points). Disability There has been a consistent increase in the proportion of NTU s first degree entrants known to have a disability; from 6.7% in 2011/12 to 9.3% in 2015/16. ECU data for 2014/15 indicates 10.6% of UK students disclosed as disabled. Over the five years, there was moderate statistical evidence that disabled students had lower rates of progression when controlling for other entry characteristics. For four of the last five years disabled students were less likely to achieve a good degree than non-disabled students. In 2015/16 the gap was 3.9 percentage points and there is now very strong statistical evidence that disabled students achieved lower rates of good degrees when controlling for pre-entry characteristics (including pre-entry qualifications). Age 2015/16 saw an increase in the proportion of undergraduates aged 21 and over, 14.6%, compared with 2014/15, 13.0% however these figures are both lower than in the three preceding years. Over the five years, mature students were considerably less likely to successfully progress to their second year of study than young students. In 2015/ % of young entrants successfully progressed, compared with 68.8% of mature entrants. The percentage of young finalists achieving good degrees had increased consistently over from 2011/12 to 2014/15. However, in 2015/16 the proportion decreased slightly to 72.2%. Mature students were far less likely to achieve a good degree with 63.1% achieving this in 2015/16. 3
5 Widening Participation There has been a considerable increase in the proportion of NTU s first degree entrants from disadvantaged WP neighbourhoods (based on ACORN classifications) over recent years, rising from 21.9% in 2011/12 to 25.9% in 2015/16. Over the five years, students from widening participation backgrounds were significantly less likely to successfully progress to their second year of UG study than students from higher socio-economic backgrounds. The 2015/16 socio-economic progression gap was 7.5 percentage points, which has increased compared with the previous year. The 2015/16 socio-economic good degree gap was 9.3 percentage points, which was an increase on the previous year. Pre-Entry Qualification Route There has been sustained growth in the number of NTU s first degree entrants entering via the BTEC qualification route (either BTEC-only or a combination of BTEC and A-Levels). 31.5% of 2015/16 new undergraduates came via this route. Over the last five years, students enrolling for NTU courses via the BTEC pre-entry qualification route were significantly less likely to successfully progress to their second year of study than students entering via the A-Level route. The entry route gap appears to be widening with the 2015/16 gap a considerable 20.6 percentage points, the largest gap of the five years. There is strong statistical evidence that BTEC entrants have lower degree classifications than their counterparts who entered via the traditional A-Level route. In 2015/16, 56% of BTEC entrants achieved a good degree compared with 77% of A-Level entrants. However, in 2015/16, nearly 15% of BTEC entrants achieved a First Class award. Overseas Residency The percentage of first degree entrants from overseas increased slightly in 2015/16, with 2.5% from the EU and 7.5% from other overseas territories. The difference in rate of progression between home and overseas students narrowed considerably in 2015/16, with 75% of overseas students progressing compared to 78% of EU students and 81% of home students. Over the five years, overseas students were significantly less likely to achieve a 1 st Class or 2:1 degree than home or EU students. In 2015/16, the good degree attainment gap between home and overseas students was 30.6 percentage points. Religion or Belief There is no evidence that students with any particular religion or belief had lower rates of progression or attainment. 4
6 1.2 Staff Data Summary Section 3 contains equality information and analysis relating to staff employed at the University during the academic year 2015/16 and excludes atypical staff (see page 70 for a definition of atypical staff). Monitoring and reporting focuses on gender, ethnicity, disability, age, and religion and belief. Sexual orientation is also reported on for the first time, focusing on disclosure rates. Each section focuses on a different protected characteristic and includes equality profiles of all staff and is then further broken down to School/Professional Services area, seniority level, and includes equality related analysis of leavers, and staff disciplinaries and grievances. During the staff record replaced the gender field with the legal sex field, of which the possible options are male/female. For the purposes of this report, data from the legal sex field is referred to as gender. Unless otherwise specified, sector data is taken from Equality in higher education: staff statistical report 2016, published by the Equality Challenge Unit 1. This benchmarking data is from the academic year 2014/15 due to ECU s publishing schedule. Key Findings Disclosure The University has seen significant improvement in its disclosure rates. Between 2010/11 and 2015/16 disclosure rates improved to: - Ethnicity: 94.7% (an improvement of 27.7 percentage points) - Disability: 80.0% (an improvement of 28.7 percentage points) - Religion: 77.2% (an improvement of 31.0 percentage points) - Age and Gender remained consistently at 100% The recently introduced monitoring category of sexual orientation has a disclosure rate of 24.5%, an increase of 6.5 percentage points compared with January Gender Women comprised the majority of staff at NTU at 55.4%, slightly higher than the sector average of 54.0% for all HEI s in the UK. The majority of part-time staff were female at 74.6%. Across the sector, in the UK, 67.5% of part-time staff were female. As with previous years, women formed the majority of Professional Services staff in 2015/16 at 57.7%. The only area with males in a majority was Information Systems at 79.3%. The most senior level posts at the University are Senior Executive Posts 2, where males are in the majority at 66.7%. The second most senior level of staff Holders of Senior Posts 3 showed an almost even gender balance at 53.8% male Senior Executive Posts are primarily members of the University Executive Team 3 Holders of Senior Posts are primarily Deans and Directors of large Professional Service areas 5
7 Although still in the minority, female representation in NTU s senior level staff 4 is 39.7%. This is significantly higher than the UK sector average of 29.5%. In terms of senior academic contracts male staff are in the majority across three salary scales: Academic Heads, 60.0%; Heads of Department, 52.3% and Professors, 73.9%. 26.1% of Professors were female, a slight decrease from last year. Although in the minority, female Professors are better represented at NTU than across the sector where 2014/15 HESA figures indicate that female professors comprise 23.1% of all professors in the UK. NTU s gender balance for Heads of Department (52.3% male) compares favourably against the sector average of 65.5% male at this grade. The gender profile of support staff at senior levels is fairly balanced, however at nonsenior levels females are in the majority at 62.3%. Ethnicity 8.3% of UK national staff, who disclosed their ethnicity, were BME. This is an increase from 7.9% last year and compares with a sector England average of 9.6%. Schools with the highest rates of BME staff were the Nottingham Business School (14.0%) and School of Architecture Design and the Built Environment (10.1%). The Schools with the lowest rate of BME staff were Animal, Rural and Environmental Sciences (2.4, an increase from 0.7% last year), and Art and Design (4.2%). The proportion of UK-national BME staff (of those who disclosed their ethnicity) was higher in the Professional Service Areas (8.9%) than across the Schools (7.9%). Disclosure rates for ethnicity were very high for all the senior level staff, many being at 100%. Rates of UK-national BME staff were on average 10.0, an increase from 9.3% last year. 21.1% of UK-national Professors were of BME origin, an increase from 19.2% in 2014/15 and 13.9% in 2013/14. The proportion of UK-national BME Professors at NTU is also much higher than the sector which stands at 7.7%. Proportions of BME staff in senior roles were at their lowest in Holders of Senior Posts (0.0%) and Professional & Managerial posts (3.1%). 8.2% of all staff in non-senior level roles were BME members of staff. The highest rate of BME staff was found in the miscellaneous 5 staff group at 17.0%. 10.6% of all leavers were of BME background (excluding atypical and non-uk nationalities). This is higher than the average employed BME staff of 8.3% (excluding atypical and non-uk nationalities). Of those members of staff who left due to dismissal 18.8% were BME staff, although the total number of dismissals was low at just 16 people, three of whom were BME. A high proportion of BME staff were also seen in those leaving due to the end of a temporary contract at 13.0%. 4 Senior level staff at NTU include: Senior Executive Posts, Holders of Senior Posts, Academic Heads, Heads of Department, Professors, Support Heads and Professional & Managerial support staff. 5 Staff falling within the Miscellaneous group of staff are all on fixed term contracts and primarily employed in assistant roles, e.g. Marketing Assistant, Finance Assistant, Technical Assistant, Student Placement etc. 6
8 Disability 6.4% of those staff who have disclosed their disability status indicated they are disabled, a slight decrease from that of 7.0% in 2014/15. Of those staff who declared their disability across the sector in England, 4.6% declared they were disabled. Rates of declared disability were higher in the Professional Service Areas, at 7.4%, than in the Schools, where they were 5.7%. The most senior posts, namely, Senior Executive Posts and Holders of Senior Posts, had no instances of disabled members of staff. This was also true of Support Heads and Academic Heads. However it is worth noting that the numbers of staff within these groups are small in number, ranging from just 10 Academic Heads to 20 Support Heads. Heads of Department had low instances of disabled staff at just 2.7%. Age Across NTU the largest group of staff were aged 35-49, at 39.7%, followed by the age group, at 32.1%, those aged 34 and under at 26.2% and finally the 65 and overs at just 2.1%. When compared to the proportions of staff employed in each of the age groups there was a disproportionate number of leavers in the 34 and under age group at 40.9% compared to 26.2% employed. Religion and Belief With the exception of sexual orientation, religion is the equality characteristic with the lowest disclosure rate and also the highest rate of staff opting for the prefer not to say option at 6.8%. In comparison the average disclosure rate for institutions in the sector which returned staff data for religion and belief was 41.2%, while NTU s disclosure rate was much higher at 77.2%. The majority of staff who disclosed their religion or belief indicated they had no religion (51.9%). The second largest group are Christian (39.5%). When compared to nationwide census data 6, where religion or belief is known, NTU s religion and belief profile is very different. For example across England and Wales 77.7% of people report as Christian compared to 39.5% of NTU staff; 16.1% of people across England and Wales report as No Religion compared to 51.9% of NTU staff. Sexual Orientation In July 2015 the University began collecting staff data on sexual orientation. In January 2016 the disclosure rate for sexual orientation was 18.0% and as of November 2016 disclosure stands at 24.5%. In comparison, UK institutions which returned data for sexual orientation (many of whom have been collecting data for longer than NTU) had an average disclosure rate of 29.9%. Disclosure rates remain too low to draw conclusions from the data declared by staff. 6 England & Wales 2011 Census. 7
9 Section 2 - Equality Information: Student Data Success of NTU s Equality & Diversity students: 2011/12 to 2015/16 Introduction This report provides an update of the success trends of NTU s students with protected equality & diversity characteristics as well as those from low socio-economic groups for the period 2011/12 to 2015/16. When adjusting for other potential explanatory factors, including pre-entry qualifications, there remains strong evidence that some groups of students had lower rates of progression, attainment and graduate level destinations. These findings are being addressed at School-level via NTU s Success for All initiative. Methodology Unless otherwise stated, the analysis in this report is taken from NTU s COGNOS five year enrolment extract, which is ultimately derived from the same data source as the University s annual monitoring reports provided to Schools. Year one to year two undergraduate progression figures shown throughout this report are shown as simple binary outcomes (progressed or did not progress, excluding the few unknowns removed from the progression calculations), for the sake of brevity of presentation. Students not progressing include: Academic failure students have not met the requirements of the first year and have effectively been withdrawn by the University following referral board decision. These represent about 25% of non-progressors. Repeating students have not met the requirements of the first year but were permitted to repeat their first year of study following referral board decision. These represent about 30% of non-progressors. Withdrawn students have withdrawn through their own volition, (e.g. personal reasons). These represent about 30% of non-progressors. Transfer student has effectively withdrawn from their course although are still in HE having transferred to a different course. These represent about 10% of non-progressors. Other all other reasons. These represent about 6% of non-progressors. The data analysis relating to progression focuses on full-time UCAS/GTTR students taking courses of greater than one year duration. The data analysis relating to undergraduate attainment focuses on full-time students who have successfully completed their degree programme and received a degree classification of first class, 2:1 ( good degree ), 2:2 or 3 rd Class award ( not good degree ). There has been a recent change in methodology to reflect external league tables and NTU s TEF framework. Students with ordinary degrees are now removed from the denominator, which has been reflected across all the years presented. Therefore, attainment gaps differ slightly from previous reporting years because E&D target groups are disproportionately more likely to receive an ordinary degree classification, and thus the gaps tend to be smaller compared with the original methodology. 8
10 Structure of report There are eight main sections to this report; gender, ethnicity, disability, age, widening participation, pre-entry qualification, home/overseas residency and religion or belief. Within each section, enrolment 7, progression and attainment outcomes are reported. In all sections, except for home/overseas residency, progression and attainment figures exclude overseas students so as to reduce potential bias in the data. However, to reflect the whole NTU student body, enrolment tables include overseas students. An at a glance summary of student success trends across the student lifecycle is provided in Table A on page 3 (overseas students are again excluded from the denominator for the E&D groupings, although shown separately at the foot of the table). This table provides statistical evidence of any disparities between different student groups after adjusting for known influencing factors, including pre-entry qualifications, E&D / WP characteristics and NTU School. In previous versions of this report, applications and admissions data was also included. However, a separate more in-depth piece of research into unconscious bias in admissions has been undertaken and a separate paper issued to the Equality, Diversity and Inclusion Advisory Group and so the information has not been included in this report. 7 There are two main tables in each enrolment sub-section. The first table focuses on new undergraduate first degree entrants (and thus excludes repeating students) and is consistent with the University s annual monitoring reports. The second table focuses on the whole student body, including postgraduate and further education students. 9
11 Table A: Summary of student success by E&D / WP characteristics: full-time undergraduates 2011/12 to 2015/16 Summary of student success by E&D / socio-economic characteristics: full-time undergraduates 2011/12 to 2015/16: All NTU E&D Group Progressing to year 2 Progressing to year 3 Attaining at least 2:1 Study or prof/m'gerial occs# Denominator % progressed Denominator % progressed Denominator % good degree Denominator % study or prof Male (UK domiciled) 15, % 13, % 10, % 7, % Female (UK) 18, % 16, % 14, % 9, % Gender gap 7.5% points*** 5.1% points*** 6.4% points*** -7.0% points*** BME (UK domiciled) 8, % 6, % 5, % 3, % White (UK) 25, % 22, % 19, % 12, % Ethnicity gap 9.5% points*** 5.7% points*** 17.8% points*** 4.6% points* Disabled (UK) 3, % 2, % 2, % 1, % Not disabled (UK) 31, % 26, % 22, % 14, % Disability gap 3.3% points* 4.8% points*** 2.9% points*** 1.9% points Mature (UK) 3, % 3, % 2, % 1, % Young (UK) 30, % 26, % 22, % 14, % Age gap 12.1% points 11.0% points*** 7.0% points -1.8% points*** WP (young, UK) 7, % 6, % 4, % 2, % Not WP (young, UK) 22, % 20, % 17, % 11, % Socio-econ gap 7.2% points*** 4.1% points*** 9.3% points*** 7.6% points*** Other route 3, % 2, % 1, % % BTEC + A-Level route 3, % 2, % 1, % % BTEC route## (UK) 4, % 2, % 1, % % A Level route (UK) 21, % 16, % 10, % 6, % Qual route gap 17.0% points*** 6.4% points*** 18.9% points*** 9.3% points EU % % % N/A N/A Overseas 2, % 2, % % N/A N/A Home 34, % 29, % 17, % N/A N/A Residency gap 10.4% points*** 13.2% points*** 35.4% points*** N/A N/A *Moderate statistical significance p<0.05; **Strong statistical significance p<0.01; ***Very strong statistical significance p< These tests control (via regression) for other known influencers of student success, including pre-entry qualifcations (UG classification for DLHE), NTU School differences and students' E&D characterisitcs # Based on DLHE surveys 2011/12 to 2014/15. Only includes students who graduated with an undergraduate degree qualifcation. ## BTEC qualfications were only available in Banner student records for new entrants from the 2011/12 academic year due to disclosure issues. Therefore, final degree outcomes are only availalbe for 2013/14 to 2015/16 graduates, whilst DLHE destinations data only available for 2013/14 and 2014/15 graduates. Only these years' data for A Level entrants have been included to maintain consistency. 10
12 1: Gender 1.1: Enrolments Table 1.1.1: NTU first degree UG new entrants by gender, 2011/12 to 2015/ / / / / /16 No. % No. % No. % No. % No. % Female 3, % 3, % 3, % 4, % 4, % Male 3, % 2, % 3, % 3, % 3, % Unknown Total 7, % 6, % 6, % 7, % 7, % There has been a consistent increase in the proportion of new first degree entrants that were female over the last five years. In 2015/16, 56.6% of these UG students were female, compared with 55.9% the previous year. The latest Equality Challenge Unit (ECU) data shows that (in 2014/15), across all UK HEIs, 57.7% of first degree UGs were female. Table 1.1.2: All 2015/16 NTU students by gender Female Male Total Programme Level Mode No. % No. % No. % FE Full-Time % % % Part-Time % % % FE Total % % % NC Full-Time % % % Part-Time % % % NC Total % % % PG Full-Time 1, % % 2, % Part-Time 1, % % 1, % PG Total 2, % 1, % 3, % PR Full-Time % % % Part-Time % % % PR Total % % % UG Full-Time 13, % 10, % 23, % Part-Time % % % UG Total 13, % 10, % 23, % Grand Total 16, % 12, % 29, % *Excludes 19 students for whom the gender is not known When focusing on the whole student body, around 57% of NTU s 2015/16 students were female. 11
13 1.2: Progression from year 1 of undergraduate study Figure 1.2.1: Progression to second year of study by gender 90% % of UG students progressing to year 2 85% 80% 75% 70% 2011/ / / / /16 Male 82.4% 79.7% 77.5% 79.0% 75.5% Female 89.0% 86.9% 86.0% 85.0% 85.0% p<0.001 Over the period analysed, female students were significantly more likely to successfully progress to their second year of study than male students, which, as previous analysis testified, cannot be solely attributed to students prior attainment. The 2015/16 female/male progression gap was 9.5 percentage points. The methodology for progression figures used by HESA differs to that used by NTU. Therefore, direct comparisons cannot be made with sector figures, although the national data indicate a similar trend of male students being less likely to successfully progress through their course. 12
14 1.3: Undergraduate attainment Figure 1.3.1a: Undergraduate attainment by gender good degrees P<0.001 % of UG finalists achieving 2:1 or First Class award 80% 75% 70% 65% 60% 55% 50% 2011/ / / / /16 Male 62.0% 64.5% 68.0% 70.4% 68.3% Female 67.5% 72.1% 74.9% 76.3% 74.1% Figure 1.3.1b: Undergraduate attainment by gender all degree classifications 100% 90% 80% 70% 60% 50% 40% 30% 20% 10% 0% 2011/ / / / / / / / / /16 Male Female 3rd Class Honours 5.0% 3.5% 3.6% 3.4% 4.8% 3.0% 2.3% 2.4% 2.0% 2.7% 2nd Class Honours-2nd Division 33.0% 32.1% 28.5% 26.3% 27.0% 29.5% 25.6% 22.8% 21.7% 23.2% 2nd Class Honours-1st Division 49.2% 48.1% 50.2% 48.3% 48.5% 54.4% 54.0% 53.7% 52.7% 50.1% 1st Class Honours 12.9% 16.3% 17.7% 22.1% 19.8% 13.1% 18.1% 21.2% 23.6% 24.0% 13
15 Male students have consistently been less likely to achieve a First Class or 2:1 degree classification than their female counterparts. Supplementary analysis (Table A, page 3) shows that whilst, on average, females had higher pre-entry qualifications than males, this only partially explains the disparities in the final degree classifications, because, when controlling for the UCAS tariff, females continued to outperform males. The 2015/16 female/male good degree (1 st Class or 2:1) attainment gap was 5.8 percentage points, which was very similar to the previous year (5.9%). The latest ECU published gap for the UK as a whole (for 2014/15) was 4.5 percentage points, which was lower than the NTU gap for that year. 2: Ethnicity 2.1: Enrolments Table 2.1.1: NTU first degree UG new entrants by ethnicity, 2011/12 to 2015/ / / / / /16 No. % No. % No. % No. % No. % Asian % % % % % Black % % % % % Chinese % % % % % Mixed ethnicity % % % % % Other ethnicity % % % % % BME 1, % 1, % 1, % 2, % 2, % White 5, % 4, % 4, % 5, % 5, % Unknown Total 7, % 6, % 6, % 7, % 7, % The proportion of new undergraduate entrants that were BME peaked in 2012/13 at 31.2%. Although the proportion fell to 26.9% in 2014/15, it has since risen to 29.6% in 2015/16. According to ECU data, in 2014/15, 21% of UK students identified as BME. Table 2.1.2: All 2015/16 NTU students by ethnicity BME White Total Programme Level Mode No. % No. % No. % FE Full-Time 4 2.1% % % Part-Time 0.0% % % FE Total 4 2.0% % % NC Full-Time % % % Part-Time % % % NC Total % % % PG Full-Time % % % Part-Time % % % PG Total % % % PR Full-Time % % % Part-Time % % % PR Total % % % UG Full-Time % % % Part-Time % % % UG Total % % % Grand Total % % % *Excludes 197 students for whom the ethnicity is not known 14
16 When taking account of all 2015/16 NTU students, 29.7% were BME. BME students were particularly well represented across full-time postgraduate research and postgraduate taught courses. 2.2: Progression from year 1 of undergraduate study Figure 2.2.1: Progression to second year of study by ethnic group 100.0% % of UG students progressing to year % 90.0% 85.0% 80.0% 75.0% 70.0% 65.0% 2011/ / / / /16 Asian 79.5% 77.4% 71.9% 75.6% 71.8% Black 79.1% 76.3% 74.2% 71.1% 72.2% Chinese 95.8% 90.5% 82.9% 84.4% 81.1% Mixed ethnicity 82.6% 78.5% 76.8% 77.9% 74.5% White 87.5% 85.7% 84.8% 84.8% 83.7% BME 80.6% 77.4% 74.2% 74.7% 72.6% p = <0.001 Over the five years, white students were significantly more likely to successfully progress to their second year of study than black, Asian and mixed ethnicity students. BME students, on average, had lower pre-entry qualifications than their white counterparts, but there was a disparity in progression rates even when adjusting for this prior attainment (Table A, page 3). In 2015/16, the progression rate for white students was 83.7% compared with 72.6% for BME students. The methodology for progression figures used by HESA differs to that used by NTU. Therefore, direct comparisons cannot be made with sector figures, although the national data indicate a similar trend of BME students being less likely to successfully progress through their course. 15
17 2.3: Undergraduate attainment Figure 2.3.1a: Undergraduate attainment by ethnic group good degrees % of UG finalists achieving 2:1 or First Class award 80.0% 70.0% 60.0% 50.0% 40.0% 30.0% 2011/ / / / /16 Asian 51.1% 51.9% 60.6% 62.5% 56.0% Black 46.3% 51.0% 48.7% 52.8% 52.2% Chinese 42.5% 41.7% 55.3% 64.1% 54.3% Mixed ethnicity 69.4% 64.1% 68.8% 68.3% 69.4% White 68.6% 73.1% 75.5% 77.6% 75.8% BME 52.6% 53.1% 58.8% 60.1% 57.3% P<0.001 Figure 2.3.1b: Undergraduate attainment by ethnic group all degree classifications 100% 90% 80% 70% 60% 50% 40% 30% 20% 10% 0% 2011/ / / / / / / / / /16 BME White 3rd Class Honours 5.9% 4.7% 4.0% 5.1% 6.9% 3.3% 2.3% 2.6% 1.9% 2.6% 2nd Class Honours-2nd Division 41.5% 42.2% 37.2% 34.8% 35.8% 28.1% 24.6% 21.9% 20.5% 21.6% 2nd Class Honours-1st Division 45.8% 44.9% 48.3% 47.8% 45.8% 53.9% 53.1% 53.3% 51.6% 50.5% 1st Class Honours 6.8% 8.2% 10.5% 12.2% 11.5% 14.7% 20.0% 22.2% 26.0% 25.3% 16
18 Black, Asian and Chinese students have been consistently less likely to achieve a 1st Class or 2:1 degree classification than their white counterparts. In 2015/16, 52% of black students achieved a good degree, compared with 56% of Asian, 54% of Chinese, 69% of mixed ethnicity and 76% of white students respectively. The BME / white attainment gap was 18.5 percentage points. In comparison, according to the latest ECU data (for 2014/15) the ethnicity degree attainment gap in the UK was 15.3 percentage points, which was lower than the NTU gap for that year (17.5 percentage points). 3: Disability 3.1: Enrolments Table 3.1.1: NTU first degree UG new entrants by disability, 2011/12 to 2015/ / / / / /16 No. % No. % No. % No. % No. % Disabled % % % % % Not-disabled 6, % 5, % 6, % 6, % 6, % Unknown Total 7, % 6, % 6, % 7, % 7, % There has been a consistent increase in the proportion of NTU s first degree entrants known to have a disability over recent years; from 6.7% in 2011/12 to 9.3% in 2015/16. According to ECU data, in 2014/15, 10.6% of UK students disclosed as disabled. Table 3.1.2: All 2015/16 NTU students by disability Disabled Not-disabled Total Programme Level Mode No. % No. % No. % FE Full-Time % % % Part-Time 0.0% % % FE Total % % % NC Full-Time 6 7.7% % % Part-Time % % % NC Total % % % PG Full-Time % 1, % 2, % Part-Time % 1, % 1, % PG Total % 3, % 3, % PR Full-Time % % % Part-Time % % % PR Total % % % UG Full-Time 2, % 20, % 23, % Part-Time % % % UG Total 2, % 21, % 23, % Grand Total 3, % 26, % 29, % *Excludes 33 students for whom the disability is not known Around 10% of the 2015/16 NTU student body were known to have a disability. Disabled students were particularly well represented across NTU s full-time further education courses. 17
19 3.2: Progression from year 1 of undergraduate study Figure 3.2.1: Progression to second year of study by disability % of UG students progressing to year 2 90% 85% 80% 75% 70% 2011/ / / / /16 Disabled 83.5% 81.1% 77.8% 79.8% 78.5% Not disabled 86.2% 83.8% 82.6% 82.6% 81.2% 0.01<p>0.05 After a dip in the progression rates of disabled students over the previous two years, there was an increase in 2014/15 followed by a slight decline in 2015/16 to 78.5%. Over the five years, there was moderate statistical evidence that disabled students had lower rates of progression when controlling for other entry characteristics. The methodology for progression figures used by HESA differs to that used by NTU. Therefore, direct comparisons cannot be made with sector figures, although, consistent with NTU trends, national data indicate that disabled students are slightly less likely than non-disabled students to successfully progress through their course. 18
20 3.3: Undergraduate attainment Figure 3.3.1a: Undergraduate attainment by disability good degrees % of UG finalists achieving 2:1 or First Class award 80% 75% 70% 65% 60% 55% 2011/ / / / /16 Disabled 68.3% 63.0% 69.3% 68.6% 68.3% Not disabled 64.9% 69.3% 72.2% 74.3% 72.2% P<0.001 Figure 3.3.1b: Undergraduate attainment by disability all degree classifications 100% 90% 80% 70% 60% 50% 40% 30% 20% 10% 0% 2011/ / / / / / / / / /16 Disabled Not disabled 3rd Class Honours 5.6% 3.1% 5.0% 4.0% 6.0% 3.7% 2.8% 2.7% 2.5% 3.2% 2nd Class Honours-2nd Division 26.1% 33.9% 25.8% 27.5% 25.7% 31.4% 28.0% 25.2% 23.3% 24.6% 2nd Class Honours-1st Division 55.1% 47.3% 48.3% 47.3% 46.5% 51.9% 51.8% 52.6% 51.2% 49.8% 1st Class Honours 13.2% 15.7% 20.9% 21.3% 21.8% 13.0% 17.5% 19.5% 23.1% 22.3% For four of the last five years disabled students were less likely to achieve a good degree than non-disabled students. In 2015/16 the gap was 3.9 percentage points and there is now very strong statistical evidence that disabled students achieved lower rates of good degrees when controlling for pre-entry characteristics (including pre-entry qualifications). The latest ECU data (for 2014/15) show a UK gap of 1.6 percentage points which is lower than the NTU gap (5.7 percentage points) for that year. 19
21 4: Age 4.1: Enrolments Table 4.1.1: NTU first degree UG new entrants by age group, 2011/12 to 2015/ / / / / /16 No. % No. % No. % No. % No. % Mature 1, % 1, % 1, % % 1, % Young 6, % 5, % 5, % 6, % 6, % Total 7, % 6, % 6, % 7, % 7, % 2015/16 saw an increase in the number and proportion of undergraduate entrants aged 21 and over. Table 4.1.2: All 2015/16 NTU students by age group Mature Young Total Programme Level Mode No. % No. % No. % FE Full-Time % % % Part-Time % 0.0% % FE Total % % % NC Full-Time % % % Part-Time % % % NC Total % % % PG Full-Time 2, % % 2, % Part-Time 1, % 4 0.2% 1, % PG Total 3, % % 3, % PR Full-Time % 0.0% % Part-Time % 2 0.5% % PR Total % 2 0.3% % UG Full-Time 3, % 20, % 23, % Part-Time % % % UG Total 3, % 20, % 23, % Grand Total 8, % 20, % 29, % Around 30% of the NTU student body in 2015/16 were aged 21 and over on entry. As would be expected, this includes almost all postgraduates and the vast majority of noncredit bearing courses. 20
22 4.2: Progression from year 1 of undergraduate study Figure 4.2.1: Progression to second year of study by age % of UG students progressing to year 2 90% 85% 80% 75% 70% 65% 60% 2011/ / / / /16 Mature 77.1% 71.0% 71.7% 71.7% 68.8% Young 86.9% 85.2% 83.4% 83.5% 82.3% p>0.05 Over the five years, mature students were considerably less likely to successfully progress to their second year of study than young students. In 2015/ % of young entrants successfully progressed, compared with 68.8% of mature entrants. Due to very different entry profiles of mature and young students (hence no statistical evidence of any disparities when controlling for entry characteristics including pre-entry tariff) NTU have not set OFFA progression targets, although will continue to monitor the progress of mature students. The methodology for progression figures used by HESA differs to that used by NTU. Therefore, direct comparisons cannot be made with sector figures, although, consistent with NTU trends, national data indicate that mature students are considerably less likely than young students to successfully progress through their course. 21
23 4.3: Undergraduate attainment Figure 4.3.1a Undergraduate attainment by age group good degrees % of UG finalists achieving 2:1 or First Class award 80% 75% 70% 65% 60% 55% 2011/ / / / /16 Mature 66.2% 64.6% 62.9% 62.8% 63.1% Young 65.0% 69.1% 73.0% 75.1% 72.7% Figure 4.3.1b Undergraduate attainment by age group all degree classifications 100% 90% 80% 70% 60% 50% 40% 30% 20% 10% 0% 2011/ / / / / / / / / /16 Mature Young 3rd Class Honours 7.1% 4.3% 6.2% 6.1% 7.4% 3.5% 2.6% 2.5% 2.2% 3.1% 2nd Class Honours-2nd Division 26.7% 31.1% 31.3% 31.4% 29.8% 31.5% 28.2% 24.5% 22.7% 24.2% 2nd Class Honours-1st Division 47.2% 46.2% 42.6% 41.6% 41.0% 52.6% 51.9% 53.4% 51.9% 50.4% 1st Class Honours 19.0% 18.4% 19.9% 20.9% 21.9% 12.4% 17.2% 19.6% 23.2% 22.3% 22
24 The percentage of young finalists achieving good degrees had increased consistently over from 2011/12 to 2014/15. However, in 2015/16 the proportion decreased slightly to 72.2%. Mature students were far less likely to achieve a good degree with 63.1% achieving this in 2015/16. According to ECU data, the latest UK-wide gap (in 2014/15) was 9.2 percentage points, which was lower than the NTU gap of 12.3 percentage points for that year. 5: Widening Participation 5.1: Enrolments Table 5.1.1: NTU first degree UG new entrants by widening participation status, 2011/12 to 2015/ / / / / /16 No. % No. % No. % No. % No. % Not WP 4, % 3, % 4, % 4, % 4, % WP 1, % 1, % 1, % 1, % 1, % Unknown Total 5, % 4, % 5, % 6, % 5, % There has been a considerable increase in the proportion of NTU s first degree entrants from disadvantaged WP neighbourhoods (based on ACORN classifications) over recent years, rising from 21.9% in 2011/12 to 25.9% in 2015/16. Table 5.1.2: All 2015/16 NTU students by widening participation status 9 Not-WP WP Total Programme Level No. % No. % No. % FE % % % UG 13, % 4, % 18, % Grand Total 14, % 4, % 18, % 25% of NTU s young home 2015/16 students were from deprived WP neighbourhoods. WP students were particularly well represented across FE courses. 8 Excludes overseas students and mature students as these fall outside of the WP remit. 9 Excludes overseas students and mature students as these fall outside of the WP remit. 23
25 5.2: Progression from year 1 of undergraduate study Figure 5.2.1: Progression to second year of study by socio-economic group % of UG students progressing to year 2 90% 85% 80% 75% P< % 2011/ / / / /16 WP 81.7% 79.2% 77.2% 79.8% 76.9% Not WP 88.5% 87.3% 85.5% 84.7% 84.4% Over the five years, students from widening participation backgrounds were significantly less likely to successfully progress to their second year of UG study than students from higher socio-economic backgrounds, which held when controlling for entry characteristics. The 2015/16 socio-economic progression gap was 7.5 percentage points, which has increased compared with the previous year. The methodology for progression figures used by HESA differs to that used by NTU. Therefore, direct comparisons cannot be made with sector figures, although, consistent with NTU trends, national data indicate that students from low socio-economic backgrounds are less likely than their more advantaged counterparts to successfully progress through their course. 24
26 5.3: Undergraduate attainment Figure 5.3.1a Undergraduate attainment by socio-economic group good degrees 80% % of UG finalists achieving 2:1 or First Class award 75% 70% 65% 60% 55% 50% 2011/ / / / /16 WP 57.9% 61.2% 65.2% 68.3% 65.5% Not WP 66.9% 71.2% 75.0% 77.0% 74.8% P=<0.001 Figure 5.3.1b Undergraduate attainment by socio-economic group all degree classifications 100% 90% 80% 70% 60% 50% 40% 30% 20% 10% 0% 2011/ / / / / / / / / /16 WP Not WP 3rd Class Honours 4.6% 3.8% 2.9% 3.7% 4.6% 3.2% 2.4% 2.3% 1.7% 2.7% 2nd Class Honours-2nd Division 37.5% 35.1% 31.9% 28.0% 29.8% 29.9% 26.5% 22.6% 21.2% 22.4% 2nd Class Honours-1st Division 47.2% 48.0% 49.2% 49.8% 50.7% 54.1% 53.0% 54.4% 52.5% 50.3% 1st Class Honours 10.7% 13.2% 15.9% 18.5% 14.8% 12.8% 18.2% 20.6% 24.5% 24.6% 25
27 Over the five years, students from low socio-economic backgrounds were consistently less likely to achieve a 1 st Class or 2:1 degree than students from higher socio-economic backgrounds, which held when controlling for entry characteristics (including pre-entry qualifications see Table A, page 3). The 2015/16 socio-economic good degree gap was 9.3 percentage points, which was an increase on the previous year. It is not possible to compare this with national trends to due to lack of comparable data. 6: Pre-entry qualification route Whilst the pre-entry qualification route is not directly related to equality & diversity, certain E&D groups (notably male, BME and low socio-economic groups) disproportionately came to study undergraduate degrees at NTU via the BTEC qualification route. Through the Trent Institute for Learning & Teaching (TILT) BTEC Champions Group, NTU are seeking to narrow the student success gap between BTEC entrants and their A-Level counterparts. As BTEC entrants are disproportionately students that have lower rates of progression and attainment, pre-entry qualification route is included in this report as the success of BTEC entrants is inextricably linked with the success for all agenda. 6.1: Enrolments Table 6.1.1: NTU first degree UG new entrants by pre-entry qualification route, 2011/12 to 2015/ / / / / /16 No. % No. % No. % No. % No. % A-levels only 4, % 3, % 3, % 4, % 3, % BTEC only % % % % 1, % BTEC and A-levels % % % % 1, % Other qual types % % 1, % 1, % % Total 6, % 5, % 6, % 7, % 6, % There has been sustained growth in the number of NTU s first degree entrants entering via the BTEC qualification route. When including the combination of BTEC and A-Levels (typically a BTEC National Diploma equivalent to two A-Levels plus one A-Level) and BTEC only (typically a BTEC Extended Diploma equivalent to three A-Levels), 31.5% of 2015/16 new undergraduates came via this route. 10 Excludes overseas students as international qualifications are not available through the UCAS star j data file. 26
28 6.2: Progression from year 1 of undergraduate study Figure 6.2.1: Progression to second year of study by pre-entry qualification route P<0.001 % of UG students progressing to year 2 95% 90% 85% 80% 75% 70% 65% 60% 2011/ / / / /16 BTEC entrants 75.3% 73.1% 72.2% 70.3% 67.1% A Level entrants 90.0% 88.9% 86.8% 87.2% 87.7% Over the last five years, students enrolling for NTU courses via the BTEC pre-entry qualification route were significantly less likely to successfully progress to their second year of study than students entering via the A-Level route. The entry route gap appears to be widening with the 2015/16 gap a considerable 20.6 percentage points, the largest gap of the five years. It is not possible to compare this with national trends to due to lack of comparable data. 6.3: Undergraduate attainment Figure 6.3.1a Undergraduate attainment by pre-entry qualification route good degrees % of UG finalists achieving 2:1 or First Class award 80% 75% 70% 65% 60% 55% 50% 45% 2013/ / /16 BTEC entrants 55.1% 62.9% 56.1% A Level entrants 75.6% 77.9% 77.0% P<
29 Figure 6.3.1b Undergraduate attainment by pre-entry qualification route all degree classifications 100% 90% 80% 70% 60% 50% 40% 30% 20% 10% 0% 2013/ / / / / /16 BTEC entrants A Level entrants 3rd Class Honours 4.6% 5.2% 7.8% 2.1% 1.7% 2.4% 2nd Class Honours-2nd Division 40.3% 31.9% 36.1% 22.3% 20.4% 20.7% 2nd Class Honours-1st Division 42.3% 49.5% 41.4% 54.7% 52.9% 52.1% 1st Class Honours 12.8% 13.4% 14.7% 20.9% 25.0% 24.8% Although data are only on final degree classifications for three years (as BTEC qualification information was only available for 2011/12 entrants and beyond), there is strong statistical evidence that BTEC entrants have lower degree classifications than their counterparts who entered via the traditional A-Level route. In 2015/16, 56% of BTEC entrants achieved a good degree compared with 77% of A-Level entrants. It should be noted that these are average figures and many BTEC entrants achieve outstanding results. Indeed, in 2015/16, nearly 15% of BTEC entrants achieved a First Class award. 7 Home/Overseas Residency 7.1 NTU enrolments Table 7.1.1: NTU first degree UG new entrants by residency, 2011/12 to 2015/ / / / / /16 No. % No. % No. % No. % No. % EU % % % % % HOME 6, % 5, % 6, % 7, % 6, % OVERSEAS % % % % % Total 7, % 6, % 6, % 7, % 7, % The number and percentage of first degree entrants from overseas increased slightly in 2015/16, with 2.5% from the EU and 7.5% from other overseas territories. 28
30 Table 7.1.2: All 2015/16 NTU students by residency EU HOME OVERSEAS Total Programme Level No. % No. % No. % No. % FE 0.0% % 0.0% % NC % % % % PG % 2, % 1, % 3, % PR % % % % UG % 21, % 1, % 23, % Grand Total 1, % 24, % 3, % 29, % *Excludes 23 students for whom the residency is not known In 2015/16, 3.6% of the whole NTU student body were from the EU, whilst 10.6% were from other overseas territories. Overseas students were particularly well represented amongst postgraduate research and postgraduate taught courses. 7.2: Progression from year 1 of undergraduate study Figure Progression to second year of study by residency % of UG students progressing to year 2 90% 85% 80% 75% 70% 65% 60% 2011/ / / / /16 EU 79.3% 85.1% 78.1% 84.5% 78.4% Home 85.9% 83.6% 82.1% 82.4% 80.9% Overseas 80.1% 65.5% 72.2% 69.4% 74.9% P=<0.001 Overseas students have consistently had lower rates of progression than home students, although the difference did narrow considerably in 2015/16, with 75% of overseas students progressing compared with 78% of EU students and 81% of home students. It is not possible to compare this with national trends to due to lack of comparable data. 29
31 7.3: Undergraduate attainment Figure 7.3.1a Undergraduate attainment by residency good degrees % of UG finalists achieving 2:1 or First Class award 80% 70% 60% 50% 40% 30% 20% 2011/ / / / /16 EU 65.7% 78.9% 67.8% 71.3% 70.1% Home 65.1% 68.7% 71.9% 73.7% 71.7% Overseas 29.2% 36.7% 30.7% 36.9% 41.1% Home v overseas p<0.001 Figure 7.3.1b Undergraduate attainment by residency all degree classifications 100% 90% 80% 70% 60% 50% 40% 30% 20% 10% 0% 2011/ / / / / / / / / /16 Overseas (excluding EU) Home 3rd Class Honours 14.9% 19.9% 17.4% 15.5% 14.2% 3.8% 2.8% 2.9% 2.6% 3.6% 2nd Class Honours-2nd Division 56.3% 43.4% 52.7% 48.4% 45.4% 31.1% 28.5% 25.2% 23.7% 24.7% 2nd Class Honours-1st Division 24.5% 32.1% 24.9% 30.4% 31.2% 52.1% 51.4% 52.2% 50.8% 49.4% 1st Class Honours 4.3% 4.6% 5.1% 5.7% 9.1% 13.0% 17.3% 19.7% 22.9% 22.2% 30
32 Over the five years, overseas students were significantly less likely to achieve a 1 st Class or 2:1 degree than home or EU students. In 2015/16, the good degree attainment gap between home and overseas students was 30.6 percentage points. Moreover, 9% of overseas students achieved a First Class degree classifications, compared with 22% of home students, although the gap did narrow slightly in 2015/16. It is not possible to compare this with national trends to due to lack of comparable data. 8: Religion or belief Data on student religion or belief is available for 2015/16. Religion is closely linked to ethnicity and statistical tests show that when you take ethnicity into account there is no evidence that students with any particular religion or belief had lower rates of progression or attainment. The progression and attainment data has been included below for completeness sake. 8.1: Enrolments Table 8.1.1: NTU first degree UG new entrants by religion or belief, 2015/ /16 No. % Buddhist % Christian 2, % Hindu % Jewish % Muslim % No religion or belief 3, % Sikh % Spiritual % Any other religion or belief % Unknown 290 Grand Total 7, % 52.6% of new first degree entrants had no religion or belief in 2015/16. The most popular student religion was Christianity (29.8%), followed by Islam (5.8%). Table All 2015/16 NTU students by religion or belief Programme Buddhist Christian Hindu Jewish Muslim No religion Sikh Spiritual ny other religion Total Level No. % No. % No. % No. % No. % No. % No. % No. % No. % No. % FE 1 0.6% % 0.0% 0.0% 1 0.6% % 0.0% 3 1.7% 0.0% % NC 8 1.9% % 8 1.9% 0.0% % % 4 1.0% 4 1.0% 4 1.0% % PG % 1, % % 7 0.2% % 1, % % % % 3, % PR % % % 3 0.4% % % 3 0.4% 5 0.7% 7 1.0% % UG % 6, % % % 1, % 12, % % % % 21, % Grand Total % 8, % % % 1, % 14, % % % % 26, % *Excludes 2,867 students for whom religion or belief is not known 31
33 8.2: Progression from year 1 of undergraduate study Figure 8.2.1: Progression to second year of study by religion 100% 90% 80% 70% 60% 50% 40% 30% 20% 10% 0% % of students progressing to second year of study Buddhist Christian Hindu Jewish Muslim Sikh Spiritual Any other religion or belief % of 2015/16 students progressing to second year of study NTU average No religion or belief 8.3: Undergraduate attainment Figure 8.3.1a: Undergraduate attainment by religion good degrees 80% % of UG finalists achieving 2:1 or First Class award 70% 60% 50% 40% 30% 20% 10% 0% Buddhist Christian Hindu Jewish Muslim Sikh Spiritual Any other religion or belief % of 2015/16 students achieving 2:1 or First Class award NTU average No religion or belief 32
34 Figure 8.3.1b: Undergraduate attainment by religion all degree classifications 100% 90% 80% 70% 60% 50% 40% 30% 20% 10% 0% Buddhist Christian Hindu Jewish Muslim Sikh Spiritual Any No other religion religion or belief or belief 3rd Class Honours 15.8% 2.8% 7.5% 7.7% 10.1% 6.8% 7.0% 3.8% 3.8% 4.8% Prefer not to say 2nd Class Honours-2nd Division 36.8% 27.8% 32.7% 36.5% 47.6% 37.5% 32.6% 26.4% 23.7% 24.2% 2nd Class Honours-1st Division 34.2% 48.6% 46.7% 38.5% 35.2% 43.2% 32.6% 54.7% 48.8% 43.5% 1st Class Honours 13.2% 20.9% 13.1% 17.3% 6.6% 12.5% 27.9% 15.1% 23.6% 27.4% Report prepared by Laura Hope Schools, Colleges & Community Outreach December
35 Section 3 - Equality Information: Staff Data This section of the annual report contains equality information relating to staff employed at the University during the academic year 2015 to 2016 (1 August 2015 to 31 July 2016). Monitoring and reporting focuses on gender, ethnicity, disability, age, and religion and belief. This year we have also included disclosure rates for sexual orientation for the first time, having begun monitoring staff sexual orientation in July All employee profiles cover staff employed during the 2015/16 academic year but exclude staff on atypical contracts. See page 70 for a definition of atypical staff. Staff numbers are reported by headcount. Unless otherwise specified, sector data is taken from Equality in higher education: staff statistical report 2016, published by the Equality Challenge Unit 11. This benchmarking data is from the academic year 2014/15 due to ECU s publishing schedule


36 3.1 Gender Figure Women comprised the majority of staff at NTU at 55.4%, the same as in 2014/15. The NTU profile is slightly higher than the sector average of 54.0% for all HEI s in the UK. Figure Full time staff were split equally between the sexes with 49.5% of full time staff being female, this compares with the UK sector average of 47.5% of full time staff being female. The majority of part time staff were female at 74.6%. Across the sector, in the UK, 67.5% of part-time staff were female. Hourly Paid Lecturers were gender balanced with 50.1% being female. 35

37 Figure As with previous years, women comprised the majority of staff working in College-level roles with the proportion of female staff being 76.4% in the College of Art, Design and Built Environment, 78.3% in the College of Business, Law and Social Sciences, and 80.7% in the College of Science and Technology. This can be attributed to the majority of staff in these areas working in administration roles, which are, both traditionally and at NTU, dominated by female staff. 36
38 Men made up the majority of staff in the School of Architecture, Design and the Built Environment at 69.0%. Although it is difficult to make exact comparisons with the sector, due to some difficulties aligning categories of subject areas with HESA, an indication of how NTU compare with the sector can be found by looking at the figure for the area of Architecture, Built Environment and Planning which finds 67.3% of academic staff working in this area to be male. Men also comprised the clear majority of staff in the School of Science and Technology at 66.2%. In comparison, the male proportion of all academic staff in SET (Science, Engineering and Technology) in the sector was 58.8%. Women made up the clear majority of staff in the School of Education at 70.4%. The UK sector average for academic female staff in the area of education was 66.0%. Women were also in a clear majority in the Nottingham Law School at 65.2% (sector average 50.2%) and in the School of Animal, Rural and Environmental Sciences at 62.4%. The proportion of women in the School of Art & Design was also higher than that of men at 57.2% (sector average 49.4%). 37

39 Figure Owing to changes in department structures, the ability to compare with last year s profile of staff in Professional Services is limited. As with previous years, women formed the majority of Professional Services staff in 2015/16 at 57.7% overall. The only area with men in a large majority was Information Systems at 79.3%. 12 Some areas have been combined owing to small numbers, or to align with past reporting. Combined areas are as follows: Admissions, Marketing, International and Engagement contains: Admissions, Digital Marketing and Creative Services, International, Marketing and Reputational Management, PVC Employer & Economic Engagement and PVC International. Sport contains: County Sports Depts and University Sports Activities. Combinations owing to small numbers are indicated with a slash (/). 38
, and Admission, Marketing, International and Engagement (70.5%). Areas with similar proportions of male and female staff were Sports at 53.")
40 Areas with women in a large majority were Student Support Services (PVC Student Affairs) (78.6%), Human Resources (75.8%), the combined areas of Academic Registry / PVC Academic / PVC Research (69.7%), and Admission, Marketing, International and Engagement (70.5%). Areas with similar proportions of male and female staff were Sports at 53.1% male, and Estates with male staff in a slight minority at 48.3%. The newly formed Campus Services 13 which has been disaggregated from Estates and Resources in 2015/16 is almost exactly gender-balanced. Figure Figure splits the senior-level staff (as defined by the Equality and Diversity Team for the purposes of reporting) into Senior Posts, Academic contracts and those under Support / Professional Services contracts. The Figure also attempts to list the scale names within these broader groups in descending order of Salary band, although this is based on averages salaries only. The most senior level posts at the University are Senior Executive Posts 14 and these have a male majority of 66.7%, an improvement on the previous year when it was 70.0%. Holders of Senior Posts 15 showed an almost even gender balance (53.8% male). 13 This department includes Security, Reception, Catering Services, Student Accommodation Services, Nottingham Conference Centre, Postal Services, and Car Parking 14 Senior Executive Posts are primarily members of the University Executive Team 15 Holders of Senior Posts are primarily Deans and Directors of large Professional Service areas 39
 at 52.3%, and most strikingly for Professors at 73.9%. 26.")
41 In terms of Academic contracts, it is noted that male staff are in the majority across all three salary scales as follows: Academic Heads 60.0%, much less so for Heads of Department (formerly Academic Team Leaders) at 52.3%, and most strikingly for Professors at 73.9%. 26.1% of Professors were female, a figure slightly lower than in previous years (28.0% in 2014/15). Although in the minority, female Professors are better represented at NTU than across the sector where indications from 2014/15 HESA figures are that female professors comprise 23.1% of all professors in the UK. NTU s gender balance for Heads of Department (52.3% male) compares favourably against the sector average of 65.5% male at this grade. The gender profile of support staff at senior levels is well-balanced, with Support Heads 16 at 50:50. However, female staff are in a clear majority across the non-senior levels of support staff at 62.3% (see Figure 3.1.6). Figure Both Lecturers and Sessional Lecturers show a close gender balance with 50.5% of Lecturers and 50.1% of Sessional Lecturers being female. HESA figures collected for 2014/15 indicate that, as in previous years, female academic staff in the UK were in a minority at 45.0%. Research staff were gender balanced. Miscellaneous 17 Support staff showed a higher percentage of males (58.1%). Female Support staff were in the majority at 62.3%. 16 Support Heads are primarily Heads or Directors of Professional Service areas 17 Staff falling within the Miscellaneous group of staff are all on fixed term contracts and primarily employed in assistant roles, e.g. Marketing Assistant, Finance Assistant, Technical Assistant, Student Placement etc. 40
42 Figure The main reasons for leaving were resignation, 56.2% female, and end of contract, 55.8% female. Overall 55.3% of leavers were female, in line with the overall proportion of female staff (55.4%). Figure Gender profile of all staff involved in grievances and disciplinaries 18 Female Male Total % No. % No. % No. Disciplinary 40.9% % % 22 Grievance 87.5% % % 8 13 disciplinaries were of male staff compared to nine female. Seven grievances were brought by female members of staff and just one brought by a male. 18 In there were 24 disciplinaries, four of which were of two individuals and as such have been combined to two counts. There were 9 formal grievances made, two of which were by the same individual and as such have been combined to one count. 41
. 13.")

43 3.2 Ethnicity Figure Figure The disclosure rate for all staff is now at 94.7% (similar to the 2014/15 rate of 94.5%). 13.0% of those staff who disclosed their ethnicity were BME 19, an increase from 12.5% in 2014/ % of all staff chose not to disclose their ethnicity. 19 BME consists of all non-white ethnicities. 42

44 Figure For the purposes of analysis BME staff have been grouped into the following ethnic groups: Asian 20 (32.2%), Black 21 (34.8%), Chinese (12.2%), Mixed 22 (12.8%) and Other 23 (8.0%). The figures for 2015/16 are broadly similar to those for Asian consists of Asian or Asian British: Bangladeshi, Indian, Pakistani and other Asian background 21 Black consists of Black or Black British: African, Caribbean and other black background 22 Mixed consists of Mixed: white and black Caribbean, white and black African, white and Asian, other mixed background 23 Other consists of Any other ethnic background and Arab 43

45 Figure % of UK national staff who disclosed their ethnicity were BME, an increase from 7.9% in 2014/15. This compares with a sector England average of 9.6%. Of the non-uk national staff, 44.5% of those who disclosed their ethnicity were BME staff. This compares with the England sector average of 28.9%. 44

46 Figure
47 Figure The overall rate of disclosure for College-based staff was 93.4%, similar to the rate of 93.0% in 2014/15. The highest rates of disclosure were found in College-level staff (an average of 96.5%), School of Architecture, Design and the Built Environment (94.7%), School of Education (95.0%) and School of Science & Technology (95.0%). The lowest disclosure rates were in the School of Art & Design (91.2%) which has improved from 88.3% in 2014/15, and School of Arts & Humanities (87.7%). In line with last year, schools with the highest rates of BME staff were the Nottingham Business School (14.0%, an increase from 13.3% in 2014/15) and School of Architecture Design and the Built Environment (10.1%, an increase from 8.7% in 2014/15). In comparison, the sector average for UK BME staff in Business and Management Studies, and Architecture, Built Environment and Planning, were 11.8% and 8.6% respectively. The Schools with the lowest levels of BME staff have all seen an increase since 2014/15: Animal, Rural and Environmental Sciences (2.4%, an increase from 0.7%), and Art and Design (4.2%, an increase from 3.7%). 46
48 Figure
 was higher in the Professional Service Areas (8.9%)")
49 Figure All Professional Services Areas have disclosure rates for ethnicity of 95% or above and an average disclosure rate of 97.0%. In line with last year, the proportion of UK-national BME staff (of those who disclosed their ethnicity) was higher in the Professional Service Areas (8.9%) than in College- Based staff (7.9%). In Professional Services areas proportions of BME staff are broadly the same as in 2014/15. Of staff who declared their ethnicity, the areas with the largest proportion of BME staff were PVC Student Support (13.9%), and Information Systems (11.7%). 48


50 Figure Disclosure rates were very high for all the senior level staff. The lowest disclosure rates were for Support Heads although still high at 95.0%. Levels of BME staff were on average 10.0%, an increase from 9.3% in 2014/15, with the highest for Professors (21.1%) which saw an increase from 19.2% in 2014/15 and 13.9% in 2013/14, and is considerably higher than the sector which stands at 7.7%. In line with 2014/15, proportions of BME staff were at their lowest in Holders of Senior Posts (0.0%) and Professional & Managerial posts (3.1%). 49
 and highest for Lecturers (96.5%) and Miscellaneous staff 24 (97.9%). 8.2% of all staff in non-senior level roles were BME members of staff.")
51 Figure Figure Within the non-senior level roles, disclosure rates were generally good at 94.7% on average. The lowest disclosure rate being for Sessional Lecturers (84.3%) and highest for Lecturers (96.5%) and Miscellaneous staff 24 (97.9%). 8.2% of all staff in non-senior level roles were BME members of staff. Lecturers and Sessional Lecturers had the lowest rates of BME staff at 7.3% and 7.6% respectively. The highest rate of BME staff was found in the Miscellaneous staff group at 17.0%. Research staff has seen a notable increase in BME representation, rising from 6.0% in 2014/15 to 12.0%. 24 Staff falling within the Miscellaneous group of staff are all on fixed term contracts and primarily employed in assistant roles, e.g. Marketing Assistant, Finance Assistant, Technical Assistant, Student Placement etc. 50
52 Figure % of all leavers were of BME background (excluding atypical and non-uk nationalities). This is higher than the average employed BME staff of 8.3% (excluding atypical and non-uk nationalities). Of those members of staff who left due to dismissal 18.8% were BME staff, although the total number of dismissals was low at just 16 people, 3 of whom were BME. A high proportion of BME staff were also seen in those leaving due to the end of a contract, at 13.0%. There was a low proportion of BME staff in those who retired, at just 3.0%. Figure Ethnicity profile (BME/white) of all staff involved in grievances or disciplinaries, showing data only where known BME White Total % No. % No. % No. Disciplinary 14.3% % % 21 Grievance 25.0% % % % of all disciplinaries were of BME members of staff, where ethnicity was known; this is broadly in line with the proportion of all staff who were BME where ethnicity was known (13.0%). There was just one member staff of unknown ethnicity and therefore not included in the table above. Ethnicity was known for all staff who brought grievances, two of those were from a BME member of staff and the remaining six were brought by White members of staff. 51


53 3.3 Disability Figure Figure The disclosure rate for disability status is 80.0%, an increase from 76.3% in 2014/ % of those staff who have disclosed their disability status have indicated they are disabled, a figure close to that of 7.0% in 2014/15. Of those staff who declared their disability across the sector in England, 4.6% declared they were disabled. 52

54 Figure

55 Figure The average disclosure rate for College-based staff was 76.3%, an increase from 71.7% in 2014/15. College-level staff had the highest rates of disclosure at 87.7% for Art, Architecture, Design and Humanities, 94.7% for Business, Law and Social Sciences, and 91.2% for Science and Technology. Lowest rates of disclosure were found in the Nottingham Business School (68.4%), and School of Art and Design (70.3%, however this is an increase from 62.5% in 2014/15). Disclosure rates in Animal, Rural and Environmental Sciences have increased from 62.6% in 2014/15 to 72.3%. 5.7% of all those College-based staff where disability status was known were disabled, a decrease from last year s figure of 6.5%. The areas with the lowest rates of disabled staff were the School of Animal, Rural & Environmental Sciences (2.0%) and School of Arts and Humanities (1.8%). The highest rate of disability were found in the Nottingham Law School (13.4%). 54
56 Figure
 and Finance / Governance and Legal (94.4%).")
57 Figure Overall the disclosure rate for Professional Services-based staff was 86.2%, higher than for College-based staff at 76.3%. In the Professional Services areas the highest disclosure rates were in Sport (93.9%) and Finance / Governance and Legal (94.4%). The lowest rate of disclosure can be found in Business Improvement & Organisational Development / Directorate / PVC Culture (76.0%). PVC Student Affairs (previously PVC Student Support) has seen an increase in disclosure from 79.1% in 2014/15 to 89.3%. Rates of declared disability (where known) were higher in the Professional Service areas at 7.4% than in the Schools where they were 5.7%. Of those staff who declared their disability status, the areas with the largest proportion of staff with declared disabilities were PVC Student Affairs (16.0, an increase from 14.3% in 2014/15) and Information Systems (10.9%). The area with the lowest declaration of disabilities was Business Improvement & Organisational Development / Directorate / PVC Culture (0%) and Sport (2.2%). 56


58 Figure Figure Mirroring last year s figures, the most senior posts, namely, Senior Executive Posts and Holders of Senior Posts, had no instances of disabled members of staff. This was also true of Support Heads and Academic Heads. It is worth noting that the numbers of staff within these groups are small in number, ranging from just 10 Academic Heads to 20 Support Heads. Heads of Department also had low instances of disabled staff at just 2.7%, which represents one member of staff out of a total of 44, and similarly Professors at 3.9%, representing 3 staff members out of 88. Professional & Managerial had the highest rate of disabled staff at 5.0%. 57

59 Figure Figure The proportion of disabled staff where their disability status was known was higher in non-senior staff at 6.6% than in senior staff at 3.3%. Of non-senior level staff Support had the highest proportion of disabled staff at 7.2%, and Research staff with declared disabilities have increased from 3.7% in 2014/15 to 5.4%. In line with last year, the disclosure rate for Sessional Lectures is low (49.9%). 58
60 Figure The proportion of disabled staff amongst those that left the University in 2015/16 (where disability status was known) was 7.0%, slightly higher than that of all disabled staff employed during the year (where disability status was known) which was 6.4%. The highest rates of disability were found in those who retired (17.5%), and those who left due to dismissal (21.1%). Figure Disability profile of all staff involved in grievances or disciplinaries, showing data only where disability status is known Disabled Not disabled Total % No. % No. % No. Disciplinary 15.0% % % 20 Grievance 16.7% % % 6 Two members of staff who were subject to disciplinaries and two who brought grievances were of unknown disability status or chose not to disclose. Of the remaining staff, three disabled staff members were subject to disciplinary and one brought a grievance. Although numbers are small, the proportions of disabled staff for both disciplinaries and grievances are higher (15.0% and 16.7% respectively) than for all staff, where disability status was known (6.4%). 59

61 3.4 Age Figure The largest group of staff were aged at 39.7%, and then the age group at 32.1%, followed by those aged 34 and under at 26.2% and finally 65 and over at just 2.1%. These figures are broadly in line with last year. 60

62 Figure For all College-level staff the age groups had the largest proportion of staff. The College of Science and Technology had a larger proportion of staff aged 34 & under than the other two colleges (30.3%, compared to 21.1% in the College of Art, Architecture, Design and Humanities, and 21.2% in the College of Business, Law & Social Sciences). The College of Science and Technology also had the lowest level of staff aged 66 + (1.8%). 61

63 Figure In Professional Services a younger staff profiles is noticeable, with 31.1% of staff in the 34 & under group and just 1.0% in the 66 + group. 62
64 Figure When compared to the proportions of staff employed in each of the age groups there was a disproportionate number of leavers in the 34 & under age group at 40.9% compared to 26.2% employed. This age group was most highly represented in staff who resigned or left due to end of contract. There was also a lower proportion of leavers in the and age group at 30.8% and 25.3% compared to 39.7% and 32.1% staff employed in the respective age groups. Figure Age profile of all staff involved in grievances or disciplinaries 34 & under Total % No. % No. % No. % No. Disciplinaries 22.7% % % % 22 Grievances 12.5% % % % 8 The majority of disciplinaries were of staff aged (59.1%) and the same age group brought the majority of grievances. 63
65 3.5 Religion and Belief Figure Figure

66 The disclosure rate for religion and belief was 77.2%, an increase from 73.6% in 2014/15. In comparison, the average disclosure rate for institutions in the sector which returned staff data for religion and belief was 41.2%. With the exception of sexual orientation, religion is the equality characteristic with the lowest disclosure rate at NTU and also the highest rate of staff opting for the prefer not to say option at 6.8%. The majority of staff who disclosed their religion or belief indicated they had no religion (51.9%). The second largest group are Christian (39.5%). The remaining staff who have a non-christian religion are looked at in more detail below (Figure 3.5.3). When compared to nationwide census data 25 where religion or belief is known, NTU s religion and belief profile is vastly different. For example across England and Wales 77.7% of people report as Christian compared to 39.5% of NTU staff; 16.1% of people across England and Wales report as No Religion compared to 51.9% of NTU staff. Figure Figure depicts the religion or belief profile of those with a non-christian religion and identifies that the two largest groups are Any other religion or belief (25.9%) and Muslim (33.9%, an increase from 24.4% in 2014/15). 25 England & Wales 2011 Census 65

67 Figure Figure
68 The religion profile of leavers, where religions are grouped into Christian and Non- Christian due to low numbers, roughly matches the religion profile of all employed staff, with slightly higher levels of non-christian leavers compared to all staff (8.7% of all staff compared with 11.7% of leavers) and slightly lower levels of Christian leavers (39.5% of all staff compared with 36.9% of leavers). Figure Religion and belief profile (Christian/Non-Christian/No religion) of all staff involved in grievances or disciplinaries, showing data only where religion and belief is known Christian No religion Non- Christian Total % No. % No. % No. % No. Disciplinaries 38.9% % % % 18 Grievances 33.3% % 4 0.0% % 6 Four members of staff with disciplinaries and two who brought grievances did not disclose or chose not to disclose their religion/belief. 67
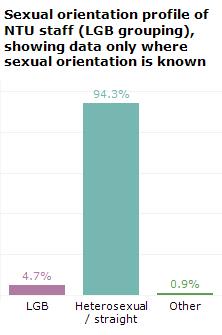
69 3.6 Sexual orientation In July 2015 the University began collecting staff data on sexual orientation. All current staff were contacted and asked to log on to the University s HR System and check and update their equality data. This was part of the usual biennial update exercise. Information was provided to explain why the University was collecting this data and how its use and storage would be managed in line with the Data Protection Act. Applicants and new starters were also asked to provide this information from July 2015 onwards. In January 2016 the disclosure rate was 18.0% and as of November 2016 disclosure stands at 24.5%. In comparison with the sector, institutions which returned data for sexual orientation (many of whom have been collecting data for longer than NTU) had an average disclosure rate of 29.9%. Because the disclosure rate is still low it is too soon to draw conclusions from the data, so the following information is presented for interest only. We have presented percentages only, due to low numbers. Figure

70 Figure Figure
Research Update. Educational Migration and Non-return in Northern Ireland May 2008
 Research Update Educational Migration and Non-return in Northern Ireland May 2008 The Equality Commission for Northern Ireland (hereafter the Commission ) in 2007 contracted the Employment Research Institute
University of Oxford: Equality Report 2013/14. Section B: Staff equality data
 University of Oxford: Equality Report 2013/14 Section B: Staff equality data 1 This is Section B of the University of Oxford s Equality Report for 2013/14 and covers staff equality data. It is produced
This Access Agreement is for only, to align with the WPSA and in light of the Browne Review.
 University of Essex Access Agreement 2011-12 The University of Essex Access Agreement has been updated in October 2010 to include new tuition fee and bursary provision for 2011 entry and account for the
Australia s tertiary education sector
 Australia s tertiary education sector TOM KARMEL NHI NGUYEN NATIONAL CENTRE FOR VOCATIONAL EDUCATION RESEARCH Paper presented to the Centre for the Economics of Education and Training 7 th National Conference
Investigating the Relationship between Ethnicity and Degree Attainment
 Investigating the Relationship between Ethnicity and Degree Attainment Jaki Lilly (Jaki.Lilly@anglia.ac.uk), INSPIRE Berenice Rivera Macías (berenice.riveramacias@anglia.ac.uk), INSPIRE Mark Warnes (Mark.Warnes@anglia.ac.uk),
Principal vacancies and appointments
 Principal vacancies and appointments 2009 10 Sally Robertson New Zealand Council for Educational Research NEW ZEALAND COUNCIL FOR EDUCATIONAL RESEARCH TE RŪNANGA O AOTEAROA MŌ TE RANGAHAU I TE MĀTAURANGA
This Access Agreement covers all relevant University provision delivered on-campus or in our UK partner institutions.
 UNIVERSITY OF HERTFORDSHIRE ACCESS AGREEMENT 2011/12 1 Overview The University of Hertfordshire has a strong track record of success in raising aspirations and thus in widening participation. This is amply
This Access Agreement is for only, to align with the WPSA and in light of the Browne Review.
 University of Essex Access Agreement 2011-12 The University of Essex Access Agreement has been updated in October 2010 to include new tuition fee and bursary provision for 2011 entry and account for the
AUTHORITATIVE SOURCES ADULT AND COMMUNITY LEARNING LEARNING PROGRAMMES
 AUTHORITATIVE SOURCES ADULT AND COMMUNITY LEARNING LEARNING PROGRAMMES AUGUST 2001 Contents Sources 2 The White Paper Learning to Succeed 3 The Learning and Skills Council Prospectus 5 Post-16 Funding
QUEEN S UNIVERSITY BELFAST SCHOOL OF MEDICINE, DENTISTRY AND BIOMEDICAL SCIENCES ADMISSION POLICY STATEMENT FOR DENTISTRY FOR 2016 ENTRY
 FINAL QUEEN S UNIVERSITY BELFAST SCHOOL OF MEDICINE, DENTISTRY AND BIOMEDICAL SCIENCES ADMISSION POLICY STATEMENT FOR DENTISTRY FOR 2016 ENTRY 1. Introduction It is the policy of the University that all
Western Australia s General Practice Workforce Analysis Update
 Western Australia s General Practice Workforce Analysis Update NOVEMBER 2015 PUBLISHED MAY 2016 Rural Health West This work is copyright. Apart from any use as permitted under the Copyright Act 1968, no
University of Essex Access Agreement
 University of Essex Access Agreement Updated in August 2009 to include new tuition fee and bursary provision for 2010 entry 1. Context The University of Essex is academically a strong institution, with
Faculty of Social Sciences
 Faculty of Social Sciences Programme Specification Programme title: BA (Hons) Sociology Academic Year: 017/18 Degree Awarding Body: Partner(s), delivery organisation or support provider (if appropriate):
Draft Budget : Higher Education
 The Scottish Parliament and Scottish Parliament Infor mation C entre l ogos. SPICe Briefing Draft Budget 2015-16: Higher Education 6 November 2014 14/79 Suzi Macpherson This briefing reports on funding
Nottingham Trent University Course Specification
 Nottingham Trent University Course Specification Basic Course Information 1. Awarding Institution: Nottingham Trent University 2. School/Campus: Nottingham Business School / City 3. Final Award, Course
Status of Women of Color in Science, Engineering, and Medicine
 Status of Women of Color in Science, Engineering, and Medicine The figures and tables below are based upon the latest publicly available data from AAMC, NSF, Department of Education and the US Census Bureau.
Educational Attainment
 A Demographic and Socio-Economic Profile of Allen County, Indiana based on the 2010 Census and the American Community Survey Educational Attainment A Review of Census Data Related to the Educational Attainment
RCPCH MMC Cohort Study (Part 4) March 2016
 March 2016") RCPCH MMC Cohort Study (Part 4) March 2016 Acknowledgements Dr Simon Clark, Officer for Workforce Planning, RCPCH Dr Carol Ewing, Vice President Health Services, RCPCH Dr Daniel Lumsden, Former Chair,
RCPCH MMC Cohort Study (Part 4) March 2016 Acknowledgements Dr Simon Clark, Officer for Workforce Planning, RCPCH Dr Carol Ewing, Vice President Health Services, RCPCH Dr Daniel Lumsden, Former Chair,
Programme Specification
 Programme Specification Title: Crisis and Disaster Management Final Award: Master of Science (MSc) With Exit Awards at: Postgraduate Certificate (PG Cert) Postgraduate Diploma (PG Dip) Master of Science
Programme Specification. MSc in International Real Estate
 Programme Specification MSc in International Real Estate IRE GUIDE OCTOBER 2014 ROYAL AGRICULTURAL UNIVERSITY, CIRENCESTER PROGRAMME SPECIFICATION MSc International Real Estate NB The information contained
IMPERIAL COLLEGE LONDON ACCESS AGREEMENT
 IMPERIAL COLLEGE LONDON ACCESS AGREEMENT BACKGROUND 1. This Access Agreement for Imperial College London is framed by the College s mission, our admissions requirements and our commitment to widening participation.
Teaching Excellence Framework
 Teaching Excellence Framework Role specification: Subject Pilot and Year Three Panel members and assessors 13 September 2017 Contents Background... 2 Introduction... 2 Application process... 3 Subject
THE ECONOMIC IMPACT OF THE UNIVERSITY OF EXETER
 THE ECONOMIC IMPACT OF THE UNIVERSITY OF EXETER Report prepared by Viewforth Consulting Ltd www.viewforthconsulting.co.uk Table of Contents Executive Summary... 2 Background to the Study... 6 Data Sources
Application for Postgraduate Studies (Research)
") Application for Postgraduate Studies (Research) Please complete clearly. This form will be photocopied. Applicant Number (for office use only). For office use only: Admissions Office Admissions Tutor Interview
Application for Postgraduate Studies (Research) Please complete clearly. This form will be photocopied. Applicant Number (for office use only). For office use only: Admissions Office Admissions Tutor Interview
GCSE English Language 2012 An investigation into the outcomes for candidates in Wales
 GCSE English Language 2012 An investigation into the outcomes for candidates in Wales Qualifications and Learning Division 10 September 2012 GCSE English Language 2012 An investigation into the outcomes
Programme Specification
 Programme Specification Title of Course: Foundation Year in Science, Computing & Mathematics Date Specification Produced: January 2013 Date Specification Last Revised: May 2013 This Programme Specification
African American Male Achievement Update
 Report from the Department of Research, Evaluation, and Assessment Number 8 January 16, 2009 African American Male Achievement Update AUTHOR: Hope E. White, Ph.D., Program Evaluation Specialist Department
Institutional review. University of Wales, Newport. November 2010
 Institutional review University of Wales, Newport November 2010 The Quality Assurance Agency for Higher Education 2011 ISBN 978 1 84979 260 8 All QAA's publications are available on our website www.qaa.ac.uk
STUDENT AND ACADEMIC SERVICES
 STUDENT AND ACADEMIC SERVICES Admissions Division International Admissions Administrator (3 posts available) Full Time, Fixed Term for 12 months Grade D: 21,220-25,298 per annum De Montfort University
Graduate Division Annual Report Key Findings
 Graduate Division 2010 2011 Annual Report Key Findings Trends in Admissions and Enrollment 1 Size, selectivity, yield UCLA s graduate programs are increasingly attractive and selective. Between Fall 2001
Institutional fee plan 2015/16. (Please copy all correspondence to
 Institutional fee plan 2015/16 Institution: Lead Contact for fee plan: Post Held: Huw Williams Deputy Vice Chancellor Telephone: 01443 483647 Email: Huw.Williams@southwales.ac.uk (Please copy all correspondence
COLLEGE OF INTEGRATED CHINESE MEDICINE ADMISSIONS POLICY
 Page 1 of 5 COLLEGE OF INTEGRATED CHINESE MEDICINE ADMISSIONS POLICY Purpose of the admissions policy The purpose of the College Admissions Policy is to ensure that the applicant: Has the academic abilities
Pharmaceutical Medicine
 Specialty specific guidance on documents to be supplied in evidence for an application for entry onto the Specialist Register with a Certificate of Eligibility for Specialist Registration (CESR) Pharmaceutical
Initial teacher training in vocational subjects
 Initial teacher training in vocational subjects This report looks at the quality of initial teacher training in vocational subjects. Based on visits to the 14 providers that undertake this training, it
BSc (Hons) Banking Practice and Management (Full-time programmes of study)
 Banking Practice and Management (Full-time programmes of study)") BSc (Hons) Banking Practice and Management (Full-time programmes of study) The London Institute of Banking & Finance is a registered charity, incorporated by Royal Charter. Programme Specification 1. GENERAL
BSc (Hons) Banking Practice and Management (Full-time programmes of study) The London Institute of Banking & Finance is a registered charity, incorporated by Royal Charter. Programme Specification 1. GENERAL
University of Exeter College of Humanities. Assessment Procedures 2010/11
 University of Exeter College of Humanities Assessment Procedures 2010/11 This document describes the conventions and procedures used to assess, progress and classify UG students within the College of Humanities.
Transportation Equity Analysis
 2015-16 Transportation Equity Analysis Each year the Seattle Public Schools updates the Transportation Service Standards and bus walk zone boundaries for use in the upcoming school year. For the 2014-15
2007 No. xxxx EDUCATION, ENGLAND. The Further Education Teachers Qualifications (England) Regulations 2007
 Regulations 2007") Please note: these Regulations are draft - they have been made but are still subject to Parliamentary Approval. They S T A T U T O R Y I N S T R U M E N T S 2007 No. xxxx EDUCATION, ENGLAND The Further
Please note: these Regulations are draft - they have been made but are still subject to Parliamentary Approval. They S T A T U T O R Y I N S T R U M E N T S 2007 No. xxxx EDUCATION, ENGLAND The Further
Introduction 3. Outcomes of the Institutional audit 3. Institutional approach to quality enhancement 3
 De Montfort University March 2009 Annex to the report Contents Introduction 3 Outcomes of the Institutional audit 3 Institutional approach to quality enhancement 3 Institutional arrangements for postgraduate
Enrollment Trends. Past, Present, and. Future. Presentation Topics. NCCC enrollment down from peak levels
 Presentation Topics 1. Enrollment Trends 2. Attainment Trends Past, Present, and Future Challenges & Opportunities for NC Community Colleges August 17, 217 Rebecca Tippett Director, Carolina Demography
Programme Specification (Postgraduate) Date amended: 25 Feb 2016
 Date amended: 25 Feb 2016") Programme Specification (Postgraduate) Date amended: Feb 06. Programme Title(s): Sc and Postgraduate Diploma in Software Engineering for Financial Services, Sc Software Engineering for Financial Services
Programme Specification (Postgraduate) Date amended: Feb 06. Programme Title(s): Sc and Postgraduate Diploma in Software Engineering for Financial Services, Sc Software Engineering for Financial Services
UNIVERSITY OF BIRMINGHAM CODE OF PRACTICE ON LEAVE OF ABSENCE PROCEDURE
 UNIVERSITY OF BIRMINGHAM CODE OF PRACTICE ON LEAVE OF ABSENCE PROCEDURE 1 Index of points 1. Introduction 2. Definition of Leave of Absence 3. Implications of Leave of Absence 4. Imposed Leave of Absence
The Netherlands. Jeroen Huisman. Introduction
 4 The Netherlands Jeroen Huisman Introduction Looking solely at the legislation, one could claim that the Dutch higher education system has been officially known as a binary system since 1986. At that
London School of Economics and Political Science. Disciplinary Procedure for Students
 London School of Economics and Political Science Purpose of this Procedure Disciplinary Procedure for Students 1. The School s Memorandum and Articles of Association set out its main objectives of education
MSc Education and Training for Development
 MSc Education and Training for Development Awarding Institution: The University of Reading Teaching Institution: The University of Reading Faculty of Life Sciences Programme length: 6 month Postgraduate
Iowa School District Profiles. Le Mars
 Iowa School District Profiles Overview This profile describes enrollment trends, student performance, income levels, population, and other characteristics of the public school district. The report utilizes
CONFERENCE PAPER NCVER. What has been happening to vocational education and training diplomas and advanced diplomas? TOM KARMEL
 CONFERENCE PAPER NCVER What has been happening to vocational education and training diplomas and advanced diplomas? TOM KARMEL NATIONAL CENTRE FOR VOCATIONAL EDUCATION RESEARCH Paper presented to the National
Your Strategic Update
 1 January 2016 Highlights University of Salford ranked as one of the world s most international universities New Dean of Salford Business School appointed (Prof David Spicer) Preparing for NSS 2016 go
ANALYSIS: LABOUR MARKET SUCCESS OF VOCATIONAL AND HIGHER EDUCATION GRADUATES
 ANALYSIS: LABOUR MARKET SUCCESS OF VOCATIONAL AND HIGHER EDUCATION GRADUATES Authors: Ingrid Jaggo, Mart Reinhold & Aune Valk, Analysis Department of the Ministry of Education and Research I KEY CONCLUSIONS
SASKATCHEWAN MINISTRY OF ADVANCED EDUCATION
 SASKATCHEWAN MINISTRY OF ADVANCED EDUCATION Report March 2017 Report compiled by Insightrix Research Inc. 1 3223 Millar Ave. Saskatoon, Saskatchewan T: 1-866-888-5640 F: 1-306-384-5655 Table of Contents
Evaluation of Teach For America:
 EA15-536-2 Evaluation of Teach For America: 2014-2015 Department of Evaluation and Assessment Mike Miles Superintendent of Schools This page is intentionally left blank. ii Evaluation of Teach For America:
Navitas UK Holdings Ltd Embedded College Review for Educational Oversight by the Quality Assurance Agency for Higher Education
 Navitas UK Holdings Ltd Embedded College Review for Educational Oversight by the Quality Assurance Agency for Higher Education February 2014 Annex: Birmingham City University International College Introduction
Shelters Elementary School
 Shelters Elementary School August 2, 24 Dear Parents and Community Members: We are pleased to present you with the (AER) which provides key information on the 23-24 educational progress for the Shelters
Programme Specification
 Programme Specification Title: Accounting and Finance Final Award: Master of Science (MSc) With Exit Awards at: Postgraduate Certificate (PG Cert) Postgraduate Diploma (PG Dip) Master of Science (MSc)
Pearson BTEC Level 3 Award in Education and Training
 Pearson BTEC Level 3 Award in Education and Training Specification BTEC Specialist qualification First teaching September 2013 Issue 3 Edexcel, BTEC and LCCI qualifications Edexcel, BTEC and LCCI qualifications
SAT Results December, 2002 Authors: Chuck Dulaney and Roger Regan WCPSS SAT Scores Reach Historic High
 ABOUT THE SAT 2001-2002 SAT Results December, 2002 Authors: Chuck Dulaney and Roger Regan WCPSS SAT Scores Reach Historic High The Scholastic Assessment Test (SAT), more formally known as the SAT I: Reasoning
Post-16 transport to education and training. Statutory guidance for local authorities
 Post-16 transport to education and training Statutory guidance for local authorities February 2014 Contents Summary 3 Key points 4 The policy landscape 4 Extent and coverage of the 16-18 transport duty
BASIC EDUCATION IN GHANA IN THE POST-REFORM PERIOD
 BASIC EDUCATION IN GHANA IN THE POST-REFORM PERIOD By Abena D. Oduro Centre for Policy Analysis Accra November, 2000 Please do not Quote, Comments Welcome. ABSTRACT This paper reviews the first stage of
. Town of birth. Nationality. address)
") ACTING BA (HONS) IN ACTING / FOUNDATION COURSE IN ACTING APPLICATION FOR ENTRY IN SEPTEMBER 2018 PLEASE COMPLETE ALL SECTIONS OF THIS APPLICATION FORM AND RETURN IT WITH THE REGISTRATION FEE Please tick
ACTING BA (HONS) IN ACTING / FOUNDATION COURSE IN ACTING APPLICATION FOR ENTRY IN SEPTEMBER 2018 PLEASE COMPLETE ALL SECTIONS OF THIS APPLICATION FORM AND RETURN IT WITH THE REGISTRATION FEE Please tick
A LIBRARY STRATEGY FOR SUTTON 2015 TO 2019
 A LIBRARY STRATEGY FOR SUTTON 2015 TO 2019 Page 15 Agenda Item 4 INTRODUCTION AND SUMMARY Library services provided in the London Borough of Sutton have been at the forefront of innovative and customer
Application for Admission to Postgraduate Studies
 Ref A Application for Admission to Postgraduate Studies Please read the attached notes before completing the application form Section A Personal Details (Please see notes) Surname / Family name Email Mr
2005 National Survey of Student Engagement: Freshman and Senior Students at. St. Cloud State University. Preliminary Report.
 National Survey of Student Engagement: Freshman and Senior Students at St. Cloud State University Preliminary Report (December, ) Institutional Studies and Planning National Survey of Student Engagement
1. Programme title and designation International Management N/A
 PROGRAMME APPROVAL FORM SECTION 1 THE PROGRAMME SPECIFICATION 1. Programme title and designation International Management 2. Final award Award Title Credit value ECTS Any special criteria equivalent MSc
Effective Pre-school and Primary Education 3-11 Project (EPPE 3-11)
") Effective Pre-school and Primary Education 3-11 Project (EPPE 3-11) A longitudinal study funded by the DfES (2003 2008) Exploring pupils views of primary school in Year 5 Address for correspondence: EPPSE
Effective Pre-school and Primary Education 3-11 Project (EPPE 3-11) A longitudinal study funded by the DfES (2003 2008) Exploring pupils views of primary school in Year 5 Address for correspondence: EPPSE
THE PENNSYLVANIA STATE UNIVERSITY SCHREYER HONORS COLLEGE DEPARTMENT OF MATHEMATICS ASSESSING THE EFFECTIVENESS OF MULTIPLE CHOICE MATH TESTS
 THE PENNSYLVANIA STATE UNIVERSITY SCHREYER HONORS COLLEGE DEPARTMENT OF MATHEMATICS ASSESSING THE EFFECTIVENESS OF MULTIPLE CHOICE MATH TESTS ELIZABETH ANNE SOMERS Spring 2011 A thesis submitted in partial
Applications from foundation doctors to specialty training. Reporting tool user guide. Contents. last updated July 2016
 Applications from foundation doctors to specialty training Reporting tool user guide last updated July 2016 Contents Overview... 2 Purpose of the reports... 2 The reports can be found on the GMC website:...
Programme Specification. BSc (Hons) RURAL LAND MANAGEMENT
 RURAL LAND MANAGEMENT") Programme Specification BSc (Hons) RURAL LAND MANAGEMENT D GUIDE SEPTEMBER 2016 ROYAL AGRICULTURAL UNIVERSITY, CIRENCESTER PROGRAMME SPECIFICATION BSc (Hons) RURAL LAND MANAGEMENT NB The information contained
Programme Specification BSc (Hons) RURAL LAND MANAGEMENT D GUIDE SEPTEMBER 2016 ROYAL AGRICULTURAL UNIVERSITY, CIRENCESTER PROGRAMME SPECIFICATION BSc (Hons) RURAL LAND MANAGEMENT NB The information contained
PROGRAMME SPECIFICATION UWE UWE. Taught course. JACS code. Ongoing
 PROGRAMME SPECIFICATION Section 1: Basic Data Awarding institution/body Teaching institution Delivery Location(s) Faculty responsible for programme Modular Scheme title UWE UWE UWE: St Matthias campus
Programme Specification. MSc in Palliative Care: Global Perspectives (Distance Learning) Valid from: September 2012 Faculty of Health & Life Sciences
 Valid from: September 2012 Faculty of Health & Life Sciences") Programme Specification MSc in Palliative Care: Global Perspectives (Distance Learning) Valid from: September 2012 Faculty of Health & Life Sciences SECTION 1: GENERAL INFORMATION Awarding body: Teaching
Programme Specification MSc in Palliative Care: Global Perspectives (Distance Learning) Valid from: September 2012 Faculty of Health & Life Sciences SECTION 1: GENERAL INFORMATION Awarding body: Teaching
1.0 INTRODUCTION. The purpose of the Florida school district performance review is to identify ways that a designated school district can:
 1.0 INTRODUCTION 1.1 Overview Section 11.515, Florida Statutes, was created by the 1996 Florida Legislature for the purpose of conducting performance reviews of school districts in Florida. The statute
Chapter 2. University Committee Structure
 Chapter 2 University Structure 2. UNIVERSITY COMMITTEE STRUCTURE This chapter provides details of the membership and terms of reference of Senate, the University s senior academic committee, and its Standing
Summary Report. ECVET Agent Exploration Study. Prepared by Meath Partnership February 2015
 Summary Report ECVET Agent Exploration Study Prepared by Meath Partnership February 2015 The European Commission support for the production of this publication does not constitute an endorsement of the
Information Pack: Exams Officer. Abbey College Cambridge
 Information Pack: Exams Officer 1 To be a community energized by a love of learning and the pursuit of outstanding achievement for all Each individual student achieves excellence by achieving significant
Programme Specification
 School of Law, Criminology and Political Science Title of Programme: LLB (Hons); LLB (Hons) Commercial Law; LLB (Hons) Criminal Justice, LLB (Hons) Government and Politics; LLB (Hons) with a Year Abroad;
INSTRUCTION MANUAL. Survey of Formal Education
 INSTRUCTION MANUAL Survey of Formal Education Montreal, January 2016 1 CONTENT Page Introduction... 4 Section 1. Coverage of the survey... 5 A. Formal initial education... 6 B. Formal adult education...
value equivalent 6. Attendance Full-time Part-time Distance learning Mode of attendance 5 days pw n/a n/a
 PROGRAMME APPROVAL FORM SECTION 1 THE PROGRAMME SPECIFICATION 1. Programme title and designation Orthodontics 2. Final award Award Title Credit ECTS Any special criteria value equivalent MSc Orthodontics
Higher Education Review (Embedded Colleges) of Kaplan International Colleges UK Ltd
 of Kaplan International Colleges UK Ltd") Higher Education Review (Embedded Colleges) of Kaplan International Colleges UK Ltd June 2016 Contents About this review... 1 Key findings... 2 QAA's judgements about Kaplan International Colleges UK Ltd...
Higher Education Review (Embedded Colleges) of Kaplan International Colleges UK Ltd June 2016 Contents About this review... 1 Key findings... 2 QAA's judgements about Kaplan International Colleges UK Ltd...
Updated: December Educational Attainment
 Updated: Educational Attainment Among 25- to 29-year olds, the proportions who have attained a high school education, some college, or a bachelor s degree are all rising, according to longterm trends.
2015 Annual Report to the School Community
 2015 Annual Report to the School Community Narre Warren South P-12 College School Number: 8839 Name of School Principal: Rob Duncan Name of School Council President: Greg Bailey Date of Endorsement: 23/03/2016
Local authority National Indicator Map 2009
 November 2009 1 The Home Access programme Local authority National Map 2009 Delivered by 2 Contents: Section 1 About the National Map Section 2 National Map tables Section 3 National supporting evidence
Programme Specification
 School of Law, Criminology and Political Science Title of Programme: Programme Code: LLB (Hons); LLB (Hons) Commercial Law; LLB (Hons) Criminal Justice, LLB (Hons) Government and Politics; LLB (Hons) with
NORTH CAROLINA VIRTUAL PUBLIC SCHOOL IN WCPSS UPDATE FOR FALL 2007, SPRING 2008, AND SUMMER 2008
 E&R Report No. 08.29 February 2009 NORTH CAROLINA VIRTUAL PUBLIC SCHOOL IN WCPSS UPDATE FOR FALL 2007, SPRING 2008, AND SUMMER 2008 Authors: Dina Bulgakov-Cooke, Ph.D., and Nancy Baenen ABSTRACT North
Equity in student finance: Cross-UK comparisons. Lucy Hunter Blackburn
 Hunter Blackburn, Lucy (2016) Equity in student finance: Cross-UK comparisons, Special Edition: Widening Access to Higher Education in Scotland, Scottish Educational Review, 48(1), 30-47. Equity in student
Educational system gaps in Romania. Roberta Mihaela Stanef *, Alina Magdalena Manole
 Available online at www.sciencedirect.com ScienceDirect Procedia - Social and Behavioral Scien ce s 93 ( 2013 ) 794 798 3rd World Conference on Learning, Teaching and Educational Leadership (WCLTA-2012)
DEGREE OF MASTER OF SCIENCE (HUMAN FACTORS ENGINEERING)
") STATUTE ENG31 DEGREE OF MASTER OF SCIENCE (HUMAN FACTORS ENGINEERING) 1. For admission as a candidate for the degree of Master of Science (Human Factors Engineering), a person must: be a graduate of this
STATUTE ENG31 DEGREE OF MASTER OF SCIENCE (HUMAN FACTORS ENGINEERING) 1. For admission as a candidate for the degree of Master of Science (Human Factors Engineering), a person must: be a graduate of this
University of Arizona
 Annual Report Submission View Questionnaire (Edit) University of Arizona Annual Report Submission for the year 2009. Report has been submitted 1 times. Report was last submitted on 11/30/2009 7:12:09 PM.
Celebrating 25 Years of Access to HE
 Celebrating 25 Years of Access to HE The Access to HE Diploma The Access to HE Diploma is designed to provide academic preparation for higher education study for adults who, because of social, educational
Archdiocese of Birmingham
 Archdiocese of Birmingham INSPECTION REPORT THE GIFFARD CATHOLIC PRIMARY SCHOOL WOLVERHAMPTON Inspection dates 25 th -26 th June 2013 Reporting Inspector Paul Nutt Inspection carried out under Section
PROPOSED MERGER - RESPONSE TO PUBLIC CONSULTATION
 PROPOSED MERGER - RESPONSE TO PUBLIC CONSULTATION Paston Sixth Form College and City College Norwich Vision for the future of outstanding Post-16 Education in North East Norfolk Date of Issue: 22 September
International Application Form
 International Application Form Please complete ALL sections of this form clearly and accurately. If information is missing, or we cannot read some of the sections we will not be able to process your application.
Office of Institutional Effectiveness 2012 NATIONAL SURVEY OF STUDENT ENGAGEMENT (NSSE) DIVERSITY ANALYSIS BY CLASS LEVEL AND GENDER VISION
 DIVERSITY ANALYSIS BY CLASS LEVEL AND GENDER VISION") Office of Institutional Effectiveness 2012 NATIONAL SURVEY OF STUDENT ENGAGEMENT (NSSE) DIVERSITY ANALYSIS BY CLASS LEVEL AND GENDER VISION We seek to become recognized for providing bright and curious
Office of Institutional Effectiveness 2012 NATIONAL SURVEY OF STUDENT ENGAGEMENT (NSSE) DIVERSITY ANALYSIS BY CLASS LEVEL AND GENDER VISION We seek to become recognized for providing bright and curious
HEAD OF GIRLS BOARDING
 HEAD OF GIRLS BOARDING Information for candidates Required for January 2018 The closing date for applications is Wednesday 5 th July 2017. Interviews will take place from Monday 10 th July 2017. THE SCHOOL
Where has all the education gone in Sub-Saharan Africa? Employment and other outcomes among secondary school and university leavers
 MPRA Munich Personal RePEc Archive Where has all the education gone in Sub-Saharan Africa? Employment and other outcomes among secondary school and university leavers Samer Al-Samarrai and Paul Bennell
An Empirical Analysis of the Effects of Mexican American Studies Participation on Student Achievement within Tucson Unified School District
 An Empirical Analysis of the Effects of Mexican American Studies Participation on Student Achievement within Tucson Unified School District Report Submitted June 20, 2012, to Willis D. Hawley, Ph.D., Special
PROJECT DESCRIPTION SLAM
 PROJECT DESCRIPTION SLAM STUDENT LEADERSHIP ADVANCEMENT MOBILITY 1 Introduction The SLAM project, or Student Leadership Advancement Mobility project, started as collaboration between ENAS (European Network
Colorado State University Department of Construction Management. Assessment Results and Action Plans
 Colorado State University Department of Construction Management Assessment Results and Action Plans Updated: Spring 2015 Table of Contents Table of Contents... 2 List of Tables... 3 Table of Figures...
Programme Specification
 Programme Specification Title: Journalism (War and International Human Rights) Final Award: Master of Arts (MA) With Exit Awards at: Postgraduate Certificate (PG Cert) Postgraduate Diploma (PG Dip) Master
Introduction. Background. Social Work in Europe. Volume 5 Number 3
 12 The Development of the MACESS Post-graduate Programme for the Social Professions in Europe: The Hogeschool Maastricht/ University of North London Experience Sue Lawrence and Nol Reverda The authors
Higher Education Review of University of Hertfordshire
 Higher Education Review of University of Hertfordshire December 2015 Contents About this review... 1 Key findings... 2 QAA's judgements about the University of Hertfordshire... 2 Good practice... 2 Affirmation
Suggested Citation: Institute for Research on Higher Education. (2016). College Affordability Diagnosis: Maine. Philadelphia, PA: Institute for
. College Affordability Diagnosis: Maine. Philadelphia, PA: Institute for") MAINE Suggested Citation: Institute for Research on Higher Education. (2016). College Affordability Diagnosis: Maine. Philadelphia, PA: Institute for Research on Higher Education, Graduate School of Education,
MAINE Suggested Citation: Institute for Research on Higher Education. (2016). College Affordability Diagnosis: Maine. Philadelphia, PA: Institute for Research on Higher Education, Graduate School of Education,