FACTORS ASSOCIATED WITH FIRST-YEAR STUDENT ATTRITION AND RETENTION AT OHIO UNIVERSITY REGIONAL CAMPUSES
|
|
|
- Noah Roland Owens
- 6 years ago
- Views:
Transcription
1 FACTORS ASSOCIATED WITH FIRST-YEAR STUDENT ATTRITION AND RETENTION AT OHIO UNIVERSITY REGIONAL CAMPUSES OFFICE OF INSTITUTIONAL RESEARCH September 2016
2 2 Executive Summary Regional Campus Retention Study This report presents first-year (freshman) retention information on each of Ohio University s regional campuses. The combined regional campus retention rate was 55 percent in 2015, 54 percent in 2014, 59 percent in 2013, 56 percent in 2012, 60 percent in 2011, 52 percent in 2010, 55 percent in 2009, 57 percent in 2008, and 55 percent in Individual campus retention rates are given below: First Year Full Time Retention Rate for the Regional Campuses Fall Chillicothe Eastern Lancaster Southern Zanesville % 57.0% 56.0% 48.0% 55.0% % 66.0% 61.0% 56.0% 64.0% % 63.4% 60.9% 51.9% 51.2% % 64.4% 65.4% 49.0% 61.2% % 54.3% 58.4% 55.9% 53.4% % 51.6% 54.9% 55.9% 59.0% Students in the top half of their high school graduating class had higher retention rates (67 percent in 2015) than students in the bottom half (40 percent in 2015). Students scoring above the 50 th percentile nationally on the ACT had higher retention rates (63.4 percent in 2015) than students scoring below the 50 th percentile (51.3 percent in 2015). The regional campus retention rate for students with an Ohio University GPA of less than 1.00 was 6% versus a retention rate of 79% for students earning a 3.00 or above.
3 3 Student retention is an important goal at Ohio University. Stable enrollment depends as much on retaining students as it does on recruiting them. In an effort to present information for regional campus faculty and administrators concerning each campus progress with retention, the Office of Institutional Research provides annual student retention data to the regional campuses. This report summarizes that data and presents a number of variables related to retention and withdrawal among different subgroups of full-time, degree-seeking Ohio University students. The last seven first-year student (freshman) classes are compared. The rationale for limiting the retention study to first-year students is that the most significant loss of Ohio University students, as a result of withdrawal, occurs during the first year. Figure 1 presents the retention rates for each regional campus after one year of enrollment. The average regional campus retention rate was 55% in 2015, 54% in 2014, 59% in 2013, 56% in 2012, 60% in 2011, 52% in 2010, 55 % in 2009, and 57% in Ohio University s regional first-year retention rates are slightly higher than comparable institutions nationally. The 2015 National Collegiate Retention and Persistence to Degree Rates by ACT revealed an average retention rate of 55% for open admission two-year public institutions. However, when compared with other university regional campuses in Ohio, Ohio University s retention rates were slightly lower. First-year student retention information from the National Center for Education Statistics indicates an average state-wide retention rate (persistence at the same institution) of 61.3 percent in 2014 (last year available) for university regional campuses in Ohio.
4 4 100% Figure 1 First Year (Freshmen) Retention 90% 80% Percent 70% 60% 50% 40% 66% 63% 64% 65% 64% 62% 60% 61% 61% 61% 58% 59% 57% 56% 56% 54% 55% 53% 54% 55% 56% 56% 51% 51% 53% 53% 52% 52% 51% 51% 48% 48% 49% 43% 41% 30% 20% 10% 0% Chillicothe Eastern Lancaster Southern Zanesville
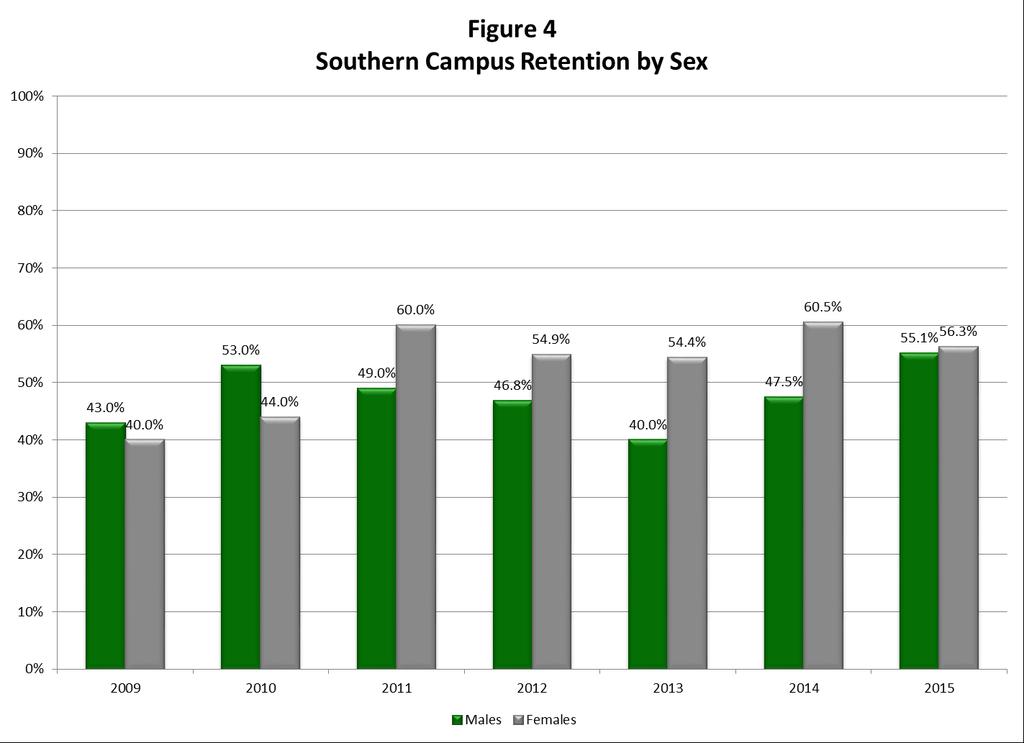
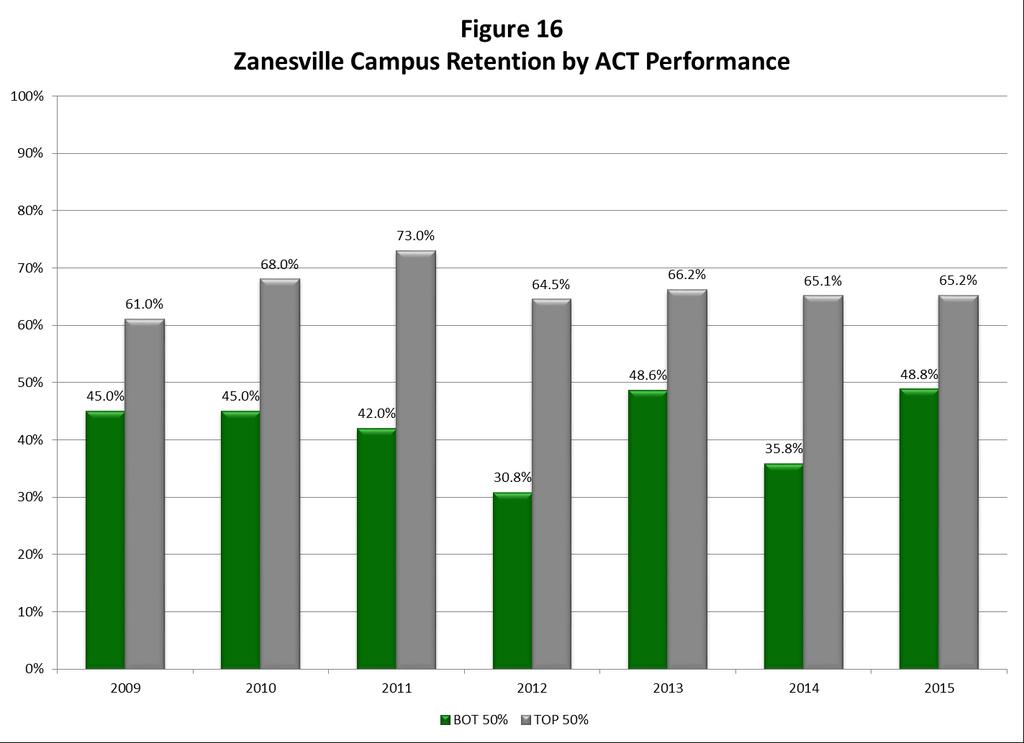
5 5 Nationally, there have been mixed results regarding the retention rates of males and females. Several researchers found higher attrition rates for males, while others have found higher attrition rates for females. These findings suggest that sex alone cannot be used in predicting attrition. Figures 2-6 show the regional campus retention rates for males and females. Again there is high variability with no clear trends emerging except at Southern where female retention tends to be consistently higher than male retention rates since High school performance has been shown to be related to persistence and academic success in college. At Ohio University s regional campuses there is a direct relationship between high school performance and retention. Figures 7-11 show the regional campus retention rates for students in the top and bottom 50 percent of their high school class. Students in the top 50 percent of their high school class had higher retention rates (67 percent in 2014) than students in the bottom 50 percent (37 percent in 2014). Measures of academic aptitude (ACT scores) have been used in predicting academic success and retention. National studies have shown that those who withdraw voluntarily, persistently had higher scores than students who had been academically dismissed. Figures present the regional campus retention rates after one year of enrollment by performance on the ACT test. In this study the top (ACT > 19) and bottom (ACT < 18) 50 percent groups were based on national ACT norms. Ohio University students in the bottom 50 percent (46 percent in 2014) had lower retention rates than students in the top 50 percent (67 percent in 2014). Persistence and performance on ACT appear to be directly related in most years; students in the upper
6 6 groups had higher retention rates. In 2014, all regional campuses had higher retention rates in the top 50% group. College grades and retention rates are presented in Table 1. Students with lower grades had lower retention rates. The regional campus retention rate for students who had end of first semester Ohio University grade point averages below a 1.00 was 6%, for 1.00 to <2.00 the retention rate was 34%, from 2.00 to < 3.00 the rate was 64%, rising to 79% for students earning a GPA of 3.0 or greater. Table 2 expands on Table 1 by adding the retention rates by gender for each regional campus. Overall, males and females had had a higher retention rate than female students for each GPA level except 3.00 or greater where the females retained at 82% compared to 75% of the males. Cells highlighted green are where the retention rate for that group is 5% points or more higher than the other gender s retention rate. Chillicothe females and Southern males tend to have higher retention rates than their opposite sex counterparts but across all campuses retention rates are fairly equivalent between males and females.
7 7
8 8
9 9
10 10
11 11
12 12
13 13
14 14
15 15
16 16
17 17
18 18
19 19
20 20
21 21
22 22 Table 1 Retention Rate by End of First Semester GPA End of Fall GPA Chillicothe Eastern Lancaster Southern Zanesville Total <1.00 8% 0% 5% 8% 7% 6% 1.00 to < % 32% 39% 32% 36% 34% 2.00 to < % 57% 68% 67% 69% 66% > % 77% 78% 84% 83% 79% blank 0% 0% 0% 14% 0% 2% Table 2 Retention Rate by End of First Semester GPA Chillicothe Eastern Lancaster Southern Zanesville Total End of Fall GPA Females Males Females Males Females Males Females Males Females Males Females Males <1.00 9% 6% 0% 0% 0% 8% 5% 12% 7% 8% 5% 8% 1.00 to < % 13% 56% 10% 39% 38% 30% 36% 13% 60% 34% 34% 2.00 to < % 59% 52% 62% 67% 70% 56% 85% 69% 68% 64% 68% > % 69% 79% 75% 74% 84% 83% 88% 87% 71% 80% 78% blank 0% 0% 0% 0% 0% 0% 33% 0% 0% 0% 4% 0%
Evaluation of Teach For America:
 EA15-536-2 Evaluation of Teach For America: 2014-2015 Department of Evaluation and Assessment Mike Miles Superintendent of Schools This page is intentionally left blank. ii Evaluation of Teach For America:
Evaluation of a College Freshman Diversity Research Program
 Evaluation of a College Freshman Diversity Research Program Sarah Garner University of Washington, Seattle, Washington 98195 Michael J. Tremmel University of Washington, Seattle, Washington 98195 Sarah
The Impact of Honors Programs on Undergraduate Academic Performance, Retention, and Graduation
 University of Nebraska - Lincoln DigitalCommons@University of Nebraska - Lincoln Journal of the National Collegiate Honors Council - -Online Archive National Collegiate Honors Council Fall 2004 The Impact
10/6/2017 UNDERGRADUATE SUCCESS SCHOLARS PROGRAM. Founded in 1969 as a graduate institution.
 UNDERGRADUATE SUCCESS SCHOLARS PROGRAM THE UNIVERSITY OF TEXAS AT DALLAS Founded in 1969 as a graduate institution. Began admitting upperclassmen in 1975 and began admitting underclassmen in 1990. 1 A
Undergraduates Views of K-12 Teaching as a Career Choice
 Undergraduates Views of K-12 Teaching as a Career Choice A Report Prepared for The Professional Educator Standards Board Prepared by: Ana M. Elfers Margaret L. Plecki Elise St. John Rebecca Wedel University
A Diverse Student Body
 A Diverse Student Body No two diversity plans are alike, even when expressing the importance of having students from diverse backgrounds. A top-tier school that attracts outstanding students uses this
learning collegiate assessment]
![learning collegiate assessment]](/thumbs/71/66063392.jpg "learning collegiate assessment]") [ collegiate learning assessment] INSTITUTIONAL REPORT 2005 2006 Kalamazoo College council for aid to education 215 lexington avenue floor 21 new york new york 10016-6023 p 212.217.0700 f 212.661.9766
[ collegiate learning assessment] INSTITUTIONAL REPORT 2005 2006 Kalamazoo College council for aid to education 215 lexington avenue floor 21 new york new york 10016-6023 p 212.217.0700 f 212.661.9766
Frequently Asked Questions About OSSI:NIFS for Student Applicants
 Frequently Asked Questions About OSSI:NIFS for Student Applicants The OSSI Frequently Asked Questions link is https://intern.nasa.gov/ossi/web/faq/index.cfm?subaction=view What does OSSI:NIFS stand for?
National Collegiate Retention and. Persistence-to-Degree Rates
 National Collegiate Retention and Persistence-to-Degree Rates Since 1983, ACT has collected a comprehensive database of first-to-second-year retention rates and persistence-to-degree rates. These rates
African American Male Achievement Update
 Report from the Department of Research, Evaluation, and Assessment Number 8 January 16, 2009 African American Male Achievement Update AUTHOR: Hope E. White, Ph.D., Program Evaluation Specialist Department
National Collegiate Retention and Persistence to Degree Rates
 National Collegiate Retention and Persistence to Degree Rates Since 1983, ACT has collected a comprehensive database of first to second year retention rates and persistence to degree rates. These rates
The Diversity of STEM Majors and a Strategy for Improved STEM Retention
 2010 The Diversity of STEM Majors and a Strategy for Improved STEM Retention Cindy P. Veenstra, Ph.D. 1 3/12/2010 A discussion of the definition of STEM for college majors, a summary of interest in the
Cooper Upper Elementary School
 LIVONIA PUBLIC SCHOOLS www.livoniapublicschools.org/cooper 213-214 BOARD OF EDUCATION 213-14 Mark Johnson, President Colleen Burton, Vice President Dianne Laura, Secretary Tammy Bonifield, Trustee Dan
EVALUATION PLAN
 UNIVERSITY OF NEW MEXICO COLLEGE OF EDUCATION 2013-14 EVALUATION PLAN NEW MEXICO PUBLIC EDUCATION DEPARTMENT EDUCATIONAL ACCOUNTABILTY REPORTING SYSTEM MSC05 3040 1 UNIVERSITY OF NEW MEXICO ALBUQUERQUE,
Student attrition at a new generation university
 CAO06288 Student attrition at a new generation university Zhongjun Cao & Roger Gabb Postcompulsory Education Centre Victoria University Abstract Student attrition is an issue for Australian higher educational
Access Center Assessment Report
 Access Center Assessment Report The purpose of this report is to provide a description of the demographics as well as higher education access and success of Access Center students at CSU. College access
READY OR NOT? CALIFORNIA'S EARLY ASSESSMENT PROGRAM AND THE TRANSITION TO COLLEGE
 READY OR NOT? CALIFORNIA'S EARLY ASSESSMENT PROGRAM AND THE TRANSITION TO COLLEGE Michal Kurlaender University of California, Davis Policy Analysis for California Education March 16, 2012 This research
Cooper Upper Elementary School
 LIVONIA PUBLIC SCHOOLS http://cooper.livoniapublicschools.org 215-216 Annual Education Report BOARD OF EDUCATION 215-16 Colleen Burton, President Dianne Laura, Vice President Tammy Bonifield, Secretary
Developing a College-level Speed and Accuracy Test
 Brigham Young University BYU ScholarsArchive All Faculty Publications 2011-02-18 Developing a College-level Speed and Accuracy Test Jordan Gilbert Marne Isakson See next page for additional authors Follow
Understanding the First Year Experience: An Avenue to Explore Trends in Higher Education (Keynote)
") Bowling Green State University ScholarWorks@BGSU University Libraries Faculty Publications University Libraries Spring 5-19-2014 Understanding the First Year Experience: An Avenue to Explore Trends in
Bowling Green State University ScholarWorks@BGSU University Libraries Faculty Publications University Libraries Spring 5-19-2014 Understanding the First Year Experience: An Avenue to Explore Trends in
University-Based Induction in Low-Performing Schools: Outcomes for North Carolina New Teacher Support Program Participants in
 University-Based Induction in Low-Performing Schools: Outcomes for North Carolina New Teacher Support Program Participants in 2014-15 In this policy brief we assess levels of program participation and
Retaining Postdoc Women Through Effective Postdoctoral Policies. Helen Mederer Department of Sociology University of Rhode Island
 Retaining Postdoc Women Through Effective Postdoctoral Policies Helen Mederer Department of Sociology University of Rhode Island Presented at the National Summit on Gender and the Postdoctorate Philadelphia,
OFFICE OF ENROLLMENT MANAGEMENT. Annual Report
 2014-2015 OFFICE OF ENROLLMENT MANAGEMENT Annual Report Table of Contents 2014 2015 MESSAGE FROM THE VICE PROVOST A YEAR OF RECORDS 3 Undergraduate Enrollment 6 First-Year Students MOVING FORWARD THROUGH
Educational Attainment
 A Demographic and Socio-Economic Profile of Allen County, Indiana based on the 2010 Census and the American Community Survey Educational Attainment A Review of Census Data Related to the Educational Attainment
AGENDA Symposium on the Recruitment and Retention of Diverse Populations
 AGENDA Symposium on the Recruitment and Retention of Diverse Populations Tuesday, April 25, 2017 7:30-8:30 a.m. Symposium Check-in and Continental Breakfast Foyer 8:30-9:30 a.m. Opening Keynote Session
Race, Class, and the Selective College Experience
 Race, Class, and the Selective College Experience Thomas J. Espenshade Alexandria Walton Radford Chang Young Chung Office of Population Research Princeton University December 15, 2009 1 Overview of NSCE
UDW+ Student Data Dictionary Version 1.7 Program Services Office & Decision Support Group
 UDW+ Student Data Dictionary Version 1.7 Program Services Office & Decision Support Group 1 Table of Contents Subject Areas... 3 SIS - Term Registration... 5 SIS - Class Enrollment... 12 SIS - Degrees...
Value of Athletics in Higher Education March Prepared by Edward J. Ray, President Oregon State University
 Materials linked from the 5/12/09 OSU Faculty Senate agenda 1. Who Participates Value of Athletics in Higher Education March 2009 Prepared by Edward J. Ray, President Oregon State University Today, more
2005 National Survey of Student Engagement: Freshman and Senior Students at. St. Cloud State University. Preliminary Report.
 National Survey of Student Engagement: Freshman and Senior Students at St. Cloud State University Preliminary Report (December, ) Institutional Studies and Planning National Survey of Student Engagement
EDUCATIONAL ATTAINMENT
 EDUCATIONAL ATTAINMENT By 2030, at least 60 percent of Texans ages 25 to 34 will have a postsecondary credential or degree. Target: Increase the percent of Texans ages 25 to 34 with a postsecondary credential.
Strategic Plan Dashboard Results. Office of Institutional Research and Assessment
 29-21 Strategic Plan Dashboard Results Office of Institutional Research and Assessment Binghamton University Office of Institutional Research and Assessment Definitions Fall Undergraduate and Graduate
Practices Worthy of Attention Step Up to High School Chicago Public Schools Chicago, Illinois
 Step Up to High School Chicago Public Schools Chicago, Illinois Summary of the Practice. Step Up to High School is a four-week transitional summer program for incoming ninth-graders in Chicago Public Schools.
A Decision Tree Analysis of the Transfer Student Emma Gunu, MS Research Analyst Robert M Roe, PhD Executive Director of Institutional Research and
 A Decision Tree Analysis of the Transfer Student Emma Gunu, MS Research Analyst Robert M Roe, PhD Executive Director of Institutional Research and Planning Overview Motivation for Analyses Analyses and
5 Programmatic. The second component area of the equity audit is programmatic. Equity
 5 Programmatic Equity It is one thing to take as a given that approximately 70 percent of an entering high school freshman class will not attend college, but to assign a particular child to a curriculum
Longitudinal Analysis of the Effectiveness of DCPS Teachers
 F I N A L R E P O R T Longitudinal Analysis of the Effectiveness of DCPS Teachers July 8, 2014 Elias Walsh Dallas Dotter Submitted to: DC Education Consortium for Research and Evaluation School of Education
Annual Report to the Public. Dr. Greg Murry, Superintendent
 Annual Report to the Public Dr. Greg Murry, Superintendent 1 Conway Board of Education Ms. Susan McNabb Mr. Bill Clements Mr. Chuck Shipp Mr. Carl Barger Dr. Adam Lamey Dr. Quentin Washispack Mr. Andre
Graduation Initiative 2025 Goals San Jose State
 Graduation Initiative 2025 Goals San Jose State Metric 2025 Goal Most Recent Rate Freshman 6-Year Graduation 71% 57% Freshman 4-Year Graduation 35% 10% Transfer 2-Year Graduation 36% 24% Transfer 4-Year
Do multi-year scholarships increase retention? Results
 Do multi-year scholarships increase retention? In the past, Boise State has mainly offered one-year scholarships to new freshmen. Recently, however, the institution moved toward offering more two and four-year
National Survey of Student Engagement (NSSE) Temple University 2016 Results
 Temple University 2016 Results") Introduction The National Survey of Student Engagement (NSSE) is administered by hundreds of colleges and universities every year (560 in 2016), and is designed to measure the amount of time and effort
Introduction The National Survey of Student Engagement (NSSE) is administered by hundreds of colleges and universities every year (560 in 2016), and is designed to measure the amount of time and effort
2010 National Survey of Student Engagement University Report
 National Survey of Student Engagement University Report Office of Assessment July 2011 NSSE Survey Summary Report The National Survey of Student Engagement (NSSE) is utilized at Kansas State University,
Application for Admission. Medical Laboratory Science Program
 Send To: Kyle Taylor, PhD, MLS(ASCP) CM Auburn Montgomery Medical Laboratory Science Program PO Box 244023 Montgomery, AL 36124 jtaylor@aum.edu Application for Admission Medical Laboratory Science Program
UK Institutional Research Brief: Results of the 2012 National Survey of Student Engagement: A Comparison with Carnegie Peer Institutions
 UK Institutional Research Brief: Results of the 2012 National Survey of Student Engagement: A Comparison with Carnegie Peer Institutions November 2012 The National Survey of Student Engagement (NSSE) has
MEASURING GENDER EQUALITY IN EDUCATION: LESSONS FROM 43 COUNTRIES
 GIRL Center Research Brief No. 2 October 2017 MEASURING GENDER EQUALITY IN EDUCATION: LESSONS FROM 43 COUNTRIES STEPHANIE PSAKI, KATHARINE MCCARTHY, AND BARBARA S. MENSCH The Girl Innovation, Research,
Moving the Needle: Creating Better Career Opportunities and Workforce Readiness. Austin ISD Progress Report
 Moving the Needle: Creating Better Career Opportunities and Workforce Readiness Austin ISD Progress Report 2013 A Letter to the Community Central Texas Job Openings More than 150 people move to the Austin
U VA THE CHANGING FACE OF UVA STUDENTS: SSESSMENT. About The Study
 About The Study U VA SSESSMENT In 6, the University of Virginia Office of Institutional Assessment and Studies undertook a study to describe how first-year students have changed over the past four decades.
DEPARTMENT OF PHILOSOPHY PROGRAM REVIEW REVIEW PROCESS
 DEPARTMENT OF PHILOSOPHY PROGRAM REVIEW REVIEW PROCESS The Department of Philosophy prepared a self-study following program review guidelines. A two-person external review team visited the campus; reviewed
NDPC-SD Data Probes Worksheet
 NDPC-SD Data Probes Worksheet This worksheet from the National Dropout Prevention Center for Students with Disabilities (NDPC- SD) is an optional tool to help schools organize multiple years of student
What Is The National Survey Of Student Engagement (NSSE)?
?") National Survey of Student Engagement (NSSE) 2000 Results for Montclair State University What Is The National Survey Of Student Engagement (NSSE)? US News and World Reports Best College Survey is due next
National Survey of Student Engagement (NSSE) 2000 Results for Montclair State University What Is The National Survey Of Student Engagement (NSSE)? US News and World Reports Best College Survey is due next
MAINE 2011 For a strong economy, the skills gap must be closed.
 For a strong economy, the skills gap must be closed. 62% 36% 26% By 2020, jobs requiring a career certificate or college degree Skills gap Too few students make it through college. MEMBER Maine adults
Segmentation Study of Tulsa Area Higher Education Needs Ages 36+ March Prepared for: Conducted by:
 Segmentation Study of Tulsa Area Higher Education Needs Ages 36+ March 2004 * * * Prepared for: Tulsa Community College Tulsa, OK * * * Conducted by: Render, vanderslice & Associates Tulsa, Oklahoma Project
Profile of BC College Transfer Students admitted to the University of Victoria
 Profile of BC College Transfer Students admitted to the University of Victoria 23/4 to 27/8 Prepared by: Jim Martell & Alan Wilson Office of Institutional Planning and Analysis, University of Victoria
STEM Academy Workshops Evaluation
 OFFICE OF INSTITUTIONAL RESEARCH RESEARCH BRIEF #882 August 2015 STEM Academy Workshops Evaluation By Daniel Berumen, MPA Introduction The current report summarizes the results of the research activities
Office of Institutional Effectiveness 2012 NATIONAL SURVEY OF STUDENT ENGAGEMENT (NSSE) DIVERSITY ANALYSIS BY CLASS LEVEL AND GENDER VISION
 DIVERSITY ANALYSIS BY CLASS LEVEL AND GENDER VISION") Office of Institutional Effectiveness 2012 NATIONAL SURVEY OF STUDENT ENGAGEMENT (NSSE) DIVERSITY ANALYSIS BY CLASS LEVEL AND GENDER VISION We seek to become recognized for providing bright and curious
Office of Institutional Effectiveness 2012 NATIONAL SURVEY OF STUDENT ENGAGEMENT (NSSE) DIVERSITY ANALYSIS BY CLASS LEVEL AND GENDER VISION We seek to become recognized for providing bright and curious
Introduction to Sociology SOCI 1101 (CRN 30025) Spring 2015
 Spring 2015") Introduction to Sociology SOCI 1101 (CRN 30025) Spring 2015 INSTRUCTOR: CLASS LOCATION: Dr. Jewrell Rivers Room 126, Bowen Hall CLASS DAYS/TIMES: Monday, Wednesday, Friday, 10:00-10:50 OFFICE LOCATION:
Introduction to Sociology SOCI 1101 (CRN 30025) Spring 2015 INSTRUCTOR: CLASS LOCATION: Dr. Jewrell Rivers Room 126, Bowen Hall CLASS DAYS/TIMES: Monday, Wednesday, Friday, 10:00-10:50 OFFICE LOCATION:
Demographic Survey for Focus and Discussion Groups
 Appendix F Demographic Survey for Focus and Discussion Groups Demographic Survey--Lesbian, Gay, and Bisexual Discussion Group Demographic Survey Faculty with Disabilities Discussion Group Demographic Survey
08-09 DATA REVIEW AND ACTION PLANS Candidate Reports
 08-09 DATA REVIEW AND ACTION PLANS Candidate Reports Data Observations Implications for Change Action for Change Admitted to TEP Only ~24% of students Recruit more secondary majors Develop recruitment
Physician Assistant Program Goals, Indicators and Outcomes Report
 Physician Assistant Program Goals, Indicators and Outcomes Report 2007-2016 UAB PA Program Goals and Outcomes University of Alabama at Birmingham Master of Science in Physician Assistant Studies Physician
Rwanda. Out of School Children of the Population Ages Percent Out of School 10% Number Out of School 217,000
 Rwanda Out of School Children of the Population Ages 7-14 Number Out of School 217, Percent Out of School % Source: Demographic and Health Survey (DHS) 2 Comparison of Rates of Out of School Children Ages
Strategic Planning for Retaining Women in Undergraduate Computing
 for Retaining Women Workbook An NCWIT Extension Services for Undergraduate Programs Resource Go to /work.extension.html or contact us at es@ncwit.org for more information. 303.735.6671 info@ncwit.org Strategic
State of New Jersey
 OVERVIEW 1213 GRADE SPAN KG6 116946 GALLOWAY, NEW JERSEY 85 This school's academic performance is about average when compared to schools across the state. Additionally, its academic performance is very
Miami-Dade County Public Schools
 ENGLISH LANGUAGE LEARNERS AND THEIR ACADEMIC PROGRESS: 2010-2011 Author: Aleksandr Shneyderman, Ed.D. January 2012 Research Services Office of Assessment, Research, and Data Analysis 1450 NE Second Avenue,
Western Australia s General Practice Workforce Analysis Update
 Western Australia s General Practice Workforce Analysis Update NOVEMBER 2015 PUBLISHED MAY 2016 Rural Health West This work is copyright. Apart from any use as permitted under the Copyright Act 1968, no
Using Choice as a Writing Intervention to Investigate Gender Differences
 Minnesota State University, Mankato Cornerstone: A Collection of Scholarly and Creative Works for Minnesota State University, Mankato Undergraduate Research Symposium Undergraduate Research Symposium 2014
NCEO Technical Report 27
 Home About Publications Special Topics Presentations State Policies Accommodations Bibliography Teleconferences Tools Related Sites Interpreting Trends in the Performance of Special Education Students
Albany Technical College Overview Goals Student Success and Implementation Team Conclusion Next Steps...
 ?33333 Dr. Josephine Reed-Taylor Chief Academic Officer Technical College System of Georgia 1800 Century Place, NE Atlanta, Georgia 30345-4304 December 2015 Contents Albany Technical College... 8 Overview...
Program Review
 De Anza College, Cupertino, CA 1 Description and Mission of the Program A) The Manufacturing and CNC Program (MCNC) offers broad yet in-depth curriculum that imparts a strong foundation for direct employment
What is related to student retention in STEM for STEM majors? Abstract:
 What is related to student retention in STEM for STEM majors? Abstract: The purpose of this study was look at the impact of English and math courses and grades on retention in the STEM major after one
BLACK MEN: A CASE STUDY OF COMMUNITY COLLEGE RETENTION AND GRADUATION. A thesis. presented by. Kristine M. Kim. The School of Education
 1 BLACK MEN: A CASE STUDY OF COMMUNITY COLLEGE RETENTION AND GRADUATION A thesis presented by Kristine M. Kim to The School of Education in partial fulfillment of the requirement for the degree of Doctor
Student Support Services Evaluation Readiness Report. By Mandalyn R. Swanson, Ph.D., Program Evaluation Specialist. and Evaluation
 Student Support Services Evaluation Readiness Report By Mandalyn R. Swanson, Ph.D., Program Evaluation Specialist and Bethany L. McCaffrey, Ph.D., Interim Director of Research and Evaluation Evaluation
LaGuardia Community College Retention Committee Report June, 2006
 LaGuardia Community College Retention Committee Report June, 2006 Committee Membership: Paul Arcario (Academic Affairs, Chair), Belkharraz Abderrazak (Mathematics), Deirdre Aherne (Academic Affairs), Barbara
Port Graham El/High. Report Card for
 School: District: Kenai Peninsula Grades: K - 12 School Enrollment: 20 Title I School? No Title 1 Program: Accreditation: Report Card for 2008-2009 A Title 1 school receives federal money in support low-achieving
Student Mobility Rates in Massachusetts Public Schools
 Student Mobility Rates in Massachusetts Public Schools Introduction The Massachusetts Department of Elementary and Secondary Education (ESE) calculates and reports mobility rates as part of its overall
National Survey of Student Engagement at UND Highlights for Students. Sue Erickson Carmen Williams Office of Institutional Research April 19, 2012
 National Survey of Student Engagement at Highlights for Students Sue Erickson Carmen Williams Office of Institutional Research April 19, 2012 April 19, 2012 Table of Contents NSSE At... 1 NSSE Benchmarks...
University of Utah. 1. Graduation-Rates Data a. All Students. b. Student-Athletes
 University of Utah FRESHMAN-COHORT GRADUATION RATES All Students Student-Athletes # 2009-10 Graduation Rate 64% 64% Four-Class Average 61% 64% Student-Athlete Graduation Success Rate 87% 1. Graduation-Rates
SORORITY AND FRATERNITY AFFAIRS POLICY ON EXPANSION FOR SOCIAL SORORITIES AND FRATERNITIES
 UNIVERSITY OF FLORIDA DIVISION OF STUDENT AFFAIRS DEPARTMENT OF STUDENT ACTIVITIES AND INVOLVEMENT SORORITY AND FRATERNITY AFFAIRS POLICY ON EXPANSION FOR SOCIAL SORORITIES AND FRATERNITIES The Policy
Why OUT-OF-LEVEL Testing? 2017 CTY Johns Hopkins University
 Why OUT-OF-LEVEL Testing? BEFORE WE GET STARTED Welcome and introductions Today s session will last about 20 minutes Feel free to ask questions at any time by speaking into your phone or by using the Q&A
Teacher Supply and Demand in the State of Wyoming
 Teacher Supply and Demand in the State of Wyoming Supply Demand Prepared by Robert Reichardt 2002 McREL To order copies of Teacher Supply and Demand in the State of Wyoming, contact McREL: Mid-continent
Prospective Student Information
 Medical Assisting Program Prospective Student Information The Medical Assisting Program prepares individuals as competent entry level medical assistants in cognitive (knowledge), psychomotor (skills),
New Jersey Institute of Technology Newark College of Engineering
 New Jersey Institute of Technology Newark College of Engineering AND IN ELECTRICAL AND COMPUTER ENGINEERING Program Review Last Update: Nov. 23, 2005 MISSION STATEMENTS DOCTOR OF PHILOSOPHY IN ELECTRICAL
1. Faculty responsible for teaching those courses for which a test is being used as a placement tool.
 Studies Addressing Content-Related Validity Materials needed 1. A listing of prerequisite knowledge and skills for each of the courses for which a test is being used as a placement tool, i.e., identify
Junior (61-90 semester hours or quarter hours) Two-year Colleges Number of Students Tested at Each Institution July 2008 through June 2013
 Two-year Colleges Number of Students Tested at Each Institution July 2008 through June 2013") Number of Students Tested at Each Institution July 2008 through June 2013 List of Institutions Number of School Name Students AIKEN TECHNICAL COLLEGE, SC 119 ARKANSAS NORTHEASTERN COLLEGE, AR 66 ASHLAND
Number of Students Tested at Each Institution July 2008 through June 2013 List of Institutions Number of School Name Students AIKEN TECHNICAL COLLEGE, SC 119 ARKANSAS NORTHEASTERN COLLEGE, AR 66 ASHLAND
National Survey of Student Engagement Spring University of Kansas. Executive Summary
 National Survey of Student Engagement Spring 2010 University of Kansas Executive Summary Overview One thousand six hundred and twenty-one (1,621) students from the University of Kansas completed the web-based
Institution of Higher Education Demographic Survey
 Institution of Higher Education Demographic Survey Data from all participating institutions are aggregated for the comparative studies by various types of institutional characteristics. For that purpose,
Chapters 1-5 Cumulative Assessment AP Statistics November 2008 Gillespie, Block 4
 Chapters 1-5 Cumulative Assessment AP Statistics Name: November 2008 Gillespie, Block 4 Part I: Multiple Choice This portion of the test will determine 60% of your overall test grade. Each question is
Principal vacancies and appointments
 Principal vacancies and appointments 2009 10 Sally Robertson New Zealand Council for Educational Research NEW ZEALAND COUNCIL FOR EDUCATIONAL RESEARCH TE RŪNANGA O AOTEAROA MŌ TE RANGAHAU I TE MĀTAURANGA
1GOOD LEADERSHIP IS IMPORTANT. Principal Effectiveness and Leadership in an Era of Accountability: What Research Says
 B R I E F 8 APRIL 2010 Principal Effectiveness and Leadership in an Era of Accountability: What Research Says J e n n i f e r K i n g R i c e For decades, principals have been recognized as important contributors
National Survey of Student Engagement (NSSE)
") 2008 NSSE National Survey of Student Engagement (NSSE) Understanding SRU Student Engagement Patterns of Evidence NSSE Presentation Overview What is student engagement? What do we already know about student
2008 NSSE National Survey of Student Engagement (NSSE) Understanding SRU Student Engagement Patterns of Evidence NSSE Presentation Overview What is student engagement? What do we already know about student
3/6/2009. Residence Halls & Strategic t Planning Overview. Residence Halls Overview. Residence Halls: Marapai Supai Kachina
 Residence Halls & Strategic t Planning Overview District Governing Board 3.10.09 Residence Halls Overview Residence Halls: Marapai Supai Kachina 1 Supai Hall Kachina Hall Marapai Hall Marapai Hall 1968
CIN-SCHOLARSHIP APPLICATION
 CATAWBA INDIAN NATION SCHOLARSHIP COMMITTEE 2014-2015 CIN-SCHOLARSHIP APPLICATION The Catawba Indian Nation Higher Education Scholarship Committee Presents: THE CATAWBA INDIAN NATION SCHOLARSHIP PROGRAM
AP Statistics Summer Assignment 17-18
 AP Statistics Summer Assignment 17-18 Welcome to AP Statistics. This course will be unlike any other math class you have ever taken before! Before taking this course you will need to be competent in basic
2012 New England Regional Forum Boston, Massachusetts Wednesday, February 1, More Than a Test: The SAT and SAT Subject Tests
 2012 New England Regional Forum Boston, Massachusetts Wednesday, February 1, 2012 More Than a Test: The SAT and SAT Subject Tests 1 Presenters Chris Lucier Vice President for Enrollment Management, University
Data Glossary. Summa Cum Laude: the top 2% of each college's distribution of cumulative GPAs for the graduating cohort. Academic Honors (Latin Honors)
") Institutional Research and Assessment Data Glossary This document is a collection of terms and variable definitions commonly used in the universities reports. The definitions were compiled from various
Institutional Research and Assessment Data Glossary This document is a collection of terms and variable definitions commonly used in the universities reports. The definitions were compiled from various
Shelters Elementary School
 Shelters Elementary School August 2, 24 Dear Parents and Community Members: We are pleased to present you with the (AER) which provides key information on the 23-24 educational progress for the Shelters
Ecosystem: Description of the modules:
 Nanotechnology Solutions to Engineering Grand Challenges Edward W. Davis Auburn University Polapradada Raju Auburn University Virginia Davis Auburn University Abstract: Nanotechnology is becoming, and
National Survey of Student Engagement
 National Survey of Student Engagement Report to the Champlain Community Authors: Michelle Miller and Ellen Zeman, Provost s Office 12/1/2007 This report supplements the formal reports provided to Champlain
Course Law Enforcement II. Unit I Careers in Law Enforcement
 Course Law Enforcement II Unit I Careers in Law Enforcement Essential Question How does communication affect the role of the public safety professional? TEKS 130.294(c) (1)(A)(B)(C) Prior Student Learning
The University of North Carolina Strategic Plan Online Survey and Public Forums Executive Summary
 The University of North Carolina Strategic Plan Online Survey and Public Forums Executive Summary The University of North Carolina General Administration January 5, 2017 Introduction The University of
For international students wishing to study Japanese language at the Japanese Language Education Center in Term 1 and/or Term 2, 2017
 For international students wishing to study language at the Language Education Center in Term 1 and/or Term 2, 2017 Overview of the Intensive Language Course The Language Education Center at Saitama University
Guinea. Out of School Children of the Population Ages Percent Out of School 46% Number Out of School 842,000
 Guinea Out of School Children of the Population Ages 7-14 Number Out of School 842, Percent Out of School 46% Source: Demographic and Health Survey (DHS) 25 Comparison of Rates of Out of School Children
The University of Michigan-Flint. The Committee on the Economic Status of the Faculty. Annual Report to the Regents. June 2007
 The University of Michigan-Flint The Committee on the Economic Status of the Faculty Annual Report to the Regents June 2007 Committee Chair: Stephen Turner (College of Arts and Sciences) Regular Members: