UNIVERSITY ADMINISTRATORS FORUM February 6, 2013
|
|
|
- Loren Baker
- 6 years ago
- Views:
Transcription


1 UNIVERSITY ADMINISTRATORS FORUM February 6, 2013 UNC FALL 2012 ENROLLMENT REPORT North Carolina Agricultural and Technical State University
2 Executive Summary In accordance with the University of North Carolina General Administration s (UNC-GA) responsibility to report to the Board of Governors (BOG), elected officials, and the general public, the Fall 2012 Enrollment Report presents the trends in enrollment across the system, focusing on total headcount and specific, strategic areas. 2
3 The following areas are detailed throughout the report: I. Enrollment II. Minority Enrollment III. NC HS Graduates as First-Time, Full-Time Freshmen IV. Dual Enrollment in the UNC System V. Transfer Students VI. Distance Education VII. Resident/Non- Resident First-Time, Full-Time Freshmen SAT Scores VIII. Reviewing the Ten- Year Enrollment Plan 3
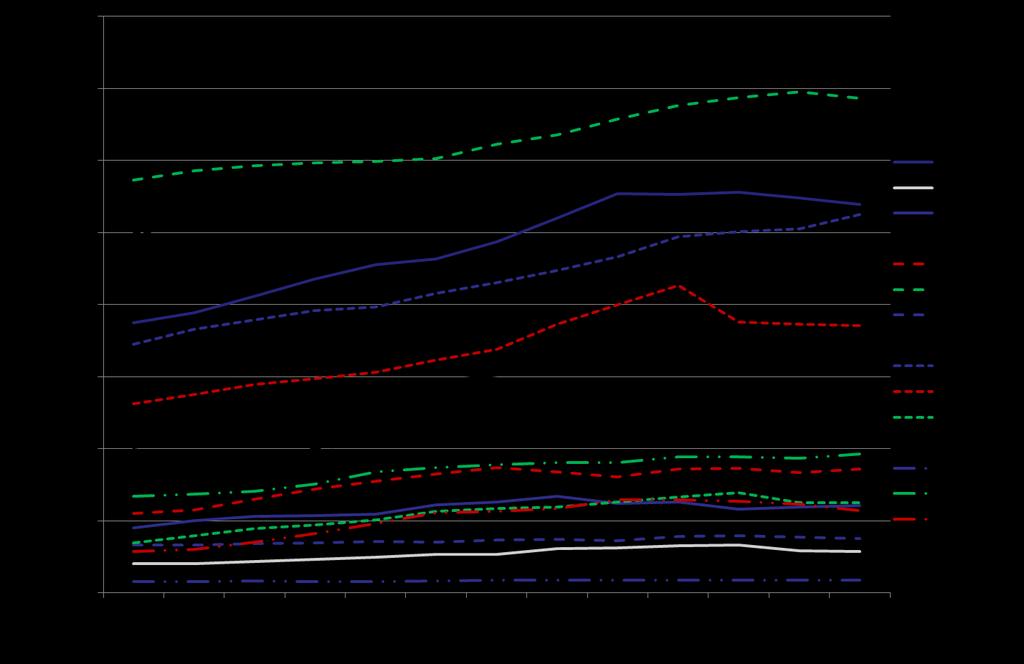
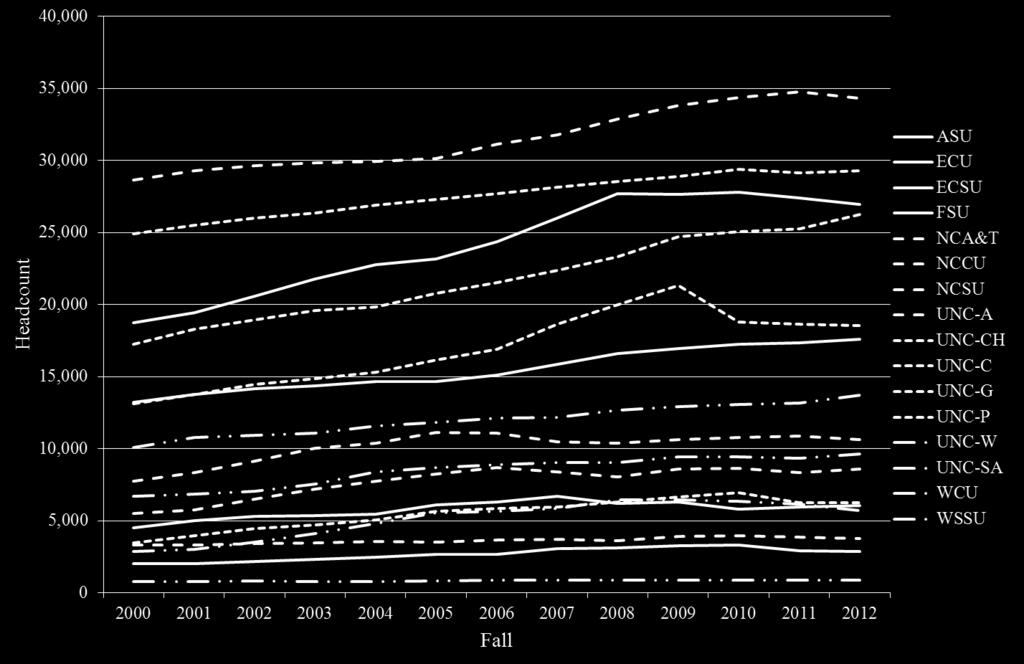
4 I. Enrollment The Fall 2012 total UNC headcount enrollment was 221,010 students, an increase of 705 students or 0.3% from the previous fall. While this increase is notable, it is minor when compared to the previous decade s rapid expansion. 4
5 I. Enrollment (cont d) Since 2003, overall enrollment increased 17% with the annual growth rate from Fall 2003 through Fall 2009 averaging approximately 3%. From Fall 2009 through Fall 2011, however, there were three consecutive years in which enrollment declined, with Fall 2012 returning to a positive trend. 5
6 I. Enrollment (cont d) Undergraduate enrollment changed from 174,805 in Fall 2011 to 175,760, an increase of 955 students or 0.5% (compared to 0.3% decrease the previous year). Graduate enrollment continued to decrease for the second year, dropping from 45,500 to 45,250 (-0.5%). 6
7 ww w.nc
8 Headcount North Carolina Agricultural and Technical State University ASU ECU ECSU FSU NCA&T NCCU NCSU UNC-A UNC-CH UNC-C UNC-G UNC-P UNC-W UNC-SA WCU WSSU Fall
9 Fall 2012 UNC Enrollment (annual change in parentheses) Total Headcount Enrollment»221,010 (+0.3%) Undergraduate Headcount»175,760 (+0.5%) Master s Headcount»31,966 (-1.7%) Doctoral Research and Professional Headcount»13,284 (+2.4%) 9

10 Figure 1: Headcount by Enrollment by degree-level, Research Institutions (Fall, 2012) 10
11 Figure 2: Headcount by Enrollment by degree-level, Master s Institutions (Fall, 2012) 11
12 Figure 3: Headcount by Enrollment by degreelevel, Baccalaureate Institutions (Fall, 2012) 12
13 II. Minority Enrollment The total enrollment of minority students for Fall 2012 was 66,111, representing 32.9% of the University s enrollment among those for whom race was reported. This was a 0.4% increase over Fall 2011, when total minority enrollment was 65,
14 Total Headcounts and Percentages by Ethnic Groups African Americans: 46,723 (down 1.2% or 575 students) American Indian: 2,076 (down 2.5% or 51 students) Asian students: 7,458 (up 4.0% or 298 students) Hispanic students: 9,658 (up 6.4% or 622 students) 14
15 II. Minority Enrollment (cont d) African American enrollment: decreased at the historically black institutions (-1.8%), but increased slightly at the historically white institutions (+0.01%). 15
16 II. Minority Enrollment (cont d) This is the 15 th consecutive year that African American students have exceeded 10% of the total enrollment at the historically white institutions. Currently 54.73% of UNC s African American students enroll at historically black institutions, down from over 60% in
")
17 Figure 4: Minority Headcount Enrollment by Race, Research Institutions (Fall, 2012) 17
")
18 Figure 5: Minority Headcount Enrollment by Race, Master s Institutions (Fall, 2012) 18
")
19 Figure 5: Minority Headcount Enrollment by Race, Baccalaureate Institutions (Fall, 2012) 19
20 Fall 2012 UNC Minority Enrollment (annual change in parentheses) Total African American Headcount»46,723 (-1.2%) Total American Indian Headcount»2,076 (-2.5%) Total Asian Headcount»7,458 (+4.0%) Total Hispanic Headcount»9,658 (+6.4%) 20
21 III. NC HS Graduates as First-Time, Full-Time Freshmen A quarter (25.7%) of recent North Carolina high school graduates entered a UNC institution in Fall 2012, a decline from 26.3% the previous year. 21
22 IV. Dual Enrollment in the UNC System UNC has six early college high schools at FSU (two), NCA&T, NCCU, NCSU, and UNCW, and two middle college high schools at UNCG and NCA&T. The combined headcount taking college courses in those programs is 1,
23 V. Transfer Students The total number of transfer students entering UNC institutions grew 7.5% from Fall 2011 to Fall 2012, totaling 14,749 students. 23
")
24 Figure 7: New Transfer Headcount Enrollment by Origin, Research Institutions (Fall, 2012) 24
")
25 Figure 8: New Transfer Headcount Enrollment by Origin, Master s Institutions (Fall, 2012) 25
")
26 Figure 9: New Transfer Headcount Enrollment by Origin, Baccalaureate Institutions (Fall, 2012) 26
27 Fall 2012 Transfer Headcount (annual change in parentheses) Total New Transfer Students»14,749 (+7.5%) Total NCCCS Transfers»7,905 (+10.8%) Total UNC to UNC Transfers»2,278 (+4.4%) Total NC Private to UNC Transfers»1,172 (+11.9%) Total Out of State Transfers»3,394 (+1.1%) 27
28 VI. Distance Education The total number of students enrolled in distance education was 32,973, a 10.4% decrease from the prior year with the decline primarily stemming from policy changes at NCSU. As might be expected, DE courses are especially convenient for nontraditional students (age 25 and older), who constitute two-thirds of all students taking a distance education course. 28
29 VI. Distance Education (cont d) This total number, however, is best understood as two distinct populations of students that utilize DE: 1. Students who are only enrolled in DE courses. 2. Students who enroll in both traditional, campus classes and DE courses (regular term students). 29
30 VI. Distance Education (cont d) The first population, those only enrolling in DE courses at UNC institutions, increased by 370 (+1.8%) to 21,224. The second population of DE students, defined as those enrolled in both traditional, campus classes and online DE courses simultaneously was 11,749 in Fall 2012, a decrease of 26.2%. This steep decline was largely due to a change in institutional policy at NCSU. 30
31 Figure 10: All Distance Education Enrollment by degreelevel, Research Institutions (Fall, 2012) 31
")
32 Figure 11: All Distance Education Enrollment by degreelevel, Master s Institutions (Fall, 2012) 32
33 Figure 12: All Distance Education Enrollment by degreelevel, Baccalaureate Institutions (Fall, 2012) 33
34 Fall 2012 Distance Education Enrollment (annual change in parentheses) All Distance Education (online and off-site only and regular term students)»32,973 (-10.4%) Distance Education Students Only (online and off-site)»1,224 (+1.8%) Regular Term Students Only (online, off-site, and traditional classroom instruction)»11,749 (-26.2%)»Reduction is largely due to a policy and reporting change at NCSU 34
35 VII. Resident/Non-Resident First-Time, Full-Time Freshmen Of new freshmen, 85.5% were from North Carolina, a decrease of 0.08% from Fall This year, one campus exceeded the 18 percent cap on the number of freshmen from out-of-state. 35
36 Fall 2012: Number and Percentage of First-Time, Out-of-State, Degree Seeking Undergraduate Students Number of New Students Number of New In-State Students Number of New Out-of-State Students ASU % ECU % ECSU % FSU % NCA&T* % NCCU % NCSU % UNCA % UNC-CH % UNCC % UNCG % UNCP % UNCW % UNCSA % WCU % WSSU % UNC Total % Source: IRA/SDF.GR302/4DEC12 *Out-of-State engineering students at NCA&T are excluded. Out-of-State Student Percentage 36
37 VIII. SAT Scores The average combined SAT for Fall 2012 UNC freshmen was 1091, down slightly from the Fall 2011 average of The UNC Fall 2012 average combined SAT score was still higher than the national average of
38 Figure 13: Average SAT Score,
39 IX. Reviewing the Ten-Year Enrollment Plan As part of the strategic planning process, in 2002 the UNC BOG established 10-year enrollment targets for the system s institutions. The system-wide target for Fall 2012 was 235,180 and the actual enrollment was 221,010 (-6%). 39
40 Figure 14: 2012 Headcount Enrollments and Target 40
41 Conclusion While there has been a slight decrease in the number of North Carolina high school graduates attending UNC, overall there are general increases in minority and transfer student enrollment, and high school students participating in early college coursework. 41
42 Conclusion While the system might anticipate slight growth increases in the near future, these will likely come through a strategic focus on the non-traditional and underserved populations outlined in this document. 42
43 Conclusion These trends from the Fall 2012 enrollment data are largely encouraging and identify areas on which the UNC system and constituent campuses can focus to continue serving the state of North Carolina moving forward. 43
44 UNC Fall Headcount Enrollment 2011 vs Total Headcount Enrollment Undergraduate Enrollment Master's Enrollment Doctoral Research and Professional % % % % Change Change Change Change Change Change Change Change ASU 17,344 17, % 15,460 15, % 1,790 1, % (7) -7.4% ECU 27,386 26,947 (439) -1.6% 21,589 21,298 (291) -1.3% 4,957 4,715 (242) -4.9% % ECSU 2,930 2,878 (52) -1.8% 2,836 2,760 (76) -2.7% % FSU 5,930 6, % 5,162 5, % % (3) -5.5% NCA&T 10,881 10,636 (245) -2.3% 9,206 8,923 (283) -3.1% 1,437 1, % % NCCU 8,359 8, % 6,416 6, % 1,408 1,356 (52) -3.7% % NCSU 34,767 34,340 (427) -1.2% 25,176 24,833 (343) -1.4% 6,123 5,982 (141) -2.3% 3,468 3, % UNCA 3,863 3,751 (112) -2.9% 3,814 3,693 (121) -3.2% % UNC-CH 29,137 29, % 18,430 18, % 4,722 4, % 5,985 5,966 (19) -0.3% UNCC 25,277 26, % 20,283 21, % 4,177 4, % % UNCG 18,627 18,516 (111) -0.6% 14,898 15, % 2,936 2,660 (276) -9.4% % UNCP 6,251 6, % 5,494 5, % % UNCW 13,145 13, % 11,950 12, % 1,138 1, % % UNCSA (13) -1.5% (12) -1.6% (1) -0.8% WCU 9,352 9, % 7,627 7, % 1,657 1,539 (118) -7.1% % WSSU 6,163 5,689 (474) -7.7% 5,692 5,245 (447) -7.9% (53) -11.9% % UNC System 220, , % 174, , % 32,523 31,966 (557) -1.7% 12,977 13, % Source: IRA/SDF.GR.302/4Dec12 44
45 Questions? 45
The University of North Carolina Strategic Plan Online Survey and Public Forums Executive Summary
 The University of North Carolina Strategic Plan Online Survey and Public Forums Executive Summary The University of North Carolina General Administration January 5, 2017 Introduction The University of
Enrollment Trends. Past, Present, and. Future. Presentation Topics. NCCC enrollment down from peak levels
 Presentation Topics 1. Enrollment Trends 2. Attainment Trends Past, Present, and Future Challenges & Opportunities for NC Community Colleges August 17, 217 Rebecca Tippett Director, Carolina Demography
University-Based Induction in Low-Performing Schools: Outcomes for North Carolina New Teacher Support Program Participants in
 University-Based Induction in Low-Performing Schools: Outcomes for North Carolina New Teacher Support Program Participants in 2014-15 In this policy brief we assess levels of program participation and
Student Mobility Rates in Massachusetts Public Schools
 Student Mobility Rates in Massachusetts Public Schools Introduction The Massachusetts Department of Elementary and Secondary Education (ESE) calculates and reports mobility rates as part of its overall
SAT Results December, 2002 Authors: Chuck Dulaney and Roger Regan WCPSS SAT Scores Reach Historic High
 ABOUT THE SAT 2001-2002 SAT Results December, 2002 Authors: Chuck Dulaney and Roger Regan WCPSS SAT Scores Reach Historic High The Scholastic Assessment Test (SAT), more formally known as the SAT I: Reasoning
READY OR NOT? CALIFORNIA'S EARLY ASSESSMENT PROGRAM AND THE TRANSITION TO COLLEGE
 READY OR NOT? CALIFORNIA'S EARLY ASSESSMENT PROGRAM AND THE TRANSITION TO COLLEGE Michal Kurlaender University of California, Davis Policy Analysis for California Education March 16, 2012 This research
University of Utah. 1. Graduation-Rates Data a. All Students. b. Student-Athletes
 University of Utah FRESHMAN-COHORT GRADUATION RATES All Students Student-Athletes # 2009-10 Graduation Rate 64% 64% Four-Class Average 61% 64% Student-Athlete Graduation Success Rate 87% 1. Graduation-Rates
Educational Attainment
 A Demographic and Socio-Economic Profile of Allen County, Indiana based on the 2010 Census and the American Community Survey Educational Attainment A Review of Census Data Related to the Educational Attainment
Graduate Division Annual Report Key Findings
 Graduate Division 2010 2011 Annual Report Key Findings Trends in Admissions and Enrollment 1 Size, selectivity, yield UCLA s graduate programs are increasingly attractive and selective. Between Fall 2001
File Print Created 11/17/2017 6:16 PM 1 of 10
 Success - Key Measures Graduation Rate: 4-, 5-, and 6-Year 9. First-time, full-time entering, degree-seeking, students enrolled in a minimum of 12 SCH their first fall semester who have graduated from
African American Male Achievement Update
 Report from the Department of Research, Evaluation, and Assessment Number 8 January 16, 2009 African American Male Achievement Update AUTHOR: Hope E. White, Ph.D., Program Evaluation Specialist Department
2012 ACT RESULTS BACKGROUND
 Report from the Office of Student Assessment 31 November 29, 2012 2012 ACT RESULTS AUTHOR: Douglas G. Wren, Ed.D., Assessment Specialist Department of Educational Leadership and Assessment OTHER CONTACT
https://secure.aacte.org/apps/peds/print_all_forms.php?view=report&prin...
 1 of 35 4/25/2012 9:56 AM A» 2011 PEDS» Institutional Data inst id: 3510 Institutional Data A_1 Institutional Information This information will be used in all official references to your institution. Institution
ADMISSION TO THE UNIVERSITY
 ADMISSION TO THE UNIVERSITY William Carter, Director of Admission College Hall 140. MSC 128. Extension 2315. Texas A&M University-Kingsville adheres to high standards of academic excellence and admits
Shelters Elementary School
 Shelters Elementary School August 2, 24 Dear Parents and Community Members: We are pleased to present you with the (AER) which provides key information on the 23-24 educational progress for the Shelters
U VA THE CHANGING FACE OF UVA STUDENTS: SSESSMENT. About The Study
 About The Study U VA SSESSMENT In 6, the University of Virginia Office of Institutional Assessment and Studies undertook a study to describe how first-year students have changed over the past four decades.
Frank Phillips College. Accountability Report
 Frank Phillips College Accountability Report January 2016 Accountability System, January 2016 1 of 22 Participation - Key Measures Enrollment 1. Fall Headcount (Unduplicated) Fall 2000 Fall 2014 Fall 2015
Evaluation of a College Freshman Diversity Research Program
 Evaluation of a College Freshman Diversity Research Program Sarah Garner University of Washington, Seattle, Washington 98195 Michael J. Tremmel University of Washington, Seattle, Washington 98195 Sarah
Strategic Plan Dashboard Results. Office of Institutional Research and Assessment
 29-21 Strategic Plan Dashboard Results Office of Institutional Research and Assessment Binghamton University Office of Institutional Research and Assessment Definitions Fall Undergraduate and Graduate
Facts and Figures Office of Institutional Research and Planning
 Facts and Figures 2008-2009 Office of Institutional Research and Planning Office of Institutional Research Fall 2009 Facts at a Glance Credit Headcount Enrollments Headcount Ethnicity Headcount Percent
STEM Academy Workshops Evaluation
 OFFICE OF INSTITUTIONAL RESEARCH RESEARCH BRIEF #882 August 2015 STEM Academy Workshops Evaluation By Daniel Berumen, MPA Introduction The current report summarizes the results of the research activities
Kansas Adequate Yearly Progress (AYP) Revised Guidance
 Revised Guidance") Kansas State Department of Education Kansas Adequate Yearly Progress (AYP) Revised Guidance Based on Elementary & Secondary Education Act, No Child Left Behind (P.L. 107-110) Revised May 2010 Revised May
Kansas State Department of Education Kansas Adequate Yearly Progress (AYP) Revised Guidance Based on Elementary & Secondary Education Act, No Child Left Behind (P.L. 107-110) Revised May 2010 Revised May
12-month Enrollment
 12-month Enrollment 2016-17 Institution: Potomac State College of West Virginia University (237701) Overview 12-month Enrollment Overview The 12-Month Enrollment component collects unduplicated student
Like much of the country, Detroit suffered significant job losses during the Great Recession.
 36 37 POPULATION TRENDS Economy ECONOMY Like much of the country, suffered significant job losses during the Great Recession. Since bottoming out in the first quarter of 2010, however, the city has seen
Data Glossary. Summa Cum Laude: the top 2% of each college's distribution of cumulative GPAs for the graduating cohort. Academic Honors (Latin Honors)
") Institutional Research and Assessment Data Glossary This document is a collection of terms and variable definitions commonly used in the universities reports. The definitions were compiled from various
Institutional Research and Assessment Data Glossary This document is a collection of terms and variable definitions commonly used in the universities reports. The definitions were compiled from various
Status of Women of Color in Science, Engineering, and Medicine
 Status of Women of Color in Science, Engineering, and Medicine The figures and tables below are based upon the latest publicly available data from AAMC, NSF, Department of Education and the US Census Bureau.
DUAL ENROLLMENT ADMISSIONS APPLICATION. You can get anywhere from here.
 DUAL ENROLLMENT ADMISSIONS APPLICATION SM You can get anywhere from here. Please print or type: DUAL ENROLLMENT APPLICATION Last Name First Name Maiden/Middle Social Security # Local Address (include apt.
Race, Class, and the Selective College Experience
 Race, Class, and the Selective College Experience Thomas J. Espenshade Alexandria Walton Radford Chang Young Chung Office of Population Research Princeton University December 15, 2009 1 Overview of NSCE
Evaluating Progress NGA Center for Best Practices STEM Summit
 Evaluating Progress NGA Center for Best Practices STEM Summit Jeni Corn, Ph.D. (jocorn@ncsu.edu) Friday Institute for Educational Innovations NC State University December 2011 SREB Health Sciences Computer
Procedures for Academic Program Review. Office of Institutional Effectiveness, Academic Planning and Review
 Procedures for Academic Program Review Office of Institutional Effectiveness, Academic Planning and Review Last Revision: August 2013 1 Table of Contents Background and BOG Requirements... 2 Rationale
Evaluation of Teach For America:
 EA15-536-2 Evaluation of Teach For America: 2014-2015 Department of Evaluation and Assessment Mike Miles Superintendent of Schools This page is intentionally left blank. ii Evaluation of Teach For America:
TRENDS IN. College Pricing
 2008 TRENDS IN College Pricing T R E N D S I N H I G H E R E D U C A T I O N S E R I E S T R E N D S I N H I G H E R E D U C A T I O N S E R I E S Highlights 2 Published Tuition and Fee and Room and Board
UH STEM Pathways Project
 UH STEM Pathways Project John Rand, PhD Director of STEM Education University of Hawai i System UH STEM Pathways Project University of Hawai i Strategic Directions, 2015-2021 http://www.hawaii.edu/strategicdirections/
Coming in. Coming in. Coming in
 212-213 Report Card for Glenville High School SCHOOL DISTRICT District results under review by the Ohio Department of Education based upon 211 findings by the Auditor of State. Achievement This grade combines
NC Education Oversight Committee Meeting
 NC Education Oversight Committee Meeting November 7, 2017 Nathan Currie, Superintendent Bridget Phifer, NCCA Board Chair Agenda School Demographics Achievements & Improvements Critical Needs Q&A Mission
A Diverse Student Body
 A Diverse Student Body No two diversity plans are alike, even when expressing the importance of having students from diverse backgrounds. A top-tier school that attracts outstanding students uses this
CAMPUS PROFILE MEET OUR STUDENTS UNDERGRADUATE ADMISSIONS. The average age of undergraduates is 21; 78% are 22 years or younger.
 CAMPUS PROFILE MEET OUR STUDENTS Freshmen are defined here as all domestic students entering in fall quarter from high school. These statistics include information drawn from records available at UC Davis.
Supply and Demand of Instructional School Personnel
 Supply and Demand of Instructional School Personnel Presentation to the 82 nd Annual Virginia Middle and High School Principals Conference and Exposition Mrs. Patty S. Pitts Assistant Superintendent of
MAINE 2011 For a strong economy, the skills gap must be closed.
 For a strong economy, the skills gap must be closed. 62% 36% 26% By 2020, jobs requiring a career certificate or college degree Skills gap Too few students make it through college. MEMBER Maine adults
A Guide to Adequate Yearly Progress Analyses in Nevada 2007 Nevada Department of Education
 A Guide to Adequate Yearly Progress Analyses in Nevada 2007 Nevada Department of Education Note: Additional information regarding AYP Results from 2003 through 2007 including a listing of each individual
Educational Management Corp Chef s Academy
 Educational Management Corp Chef s Academy Morrisville, North Carolina (Raleigh MSA) Exclusively Offered By: Porthaven Partners 8908 S. Yale Ave. Suite 400 Tulsa, OK 74137 Ryan Carter Partner P: 918.496.1464
National Survey of Student Engagement (NSSE) Temple University 2016 Results
 Temple University 2016 Results") Introduction The National Survey of Student Engagement (NSSE) is administered by hundreds of colleges and universities every year (560 in 2016), and is designed to measure the amount of time and effort
Introduction The National Survey of Student Engagement (NSSE) is administered by hundreds of colleges and universities every year (560 in 2016), and is designed to measure the amount of time and effort
BENCHMARK TREND COMPARISON REPORT:
 National Survey of Student Engagement (NSSE) BENCHMARK TREND COMPARISON REPORT: CARNEGIE PEER INSTITUTIONS, 2003-2011 PREPARED BY: ANGEL A. SANCHEZ, DIRECTOR KELLI PAYNE, ADMINISTRATIVE ANALYST/ SPECIALIST
Transportation Equity Analysis
 2015-16 Transportation Equity Analysis Each year the Seattle Public Schools updates the Transportation Service Standards and bus walk zone boundaries for use in the upcoming school year. For the 2014-15
2005 National Survey of Student Engagement: Freshman and Senior Students at. St. Cloud State University. Preliminary Report.
 National Survey of Student Engagement: Freshman and Senior Students at St. Cloud State University Preliminary Report (December, ) Institutional Studies and Planning National Survey of Student Engagement
Serving Country and Community: A Study of Service in AmeriCorps. A Profile of AmeriCorps Members at Baseline. June 2001
 Serving Country and Community: A Study of Service in AmeriCorps Cambridge, MA Lexington, MA Hadley, MA Bethesda, MD Washington, DC Chicago, IL Cairo, Egypt Johannesburg, South Africa A Profile of AmeriCorps
Miami-Dade County Public Schools
 ENGLISH LANGUAGE LEARNERS AND THEIR ACADEMIC PROGRESS: 2010-2011 Author: Aleksandr Shneyderman, Ed.D. January 2012 Research Services Office of Assessment, Research, and Data Analysis 1450 NE Second Avenue,
Los Angeles City College Student Equity Plan. Signature Page
 Los Angeles City College Student Equity Plan Signature Page Los Angeles Community College Los Angeles City College President, Board of Trustees Date District Chancellor: College President: Academic Senate
Financial aid: Degree-seeking undergraduates, FY15-16 CU-Boulder Office of Data Analytics, Institutional Research March 2017
 CU-Boulder financial aid, degree-seeking undergraduates, FY15-16 Page 1 Financial aid: Degree-seeking undergraduates, FY15-16 CU-Boulder Office of Data Analytics, Institutional Research March 2017 Contents
What Is The National Survey Of Student Engagement (NSSE)?
?") National Survey of Student Engagement (NSSE) 2000 Results for Montclair State University What Is The National Survey Of Student Engagement (NSSE)? US News and World Reports Best College Survey is due next
National Survey of Student Engagement (NSSE) 2000 Results for Montclair State University What Is The National Survey Of Student Engagement (NSSE)? US News and World Reports Best College Survey is due next
The Demographic Wave: Rethinking Hispanic AP Trends
 The Demographic Wave: Rethinking Hispanic AP Trends Kelcey Edwards & Ellen Sawtell AP Annual Conference, Las Vegas, NV July 19, 2013 Exploring the Data Hispanic/Latino US public school graduates The Demographic
RAISING ACHIEVEMENT BY RAISING STANDARDS. Presenter: Erin Jones Assistant Superintendent for Student Achievement, OSPI
 RAISING ACHIEVEMENT BY RAISING STANDARDS Presenter: Erin Jones Assistant Superintendent for Student Achievement, OSPI Agenda Introductions Definitions History of the work Strategies Next steps Debrief
Personnel Administrators. Alexis Schauss. Director of School Business NC Department of Public Instruction
 Personnel Administrators Alexis Schauss Director of School Business NC Department of Public Instruction Delivering Bad News in a Good Way Planning Allotments are NOT Allotments Budget tool New Allotted
Higher Education / Student Affairs Internship Manual
 ELMP 8981 & ELMP 8982 Administrative Internship Higher Education / Student Affairs Internship Manual College of Education & Human Services Department of Education Leadership, Management & Policy Table
College and Career Ready Performance Index, High School, Grades 9-12
 Dr. John D. Barge, State School Superintendent Making Education Work for All of Georgia s Students College and Career Ready Performance Index, High School, Grades 9-12 CONTENT MASTERY (END of COURSE TESTS
Moving the Needle: Creating Better Career Opportunities and Workforce Readiness. Austin ISD Progress Report
 Moving the Needle: Creating Better Career Opportunities and Workforce Readiness Austin ISD Progress Report 2013 A Letter to the Community Central Texas Job Openings More than 150 people move to the Austin
The State University System of Florida Annual Report
 The State University System of Florida 2009 Annual Report Data definitions are provided in the Appendices. Note concerning data accuracy: The Office of the Board of Governors believes that the accuracy
Aligning and Improving Systems for Special Education Services in St Paul Public Schools. Dr. Elizabeth Keenan Assistant Superintendent
 Aligning and Improving Systems for Special Education Services in St Paul Public Schools Dr. Elizabeth Keenan Assistant Superintendent 1 Aligning and Improving Systems for Special Education Student Purpose:
Council on Postsecondary Education Funding Model for the Public Universities (Excluding KSU) Bachelor's Degrees
 Bachelor's Degrees") Bachelor's Degrees Institution 2013-14 2014-15 2015-16 UK 3,988 4,238 4,540 UofL 2,821 2,832 2,705 EKU 2,508 2,532 2,559 MoSU 1,144 1,166 1,306 MuSU 1,469 1,512 1,696 NKU 2,143 2,214 2,196 WKU 2,751 2,704
Bachelor's Degrees Institution 2013-14 2014-15 2015-16 UK 3,988 4,238 4,540 UofL 2,821 2,832 2,705 EKU 2,508 2,532 2,559 MoSU 1,144 1,166 1,306 MuSU 1,469 1,512 1,696 NKU 2,143 2,214 2,196 WKU 2,751 2,704
Best Colleges Main Survey
 Best Colleges Main Survey Date submitted 5/12/216 18::56 Introduction page 1 / 146 BEST COLLEGES Data Collection U.S. News has begun collecting data for the 217 edition of Best Colleges. The U.S. News
Networks and the Diffusion of Cutting-Edge Teaching and Learning Knowledge in Sociology
 RESEARCH BRIEF Networks and the Diffusion of Cutting-Edge Teaching and Learning Knowledge in Sociology Roberta Spalter-Roth, Olga V. Mayorova, Jean H. Shin, and Janene Scelza INTRODUCTION How are transformational
5 Programmatic. The second component area of the equity audit is programmatic. Equity
 5 Programmatic Equity It is one thing to take as a given that approximately 70 percent of an entering high school freshman class will not attend college, but to assign a particular child to a curriculum
The number of involuntary part-time workers,
 University of New Hampshire Carsey School of Public Policy CARSEY RESEARCH National Issue Brief #116 Spring 2017 Involuntary Part-Time Employment A Slow and Uneven Economic Recovery Rebecca Glauber The
GLBL 210: Global Issues
 GLBL 210: Global Issues This syllabus includes the following sections: Course Overview Required Texts Course Requirements Academic Policies Course Outline COURSE OVERVIEW Over the last two decades, there
NATIONAL CENTER FOR EDUCATION STATISTICS
 NATIONAL CENTER FOR EDUCATION STATISTICS Palm Desert, CA The Integrated Postsecondary Education Data System (IPEDS) is the nation s core postsecondary education data collection program. It is a single,
46 Children s Defense Fund
 Nationally, about 1 in 15 teens ages 16 to 19 is a dropout. Fewer than two-thirds of 9 th graders in Florida, Georgia, Louisiana and Nevada graduate from high school within four years with a regular diploma.
learning collegiate assessment]
![learning collegiate assessment]](/thumbs/71/66063392.jpg "learning collegiate assessment]") [ collegiate learning assessment] INSTITUTIONAL REPORT 2005 2006 Kalamazoo College council for aid to education 215 lexington avenue floor 21 new york new york 10016-6023 p 212.217.0700 f 212.661.9766
[ collegiate learning assessment] INSTITUTIONAL REPORT 2005 2006 Kalamazoo College council for aid to education 215 lexington avenue floor 21 new york new york 10016-6023 p 212.217.0700 f 212.661.9766
JOB OUTLOOK 2018 NOVEMBER 2017 FREE TO NACE MEMBERS $52.00 NONMEMBER PRICE NATIONAL ASSOCIATION OF COLLEGES AND EMPLOYERS
 NOVEMBER 2017 FREE TO NACE MEMBERS $52.00 NONMEMBER PRICE JOB OUTLOOK 2018 NATIONAL ASSOCIATION OF COLLEGES AND EMPLOYERS 62 Highland Avenue, Bethlehem, PA 18017 www.naceweb.org 610,868.1421 TABLE OF CONTENTS
The Condition of College & Career Readiness 2016
 The Condition of College and Career Readiness This report looks at the progress of the 16 ACT -tested graduating class relative to college and career readiness. This year s report shows that 64% of students
Executive Summary. Hialeah Gardens High School
 Miami-Dade County Public Schools Dr. Louis Algaze, Principal 11700 Hialeah Gardens Blvd Hialeah Gardens, FL 33018 Document Generated On March 19, 2014 TABLE OF CONTENTS Introduction 1 Description of the
Faculty Athletics Committee Annual Report to the Faculty Council September 2014
 Faculty Athletics Committee Annual Report to the Faculty Council September 2014 This annual report on the activities of the Faculty Athletics Committee (FAC) during the 2013-2014 academic year was prepared
NC Community College System: Overview
 NC Community College System: Overview Presentation to Joint Appropriations Subcommittee on Education Brett Altman Mark Bondo Fiscal Research Division March 18, 2015 Presentation Agenda 1. NCCCS Background
Idaho Public Schools
 Advanced Placement: Student Participation 13.5% increase in the number of students participating between 25 and 26 In 26: 3,79 Idaho Public School Students took AP Exams In 25: 3,338 Idaho Public School
The University of Michigan-Flint. The Committee on the Economic Status of the Faculty. Annual Report to the Regents. June 2007
 The University of Michigan-Flint The Committee on the Economic Status of the Faculty Annual Report to the Regents June 2007 Committee Chair: Stephen Turner (College of Arts and Sciences) Regular Members:
Strategic Plan Revised November 2012 Reviewed and Updated July 2014
 DUKE UNIVERSITY Medical Center Library & Archives Strategic Plan 2011-2016 Revised November 2012 Reviewed and Updated July 2014 Mission Connecting Duke to biomedical knowledge networks. Vision The vision
NBER WORKING PAPER SERIES WOULD THE ELIMINATION OF AFFIRMATIVE ACTION AFFECT HIGHLY QUALIFIED MINORITY APPLICANTS? EVIDENCE FROM CALIFORNIA AND TEXAS
 NBER WORKING PAPER SERIES WOULD THE ELIMINATION OF AFFIRMATIVE ACTION AFFECT HIGHLY QUALIFIED MINORITY APPLICANTS? EVIDENCE FROM CALIFORNIA AND TEXAS David Card Alan B. Krueger Working Paper 10366 http://www.nber.org/papers/w10366
Asheboro High School. Class of Senior Bulletin Fall Semester
 Asheboro High School Class of 2017 Senior Bulletin Fall Semester Asheboro High School 1221 South Park Street Asheboro, North Carolina 27203 TELEPHONE (336) 625-6185 FAX (336) 625-9320 Dear Senior/Parent:
Principal vacancies and appointments
 Principal vacancies and appointments 2009 10 Sally Robertson New Zealand Council for Educational Research NEW ZEALAND COUNCIL FOR EDUCATIONAL RESEARCH TE RŪNANGA O AOTEAROA MŌ TE RANGAHAU I TE MĀTAURANGA
Higher Education. Pennsylvania State System of Higher Education. November 3, 2017
 November 3, 2017 Higher Education Pennsylvania s diverse higher education sector - consisting of many different kinds of public and private colleges and universities - helps students gain the knowledge
10/6/2017 UNDERGRADUATE SUCCESS SCHOLARS PROGRAM. Founded in 1969 as a graduate institution.
 UNDERGRADUATE SUCCESS SCHOLARS PROGRAM THE UNIVERSITY OF TEXAS AT DALLAS Founded in 1969 as a graduate institution. Began admitting upperclassmen in 1975 and began admitting underclassmen in 1990. 1 A
2015 High School Results: Summary Data (Part I)
") 1 2015 High School Results: Summary Data (Part I) October 27, 2015 Dr. Gregory E. Thornton CEO, Baltimore City Public Schools Theresa D. Jones Chief Achievement and Accountability Officer HS Data Summary
1 2015 High School Results: Summary Data (Part I) October 27, 2015 Dr. Gregory E. Thornton CEO, Baltimore City Public Schools Theresa D. Jones Chief Achievement and Accountability Officer HS Data Summary
Mission, Vision and Values Providing a Context
 Mission, Vision and Values Providing a Context Kathy McLain, Dean College Planning and Research Role of the Mission Statement Spring Break Experience Helped organize and lead a 4 day bike trip for 25 high
Psychometric Research Brief Office of Shared Accountability
 August 2012 Psychometric Research Brief Office of Shared Accountability Linking Measures of Academic Progress in Mathematics and Maryland School Assessment in Mathematics Huafang Zhao, Ph.D. This brief
A Snapshot of the Graduate School
 A Snapshot of the Graduate School Prepared for the Research Council February 6, 2009 John R. Mullin, Ph.D., FAICP Dean of the Graduate School University of Massachusetts Amherst Graduate School Purpose
Office of Institutional Effectiveness 2012 NATIONAL SURVEY OF STUDENT ENGAGEMENT (NSSE) DIVERSITY ANALYSIS BY CLASS LEVEL AND GENDER VISION
 DIVERSITY ANALYSIS BY CLASS LEVEL AND GENDER VISION") Office of Institutional Effectiveness 2012 NATIONAL SURVEY OF STUDENT ENGAGEMENT (NSSE) DIVERSITY ANALYSIS BY CLASS LEVEL AND GENDER VISION We seek to become recognized for providing bright and curious
Office of Institutional Effectiveness 2012 NATIONAL SURVEY OF STUDENT ENGAGEMENT (NSSE) DIVERSITY ANALYSIS BY CLASS LEVEL AND GENDER VISION We seek to become recognized for providing bright and curious
Southern Wesleyan University 2017 Winter Graduation Exercises Information for Graduates and Guests (Updated 09/14/2017)
") I. Ceremonies II. Graduation Timeline III. Graduation Day Schedule IV. Academic Regalia V. Alumni Receptions VI. Applause VII. Applications VIII. Appropriate Attire for Graduates IX. Baccalaureate X. Cameras,
I. Ceremonies II. Graduation Timeline III. Graduation Day Schedule IV. Academic Regalia V. Alumni Receptions VI. Applause VII. Applications VIII. Appropriate Attire for Graduates IX. Baccalaureate X. Cameras,
EXECUTIVE SUMMARY. Online courses for credit recovery in high schools: Effectiveness and promising practices. April 2017
 EXECUTIVE SUMMARY Online courses for credit recovery in high schools: Effectiveness and promising practices April 2017 Prepared for the Nellie Mae Education Foundation by the UMass Donahue Institute 1
JEFFERSON COLLEGE COURSE SYLLABUS BUS 261 BUSINESS COMMUNICATIONS. 3 Credit Hours. Prepared by: Cindy Rossi January 25, 2014
 JEFFERSON COLLEGE COURSE SYLLABUS BUS 261 BUSINESS COMMUNICATIONS 3 Credit Hours Prepared by: Cindy Rossi January 25, 2014 Ms. Linda Abernathy, Math, Science and Business Division Chair Ms. Shirley Davenport,
Descriptive Summary of Beginning Postsecondary Students Two Years After Entry
 NATIONAL CENTER FOR EDUCATION STATISTICS Statistical Analysis Report June 994 Descriptive Summary of 989 90 Beginning Postsecondary Students Two Years After Entry Contractor Report Robert Fitzgerald Lutz
Denver Public Schools
 2017 Candidate Surveys Denver Public Schools Denver School Board District 4: Northeast DPS District 4 - Introduction School board elections offer community members the opportunity to reflect on the state
Missouri 4-H University of Missouri 4-H Center for Youth Development
 Missouri 4-H University of Missouri 4-H Center for Youth Development Missouri 4-H Key Award Purpose To Encourage: A quality educational programs for all members. A safe environment where all youth feel
North Carolina Community Colleges Golden LEAF Scholars Program Two-Year Colleges Student Application
 North Carolina Community Colleges Golden LEAF Scholars Program Two-Year Colleges Student Application Instructions: Complete this application and return the completed application to the college s Financial
What We Are Learning about Successful Programs In College Calculus
 What We Are Learning about Successful Programs In College Calculus David Bressoud St. Paul, MN Knox College Galesburg, IL May 15, 2014 A pdf file of this PowerPoint is available at www.macalester.edu/~bressoud/talks
National Survey of Student Engagement Spring University of Kansas. Executive Summary
 National Survey of Student Engagement Spring 2010 University of Kansas Executive Summary Overview One thousand six hundred and twenty-one (1,621) students from the University of Kansas completed the web-based
Higher Education Six-Year Plans
 Higher Education Six-Year Plans 2018-2024 House Appropriations Committee Retreat November 15, 2017 Tony Maggio, Staff Background The Higher Education Opportunity Act of 2011 included the requirement for
Port Graham El/High. Report Card for
 School: District: Kenai Peninsula Grades: K - 12 School Enrollment: 20 Title I School? No Title 1 Program: Accreditation: Report Card for 2008-2009 A Title 1 school receives federal money in support low-achieving
Creating Collaborative Partnerships: The Success Stories and Challenges
 Creating Collaborative Partnerships: The Success Stories and Challenges Community College Center of Excellence Building a World Class Workforce Through Community College Partnerships Cari Mallory National
FACTORS THAT INFLUENCE THE COLLEGE CHOICE PROCESS FOR AFRICAN AMERICAN STUDENTS. Melanie L. Hayden. Thesis submitted to the Faculty of the
 FACTORS THAT INFLUENCE THE COLLEGE CHOICE PROCESS FOR AFRICAN AMERICAN STUDENTS by Melanie L. Hayden Thesis submitted to the Faculty of the Virginia Polytechnic Institute and State University In partial
Spanish Users and Their Participation in College: The Case of Indiana
 and Their Participation in College: The Case of Indiana CAROLINA PELAEZ-MORALES Purdue University Spanish has become a widely used second language in the U.S. As the number of Spanish users (SUs) continues
Undergraduate Admissions Standards for the Massachusetts State University System and the University of Massachusetts. Reference Guide April 2016
 Undergraduate Admissions Standards for the Massachusetts State University System and the University of Massachusetts Reference Guide April 2016 Massachusetts Department of Higher Education One Ashburton