Bowie State University (BSU) Coppin State University (CSU) Frostburg State University (FSU) Salisbury University (SU) Towson University (TU)
|
|
|
- Amanda Norman
- 6 years ago
- Views:
Transcription
1 Bowie State University (BSU) Coppin State University (CSU) Frostburg State University (FSU) Salisbury University (SU) Towson University (TU) University of Baltimore (UB) University of Maryland, Baltimore County (UMBC) University of Maryland, College Park (UMCP) University of Maryland Eastern Shore (UMES) Office of Institutional Research Vice Chancellor for Administration and Finance University System of Maryland Office March
2 Background The purpose of this report is to provide the most recent information available on how well new first time, full time freshmen students entering a USM institution in the fall semester are being retained and progressing toward a bachelor s degree. New first time, full time students, often referred to as traditional students, represent the student population most often referenced when higher education enrollment, retention, and graduation data are discussed. While new first time, full time new students only comprise a third of the new students matriculating at USM institutions each fiscal year, they have an outsized impact on our System and its institutions because they drive reporting for most federal and state retention and graduation rates, as well as a host of other reputation measures used by the various national ranking systems. For this reason a significant portion of institutional aid is directed towards these students. Further, this population of students also figures heavily in the System s ability to meet many of its strategic plan goals, including degree completion, STEM production, and achievement gap reduction. The data provided in this report are for freshmen who entered USM institutions in the fall semesters. Second, third, and fourth year retention rates, as well as fourth, fifth, and sixthyear graduation rates are presented for the following groups: all USM students, USM African American students, USM Hispanic students, and USM Pell Grant recipients. A set of tables in the Appendix shows the rates for the USM as a whole and for each institution, with data for each new freshmen cohort presented separately. In addition, a brief discussion of the trends we witnessed this past year with regard to the size and diversity of USM s first time, full time new freshmen cohorts, as well as the performance of the most recent cohorts on the traditional higher education measures of second year retention and six year graduation rates, is presented below. This analysis was prepared by combining data collected each fall semester on students who are enrolled at USM institutions with data collected each year on degrees and financial aid awarded. Retention and graduation rates are reported for those students re enrolling at or graduating from any USM institution, and for USM students re enrolling at or graduating from their institution of initial entry. This report does not reflect changes to student cohorts from eligible exclusions and student ID changes, and may not align with the official calculations of each campus (as reported to the Department of Education). Unlike the nationally focused Student Achievement Measure (SAM), the report also does not account for students who may have transferred or graduated from an institution outside the USM. Although UMUC enrolls some students identified as first time, full time, this report will focus on the nine USM residential institutions that recruit and competitively admit this cohort each fall. The information in this report reflects the most recent updates to the fall new freshmen data. It is also part of a series of reports about the undergraduate pipeline including SAT Percentile Distribution of First Time Undergraduates report, the Transfer Students to the University System of Maryland: Patterns of Enrollment and Success report and provides context for the USM s Enrollment Projections. For further information, please contact Chad Muntz, cmuntz@usmd.edu, or Laura Walker, alwalker@usmd.edu,
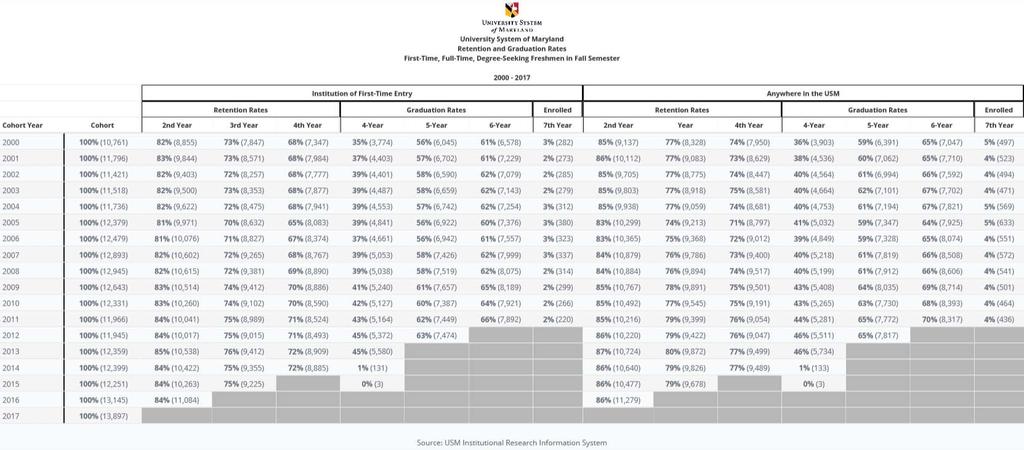
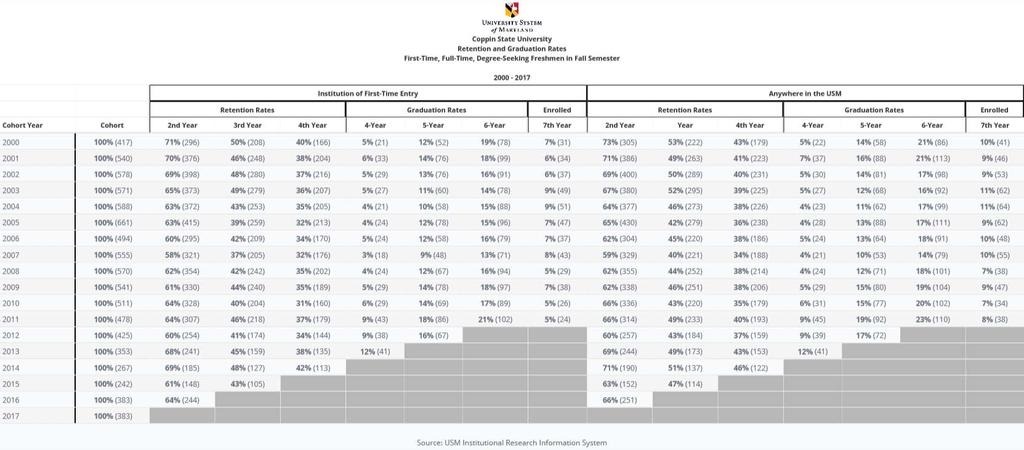
3 Impact on Institutional Enrollment and Degree Production New first time, full time (FTFT) students are the most prominent group of new students on campus. Most of the applications received by a traditional institution are from students seeking admission for the fall semester with the intent to study full time. The size, diversity, and success rate (i.e., retention and graduation rates) of each cohort of these first time, full time students will be highlighted in guidebooks and will partially determine the institution s reputation. Such information will figure into decisions of future students when deciding to apply and/or enroll if admitted. Institutions that enroll significant numbers of FTFT students depend heavily on generating significant levels of prospective interest (i.e., applications) among just graduating high school seniors planning to enter higher education in the fall. However, generating more applications does not always yield more students because the quality of the applicant pool ultimately determines the number of admissible students. Further, because fall first time, full time admission is competitive, applicants often apply to multiple institutions, and the most soughtafter prospective students are often admitted to multiple institutions. Without decreasing the quality of the admitted cohort, an institution s ability to increase or maintain the size of the fall first time cohort is often determined by student choice. More recently some institutions have sought to increase access to first time students by offering students the opportunity to start in the spring semester, after space has become available due to winter graduation and fall attrition. An institution will defer a student s fall application until spring, and students willing to wait a semester will then attend in the spring. However, many will choose another institution where they may enroll in the fall. The University of Maryland, College Park s Freshmen Connection program solves this problem by providing their spring admitted students an opportunity to connect with the campus during the fall term through a self supported academic unit that provides first year credit courses. [Before fall 2017, these students were only reported in spring. However, due to recent changes, the University of Maryland included these students as fall first time, full time reflecting the enrollment in fall credit courses.] Freshmen Connection has been successful at increasing the total enrollment at the University of Maryland by effectively increasing the yield of their fall applicant pool. In summary, the total enrollment at a campus is comprised of both the new student yield (i.e., the number of new students who were admitted and chose to enroll) plus the retention of returning students from previous cohorts. Therefore, retention of prior cohorts is essential for maintaining or increasing enrollment and degree completion because an increase from new students in the fall is not always feasible nor the applicant pool available nor the student willing to delay enrollment. Trends in the Size and Diversity of the USM s Fall First time, Full time New Cohort As the data in Table 1 below show, the size of the entering new first time, full time (FTFT) freshmen cohort at each campus varies from year to year. As mentioned in the previous section, in Fall 2017, UMCP included the Freshmen Connection new spring students in their fall 3
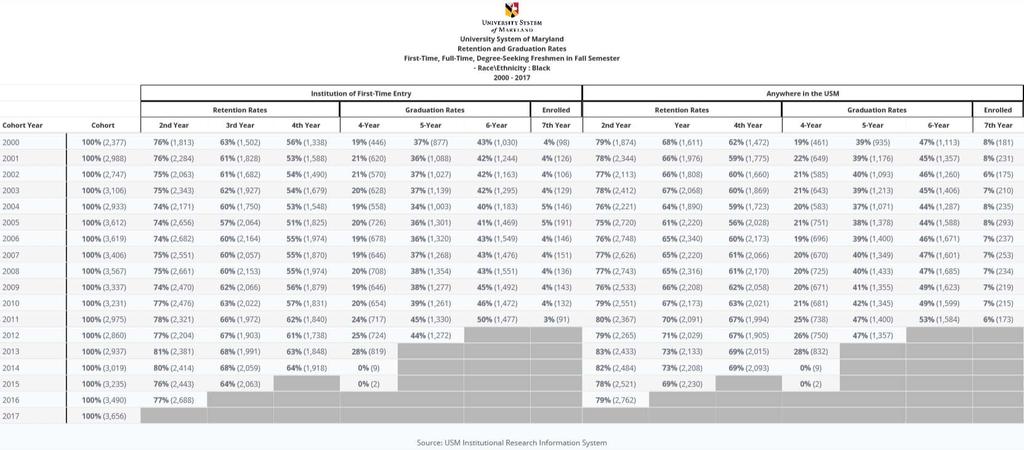
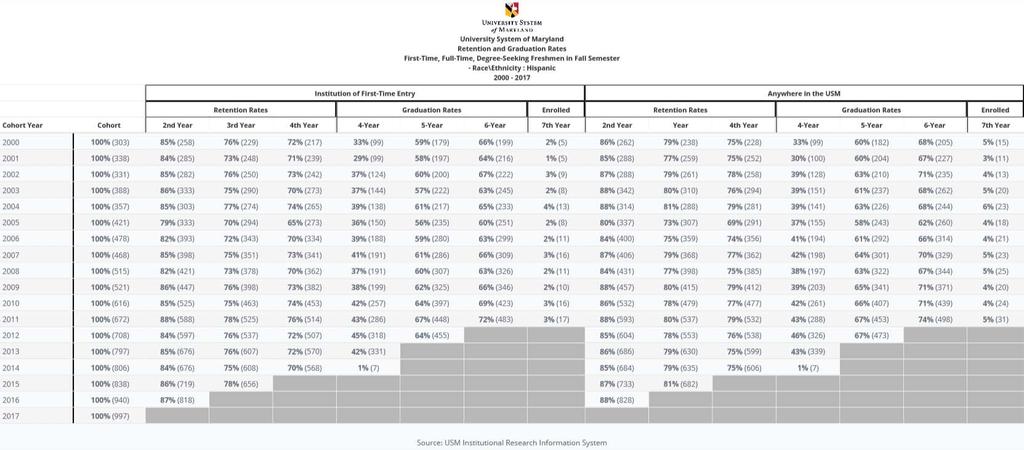
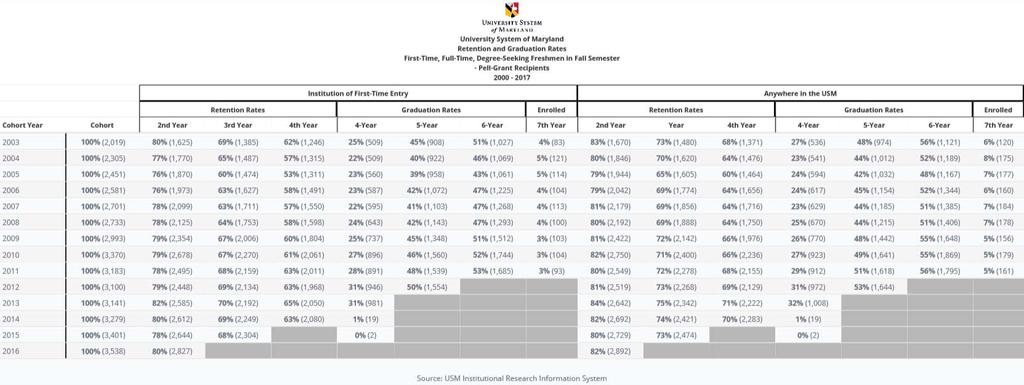
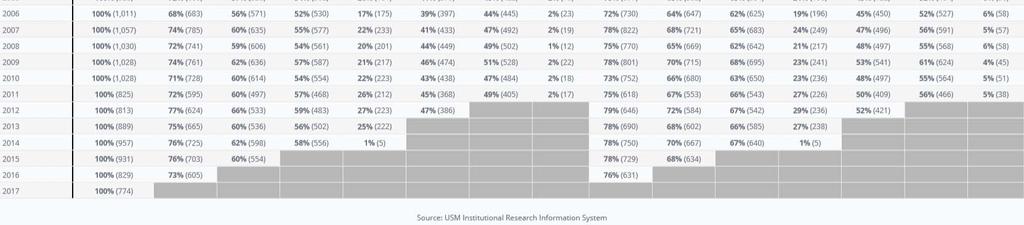
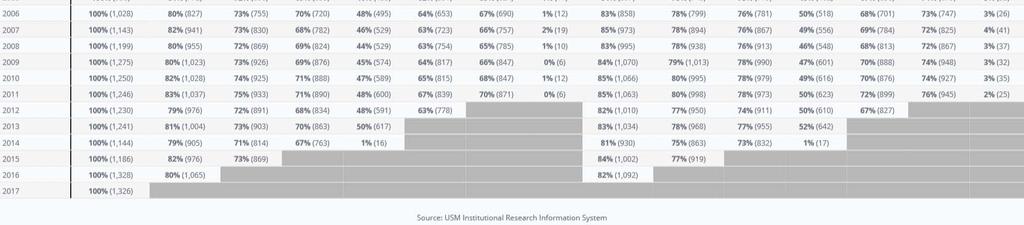
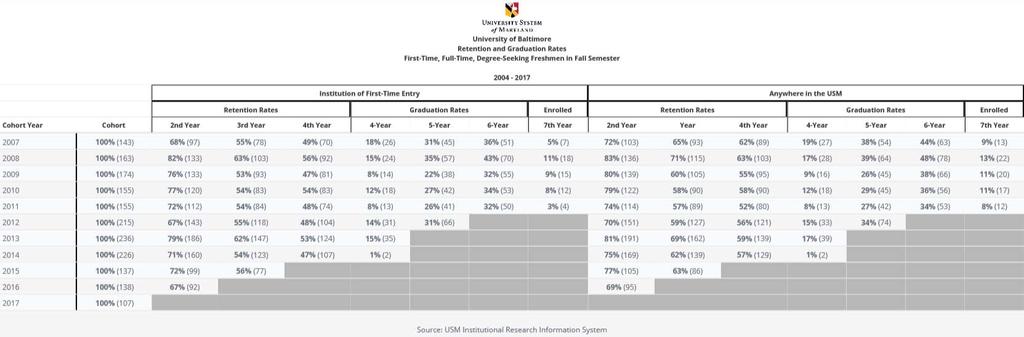
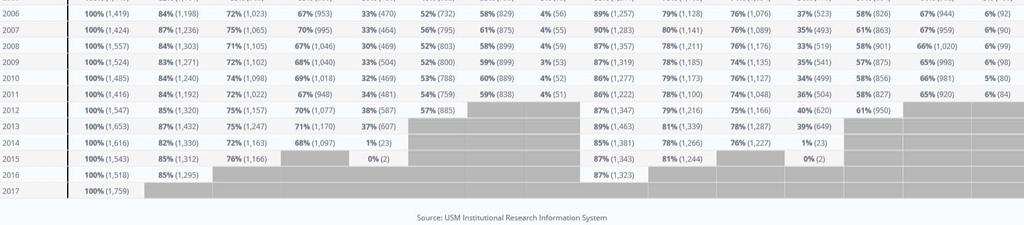
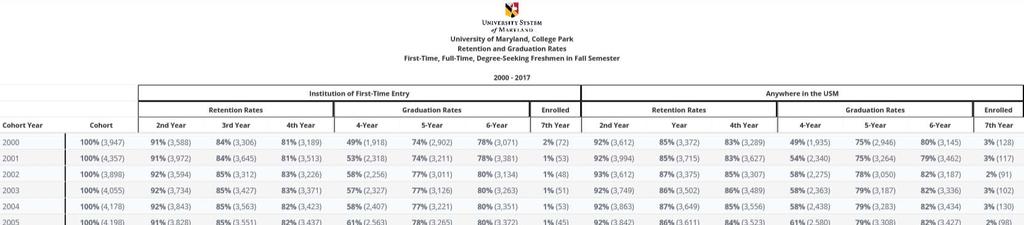
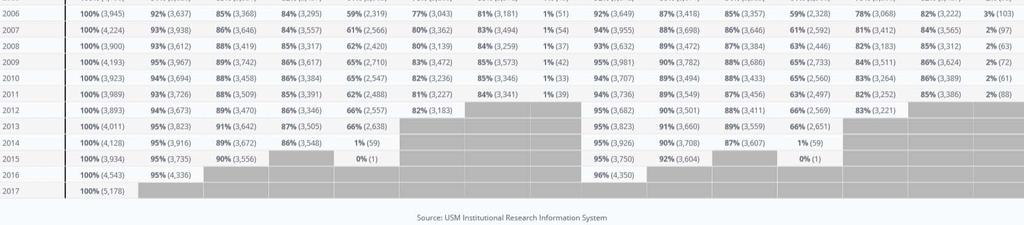
4 first time, full time numbers because of the credit course enrollment opportunities pursued by these students in the fall semester. Other than UMCP s reporting change, Bowie continues to increase its fall FTFT students and UMBC increased for the first time in five years. Frostburg, UMES and UB continue to experience decreases in fall FTFT students. Coppin, Salisbury, and Towson remained steady compared to the enrollment last year. Table 1 Fall First time, Full time New Students by USM Institution Bowie ,075 Coppin Frostburg Salisbury 1,246 1,230 1,241 1,144 1,186 1,328 1,326 Towson 2,536 2,463 2,747 2,711 2,708 2,750 2,735 UB UMBC 1,416 1,547 1,653 1,616 1,543 1,518 1,759 UMCP 3,989 3,893 4,011 4,128 3,934 4,543 5,178 UMES , USM 11,966 11,945 12,359 12,399 12,251 13,145 13,897 The aggregate changes also include changes in the demographic diversity occurring within the new FTFT cohort. The most recent 2017 FTFT cohort was approximately 7.1% (or 997 students) Hispanic and continues to increase in size year after year. African Americans made up 25% (3,656) of the 2017 cohort with fewer than half (49% or 1,688) enrolled at the USM s Historically Black Institutions (HBIs) also a multi year trend. Finally, the number of low income students continued to increase, as over one quarter (26%) of the 2016 freshmen cohort received a Pell grant. In short, the USM freshmen cohort is more diverse than ever and increasing in the number of low income students. Trends in Retention and Graduation Rates The USM s overall retention and graduation rates are determined by two interacting factors: 1) the rate at which new FTFT students are retained and graduated by each campus, and 2) the size of the new FTFT cohort at each campus. Both factors play a role in determining the System s overall success rates and degree production. Second Year Retention Rate. The second year retention rate of USM FTFT (at institution of initial entry) remained strong in 2017 with 84% (11,084) of the fall 2016 cohort returning. Although the overall second year retention rate remained unchanged, there was a four percent decrease for African American students, 77% (2,688) and a two percent increase for Pell Grant 4
5 recipients to 80% (2,827). However, the second year retention rate for Hispanic students increased one percent to 87% (818). Broken down by campus, the USM saw declines in second year retention at six of the nine campuses: After a dramatic cohort size increase, Bowie s retention rate dropped three points to 71% (682). Frostburg also dropped three points to 73% (605). Salisbury decreased two points to 80% (1,065). Towson dropped a point to 84% (2,323). UB fell by five points to 67% (92). The three campuses that increased or remained flat were: UMCP and UMBC, which maintained very high retention rates of 95% (4,336) and 85% (1,295), respectively, and UMES, whose retention rate improved six percent to 63% (442) but was still nearly 10 percent lower than its high point achieved a few years earlier. As can be seen by these rates and the increases or decreases of students (Table 1), the interaction between volume and success shapes the USM average and explains why the USM average did not change. Six Year Graduation Rate. The most recent graduating cohort consisted of 11,966 new firsttime, full time students, who entered a USM institution in fall It was the smallest cohort since The six year graduation rate reported for the 2011 cohort was 66% at the Institution of Initial Entry, and 70% if the definition was expanded to include graduating Anywhere within the USM. Both represented historically high rates. Similarly, strong graduation rates were reported by subgroups. Although the cohort size decreased by nearly 250 students, the 53% (1,635) graduation rate of African Americans who graduated Anywhere within the USM improved three percent and became USM s historical high point. The rate for Hispanic students who graduated Anywhere within the USM set a new historically high mark of 74% (498) for this subgroup. The percentage of Pell Grant students graduating Anywhere with the USM also set a new historical high point for this subgroup a 56% (1,795). It is clear that the improvement in graduation rates for these subgroups positively impacted the overall USM graduation rates. Summary Fall first time, full time new students at USM continue to be an academically strong and wellprepared population group. As indicated in the USM s SAT Percentile Distribution of First Time Undergraduates, the academic profile for this group exceeded Maryland averages at most institutions. In addition, since the Closing Achievement Gap initiative began in spring 2008, the preparedness of the students at entry, as well as the institutions focus on increasing student success, has meant an improvement in the second year retention rates and the six year graduation rates for first time, full time students. The most recent graduating cohort, fall 2011, reported a Systemwide graduation rate of 70% (8,317) with the retention rates of the subsequent cohorts over 80%. All leading indicators predict sustained rates of success for the fall 2012 cohort and beyond. Thus, the USM is maximizing this pipeline by producing seven graduates for every ten that enter as new fall first time, full time students. 5
6 APPENDIX 6
7 7
8 8
9 9
10 10
11 11
12 12
13 13
14 14
15 15
16 16
17 17
18 18
19 19
TOPIC: Biennial Exempt Market Salary Survey Report and FY Structures Adjustment
 BOARD OF REGENTS SUMMARY OF ITEM FOR ACTION, INFORMATION OR DISCUSSION TOPIC: Biennial Exempt Market Salary Survey Report and FY 2015 2016 Structures Adjustment COMMITTEE: Finance DATE OF COMMITTEE MEETING:
Access Center Assessment Report
 Access Center Assessment Report The purpose of this report is to provide a description of the demographics as well as higher education access and success of Access Center students at CSU. College access
EDUCATIONAL ATTAINMENT
 EDUCATIONAL ATTAINMENT By 2030, at least 60 percent of Texans ages 25 to 34 will have a postsecondary credential or degree. Target: Increase the percent of Texans ages 25 to 34 with a postsecondary credential.
OFFICE OF ENROLLMENT MANAGEMENT. Annual Report
 2014-2015 OFFICE OF ENROLLMENT MANAGEMENT Annual Report Table of Contents 2014 2015 MESSAGE FROM THE VICE PROVOST A YEAR OF RECORDS 3 Undergraduate Enrollment 6 First-Year Students MOVING FORWARD THROUGH
MAINE 2011 For a strong economy, the skills gap must be closed.
 For a strong economy, the skills gap must be closed. 62% 36% 26% By 2020, jobs requiring a career certificate or college degree Skills gap Too few students make it through college. MEMBER Maine adults
UDW+ Student Data Dictionary Version 1.7 Program Services Office & Decision Support Group
 UDW+ Student Data Dictionary Version 1.7 Program Services Office & Decision Support Group 1 Table of Contents Subject Areas... 3 SIS - Term Registration... 5 SIS - Class Enrollment... 12 SIS - Degrees...
Evaluation of a College Freshman Diversity Research Program
 Evaluation of a College Freshman Diversity Research Program Sarah Garner University of Washington, Seattle, Washington 98195 Michael J. Tremmel University of Washington, Seattle, Washington 98195 Sarah
EVALUATION PLAN
 UNIVERSITY OF NEW MEXICO COLLEGE OF EDUCATION 2013-14 EVALUATION PLAN NEW MEXICO PUBLIC EDUCATION DEPARTMENT EDUCATIONAL ACCOUNTABILTY REPORTING SYSTEM MSC05 3040 1 UNIVERSITY OF NEW MEXICO ALBUQUERQUE,
Race, Class, and the Selective College Experience
 Race, Class, and the Selective College Experience Thomas J. Espenshade Alexandria Walton Radford Chang Young Chung Office of Population Research Princeton University December 15, 2009 1 Overview of NSCE
Graduate Division Annual Report Key Findings
 Graduate Division 2010 2011 Annual Report Key Findings Trends in Admissions and Enrollment 1 Size, selectivity, yield UCLA s graduate programs are increasingly attractive and selective. Between Fall 2001
The Condition of College & Career Readiness 2016
 The Condition of College and Career Readiness This report looks at the progress of the 16 ACT -tested graduating class relative to college and career readiness. This year s report shows that 64% of students
Data Glossary. Summa Cum Laude: the top 2% of each college's distribution of cumulative GPAs for the graduating cohort. Academic Honors (Latin Honors)
") Institutional Research and Assessment Data Glossary This document is a collection of terms and variable definitions commonly used in the universities reports. The definitions were compiled from various
Institutional Research and Assessment Data Glossary This document is a collection of terms and variable definitions commonly used in the universities reports. The definitions were compiled from various
African American Male Achievement Update
 Report from the Department of Research, Evaluation, and Assessment Number 8 January 16, 2009 African American Male Achievement Update AUTHOR: Hope E. White, Ph.D., Program Evaluation Specialist Department
READY OR NOT? CALIFORNIA'S EARLY ASSESSMENT PROGRAM AND THE TRANSITION TO COLLEGE
 READY OR NOT? CALIFORNIA'S EARLY ASSESSMENT PROGRAM AND THE TRANSITION TO COLLEGE Michal Kurlaender University of California, Davis Policy Analysis for California Education March 16, 2012 This research
Do multi-year scholarships increase retention? Results
 Do multi-year scholarships increase retention? In the past, Boise State has mainly offered one-year scholarships to new freshmen. Recently, however, the institution moved toward offering more two and four-year
Segmentation Study of Tulsa Area Higher Education Needs Ages 36+ March Prepared for: Conducted by:
 Segmentation Study of Tulsa Area Higher Education Needs Ages 36+ March 2004 * * * Prepared for: Tulsa Community College Tulsa, OK * * * Conducted by: Render, vanderslice & Associates Tulsa, Oklahoma Project
Best Colleges Main Survey
 Best Colleges Main Survey Date submitted 5/12/216 18::56 Introduction page 1 / 146 BEST COLLEGES Data Collection U.S. News has begun collecting data for the 217 edition of Best Colleges. The U.S. News
The Impact of Honors Programs on Undergraduate Academic Performance, Retention, and Graduation
 University of Nebraska - Lincoln DigitalCommons@University of Nebraska - Lincoln Journal of the National Collegiate Honors Council - -Online Archive National Collegiate Honors Council Fall 2004 The Impact
U VA THE CHANGING FACE OF UVA STUDENTS: SSESSMENT. About The Study
 About The Study U VA SSESSMENT In 6, the University of Virginia Office of Institutional Assessment and Studies undertook a study to describe how first-year students have changed over the past four decades.
AGENDA Symposium on the Recruitment and Retention of Diverse Populations
 AGENDA Symposium on the Recruitment and Retention of Diverse Populations Tuesday, April 25, 2017 7:30-8:30 a.m. Symposium Check-in and Continental Breakfast Foyer 8:30-9:30 a.m. Opening Keynote Session
Evaluation of Teach For America:
 EA15-536-2 Evaluation of Teach For America: 2014-2015 Department of Evaluation and Assessment Mike Miles Superintendent of Schools This page is intentionally left blank. ii Evaluation of Teach For America:
Strategic Plan Dashboard Results. Office of Institutional Research and Assessment
 29-21 Strategic Plan Dashboard Results Office of Institutional Research and Assessment Binghamton University Office of Institutional Research and Assessment Definitions Fall Undergraduate and Graduate
10/6/2017 UNDERGRADUATE SUCCESS SCHOLARS PROGRAM. Founded in 1969 as a graduate institution.
 UNDERGRADUATE SUCCESS SCHOLARS PROGRAM THE UNIVERSITY OF TEXAS AT DALLAS Founded in 1969 as a graduate institution. Began admitting upperclassmen in 1975 and began admitting underclassmen in 1990. 1 A
A Guide to Adequate Yearly Progress Analyses in Nevada 2007 Nevada Department of Education
 A Guide to Adequate Yearly Progress Analyses in Nevada 2007 Nevada Department of Education Note: Additional information regarding AYP Results from 2003 through 2007 including a listing of each individual
Graduation Initiative 2025 Goals San Jose State
 Graduation Initiative 2025 Goals San Jose State Metric 2025 Goal Most Recent Rate Freshman 6-Year Graduation 71% 57% Freshman 4-Year Graduation 35% 10% Transfer 2-Year Graduation 36% 24% Transfer 4-Year
Educational Attainment
 A Demographic and Socio-Economic Profile of Allen County, Indiana based on the 2010 Census and the American Community Survey Educational Attainment A Review of Census Data Related to the Educational Attainment
Wisconsin 4 th Grade Reading Results on the 2015 National Assessment of Educational Progress (NAEP)
") Wisconsin 4 th Grade Reading Results on the 2015 National Assessment of Educational Progress (NAEP) Main takeaways from the 2015 NAEP 4 th grade reading exam: Wisconsin scores have been statistically flat
Wisconsin 4 th Grade Reading Results on the 2015 National Assessment of Educational Progress (NAEP) Main takeaways from the 2015 NAEP 4 th grade reading exam: Wisconsin scores have been statistically flat
Review of Student Assessment Data
 Reading First in Massachusetts Review of Student Assessment Data Presented Online April 13, 2009 Jennifer R. Gordon, M.P.P. Research Manager Questions Addressed Today Have student assessment results in
This Access Agreement is for only, to align with the WPSA and in light of the Browne Review.
 University of Essex Access Agreement 2011-12 The University of Essex Access Agreement has been updated in October 2010 to include new tuition fee and bursary provision for 2011 entry and account for the
1.0 INTRODUCTION. The purpose of the Florida school district performance review is to identify ways that a designated school district can:
 1.0 INTRODUCTION 1.1 Overview Section 11.515, Florida Statutes, was created by the 1996 Florida Legislature for the purpose of conducting performance reviews of school districts in Florida. The statute
Idaho Public Schools
 Advanced Placement: Student Participation 13.5% increase in the number of students participating between 25 and 26 In 26: 3,79 Idaho Public School Students took AP Exams In 25: 3,338 Idaho Public School
2012 New England Regional Forum Boston, Massachusetts Wednesday, February 1, More Than a Test: The SAT and SAT Subject Tests
 2012 New England Regional Forum Boston, Massachusetts Wednesday, February 1, 2012 More Than a Test: The SAT and SAT Subject Tests 1 Presenters Chris Lucier Vice President for Enrollment Management, University
Higher Education. Pennsylvania State System of Higher Education. November 3, 2017
 November 3, 2017 Higher Education Pennsylvania s diverse higher education sector - consisting of many different kinds of public and private colleges and universities - helps students gain the knowledge
Transportation Equity Analysis
 2015-16 Transportation Equity Analysis Each year the Seattle Public Schools updates the Transportation Service Standards and bus walk zone boundaries for use in the upcoming school year. For the 2014-15
2015 High School Results: Summary Data (Part I)
") 1 2015 High School Results: Summary Data (Part I) October 27, 2015 Dr. Gregory E. Thornton CEO, Baltimore City Public Schools Theresa D. Jones Chief Achievement and Accountability Officer HS Data Summary
1 2015 High School Results: Summary Data (Part I) October 27, 2015 Dr. Gregory E. Thornton CEO, Baltimore City Public Schools Theresa D. Jones Chief Achievement and Accountability Officer HS Data Summary
NCEO Technical Report 27
 Home About Publications Special Topics Presentations State Policies Accommodations Bibliography Teleconferences Tools Related Sites Interpreting Trends in the Performance of Special Education Students
Longitudinal Analysis of the Effectiveness of DCPS Teachers
 F I N A L R E P O R T Longitudinal Analysis of the Effectiveness of DCPS Teachers July 8, 2014 Elias Walsh Dallas Dotter Submitted to: DC Education Consortium for Research and Evaluation School of Education
What is related to student retention in STEM for STEM majors? Abstract:
 What is related to student retention in STEM for STEM majors? Abstract: The purpose of this study was look at the impact of English and math courses and grades on retention in the STEM major after one
Higher Education Six-Year Plans
 Higher Education Six-Year Plans 2018-2024 House Appropriations Committee Retreat November 15, 2017 Tony Maggio, Staff Background The Higher Education Opportunity Act of 2011 included the requirement for
Financial aid: Degree-seeking undergraduates, FY15-16 CU-Boulder Office of Data Analytics, Institutional Research March 2017
 CU-Boulder financial aid, degree-seeking undergraduates, FY15-16 Page 1 Financial aid: Degree-seeking undergraduates, FY15-16 CU-Boulder Office of Data Analytics, Institutional Research March 2017 Contents
Upward Bound Program
 SACS Preparation Division of Student Affairs Upward Bound Program REQUIREMENTS: The institution provides student support programs, services, and activities consistent with its mission that promote student
Status of Women of Color in Science, Engineering, and Medicine
 Status of Women of Color in Science, Engineering, and Medicine The figures and tables below are based upon the latest publicly available data from AAMC, NSF, Department of Education and the US Census Bureau.
FRANKLIN D. CHAMBERS,
 CURRICULUM VITAE FRANKLIN D. CHAMBERS, Ph.D. EDUCATIONAL BACKGROUND Doctor of Philosophy: Organizational Communications Howard University, Washington, D.C. Masters Degree: Educational Administration Howard
Effectiveness of McGraw-Hill s Treasures Reading Program in Grades 3 5. October 21, Research Conducted by Empirical Education Inc.
 Effectiveness of McGraw-Hill s Treasures Reading Program in Grades 3 5 October 21, 2010 Research Conducted by Empirical Education Inc. Executive Summary Background. Cognitive demands on student knowledge
Proficiency Illusion
 KINGSBURY RESEARCH CENTER Proficiency Illusion Deborah Adkins, MS 1 Partnering to Help All Kids Learn NWEA.org 503.624.1951 121 NW Everett St., Portland, OR 97209 Executive Summary At the heart of the
Shelters Elementary School
 Shelters Elementary School August 2, 24 Dear Parents and Community Members: We are pleased to present you with the (AER) which provides key information on the 23-24 educational progress for the Shelters
Iowa School District Profiles. Le Mars
 Iowa School District Profiles Overview This profile describes enrollment trends, student performance, income levels, population, and other characteristics of the public school district. The report utilizes
EXECUTIVE SUMMARY. Online courses for credit recovery in high schools: Effectiveness and promising practices. April 2017
 EXECUTIVE SUMMARY Online courses for credit recovery in high schools: Effectiveness and promising practices April 2017 Prepared for the Nellie Mae Education Foundation by the UMass Donahue Institute 1
Moving the Needle: Creating Better Career Opportunities and Workforce Readiness. Austin ISD Progress Report
 Moving the Needle: Creating Better Career Opportunities and Workforce Readiness Austin ISD Progress Report 2013 A Letter to the Community Central Texas Job Openings More than 150 people move to the Austin
Practices Worthy of Attention Step Up to High School Chicago Public Schools Chicago, Illinois
 Step Up to High School Chicago Public Schools Chicago, Illinois Summary of the Practice. Step Up to High School is a four-week transitional summer program for incoming ninth-graders in Chicago Public Schools.
University of Essex Access Agreement
 University of Essex Access Agreement Updated in August 2009 to include new tuition fee and bursary provision for 2010 entry 1. Context The University of Essex is academically a strong institution, with
Peer Influence on Academic Achievement: Mean, Variance, and Network Effects under School Choice
 Megan Andrew Cheng Wang Peer Influence on Academic Achievement: Mean, Variance, and Network Effects under School Choice Background Many states and municipalities now allow parents to choose their children
FACTORS THAT INFLUENCE THE COLLEGE CHOICE PROCESS FOR AFRICAN AMERICAN STUDENTS. Melanie L. Hayden. Thesis submitted to the Faculty of the
 FACTORS THAT INFLUENCE THE COLLEGE CHOICE PROCESS FOR AFRICAN AMERICAN STUDENTS by Melanie L. Hayden Thesis submitted to the Faculty of the Virginia Polytechnic Institute and State University In partial
THE PENNSYLVANIA STATE UNIVERSITY SCHREYER HONORS COLLEGE DEPARTMENT OF MATHEMATICS ASSESSING THE EFFECTIVENESS OF MULTIPLE CHOICE MATH TESTS
 THE PENNSYLVANIA STATE UNIVERSITY SCHREYER HONORS COLLEGE DEPARTMENT OF MATHEMATICS ASSESSING THE EFFECTIVENESS OF MULTIPLE CHOICE MATH TESTS ELIZABETH ANNE SOMERS Spring 2011 A thesis submitted in partial
This Access Agreement is for only, to align with the WPSA and in light of the Browne Review.
 University of Essex Access Agreement 2011-12 The University of Essex Access Agreement has been updated in October 2010 to include new tuition fee and bursary provision for 2011 entry and account for the
2013 TRIAL URBAN DISTRICT ASSESSMENT (TUDA) RESULTS
 RESULTS") 3 TRIAL URBAN DISTRICT ASSESSMENT (TUDA) RESULTS Achievement and Accountability Office December 3 NAEP: The Gold Standard The National Assessment of Educational Progress (NAEP) is administered in reading
3 TRIAL URBAN DISTRICT ASSESSMENT (TUDA) RESULTS Achievement and Accountability Office December 3 NAEP: The Gold Standard The National Assessment of Educational Progress (NAEP) is administered in reading
NATIONAL CENTER FOR EDUCATION STATISTICS
 NATIONAL CENTER FOR EDUCATION STATISTICS Palm Desert, CA The Integrated Postsecondary Education Data System (IPEDS) is the nation s core postsecondary education data collection program. It is a single,
SASKATCHEWAN MINISTRY OF ADVANCED EDUCATION
 SASKATCHEWAN MINISTRY OF ADVANCED EDUCATION Report March 2017 Report compiled by Insightrix Research Inc. 1 3223 Millar Ave. Saskatoon, Saskatchewan T: 1-866-888-5640 F: 1-306-384-5655 Table of Contents
NATIONAL CENTER FOR EDUCATION STATISTICS
 NATIONAL CENTER FOR EDUCATION STATISTICS The Integrated Postsecondary Education Data System (IPEDS) is the core postsecondary education data collection program for the NCES. It is a single, comprehensive
VI-1.12 Librarian Policy on Promotion and Permanent Status
 University of Baltimore VI-1.12 Librarian Policy on Promotion and Permanent Status Approved by University Faculty Senate 2/11/09 Approved by Attorney General s Office 2/12/09 Approved by Provost 2/24/09
Teacher Supply and Demand in the State of Wyoming
 Teacher Supply and Demand in the State of Wyoming Supply Demand Prepared by Robert Reichardt 2002 McREL To order copies of Teacher Supply and Demand in the State of Wyoming, contact McREL: Mid-continent
Effective Recruitment and Retention Strategies for Underrepresented Minority Students: Perspectives from Dental Students
 Critical Issues in Dental Education Effective Recruitment and Retention Strategies for Underrepresented Minority Students: Perspectives from Dental Students Naty Lopez, Ph.D.; Rose Wadenya, D.M.D., M.S.;
Robert S. Unnasch, Ph.D.
 Introduction External Reviewer s Final Report Project DESERT Developing Expertise in Science Education, Research, and Technology National Science Foundation Grant #0849389 Arizona Western College November
Miami-Dade County Public Schools
 ENGLISH LANGUAGE LEARNERS AND THEIR ACADEMIC PROGRESS: 2010-2011 Author: Aleksandr Shneyderman, Ed.D. January 2012 Research Services Office of Assessment, Research, and Data Analysis 1450 NE Second Avenue,
Undergraduates Views of K-12 Teaching as a Career Choice
 Undergraduates Views of K-12 Teaching as a Career Choice A Report Prepared for The Professional Educator Standards Board Prepared by: Ana M. Elfers Margaret L. Plecki Elise St. John Rebecca Wedel University
Basic Skills Initiative Project Proposal Date Submitted: March 14, Budget Control Number: (if project is continuing)
") Basic Skills Initiative Project Proposal 2016-2017 Date Submitted: March 14, 2016 Check One: New Proposal: Continuing Project: X Budget Control Number: (if project is continuing) Control # 87-413 - EOPS
Basic Skills Initiative Project Proposal 2016-2017 Date Submitted: March 14, 2016 Check One: New Proposal: Continuing Project: X Budget Control Number: (if project is continuing) Control # 87-413 - EOPS
Annual Report to the Public. Dr. Greg Murry, Superintendent
 Annual Report to the Public Dr. Greg Murry, Superintendent 1 Conway Board of Education Ms. Susan McNabb Mr. Bill Clements Mr. Chuck Shipp Mr. Carl Barger Dr. Adam Lamey Dr. Quentin Washispack Mr. Andre
EXPANSION PACKET Revision: 2015
 EXPANSION PACKET Revision: 2015 Letter from the Executive Director Dear Prospective Members: We are pleased with your interest in Sigma Lambda Beta International Fraternity. Since April 4, 1986, Sigma
Psychometric Research Brief Office of Shared Accountability
 August 2012 Psychometric Research Brief Office of Shared Accountability Linking Measures of Academic Progress in Mathematics and Maryland School Assessment in Mathematics Huafang Zhao, Ph.D. This brief
CAMPUS PROFILE MEET OUR STUDENTS UNDERGRADUATE ADMISSIONS. The average age of undergraduates is 21; 78% are 22 years or younger.
 CAMPUS PROFILE MEET OUR STUDENTS Freshmen are defined here as all domestic students entering in fall quarter from high school. These statistics include information drawn from records available at UC Davis.
A Diverse Student Body
 A Diverse Student Body No two diversity plans are alike, even when expressing the importance of having students from diverse backgrounds. A top-tier school that attracts outstanding students uses this
Kansas Adequate Yearly Progress (AYP) Revised Guidance
 Revised Guidance") Kansas State Department of Education Kansas Adequate Yearly Progress (AYP) Revised Guidance Based on Elementary & Secondary Education Act, No Child Left Behind (P.L. 107-110) Revised May 2010 Revised May
Kansas State Department of Education Kansas Adequate Yearly Progress (AYP) Revised Guidance Based on Elementary & Secondary Education Act, No Child Left Behind (P.L. 107-110) Revised May 2010 Revised May
Facts and Figures Office of Institutional Research and Planning
 Facts and Figures 2008-2009 Office of Institutional Research and Planning Office of Institutional Research Fall 2009 Facts at a Glance Credit Headcount Enrollments Headcount Ethnicity Headcount Percent
Teach For America alumni 37,000+ Alumni working full-time in education or with low-income communities 86%
 About Teach For America Teach For America recruits, trains, and supports top college graduates and professionals who make an initial commitment to teach for two years in urban and rural public schools
Invest in CUNY Community Colleges
 Invest in Opportunity Invest in CUNY Community Colleges Pat Arnow Professional Staff Congress Invest in Opportunity Household Income of CUNY Community College Students
GENERAL UNIVERSITY POLICY APM REGARDING ACADEMIC APPOINTEES Limitation on Total Period of Service with Certain Academic Titles
 Important Introductory Note Please read this note before consulting APM - 133-0. I. For determining years toward the eight-year limitation of service with certain academic titles, see APM - 133-0 printed
2012 ACT RESULTS BACKGROUND
 Report from the Office of Student Assessment 31 November 29, 2012 2012 ACT RESULTS AUTHOR: Douglas G. Wren, Ed.D., Assessment Specialist Department of Educational Leadership and Assessment OTHER CONTACT
The University of North Carolina Strategic Plan Online Survey and Public Forums Executive Summary
 The University of North Carolina Strategic Plan Online Survey and Public Forums Executive Summary The University of North Carolina General Administration January 5, 2017 Introduction The University of
Albany Technical College Overview Goals Student Success and Implementation Team Conclusion Next Steps...
 ?33333 Dr. Josephine Reed-Taylor Chief Academic Officer Technical College System of Georgia 1800 Century Place, NE Atlanta, Georgia 30345-4304 December 2015 Contents Albany Technical College... 8 Overview...
Cooper Upper Elementary School
 LIVONIA PUBLIC SCHOOLS http://cooper.livoniapublicschools.org 215-216 Annual Education Report BOARD OF EDUCATION 215-16 Colleen Burton, President Dianne Laura, Vice President Tammy Bonifield, Secretary
Communication Disorders Program. Strategic Plan January 2012 December 2016
 Communication Disorders Program Strategic Plan January 2012 December 2016 Preamble The Communication Disorders Program (CD) at Georgia State University began with only one faculty member in 1974. The Program
University of Utah. 1. Graduation-Rates Data a. All Students. b. Student-Athletes
 University of Utah FRESHMAN-COHORT GRADUATION RATES All Students Student-Athletes # 2009-10 Graduation Rate 64% 64% Four-Class Average 61% 64% Student-Athlete Graduation Success Rate 87% 1. Graduation-Rates
The Diversity of STEM Majors and a Strategy for Improved STEM Retention
 2010 The Diversity of STEM Majors and a Strategy for Improved STEM Retention Cindy P. Veenstra, Ph.D. 1 3/12/2010 A discussion of the definition of STEM for college majors, a summary of interest in the
Student Mobility Rates in Massachusetts Public Schools
 Student Mobility Rates in Massachusetts Public Schools Introduction The Massachusetts Department of Elementary and Secondary Education (ESE) calculates and reports mobility rates as part of its overall
The Efficacy of PCI s Reading Program - Level One: A Report of a Randomized Experiment in Brevard Public Schools and Miami-Dade County Public Schools
 The Efficacy of PCI s Reading Program - Level One: A Report of a Randomized Experiment in Brevard Public Schools and Miami-Dade County Public Schools Megan Toby Boya Ma Andrew Jaciw Jessica Cabalo Empirical
Institution-Set Standards: CTE Job Placement Resources. February 17, 2016 Danielle Pearson, Institutional Research
 Institution-Set Standards: CTE Job Placement Resources February 17, 2016 Danielle Pearson, Institutional Research Standard 1.B.3 states: The institution establishes institution-set standards for student
Testimony to the U.S. Senate Committee on Health, Education, Labor and Pensions. John White, Louisiana State Superintendent of Education
 Testimony to the U.S. Senate Committee on Health, Education, Labor and Pensions John White, Louisiana State Superintendent of Education October 3, 2017 Chairman Alexander, Senator Murray, members of the
Financing Education In Minnesota
 Financing Education In Minnesota 2016-2017 Created with Tagul.com A Publication of the Minnesota House of Representatives Fiscal Analysis Department August 2016 Financing Education in Minnesota 2016-17
Meeting these requirements does not guarantee admission to the program.
 .Eastern Connecticut State University, School of Education & Professional Studies Committee on Admission and Retention in Education (CARE) UNDERGRADUATE ELEMENTARY Teacher Certification Application Application
FTE General Instructions
 Florida Department of Education Bureau of PK-20 Education Data Warehouse and Office of Funding and Financial Reporting FTE General Instructions 2017-18 Questions and comments regarding this publication
STEM Extension OPT Checklist
 STEM Extension OPT Checklist OPT Timeline: Review the rules and regulations about when to start OPT Have you already been approved for Post Completion OPT? End Date of Post Completion OPT Read all rules
Coming in. Coming in. Coming in
 212-213 Report Card for Glenville High School SCHOOL DISTRICT District results under review by the Ohio Department of Education based upon 211 findings by the Auditor of State. Achievement This grade combines
For the Ohio Board of Regents Second Report on the Condition of Higher Education in Ohio
 Facilities and Technology Infrastructure Report For the Ohio Board of Regents Second Report on the Condition of Higher Education in Ohio Introduction. As Ohio s national research university, Ohio State
Swarthmore College Common Data Set
 Swarthmore College Common Data Set 2015 2016 Office of Institutional Research Swarthmore College Common Data Set 2015-2016 Table of Contents Section Page A. General Information... 1 B. Enrollment and Persistence...
TACOMA HOUSING AUTHORITY
 TACOMA HOUSING AUTHORITY CHILDREN s SAVINGS ACCOUNT for the CHILDREN of NEW SALISHAN, Tacoma, WA last revised July 10, 2014 1. SUMMARY The Tacoma Housing Authority (THA) plans to offer individual development
Descriptive Summary of Beginning Postsecondary Students Two Years After Entry
 NATIONAL CENTER FOR EDUCATION STATISTICS Statistical Analysis Report June 994 Descriptive Summary of 989 90 Beginning Postsecondary Students Two Years After Entry Contractor Report Robert Fitzgerald Lutz
University of Toronto
 University of Toronto OFFICE OF THE VICE PRESIDENT AND PROVOST 1. Introduction A Framework for Graduate Expansion 2004-05 to 2009-10 In May, 2000, Governing Council Approved a document entitled Framework
National Collegiate Retention and. Persistence-to-Degree Rates
 National Collegiate Retention and Persistence-to-Degree Rates Since 1983, ACT has collected a comprehensive database of first-to-second-year retention rates and persistence-to-degree rates. These rates
Serving Country and Community: A Study of Service in AmeriCorps. A Profile of AmeriCorps Members at Baseline. June 2001
 Serving Country and Community: A Study of Service in AmeriCorps Cambridge, MA Lexington, MA Hadley, MA Bethesda, MD Washington, DC Chicago, IL Cairo, Egypt Johannesburg, South Africa A Profile of AmeriCorps
School Performance Plan Middle Schools
 SY 2012-2013 School Performance Plan Middle Schools 734 Middle ALternative Program @ Lombard, Principal Roger Shaw (Interim), Executive Director, Network Facilitator PLEASE REFER TO THE SCHOOL PERFORMANCE