Worksheets for GCSE Mathematics. Representing Data. Mr Black's Maths Resources for Teachers GCSE 1-9. Handling Data
|
|
|
- Noreen West
- 5 years ago
- Views:
Transcription


1 Worksheets for GCSE Mathematics Representing Data Mr Black's Maths Resources for Teachers GCSE 1-9 Handling Data
2 Representing Data Worksheets Contents Differentiated Independent Learning Worksheets Pictograms Bar Charts Dual & Compound Bar Charts Drawing Pie Charts Interpreting Pie Charts Stem & Leaf Diagrams Frequency Polygons Time Series Cumulative Frequency Graphs Cumulative Frequency Graphs & Box Plots Interpreting Box and Whisker Diagrams Drawing Histograms Interpreting Histograms Page 3 Page 4 Page 5 Page 6 Page 7 Page 8 Page 9 Page 10 Page 11 Page 12 Page 13 Page 14 Page 15 Solutions Pictograms Bar Charts Dual & Compound Bar Charts Drawing Pie Charts Interpreting Pie Charts Stem & Leaf Diagrams Frequency Polygons Time Series Cumulative Frequency Graphs Cumulative Frequency Graphs & Box Plots Interpreting Box and Whisker Diagrams Drawing Histograms Interpreting Histograms Page 16 Page 17 Page 18 Page 19 Page 20 Page 21 Page 22 Page 23 Page 24 Page 26 Page 27 Page 28 Page 300 2


3 Pictograms Q1. This pictogram shows the favourite sports in Year 7. Football d) e) f) Which is the most popular sport? Which is the least popular sport? How many people have basketball as their favourite sport? How many people chose golf? How many more people prefer football to tennis? How many people were included in the survey? Basketball Tennis Golf Key: = 4 students Q2. d) e) f) This pictogram shows the favourite musical instrument of Year 8 students. Which is the most popular instrument? Which is the least popular instrument? How many people have piano as their favourite instrument? How many people chose harp? How many more people prefer guitar to violin? How many people were included in the survey? Guitar Drums Piano Harp Violin Key: = 8 students Q3. Class 9U took part in a survey. Their results are shown in the four frequency tables. Use a pictogram with your own key to represent each set of data. d) 3

 e) Here are the results of a survey about the favourite subjects for students in Year 7. Which is the most popular subject?")


4 Q1. d) e) Here are the results of a survey about the favourite pets for students in Year 8. Which is the most popular pet? Which is the least popular pet? How many people prefer Hamster s over Rabbits? How many more people prefer Dogs to Cats? How many people were included in the survey? Bar Charts Q2. d) e) Here are the results of a survey about the favourite subjects for students in Year 7. Which is the most popular subject? Which is the least popular subject? How many people prefer Science over Geography? How many more people prefer Maths to English? How many people were included in the survey? Q3. Year 9 were surveyed. Their results are shown in the four frequency tables. Represent the data using bar charts. Q4. Simon does a survey about peoples favourite sport. Here are her results. Other, Running, Hockey, Hockey, Hockey, Rugby, Tennis, Rugby, Rugby, Rugby, Football, Hockey, Football, Rugby, Hockey, Tennis, Running, Other, Hockey, Football, Hockey, Tennis, Football, Running, Tennis, Hockey, Running, Rugby, Rugby, Hockey, Rugby, Tennis, Running, Rugby, Running, Tennis, Hockey, Tennis, Other, Football, Football, Rugby, Football, Other, Other, Other Organise the data into a tally chart. Represent the data using a bar chart. i) Which sport is the most popular? ii) Which sport is the least popular? iii) How many more people prefer Hockey to Football? 4


5 Q1. d) Boys in primary and secondary school were asked to name their favourite subject. This dual bar chart shows the results. Which subject is most popular at primary school? Which subject is least popular at secondary school? Which subject became most popular from primary to secondary? Which subject became less popular at secondary after primary school? Compound & Dual Bar Charts Q2. d) e) Students in year 7 and 8 were each asked whether they were for or against wearing school uniform. The compound bar chart shows the results. How many students in year 7 are for uniforms? How many students in year 8 are against? How many students in year 7 are against uniforms? In total, how many students are for uniforms? In total, how many students are against uniforms? Q3. a ) A group of students were asked how they travelled to and from school. The table below shows the results. A group of students were surveyed about their favourite snack. The table below shows the results. Create a dual bar chart to represent the data. Create a dual bar chart to represent the data. Q4. A survey was carried out to determine how people s preferred film genre changed over time. The results are shown. Represent the data using a compound bar chart. Describe how people s favourite movie genre changes as they get older. 5


6 Drawing Pie Charts Q1. A survey of 18 people is carried out to understand information about their working life. The results are shown below. Create a pie chart for each set of data. d) Q2. A survey was carried out to find the favourite pet for students in year 9. The results are shown below. Create a pie chart to represent the data. Q3. A coffee shop carried out a survey to determine the most popular type of drink. The results are shown in this bar chart. Favourite Drink Survey Other Tea Drink Espresso Cappuccino Americano Latte Frequency Create a pie chart to represent the same set of data. Which representation, bar chart or pie chart, do you think is the best? Explain why. 6


7 Interpreting Pie Charts Q1. Match pie charts A, B, C and D to the correct data set. Q2. The pie chart on the right shows the proportion of student s favourite subject in a high school. What fraction of the students prefer Maths? 24 people took part in the survey. Calculate how many students chose each of the subjects. Q3. Elliot asked pupils in his school to name their favourite pizza topping. The pie chart shows his results. What fraction of people said chicken was their favourite topping? 18 students said vegetable was their favourite topping. How many people took part in the survey overall? How many more people prefer pineapple to ham? Q4. Simon and Jane carried out a survey to compare the makes of cars on two streets. The results are shown in the pie charts. Simon says half the cars on North Street are either Mercedes or Renault. Is he correct? Do the pie charts tell you which street has the most Renaults? Explain your answer. Based on the pie charts, what can you tell about the two neighbourhoods? 7
8 Stem & Leaf Diagrams Q1. Organise these data into the Stem and Leaf diagram Q2. Organise these data into the Stem and Leaf diagram Q3. Organise these data into the Stem and Leaf diagram Calculate the modal average. Calculate the range of the data. Q4. Organise these data into the Stem and Leaf diagram Calculate the modal average. Calculate the median average. Calculate the range of the data


9 Q1. d) A group of people were asked how long they had to wait for a train, What is the modal waiting time? How many people waited between 20 and 25 minutes? How many less people waited between 5 to 10 minutes than 10 to 15? How many people were included in the survey? Frequency Diagrams and Polygons Q2. The table shows the waiting time for 60 customers at a local Doctor s surgery. Draw a frequency diagram to represent the data. Q3. Participants in an after school P.E. class were asked to balance on one leg for as long as possible. The frequency table shows the results. Draw a frequency polygon to represent the data. Q4. Marisa recorded the number of hours of bright sunshine each day in for a period of time during a 34 day period. The frequency polygon shows her results. In which season is she likely to have carried out her survey? How many days fell in the class for 2 to 2.5 hours? What is the modal class for this data? 9
10 Time Series Q1. Describe the trend shown by each time series graph. Q2. The number of people absent from work were recorded. Week 1 Week 2 Week 3 M T W Th F M T W Th F M T W Th F Plot the data on a time series graph and draw a trend line by eye Sales ( oo's) Q1 Q2 Q3 Q4 Q1 Q2 Q3 Q4 Q1 Q2 Q3 Q4 Q1 Q2 Time d) On which day is the absence greatest? On which day is the absence the least? Suggest a reason for the difference in absenteeism between the two days. Q3. The table shows the quarterly sales figures for a small company over the past 3 ½ years. Q1 Q2 Q3 Q4 Q1 Q2 Q3 Q4 Q1 Q2 Q3 Q4 Q1 Q2 Sales ( 00's) Plot these figures as a time series graph. Plot a trend line and describe the overall trend shown. Use the trend line to predict the sales figure for the third quarter in the third year. 10


11 Q1. Cumulative Frequency A group of 40 students took an exam. Their results are recorded in the table below. d) Complete the cumulative frequency table. Plot the cumulative frequency graph. How many students scored above 45 marks? How many students scored less than 16 marks? Q2. The weights of 80 people between the age of are recorded in the table below. d) e) f) Complete the cumulative frequency table. Plot the cumulative frequency graph. How many people weigh over 62 kg. How many people weigh less than 35 kg? How many people weigh between 35 and 62 kg? How many people weigh between 41 and 76 kg? Q3. The heights of 36 boys and girls aged 12 years old are shown in the cumulative frequency graphs below. Write the median average height for each of the boys and girls. How many boys are between 1.25 and 1.55 meters tall? How many girls are taller than 1.45 meters? d) How many boys are taller than 1.45 meters? e) Comment on the difference in height between the boys and girls based on your findings. 11
 adults ii) children.")
12 Cumulative Frequency Graphs & Box Plots Q1. The following cumulative frequency graph shows the time taken in seconds for a group of 44 children and adults to complete a puzzle. Use the cumulative frequency graphs to draw a box plot showing the median and interquartile range for the: i) adults ii) children. Write a statement to compare the two sets of time taken including the median and interquartile range. Q2. The tables below show the waiting time at two different doctor s surgeries. The shortest waiting time at surgery A was 4 minutes and the longest time was 23 minutes. The shortest waiting time at surgery B was 2 minutes and the longest time was 18 minutes. d) Construct a cumulative frequency table for i) Surgery A ii) Surgery B Draw, on a single pair of axes a the cumulative frequency curve for i) Surgery A ii) Surgery B Draw a box and whisker diagram for each of the surgeries to show the key statistical data. Make a comparison of the two surgeries waiting times. 12
 Plant A ii) Plant B What is the interquartile range for: i) Plant A ii) Plant B Compare the two distributions by commenting on the median and IQR.")
 Mathematics ii) Science What is the interquartile range for: i) Mathematics ii) Science Compare the two distributions by commenting on the median and IQR. Q3.")
13 Q1. The lengths of two types of plants are recorded. The box plots show their results. What is the median average for: i) Plant A ii) Plant B What is the interquartile range for: i) Plant A ii) Plant B Compare the two distributions by commenting on the median and IQR. Interpreting Box Plots Q2. A group of students take a science and mathematics exam. The box plots show their results. What is the median average for: i) Mathematics ii) Science What is the interquartile range for: i) Mathematics ii) Science Compare the two distributions by commenting on the median and IQR. Q3. A groups of students sit an exam. Their results are analyzed by gender. The box plot below shows the results for the girls. The results for the boys are given as: Minimum Percentage = 32% Lower Quartile = 43% Median = 54% Upper Quartile = 59% Maximum Percentage = 75% Draw the box plot to represent the boys performance. Compare the two distributions by commenting on the median and interquartile range. 13
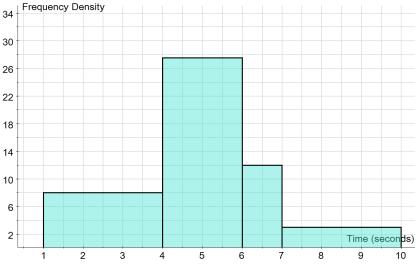
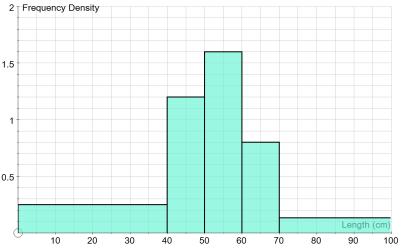
 20 s < 24 24 s < 25 25 s < 26 26 s < 28 Frequency 12 35 38 21 Time, t (seconds) 1 t < 4 4 t < 6 6 t < 7 7 t < 10 Frequency 24 55 12 9 Length, L (cm) 0 L < 40 40 L < 50 50 L < 60 60 L")
14 Drawing Histograms Q1. Draw histograms for these grouped frequency distributions. Speed, s (km/h) 20 s < s < s < s < 28 Frequency Time, t (seconds) 1 t < 4 4 t < 6 6 t < 7 7 t < 10 Frequency Length, L (cm) 0 L < L < L < L < L < 100 Frequency Q2. Eric works in a customer service centre. The table shows some information about the length of time, t, minutes of the calls he had. Draw a histogram to show this information. Q3. Sophie works in a cable production factory. She records the lengths of each of 100 cables that she makes one day. Sophie drew an incorrect histogram to represent the data. Explain what Sophie has done wrong. Draw a correct histogram to represent the data. 14


15 Interpreting Histograms Q1. This frequency table shows the time taken for 320 people to run 200 m. Estimate how many people ran between 60 and 70 seconds. Estimate how many people ran between 80 and 90 seconds. Estimate how many people took more than 78 seconds to complete 200 m. Q2. This histogram shows the heights for a group of students. Construct a frequency table for this data to show how many students are included in each class interval. Q3. A survey was carried out to find the speeds of cars passing a particular point on the M6. The histogram illustrates the results of the survey. Work out an estimate for the mean average speed of the cars on this part of the M6. 15
16 Solutions Pictograms Q1. Football Golf 8 d) 6 e) 2 f) 44 Q2. Guitar Harp 32 d) 18 e) 14 f) 136 Q3. Check students work using their key as a reference. 16

 40 Q2.")


17 Bar Charts Q1. Dog Other 3 d) 4 e) 40 Q2. Maths Geography 2 d) 3 e) 44 Q3. Q4. i) Hockey and Rugby ii) Other iii) 3 17
 English,")
 32 e) 28 Q3. Q4.")

18 Solutions Compound & Dual Bar Charts Q1. Maths History Maths d) English, History, P.E. Q d) 32 e) 28 Q3. Q4. As people get older they prefer action and comedy genres. Younger viewers tend to prefer animated movies. 18

")

19 Solutions Drawing Pie Charts d) Q2. Q3. 19
20 Solutions Interpreting Pie Charts Q1. A -> 4, B -> 1, C -> 3, D -> 2 Q2. Maths = 1 3 P.E. = 4, Maths = 8, Music= 8, French = 6, Drama = 5 Q3. Chicken = people 9 people Q4. Yes, = 180 No, population sizes not known. North Street is likely to be more effluent o to the makes of cars. 20
21 Stem & Leaf Diagrams Solutions Q1. Q2. Q3. Q4. Mode = 7.7 Median = 6.2 Range =

 55 people Q2. Q3. Q4.")
22 Frequency Diagrams and Polygons Solutions Q minutes 5 minutes 14 people d) 55 people Q2. Q3. Q4. Winter 6 days hours 22
 People could have been ill over the past weekend and are likely to have recovered by")
23 Solutions Time Series Q1. A -> Downward trend, B -> Upward trend, C -> Level trend Q2. Monday Wednesday d) People could have been ill over the past weekend and are likely to have recovered by Wednesday. Q3. a,


 6")
24 Solutions Q1. Cumulative Frequency 34 people d) 6 people Q2. 24
25 Cumulative Frequency 40 people. d) 4 people. e) 36 people. f) 60 people. Q3. Girls median = 1.34 m; Boys Median = 1.52 m 14 boys 29 Girls d) 12 Boys e) Boys are generally taller than girls. 25

 Surgery A has the longer average waiting time.")
26 Q1. Cumulative Frequency Graphs & Box Plots Children take approximately 4 seconds longer to complete the puzzle than adults. However, adults are consistent due to the larger interquartile range. Q2. d) Surgery A has the longer average waiting time. Surgery B is less consistent since it has a larger interquartile range. 26
 40 marks ii) 37 marks i) 9 marks ii) 12 marks The median students scored 3 marks higher in the mathematics exam than science.")
27 Solutions Interpreting Box Plots Q1. i) 14 cm ii) 11 cm i) 16 cm ii) 7 cm The median shows plant A, on average is 3 cm taller than plant B. The interquartile range shows plant B is more consistent. Q2. i) 40 marks ii) 37 marks i) 9 marks ii) 12 marks The median students scored 3 marks higher in the mathematics exam than science. The interquartile range shows students were more consistent in mathematics than science. Q3. Boys and girls tend to have a similar percentage in the exam as shown by the median averages. However, the boys were more consistent in the exam than girls since they have a lower interquartile range. 27

28 Solutions Drawing Histograms Q1 28


29 Q2. Drawing Histograms Q3. Sophie plotted frequency rather than frequency density. 29

30 Solutions Interpreting Histograms Q1. 40 people 87 people 160 people Q2. Q3. Mean Estimate = 99 km/h 30
Probability and Statistics Curriculum Pacing Guide
 Unit 1 Terms PS.SPMJ.3 PS.SPMJ.5 Plan and conduct a survey to answer a statistical question. Recognize how the plan addresses sampling technique, randomization, measurement of experimental error and methods
Measures of the Location of the Data
 OpenStax-CNX module m46930 1 Measures of the Location of the Data OpenStax College This work is produced by OpenStax-CNX and licensed under the Creative Commons Attribution License 3.0 The common measures
Shockwheat. Statistics 1, Activity 1
 Statistics 1, Activity 1 Shockwheat Students require real experiences with situations involving data and with situations involving chance. They will best learn about these concepts on an intuitive or informal
Introduction to the Practice of Statistics
 Chapter 1: Looking at Data Distributions Introduction to the Practice of Statistics Sixth Edition David S. Moore George P. McCabe Bruce A. Craig Statistics is the science of collecting, organizing and
Edexcel GCSE. Statistics 1389 Paper 1H. June Mark Scheme. Statistics Edexcel GCSE
 Edexcel GCSE Statistics 1389 Paper 1H June 2007 Mark Scheme Edexcel GCSE Statistics 1389 NOTES ON MARKING PRINCIPLES 1 Types of mark M marks: method marks A marks: accuracy marks B marks: unconditional
Level 1 Mathematics and Statistics, 2015
 91037 910370 1SUPERVISOR S Level 1 Mathematics and Statistics, 2015 91037 Demonstrate understanding of chance and data 9.30 a.m. Monday 9 November 2015 Credits: Four Achievement Achievement with Merit
Lesson M4. page 1 of 2
 Lesson M4 page 1 of 2 Miniature Gulf Coast Project Math TEKS Objectives 111.22 6b.1 (A) apply mathematics to problems arising in everyday life, society, and the workplace; 6b.1 (C) select tools, including
The following shows how place value and money are related. ones tenths hundredths thousandths
 2-1 The following shows how place value and money are related. ones tenths hundredths thousandths (dollars) (dimes) (pennies) (tenths of a penny) Write each fraction as a decimal and then say it. 1. 349
STT 231 Test 1. Fill in the Letter of Your Choice to Each Question in the Scantron. Each question is worth 2 point.
 STT 231 Test 1 Fill in the Letter of Your Choice to Each Question in the Scantron. Each question is worth 2 point. 1. A professor has kept records on grades that students have earned in his class. If he
GCSE Mathematics B (Linear) Mark Scheme for November Component J567/04: Mathematics Paper 4 (Higher) General Certificate of Secondary Education
 Mark Scheme for November Component J567/04: Mathematics Paper 4 (Higher) General Certificate of Secondary Education") GCSE Mathematics B (Linear) Component J567/04: Mathematics Paper 4 (Higher) General Certificate of Secondary Education Mark Scheme for November 2014 Oxford Cambridge and RSA Examinations OCR (Oxford Cambridge
GCSE Mathematics B (Linear) Component J567/04: Mathematics Paper 4 (Higher) General Certificate of Secondary Education Mark Scheme for November 2014 Oxford Cambridge and RSA Examinations OCR (Oxford Cambridge
Grade 6: Correlated to AGS Basic Math Skills
 Grade 6: Correlated to AGS Basic Math Skills Grade 6: Standard 1 Number Sense Students compare and order positive and negative integers, decimals, fractions, and mixed numbers. They find multiples and
Research Design & Analysis Made Easy! Brainstorming Worksheet
 Brainstorming Worksheet 1) Choose a Topic a) What are you passionate about? b) What are your library s strengths? c) What are your library s weaknesses? d) What is a hot topic in the field right now that
Broward County Public Schools G rade 6 FSA Warm-Ups
 Day 1 1. A florist has 40 tulips, 32 roses, 60 daises, and 50 petunias. Draw a line from each comparison to match it to the correct ratio. A. tulips to roses B. daises to petunias C. roses to tulips D.
MULTIPLE CHOICE. Choose the one alternative that best completes the statement or answers the question.
 Ch 2 Test Remediation Work Name MULTIPLE CHOICE. Choose the one alternative that best completes the statement or answers the question. Provide an appropriate response. 1) High temperatures in a certain
UNIT ONE Tools of Algebra
 UNIT ONE Tools of Algebra Subject: Algebra 1 Grade: 9 th 10 th Standards and Benchmarks: 1 a, b,e; 3 a, b; 4 a, b; Overview My Lessons are following the first unit from Prentice Hall Algebra 1 1. Students
Paper Reference. Edexcel GCSE Mathematics (Linear) 1380 Paper 1 (Non-Calculator) Foundation Tier. Monday 6 June 2011 Afternoon Time: 1 hour 30 minutes
 1380 Paper 1 (Non-Calculator) Foundation Tier. Monday 6 June 2011 Afternoon Time: 1 hour 30 minutes") Centre No. Candidate No. Paper Reference 1 3 8 0 1 F Paper Reference(s) 1380/1F Edexcel GCSE Mathematics (Linear) 1380 Paper 1 (Non-Calculator) Foundation Tier Monday 6 June 2011 Afternoon Time: 1 hour
Centre No. Candidate No. Paper Reference 1 3 8 0 1 F Paper Reference(s) 1380/1F Edexcel GCSE Mathematics (Linear) 1380 Paper 1 (Non-Calculator) Foundation Tier Monday 6 June 2011 Afternoon Time: 1 hour
Numeracy Medium term plan: Summer Term Level 2C/2B Year 2 Level 2A/3C
 Numeracy Medium term plan: Summer Term Level 2C/2B Year 2 Level 2A/3C Using and applying mathematics objectives (Problem solving, Communicating and Reasoning) Select the maths to use in some classroom
Paper 2. Mathematics test. Calculator allowed. First name. Last name. School KEY STAGE TIER
 259574_P2 5-7_KS3_Ma.qxd 1/4/04 4:14 PM Page 1 Ma KEY STAGE 3 TIER 5 7 2004 Mathematics test Paper 2 Calculator allowed Please read this page, but do not open your booklet until your teacher tells you
AP Statistics Summer Assignment 17-18
 AP Statistics Summer Assignment 17-18 Welcome to AP Statistics. This course will be unlike any other math class you have ever taken before! Before taking this course you will need to be competent in basic
Mathematics process categories
 Mathematics process categories All of the UK curricula define multiple categories of mathematical proficiency that require students to be able to use and apply mathematics, beyond simple recall of facts
EDEXCEL FUNCTIONAL SKILLS PILOT
 EDEXCEL FUNCTIONAL SKILLS PILOT Maths Level 1 Chapter 6 Working with data and averages SECTION I Working with data 1 Collecting, recording and representing information 95 2 Interpreting data from tables
AGS THE GREAT REVIEW GAME FOR PRE-ALGEBRA (CD) CORRELATED TO CALIFORNIA CONTENT STANDARDS
 CORRELATED TO CALIFORNIA CONTENT STANDARDS") AGS THE GREAT REVIEW GAME FOR PRE-ALGEBRA (CD) CORRELATED TO CALIFORNIA CONTENT STANDARDS 1 CALIFORNIA CONTENT STANDARDS: Chapter 1 ALGEBRA AND WHOLE NUMBERS Algebra and Functions 1.4 Students use algebraic
AGS THE GREAT REVIEW GAME FOR PRE-ALGEBRA (CD) CORRELATED TO CALIFORNIA CONTENT STANDARDS 1 CALIFORNIA CONTENT STANDARDS: Chapter 1 ALGEBRA AND WHOLE NUMBERS Algebra and Functions 1.4 Students use algebraic
What s Different about the CCSS and Our Current Standards?
 The Common Core State Standards and CPM Educational Program The Need for Change in Our Educational System: College and Career Readiness Students are entering into a world that most of us would have found
Student s Edition. Grade 6 Unit 6. Statistics. Eureka Math. Eureka Math
 Student s Edition Grade 6 Unit 6 Statistics Eureka Math Eureka Math Lesson 1 Lesson 1: Posing Statistical Questions Statistics is about using data to answer questions. In this module, the following four
Functional Skills Mathematics Level 2 assessment
 Functional Skills Mathematics Level 2 assessment www.cityandguilds.com September 2015 Version 1.0 Marking scheme ONLINE V2 Level 2 Sample Paper 4 Mark Represent Analyse Interpret Open Fixed S1Q1 3 3 0
Association Between Categorical Variables
 Student Outcomes Students use row relative frequencies or column relative frequencies to informally determine whether there is an association between two categorical variables. Lesson Notes In this lesson,
Functional Skills Mathematics Level 2 sample assessment
 Functional Skills Mathematics Level 2 sample assessment Sample paper 3 Candidate Name (First, Middle, Last) www.cityandguilds.com May 2015 Version 1-3 Total marks Task Mark Candidate enrolment number DOB
May To print or download your own copies of this document visit Name Date Eurovision Numeracy Assignment
 1. An estimated one hundred and twenty five million people across the world watch the Eurovision Song Contest every year. Write this number in figures. 2. Complete the table below. 2004 2005 2006 2007
After your registration is complete and your proctor has been approved, you may take the Credit by Examination for MATH 6A.
 MATH 6A Mathematics, Grade 6, First Semester #03 (v.3.0) To the Student: After your registration is complete and your proctor has been approved, you may take the Credit by Examination for MATH 6A. WHAT
Using Proportions to Solve Percentage Problems I
 RP7-1 Using Proportions to Solve Percentage Problems I Pages 46 48 Standards: 7.RP.A. Goals: Students will write equivalent statements for proportions by keeping track of the part and the whole, and by
THE ALTON SCHOOL GUIDE TO SPORT
 THE ALTON SCHOOL GUIDE TO SPORT Index Page Number: 2 Welcome from the Director of Sport 3 The PE Department 4 Life skills learnt from sport 5 Lifelong participation in sport 6 Parent guidelines at sporting
Chapters 1-5 Cumulative Assessment AP Statistics November 2008 Gillespie, Block 4
 Chapters 1-5 Cumulative Assessment AP Statistics Name: November 2008 Gillespie, Block 4 Part I: Multiple Choice This portion of the test will determine 60% of your overall test grade. Each question is
The Editor s Corner. The. Articles. Workshops. Editor. Associate Editors. Also In This Issue
 The S tatistics T eacher N etwork www.amstat.org/education/stn Number 73 ASA/NCTM Joint Committee on the Curriculum in Statistics and Probability Fall 2008 The Editor s Corner We hope you enjoy Issue 73
Math-U-See Correlation with the Common Core State Standards for Mathematical Content for Third Grade
 Math-U-See Correlation with the Common Core State Standards for Mathematical Content for Third Grade The third grade standards primarily address multiplication and division, which are covered in Math-U-See
Montana Content Standards for Mathematics Grade 3. Montana Content Standards for Mathematical Practices and Mathematics Content Adopted November 2011
 Montana Content Standards for Mathematics Grade 3 Montana Content Standards for Mathematical Practices and Mathematics Content Adopted November 2011 Contents Standards for Mathematical Practice: Grade
Cincinnati Country Day Middle School Parents Athletics Handbook
 Cincinnati Country Day Middle School Parents Athletics Handbook 8/14/2016 Table of Contents: Introduction:... 1 CCDS Motto, Character Virtues, and Code of Conduct:... 1 7th & 8th Grade Athletic Code:...
Sample Problems for MATH 5001, University of Georgia
 Sample Problems for MATH 5001, University of Georgia 1 Give three different decimals that the bundled toothpicks in Figure 1 could represent In each case, explain why the bundled toothpicks can represent
Investigations for Chapter 1. How do we measure and describe the world around us?
 1 Chapter 1 Forces and Motion Introduction to Chapter 1 This chapter is about measurement and how we use measurements and experiments to learn about the world. Two fundamental properties of the universe
JUNIOR HIGH SPORTS MANUAL GRADES 7 & 8
 JUNIOR HIGH SPORTS MANUAL GRADES 7 & 8 The purpose of this Junior High Sports Manual is to clarify the rules and regulations for seventh and eighth grade girls athletics for the member schools of the Iowa
Living & Learning Together
 Living & Learning Together Friday, 17th February, 2017 Acting Principal Mr Ryan Trama Teachers Mrs Libby Johnson Mrs Louise Fulwood Mrs Allie Hill Student Support Teacher Mrs Kelly Webster Students of
Statistics and Probability Standards in the CCSS- M Grades 6- HS
 Statistics and Probability Standards in the CCSS- M Grades 6- HS Grade 6 Develop understanding of statistical variability. -6.SP.A.1 Recognize a statistical question as one that anticipates variability
Math 121 Fundamentals of Mathematics I
 I. Course Description: Math 121 Fundamentals of Mathematics I Math 121 is a general course in the fundamentals of mathematics. It includes a study of concepts of numbers and fundamental operations with
Foothill College Fall 2014 Math My Way Math 230/235 MTWThF 10:00-11:50 (click on Math My Way tab) Math My Way Instructors:
 Math My Way Instructors:") This is a team taught directed study course. Foothill College Fall 2014 Math My Way Math 230/235 MTWThF 10:00-11:50 www.psme.foothill.edu (click on Math My Way tab) Math My Way Instructors: Instructor:
This is a team taught directed study course. Foothill College Fall 2014 Math My Way Math 230/235 MTWThF 10:00-11:50 www.psme.foothill.edu (click on Math My Way tab) Math My Way Instructors: Instructor:
This document has been produced by:
 year 6 This document has been produced by: The All Wales ESDGC Officer Group to support schools introducing the National Literacy and Numeracy Framework through ESDGC activities. With support from: Developing
STA 225: Introductory Statistics (CT)
") Marshall University College of Science Mathematics Department STA 225: Introductory Statistics (CT) Course catalog description A critical thinking course in applied statistical reasoning covering basic
Marshall University College of Science Mathematics Department STA 225: Introductory Statistics (CT) Course catalog description A critical thinking course in applied statistical reasoning covering basic
Enhancing Students Understanding Statistics with TinkerPlots: Problem-Based Learning Approach
 Enhancing Students Understanding Statistics with TinkerPlots: Problem-Based Learning Approach Krongthong Khairiree drkrongthong@gmail.com International College, Suan Sunandha Rajabhat University, Bangkok,
MINUTE TO WIN IT: NAMING THE PRESIDENTS OF THE UNITED STATES
 MINUTE TO WIN IT: NAMING THE PRESIDENTS OF THE UNITED STATES THE PRESIDENTS OF THE UNITED STATES Project: Focus on the Presidents of the United States Objective: See how many Presidents of the United States
Mathematics subject curriculum
 Mathematics subject curriculum Dette er ei omsetjing av den fastsette læreplanteksten. Læreplanen er fastsett på Nynorsk Established as a Regulation by the Ministry of Education and Research on 24 June
Algebra 2- Semester 2 Review
 Name Block Date Algebra 2- Semester 2 Review Non-Calculator 5.4 1. Consider the function f x 1 x 2. a) Describe the transformation of the graph of y 1 x. b) Identify the asymptotes. c) What is the domain
Algebra 1, Quarter 3, Unit 3.1. Line of Best Fit. Overview
 Algebra 1, Quarter 3, Unit 3.1 Line of Best Fit Overview Number of instructional days 6 (1 day assessment) (1 day = 45 minutes) Content to be learned Analyze scatter plots and construct the line of best
Radius STEM Readiness TM
 Curriculum Guide Radius STEM Readiness TM While today s teens are surrounded by technology, we face a stark and imminent shortage of graduates pursuing careers in Science, Technology, Engineering, and
Characteristics of Functions
 Characteristics of Functions Unit: 01 Lesson: 01 Suggested Duration: 10 days Lesson Synopsis Students will collect and organize data using various representations. They will identify the characteristics
MODULE FRAMEWORK AND ASSESSMENT SHEET
 MODULE FRAMEWORK AND ASSESSMENT SHEET LEARNING OUTCOMES (LOS) ASSESSMENT STANDARDS (ASS) FORMATIVE ASSESSMENT ASs Pages and (mark out of ) LOs (ave. out of ) SUMMATIVE ASSESSMENT Tasks or tests Ave for
Grade Band: High School Unit 1 Unit Target: Government Unit Topic: The Constitution and Me. What Is the Constitution? The United States Government
 The Constitution and Me This unit is based on a Social Studies Government topic. Students are introduced to the basic components of the U.S. Constitution, including the way the U.S. government was started
FOR TEACHERS ONLY. The University of the State of New York REGENTS HIGH SCHOOL EXAMINATION PHYSICAL SETTING/PHYSICS
 PS P FOR TEACHERS ONLY The University of the State of New York REGENTS HIGH SCHOOL EXAMINATION PHYSICAL SETTING/PHYSICS Thursday, June 21, 2007 9:15 a.m. to 12:15 p.m., only SCORING KEY AND RATING GUIDE
2 nd Grade Math Curriculum Map
 .A.,.M.6,.M.8,.N.5,.N.7 Organizing Data in a Table Working with multiples of 5, 0, and 5 Using Patterns in data tables to make predictions and solve problems. Solving problems involving money. Using a
Math 96: Intermediate Algebra in Context
 : Intermediate Algebra in Context Syllabus Spring Quarter 2016 Daily, 9:20 10:30am Instructor: Lauri Lindberg Office Hours@ tutoring: Tutoring Center (CAS-504) 8 9am & 1 2pm daily STEM (Math) Center (RAI-338)
Science Fair Project Handbook
 Science Fair Project Handbook IDENTIFY THE TESTABLE QUESTION OR PROBLEM: a) Begin by observing your surroundings, making inferences and asking testable questions. b) Look for problems in your life or surroundings
Name: Class: Date: ID: A
 Name: Class: _ Date: _ Test Review Multiple Choice Identify the choice that best completes the statement or answers the question. 1. Members of a high school club sold hamburgers at a baseball game to
Extending Place Value with Whole Numbers to 1,000,000
 Grade 4 Mathematics, Quarter 1, Unit 1.1 Extending Place Value with Whole Numbers to 1,000,000 Overview Number of Instructional Days: 10 (1 day = 45 minutes) Content to Be Learned Recognize that a digit
TOPICS LEARNING OUTCOMES ACTIVITES ASSESSMENT Numbers and the number system
 Curriculum Overview Mathematics 1 st term 5º grade - 2010 TOPICS LEARNING OUTCOMES ACTIVITES ASSESSMENT Numbers and the number system Multiplies and divides decimals by 10 or 100. Multiplies and divide
Answer Key For The California Mathematics Standards Grade 1
 Introduction: Summary of Goals GRADE ONE By the end of grade one, students learn to understand and use the concept of ones and tens in the place value number system. Students add and subtract small numbers
Simple Random Sample (SRS) & Voluntary Response Sample: Examples: A Voluntary Response Sample: Examples: Systematic Sample Best Used When
 & Voluntary Response Sample: Examples: A Voluntary Response Sample: Examples: Systematic Sample Best Used When") Simple Random Sample (SRS) & Voluntary Response Sample: In statistics, a simple random sample is a group of people who have been chosen at random from the general population. A simple random sample is
Simple Random Sample (SRS) & Voluntary Response Sample: In statistics, a simple random sample is a group of people who have been chosen at random from the general population. A simple random sample is
OVERVIEW OF CURRICULUM-BASED MEASUREMENT AS A GENERAL OUTCOME MEASURE
 OVERVIEW OF CURRICULUM-BASED MEASUREMENT AS A GENERAL OUTCOME MEASURE Mark R. Shinn, Ph.D. Michelle M. Shinn, Ph.D. Formative Evaluation to Inform Teaching Summative Assessment: Culmination measure. Mastery
Students of the week. Living & Learning Together. https://www.facebook.com/pages/thallon-state-school/
 Living & Learning Together Friday, 19th August 2016 Acting Principal Mr Ryan Trama Teachers Mrs Libby Johnson Mrs Louise Fulwood Mrs Annette McLean Student Support Teacher Mrs Louise Cowley Support Staff
Fourth Grade. Reporting Student Progress. Libertyville School District 70. Fourth Grade
 Fourth Grade Libertyville School District 70 Reporting Student Progress Fourth Grade A Message to Parents/Guardians: Libertyville Elementary District 70 teachers of students in kindergarten-5 utilize a
About our academy. Joining our community
 Hethersett Academy is part of the Inspiration Trust, a not-for-profit charity whose mission is to transform the lives of young people in Norfolk and Suffolk through education. Led by nationally-recognised
Level: 5 TH PRIMARY SCHOOL
 Level: 5 TH PRIMARY SCHOOL GENERAL AIMS: To understand oral and written texts which include numbers. How to use ordinal and cardinal numbers in everyday/ordinary situations. To write texts for various
MADERA SCIENCE FAIR 2013 Grades 4 th 6 th Project due date: Tuesday, April 9, 8:15 am Parent Night: Tuesday, April 16, 6:00 8:00 pm
 MADERA SCIENCE FAIR 2013 Grades 4 th 6 th Project due date: Tuesday, April 9, 8:15 am Parent Night: Tuesday, April 16, 6:00 8:00 pm Why participate in the Science Fair? Science fair projects give students
GCE. Mathematics (MEI) Mark Scheme for June Advanced Subsidiary GCE Unit 4766: Statistics 1. Oxford Cambridge and RSA Examinations
 Mark Scheme for June Advanced Subsidiary GCE Unit 4766: Statistics 1. Oxford Cambridge and RSA Examinations") GCE Mathematics (MEI) Advanced Subsidiary GCE Unit 4766: Statistics 1 Mark Scheme for June 2013 Oxford Cambridge and RSA Examinations OCR (Oxford Cambridge and RSA) is a leading UK awarding body, providing
GCE Mathematics (MEI) Advanced Subsidiary GCE Unit 4766: Statistics 1 Mark Scheme for June 2013 Oxford Cambridge and RSA Examinations OCR (Oxford Cambridge and RSA) is a leading UK awarding body, providing
LESSON PLANS: AUSTRALIA Year 6: Patterns and Algebra Patterns 50 MINS 10 MINS. Introduction to Lesson. powered by
 Year 6: Patterns and Algebra Patterns 50 MINS Strand: Number and Algebra Substrand: Patterns and Algebra Outcome: Continue and create sequences involving whole numbers, fractions and decimals. Describe
Mathacle PSet Stats, Concepts in Statistics and Probability Level Number Name: Date:
 1 st Quarterly Exam ~ Sampling, Designs, Exploring Data and Regression Part 1 Review I. SAMPLING MC I-1.) [APSTATSMC2014-6M] Approximately 52 percent of all recent births were boys. In a simple random
UNIT IX. Don t Tell. Are there some things that grown-ups don t let you do? Read about what this child feels.
 UNIT IX Are there some things that grown-ups don t let you do? Read about what this child feels. There are lots of things They won t let me do- I'm not big enough yet, They say. So I patiently wait Till
GREENBRIAR MIDDLE SCHOOL/ VALLEY FORGE HIGH SCHOOL 7TH AND 8TH GRADE ATHLETICS
 GREENBRIAR MIDDLE SCHOOL/ VALLEY FORGE HIGH SCHOOL! 7TH AND 8TH GRADE ATHLETICS 2015-2016 ATHLETIC DIRECTOR My name is Joe Porach Contact information is porachj@parmacityschools.org or (440)885-2371 ELIGIBILITY
P a g e 1. Grade 5. Grant funded by:
 P a g e 1 Grade 5 Grant funded by: P a g e 2 Focus Standard: 5.NF.1, 5.NF.2 Lesson 6: Adding and Subtracting Unlike Fractions Standards for Mathematical Practice: SMP.1, SMP.2, SMP.6, SMP.7, SMP.8 Estimated
Conteúdos de inglês para o primeiro bimestre. Turma 21. Turma 31. Turma 41
 Conteúdos de inglês para o primeiro bimestre Turma 21 Greetings Vocabulário: hello, hi, good morning, good afternoon, good night, good evening, goodbye, bye Estrutura: Hello! What is your name? My name
State University of New York at Buffalo INTRODUCTION TO STATISTICS PSC 408 Fall 2015 M,W,F 1-1:50 NSC 210
 1 State University of New York at Buffalo INTRODUCTION TO STATISTICS PSC 408 Fall 2015 M,W,F 1-1:50 NSC 210 Dr. Michelle Benson mbenson2@buffalo.edu Office: 513 Park Hall Office Hours: Mon & Fri 10:30-12:30
Arizona s College and Career Ready Standards Mathematics
 Arizona s College and Career Ready Mathematics Mathematical Practices Explanations and Examples First Grade ARIZONA DEPARTMENT OF EDUCATION HIGH ACADEMIC STANDARDS FOR STUDENTS State Board Approved June
Sight Word Assessment
 Make, Take & Teach Sight Word Assessment Assessment and Progress Monitoring for the Dolch 220 Sight Words What are sight words? Sight words are words that are used frequently in reading and writing. Because
This document has been produced by:
 year 9 This document has been produced by: The All Wales ESDGC Officer Group to support schools introducing the National Literacy and Numeracy Framework through ESDGC activities. With support from: Developing
The St. Marylebone Church of England Bridge School
 The St. Marylebone Church of England Bridge School Home/School Agreement 2016 / 17 HOME / SCHOOL AGREEMENT The St. Marylebone CE Bridge School 17 23 Third Avenue, London W10 4RS MISSION STATEMENT The St.
English Language Test. Grade Five. Semester One
 ENGLISH LANGUAGE REGION:MUSANDAM SCHOOL: KHAWLA BINT AL AZWAR B.E.S. (5-12) English Language Test Grade Five Semester One Name School Class Write your answers on the Test Paper Time: 1½ hours Pages: 7
An NWO Hands-On STEM Activity Mathematics and Language Arts with The Mitten by Jan Brett
 An NWO Hands-On STEM Activity Mathematics and Language Arts with The Mitten by Jan Brett Suggested Grade Levels: prek-3 Standards Alignment: Geometry K, 1, & 2. Measurement and Data K, 1, 2, & 3 Materials:
Curriculum Policy. November Independent Boarding and Day School for Boys and Girls. Royal Hospital School. ISI reference.
 Curriculum Policy Independent Boarding and Day School for Boys and Girls Royal Hospital School November 2017 ISI reference Key author Reviewing body Approval body Approval frequency 2a Director of Curriculum,
Boarding Prospectus By the boys, for the boys
 2017 Boarding Prospectus By the boys, for the boys 0 Contents Introduction... 2 Need to know... 3 Settling in... 4 The Daily Routine... 5 Food... 7 Weekends... 8 Prep... 9 The Older Boys... 10 The Staff...
Westminster Cathedral Catholic Primary School
 Westminster Cathedral Catholic Primary School Founded by The Jesuit Fathers Circa 1849 Newsletter 15th September 2017 Love one another as I have loved you John 13:34 Our Mission Statement A new commandment
Welcome to Year 2. The New National Curriculum
 Welcome to Year 2 The New National Curriculum Literacy Reading Pupils should be taught to: continue to apply phonic knowledge and skills as the route to decode words until automatic decoding has become
Common Core State Standards
 Common Core State Standards Common Core State Standards 7.NS.3 Solve real-world and mathematical problems involving the four operations with rational numbers. Mathematical Practices 1, 3, and 4 are aspects
Pinner High School Parent feedback
 Pinner High School Parent feedback a credit to education a breath of fresh air fantastic new school opportunities, buzzing, inclusive we are really pleased with our choice keep up the good work x mind-expanding
Classroom Activities/Lesson Plan
 Grade Band: Intermediate Unit17 Unit Target: History Unit Topic: Friends in Different Places Lesson 3 Instructional Targets Reading Standards for Literature Range and Level of Text Complexity: Experience
Aim. Main. We aim. to provide. helpful, stating. Football. Mr Gomez Mr Stewartt Mr Jones. Miss Paul Mrs Bennett. Netball
 Think Fr eem men s PE & Sport Parents Information & Guide 2017-18 Aim We aim to provide a highly effective department, delivering ann excellent Physical education & Games programme. Pupils have accesss
Intensive language courses (French, English and German) Thematic language courses: Sciences, Soccer
 Thematic language courses: Sciences, Soccer") Internat & externat privé fondé en 1966 Membre AVDEP, FSEP Accrédité QSC (Quality School Certificate) SUMMER CAMP 2016 Intensive language courses (French, English and German) Thematic language courses:
Internat & externat privé fondé en 1966 Membre AVDEP, FSEP Accrédité QSC (Quality School Certificate) SUMMER CAMP 2016 Intensive language courses (French, English and German) Thematic language courses:
Name Class Date. Graphing Proportional Relationships
 Name Class Date Practice 5-1 Graphing Proportional Relationships 5-1 Graphing Proportional Relationships 1. An electronics store has a frequent shopper program. The buyer earns 4 points for every movie
UNIT 1. Pupils should become aware of: the many languages spoken around the world the international use of English as a lingua franca
 UNIT 1 OBJECTIVES Language: Pupils should be able to: ask and answer questions about general personal information (name, age, hobbies, family, likes/dislikes) describe people s appearance and personality
Meet Modern Languages Department
 Meet Modern Languages Department The languages team makes up a large and thriving department where French and German and Spanish are taught to A Level: Mr Pete Alborough, Teacher of French - Head of Modern
Participatory Learning and Action
 Participatory Learning and Action Produced by the PPAZ/GRZ Community-Based Distribution Project in Eastern Province, Zambia with funding from DFID Introduction CBD agents work with groups in three ways,
Year 3 at Leighton. Autumn Term - Ancient Britain, from Stone Age to Iron Age. Spring Term Ancient Egypt Summer Term The World Cup
 Year 3 at Leighton In Year 3 at Leighton children learn to work with greater independence, building on the key skills taught in Key Stage 1. Learning is exciting, varied and hands-on whenever possible,
A 1,200 B 1,300 C 1,500 D 1,700
 North arolina Testing Program EOG Mathematics Grade Sample Items Goal. There are eighty-six thousand four hundred seconds in a day. How else could this number be written? 80,06. Jenny s vacation money
Case study Norway case 1
 Case study Norway case 1 School : B (primary school) Theme: Science microorganisms Dates of lessons: March 26-27 th 2015 Age of students: 10-11 (grade 5) Data sources: Pre- and post-interview with 1 teacher
Lab 1 - The Scientific Method
 Lab 1 - The Scientific Method As Biologists we are interested in learning more about life. Through observations of the living world we often develop questions about various phenomena occurring around us.