MINUTE TO WIN IT: NAMING THE PRESIDENTS OF THE UNITED STATES
|
|
|
- Abel Benson
- 6 years ago
- Views:
Transcription


1 MINUTE TO WIN IT: NAMING THE PRESIDENTS OF THE UNITED STATES
2 THE PRESIDENTS OF THE UNITED STATES Project: Focus on the Presidents of the United States Objective: See how many Presidents of the United States someone can name in a minute Data: Used Fathom to record our data, had a list of all of the Presidents of the United States that we used to check off each time a President was mentioned Variables: How many Presidents the person could name, their gender, their favorite subject, and if the person has taken any Honors or AP History courses

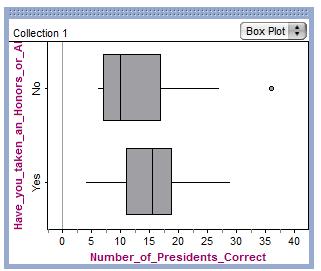
3 QUANTITATIVE DATA Collection 1 Box Plot Num ber_of_presidents_correct
4 QUANTITATIVE DATA Summary Statistics Mean: Presidents Std. Deviation: Presidents Minimum: 4 Presidents Q1: 9 Presidents Median: 14 Presidents Q3: 19 Presidents Maximum: 36 Presidents IQR: 10 Presidents
5 QUANTITATIVE DATA Shape, Center, Spread Shape: Right Skewed, Unimodal Center: At the median of 14 Presidents IQR: Of 10 Presidents Outlier: At 36 Presidents Range: Of (4, 36) Presidents
6 QUANTITATIVE DATA Outliers A= 9- (1.5 x 10) A=-6 Presidents B= 19+ (1.5 x 10) B= 34 Presidents Range: (-6,34) Presidents There is an outlier at 36 Presidents because 36 exceeds the range of the data which is (-6,34) Presidents.
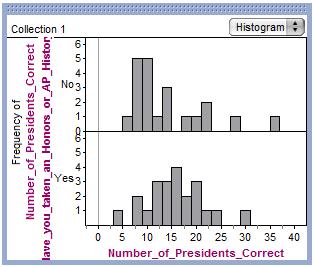
7 QUANTITATIVE DATA Shape: The shape of the histogram does not look Normal because the data is right skewed. Percent of Data Falling within 1, 2, and 3 Std. Deviations from the Mean: X= 14.4 Presidents S= 6.78 Presidents 1 Std. Deviation: 31/43= 72.1% 2 Std. Deviations: 41/43= 95.35% 3 Std. Deviations: 42/43= 97.67% The % Rule: (7.62,21.18) Presidents = 68% (0.84, 27.96) Presidents = 95% (-5.94, 34.74) Presidents = 99.7% Although our shape of our histogram was not Normal because it was right skewed; the skew is very slight and can also be considered to be roughly symmetric which explains why our percentages are very similar and almost exact to the actual percentages.

8 QUANTITATIVE DATA Counts: Female: 18 Male: 25 Total: 43 Percentages: Female: 41.86% Male: 58.14% Total: 100%
9 QUANTITATIVE DATA
10 Summary Statistics of Gender and the Number of Presidents Correct Males: Mean: Presidents Std. Deviation: 7.24 Presidents Minimum: 7 Presidents Q1: 11 Presidents Median: 14 Presidents Q3: 19 Presidents Maximum: 36 Presidents IQR: 8 Presidents QUANTITATIVE DATA
11 Summary Statistics of Gender and the Number of Presidents Correct Females: Mean: 12 Presidents Std. Deviation: 5.39 Presidents Minimum: 4 Presidents Q1: 7 Presidents Median: 10 Presidents Q3: 16 Presidents Maximum: 21 Presidents IQR: 9 Presidents QUANTITATIVE DATA
12 Summary Statistics of Gender and the Number of Presidents Correct Row Summary: Mean: 14.4 Presidents Std. Deviation: 6.78 Presidents Minimum: 4 Presidents Q1: 9 Presidents Median: 14 Presidents Q3: 19 Presidents Maximum: 36 Presidents IQR: 10 Pesidents QUANTITATIVE DATA
13 QUANTITATIVE DATA Male Outlier(s) A= 11- (1.5 x 8) A= -1 President(s) B= 19 + (1.5 x 8) B= 31 Presidents Range (-1,31) Presidents There is an outlier for the Male's at 36 Presidents because the number 36 exceeds the range of (-1,31) Presidents. Female Outlier(s) A= 7- (1.5 x 9) A= -6.5 Presidents B= 16+ (1.5 x 9) B= 29.5 Presidents Range (-6.5, 29.5) Presidents There are not outliers for the Female's set of data, all the data falls within the range of (-6.5, 29.5) Presidents.
14 QUANTITATIVE DATA The shape of the Males graph is right skew and unimodal while the shape of the Females graph is symmetric and bimodal. The center of the Males graph is at the median of 14 Presidents, while the center of the Females graph is at the mean of 12 Presidents. The IQR of the Males graph is 8 Presidents, while the Std. Deviation of the Females graph is 5.39 Presidents. There is an outlier at 36 Presidents for the Males graph, while there are no outliers for the Females graph. The range of the Males is (7,36) Presidents, larger than the range of the Females which is (4,21) Presidents.
15 QUANTITATIVE DATA Gender does seem to have an effect on our quantitative data. This can be seen when analyzing the data for Males and Females along with looking at the shapes of the graphs. For example the shape of the Male graph is right skew and unimodal, while the Female graph is symmetric and bimodal. The difference in the shape of the graphs is because there was a greater range for the Males data than there was for the Females data (Males= 29 [range]; Females=17 [range]). Each summary statistic was different for both genders. Example: The Q1 for the Male graph is 11 Presidents; the Q1 for the Females graph is 7 Presidents.
16 CATEGORICAL DATA 1
17 CATEGORICAL DATA 1 All Academic S.S. Classes Mean: Presidents Std Deviation: 7.78 Presidents Min: 6 Presidents Q1: 7 Presidents Med: 10 Presidents Q3: 17 Presidents Max: 36 Presidents IQR: 10 Presidents At least One Honor's/AP Class Mean: Presidents Std Deviation: 5.75 Presidents Min: 4 Presidents Q1: 11 Presidents Med: 15.5 Presidents Q3: 19 Presidents Max: 29 Presidents IQR: 8 Presidents
18 CATEGORICAL DATA 1 All Academic S.S. Classes A = 7-(1.5 x 10) A = -8 B = 17+(1.5 x 10) B = 32 Range = (-8, 31) Presidents There is an outlier in this set of data because 36 does not fall in the range of (-8, 31) At least One Honor's/AP Class A = 11-(1.5 x 8) A = -1 B = 19+(1.5 x 8) B = 35 Range = (-1, 35) Presidents There is no outlier in this set of data because all data falls in the range of (-1, 35)
19 CATEGORICAL DATA 1 The shape of the Yes graph(students that have taken an AP/Honors History Course) is right skewed and unimodal while the No graph (Students that have not taken an AP/Honors History Course) is unimodal and symmetric. The center of the Yes graph had a center median of 15.5 Presidents, while the No graph has a center mean of 7.78 Presidents. The IQR of the Yes graph is 8,while the Std. Deviation of the No graph is Presidents. There is an outlier at 36 Presidents for the No graph, while the Yes graph has no outliers. The range of the Yes graph is (4,29) Presidents, which is smaller than the No graph with a range of (6,36) Presidents.
20 CATEGORICAL DATA 1 Taking an AP/Honors course seems to have an influence on our quantitative data. By looking at the shapes of the graph, you can see a difference in knowledge of presidents. You can see that the No graph is right skewed with a median of 10 Presidents, while the Yes graph is symmetrical and has a mean of Presidents. It seemed that taking an AP/Honors history course seemed to help with knowledge of presidents.
21 CATEGORICAL DATA 2
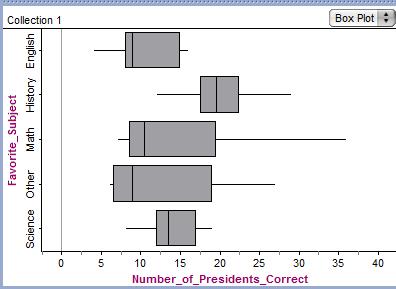
22 CATEGORICAL DATA 2 English: Mean: Presidents Std. Deviation: 4.43 Presidents Min: 4 Presidents Q1: 7 Presidents Med: 9 Presidents Q3: 9 Presidents Max: 15 Presidents IQR: 2 Presidents History: Mean: 20 Presidents Std. Deviation: 5.07 Presidents Min: 12 Presidents Q1: 5 Presidents Med: 19.5 Presidents Q3: 19.5 Presidents Max: 22.5 Presidents IQR: 14.5 Presidents
23 CATEGORICAL DATA 2 Math: Mean: Presidents Std. Deviation: 8.61 Presidents Min: 7 Presidents Q1: 8.5 Presidents Med:10.5 Presidents Q3: 19.5 Presidents Max: 36 Presidents IQR: 11 Presidents Science: Mean: 13.7 Presidents Std. Deviation: 3.59 Presidents Min: 8 Presidents Q1: 12 Presidents Med: 5 Presidents Q3: 17 Presidents Max: 19 Presidents IQR: 5 Presidents
24 CATEGORICAL DATA 2 Other: Mean: Presidents Std. Deviation: 9.74 Presidents Min: 6 Presidents Q1: 6.5 Presidents Med: 9 Presidents Q3: 19 Presidents Max: 27 Presidents IQR: 12.5 Presidents
25 CATEGORICAL DATA 2 The categorical variable does have an effect on our quantitative data because it changes the amount of the data when looking at each subject. Some subjects have a smaller range of quantitative data while other subjects have a larger range. The quantitative data was different for each subject because some students who's favorite subject was Math did better than the students who favorite subject was Other. Example: Comparing the Medians of the different subjects English: Mean of Presidents Math: Mean of Presidents History: Mean of 20 Presidents Science: Mean of 13.7 Presidents Other: Mean of Presidents

26 ANALYSIS OF CATEGORICAL VARIABLE 1 Click to add text Count: Yes: 22 People No: 21 People Percent: Yes: 51.16% No: 48.84%
27 ANALYSIS OF CATEGORICAL VARIABLE 1
28 ANALYSIS OF CATEGORICAL VARIABLE 1
29 ANALYSIS OF CATEGORICAL VARIABLE 1 Gender does have an affect on our categorical data when looking at the percentages of females that have not taken an AP or Honors History Course compared to the Males that have not take an AP or Honors History Course. Example: 14.63% of the Females have not taken an AP or Honors History Class While 36.59% of the Males have not taken an AP or Honors History Class. There is a great distance between the two percentages; great enough to have an affect on our categorical data. If we only looked at the Female Gender percentage we would not have enough data or a high enough percent as we would if we looked at the Male Gender percentage.
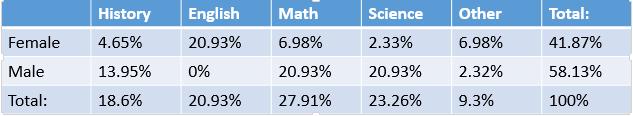
30 ANALYSIS OF CATEGORICAL VARIABLE 2 Count: History: 8 People Science: 10 People Math: 12 People English: 9 People Other: 4 People Total: 43 People Percent: History: 18.6% Science: 23.26% Math: 27.91% English: 20.93% Other: 9.3% Total: 100%

31 ANALYSIS OF CATEGORICAL VARIABLE 2

32 ANALYSIS OF CATEGORICAL VARIABLE 2 Gender does have an effect on our categorical variable. This can be concluded when looking at the stacked bar graph to the left. There were no males who had English as their favorite subject, so the females were dominant in that subject. There were 9 males who's favorite subject was Science compared to the 1 female who's favorite subject was Science. There was not a consistent or equal distribution of data of each gender for each subject; that is why gender does have an affect on our categorical variable of favorite subject.
33 CONCLUSION In our project there was no errors in any of our calculations or data. There might have been some bias when we were gathering our data because it seemed like the people who did not have an interest in history whatsoever, seemed to give up before the time ran out. These people also had a lack of self confidence in themselves and would easily get embarrassed because often Benjamin Franklin was named as being one of the Presidents of the United States (this is false, he was one of the founding fathers).
34 CONCLUSION Quantitative Data From our data we learned a lot of information. When looking at the summary statistics of our quantitative data we learned that the median number of presidents that were named was 14. We were surprised that the minimum of our quantitative data was four presidents, especially since their are a couple of Presidents that have the dame last name. We were shocked that the maximum number of presidents that was named was 36 out of the total 43 (yes there have been 44 Presidents, but Grover Cleveland was president twice during different terms).
35 CONCLUSION Quantitative Data -Gender When looking at the Quantitative Data broken down by Gender, the shape of the Males graph is right skew and unimodal while the shape of the Females graph is symmetric and bimodal. The different shape of the graphs allowed us to conclude that gender does have an affect on our quantitative data. Categorical Data 1 The shape of the Yes graph (Students that have taken an AP/Honors History Course) is right skewed and unimodal while the No graph (Students that have not taken an AP/Honors History Course) is unimodal and symmetric. Whether or not the person has taken an Honors or AP History Class does have an effect on our quantitative data. Categorical Data 2 The categorical variable does have an effect on our quantitative data because it changes the amount of the data when looking at each subject.
36 CONCLUSION Analysis of Categorical Variable % of the people have taken an AP or Honors History Class, while 48.84% have not. Gender does have an affect on our categorical data. Analysis of Categorical Variable 2 The people of which we collected our data on, their favorite subjects were: History: 18.6%; Science: 23.26%; Math: 27.91%; English: 20.93%; and Other: 9.3%. Gender does have an effect on our categorical variable.
AP Statistics Summer Assignment 17-18
 AP Statistics Summer Assignment 17-18 Welcome to AP Statistics. This course will be unlike any other math class you have ever taken before! Before taking this course you will need to be competent in basic
Lesson M4. page 1 of 2
 Lesson M4 page 1 of 2 Miniature Gulf Coast Project Math TEKS Objectives 111.22 6b.1 (A) apply mathematics to problems arising in everyday life, society, and the workplace; 6b.1 (C) select tools, including
STT 231 Test 1. Fill in the Letter of Your Choice to Each Question in the Scantron. Each question is worth 2 point.
 STT 231 Test 1 Fill in the Letter of Your Choice to Each Question in the Scantron. Each question is worth 2 point. 1. A professor has kept records on grades that students have earned in his class. If he
Chapters 1-5 Cumulative Assessment AP Statistics November 2008 Gillespie, Block 4
 Chapters 1-5 Cumulative Assessment AP Statistics Name: November 2008 Gillespie, Block 4 Part I: Multiple Choice This portion of the test will determine 60% of your overall test grade. Each question is
Measures of the Location of the Data
 OpenStax-CNX module m46930 1 Measures of the Location of the Data OpenStax College This work is produced by OpenStax-CNX and licensed under the Creative Commons Attribution License 3.0 The common measures
Edexcel GCSE. Statistics 1389 Paper 1H. June Mark Scheme. Statistics Edexcel GCSE
 Edexcel GCSE Statistics 1389 Paper 1H June 2007 Mark Scheme Edexcel GCSE Statistics 1389 NOTES ON MARKING PRINCIPLES 1 Types of mark M marks: method marks A marks: accuracy marks B marks: unconditional
Probability and Statistics Curriculum Pacing Guide
 Unit 1 Terms PS.SPMJ.3 PS.SPMJ.5 Plan and conduct a survey to answer a statistical question. Recognize how the plan addresses sampling technique, randomization, measurement of experimental error and methods
Introduction to the Practice of Statistics
 Chapter 1: Looking at Data Distributions Introduction to the Practice of Statistics Sixth Edition David S. Moore George P. McCabe Bruce A. Craig Statistics is the science of collecting, organizing and
Level 1 Mathematics and Statistics, 2015
 91037 910370 1SUPERVISOR S Level 1 Mathematics and Statistics, 2015 91037 Demonstrate understanding of chance and data 9.30 a.m. Monday 9 November 2015 Credits: Four Achievement Achievement with Merit
MULTIPLE CHOICE. Choose the one alternative that best completes the statement or answers the question.
 Ch 2 Test Remediation Work Name MULTIPLE CHOICE. Choose the one alternative that best completes the statement or answers the question. Provide an appropriate response. 1) High temperatures in a certain
Algebra 2- Semester 2 Review
 Name Block Date Algebra 2- Semester 2 Review Non-Calculator 5.4 1. Consider the function f x 1 x 2. a) Describe the transformation of the graph of y 1 x. b) Identify the asymptotes. c) What is the domain
Preliminary Chapter survey experiment an observational study that is not a survey
 1 Preliminary Chapter P.1 Getting data from Jamie and her friends is convenient, but it does not provide a good snapshot of the opinions held by all young people. In short, Jamie and her friends are not
Mathacle PSet Stats, Concepts in Statistics and Probability Level Number Name: Date:
 1 st Quarterly Exam ~ Sampling, Designs, Exploring Data and Regression Part 1 Review I. SAMPLING MC I-1.) [APSTATSMC2014-6M] Approximately 52 percent of all recent births were boys. In a simple random
Statistical Studies: Analyzing Data III.B Student Activity Sheet 7: Using Technology
 Suppose data were collected on 25 bags of Spud Potato Chips. The weight (to the nearest gram) of the chips in each bag is listed below. 25 28 23 26 23 25 25 24 24 27 23 24 28 27 24 26 24 25 27 26 25 26
Informal Comparative Inference: What is it? Hand Dominance and Throwing Accuracy
 Informal Comparative Inference: What is it? Hand Dominance and Throwing Accuracy Logistics: This activity addresses mathematics content standards for seventh-grade, but can be adapted for use in sixth-grade
The Editor s Corner. The. Articles. Workshops. Editor. Associate Editors. Also In This Issue
 The S tatistics T eacher N etwork www.amstat.org/education/stn Number 73 ASA/NCTM Joint Committee on the Curriculum in Statistics and Probability Fall 2008 The Editor s Corner We hope you enjoy Issue 73
Enhancing Students Understanding Statistics with TinkerPlots: Problem-Based Learning Approach
 Enhancing Students Understanding Statistics with TinkerPlots: Problem-Based Learning Approach Krongthong Khairiree drkrongthong@gmail.com International College, Suan Sunandha Rajabhat University, Bangkok,
Shockwheat. Statistics 1, Activity 1
 Statistics 1, Activity 1 Shockwheat Students require real experiences with situations involving data and with situations involving chance. They will best learn about these concepts on an intuitive or informal
Algebra 1, Quarter 3, Unit 3.1. Line of Best Fit. Overview
 Algebra 1, Quarter 3, Unit 3.1 Line of Best Fit Overview Number of instructional days 6 (1 day assessment) (1 day = 45 minutes) Content to be learned Analyze scatter plots and construct the line of best
Functional Skills Mathematics Level 2 assessment
 Functional Skills Mathematics Level 2 assessment www.cityandguilds.com September 2015 Version 1.0 Marking scheme ONLINE V2 Level 2 Sample Paper 4 Mark Represent Analyse Interpret Open Fixed S1Q1 3 3 0
Minitab Tutorial (Version 17+)
") Minitab Tutorial (Version 17+) Basic Commands and Data Entry Graphical Tools Descriptive Statistics Outline Minitab Basics Basic Commands, Data Entry, and Organization Minitab Project Files (*.MPJ) vs.
Minitab Tutorial (Version 17+) Basic Commands and Data Entry Graphical Tools Descriptive Statistics Outline Minitab Basics Basic Commands, Data Entry, and Organization Minitab Project Files (*.MPJ) vs.
Student s Edition. Grade 6 Unit 6. Statistics. Eureka Math. Eureka Math
 Student s Edition Grade 6 Unit 6 Statistics Eureka Math Eureka Math Lesson 1 Lesson 1: Posing Statistical Questions Statistics is about using data to answer questions. In this module, the following four
GCSE Mathematics B (Linear) Mark Scheme for November Component J567/04: Mathematics Paper 4 (Higher) General Certificate of Secondary Education
 Mark Scheme for November Component J567/04: Mathematics Paper 4 (Higher) General Certificate of Secondary Education") GCSE Mathematics B (Linear) Component J567/04: Mathematics Paper 4 (Higher) General Certificate of Secondary Education Mark Scheme for November 2014 Oxford Cambridge and RSA Examinations OCR (Oxford Cambridge
GCSE Mathematics B (Linear) Component J567/04: Mathematics Paper 4 (Higher) General Certificate of Secondary Education Mark Scheme for November 2014 Oxford Cambridge and RSA Examinations OCR (Oxford Cambridge
Evaluation of a College Freshman Diversity Research Program
 Evaluation of a College Freshman Diversity Research Program Sarah Garner University of Washington, Seattle, Washington 98195 Michael J. Tremmel University of Washington, Seattle, Washington 98195 Sarah
State of New Jersey
 OVERVIEW 1213 GRADE SPAN KG6 116946 GALLOWAY, NEW JERSEY 85 This school's academic performance is about average when compared to schools across the state. Additionally, its academic performance is very
African American Male Achievement Update
 Report from the Department of Research, Evaluation, and Assessment Number 8 January 16, 2009 African American Male Achievement Update AUTHOR: Hope E. White, Ph.D., Program Evaluation Specialist Department
Broward County Public Schools G rade 6 FSA Warm-Ups
 Day 1 1. A florist has 40 tulips, 32 roses, 60 daises, and 50 petunias. Draw a line from each comparison to match it to the correct ratio. A. tulips to roses B. daises to petunias C. roses to tulips D.
Association Between Categorical Variables
 Student Outcomes Students use row relative frequencies or column relative frequencies to informally determine whether there is an association between two categorical variables. Lesson Notes In this lesson,
School Size and the Quality of Teaching and Learning
 School Size and the Quality of Teaching and Learning An Analysis of Relationships between School Size and Assessments of Factors Related to the Quality of Teaching and Learning in Primary Schools Undertaken
GCE. Mathematics (MEI) Mark Scheme for June Advanced Subsidiary GCE Unit 4766: Statistics 1. Oxford Cambridge and RSA Examinations
 Mark Scheme for June Advanced Subsidiary GCE Unit 4766: Statistics 1. Oxford Cambridge and RSA Examinations") GCE Mathematics (MEI) Advanced Subsidiary GCE Unit 4766: Statistics 1 Mark Scheme for June 2013 Oxford Cambridge and RSA Examinations OCR (Oxford Cambridge and RSA) is a leading UK awarding body, providing
GCE Mathematics (MEI) Advanced Subsidiary GCE Unit 4766: Statistics 1 Mark Scheme for June 2013 Oxford Cambridge and RSA Examinations OCR (Oxford Cambridge and RSA) is a leading UK awarding body, providing
Grade 6: Correlated to AGS Basic Math Skills
 Grade 6: Correlated to AGS Basic Math Skills Grade 6: Standard 1 Number Sense Students compare and order positive and negative integers, decimals, fractions, and mixed numbers. They find multiples and
ASSESSMENT OF LEARNING STYLES FOR MEDICAL STUDENTS USING VARK QUESTIONNAIRE
 ASSESSMENT OF LEARNING STYLES FOR MEDICAL STUDENTS USING VARK QUESTIONNAIRE 1 MARWA. M. EL SAYED, 2 DALIA. M.MOHSEN, 3 RAWHEIH.S.DOGHEIM, 4 HAFSA.H.ZAIN, 5 DALIA.AHMED. 1,2,4 Inaya Medical College, Riyadh,
Research Design & Analysis Made Easy! Brainstorming Worksheet
 Brainstorming Worksheet 1) Choose a Topic a) What are you passionate about? b) What are your library s strengths? c) What are your library s weaknesses? d) What is a hot topic in the field right now that
Predicting the Performance and Success of Construction Management Graduate Students using GRE Scores
 Predicting the Performance and of Construction Management Graduate Students using GRE Scores Joel Ochieng Wao, PhD, Kimberly Baylor Bivins, M.Eng and Rogers Hunt III, M.Eng Tuskegee University, Tuskegee,
ACBSP Related Standards: #3 Student and Stakeholder Focus #4 Measurement and Analysis of Student Learning and Performance
 Graduate Business Student Course Evaluations Baselines July 12, 2011 W. Kleintop Process: Student Course Evaluations ACBSP Related Standards: #3 Student and Stakeholder Focus #4 Measurement and Analysis
Tuesday 13 May 2014 Afternoon
 Tuesday 13 May 2014 Afternoon AS GCE PSYCHOLOGY G541/01 Psychological Investigations *3027171541* Candidates answer on the Question Paper. OCR supplied materials: None Other materials required: None Duration:
Best Practices in Internet Ministry Released November 7, 2008
 Best Practices in Internet Ministry Released November 7, 2008 David T. Bourgeois, Ph.D. Associate Professor of Information Systems Crowell School of Business Biola University Best Practices in Internet
Graduate Division Annual Report Key Findings
 Graduate Division 2010 2011 Annual Report Key Findings Trends in Admissions and Enrollment 1 Size, selectivity, yield UCLA s graduate programs are increasingly attractive and selective. Between Fall 2001
Mathematics Success Level E
 T403 [OBJECTIVE] The student will generate two patterns given two rules and identify the relationship between corresponding terms, generate ordered pairs, and graph the ordered pairs on a coordinate plane.
Math 121 Fundamentals of Mathematics I
 I. Course Description: Math 121 Fundamentals of Mathematics I Math 121 is a general course in the fundamentals of mathematics. It includes a study of concepts of numbers and fundamental operations with
The application is available on the AAEA website at org. Click on "Constituent Groups", then AAFC and then AAFC Scholarship.
 TO: FROM: SUBJECT: Arkansas High School Principals and Counselors Christie Jay, AAFC Scholarship Chair Scholarship Award -Arkansas Association of Federal Coordinators The Arkansas Association of Federal
STA 225: Introductory Statistics (CT)
") Marshall University College of Science Mathematics Department STA 225: Introductory Statistics (CT) Course catalog description A critical thinking course in applied statistical reasoning covering basic
Marshall University College of Science Mathematics Department STA 225: Introductory Statistics (CT) Course catalog description A critical thinking course in applied statistical reasoning covering basic
12- A whirlwind tour of statistics
 CyLab HT 05-436 / 05-836 / 08-534 / 08-734 / 19-534 / 19-734 Usable Privacy and Security TP :// C DU February 22, 2016 y & Secu rivac rity P le ratory bo La Lujo Bauer, Nicolas Christin, and Abby Marsh
Statistics and Probability Standards in the CCSS- M Grades 6- HS
 Statistics and Probability Standards in the CCSS- M Grades 6- HS Grade 6 Develop understanding of statistical variability. -6.SP.A.1 Recognize a statistical question as one that anticipates variability
Understanding and Interpreting the NRC s Data-Based Assessment of Research-Doctorate Programs in the United States (2010)
") Understanding and Interpreting the NRC s Data-Based Assessment of Research-Doctorate Programs in the United States (2010) Jaxk Reeves, SCC Director Kim Love-Myers, SCC Associate Director Presented at UGA
Understanding and Interpreting the NRC s Data-Based Assessment of Research-Doctorate Programs in the United States (2010) Jaxk Reeves, SCC Director Kim Love-Myers, SCC Associate Director Presented at UGA
LESSON PLANS: AUSTRALIA Year 6: Patterns and Algebra Patterns 50 MINS 10 MINS. Introduction to Lesson. powered by
 Year 6: Patterns and Algebra Patterns 50 MINS Strand: Number and Algebra Substrand: Patterns and Algebra Outcome: Continue and create sequences involving whole numbers, fractions and decimals. Describe
Updated: December Educational Attainment
 Updated: Educational Attainment Among 25- to 29-year olds, the proportions who have attained a high school education, some college, or a bachelor s degree are all rising, according to longterm trends.
NCEO Technical Report 27
 Home About Publications Special Topics Presentations State Policies Accommodations Bibliography Teleconferences Tools Related Sites Interpreting Trends in the Performance of Special Education Students
American Journal of Business Education October 2009 Volume 2, Number 7
 Factors Affecting Students Grades In Principles Of Economics Orhan Kara, West Chester University, USA Fathollah Bagheri, University of North Dakota, USA Thomas Tolin, West Chester University, USA ABSTRACT
The lab is designed to remind you how to work with scientific data (including dealing with uncertainty) and to review experimental design.
 and to review experimental design.") Name: Partner(s): Lab #1 The Scientific Method Due 6/25 Objective The lab is designed to remind you how to work with scientific data (including dealing with uncertainty) and to review experimental design.
Name: Partner(s): Lab #1 The Scientific Method Due 6/25 Objective The lab is designed to remind you how to work with scientific data (including dealing with uncertainty) and to review experimental design.
Many instructors use a weighted total to calculate their grades. This lesson explains how to set up a weighted total using categories.
 Weighted Totals Many instructors use a weighted total to calculate their grades. This lesson explains how to set up a weighted total using categories. Set up your grading scheme in your syllabus Your syllabus
Case study Norway case 1
 Case study Norway case 1 School : B (primary school) Theme: Science microorganisms Dates of lessons: March 26-27 th 2015 Age of students: 10-11 (grade 5) Data sources: Pre- and post-interview with 1 teacher
CHAPTER 5: COMPARABILITY OF WRITTEN QUESTIONNAIRE DATA AND INTERVIEW DATA
 CHAPTER 5: COMPARABILITY OF WRITTEN QUESTIONNAIRE DATA AND INTERVIEW DATA Virginia C. Mueller Gathercole As a supplement to the interviews, we also sent out written questionnaires, to gauge the generality
Spinners at the School Carnival (Unequal Sections)
") Spinners at the School Carnival (Unequal Sections) Maryann E. Huey Drake University maryann.huey@drake.edu Published: February 2012 Overview of the Lesson Students are asked to predict the outcomes of
Spinners at the School Carnival (Unequal Sections) Maryann E. Huey Drake University maryann.huey@drake.edu Published: February 2012 Overview of the Lesson Students are asked to predict the outcomes of
2014 Comprehensive Survey of Lawyer Assistance Programs
 2014 Comprehensive Survey of Lawyer Assistance Programs A m e r i c a n B a r A s s o c i a t i o n 3 2 1 N. C l a r k S t r e e t C h i c a g o, I L 6 0 6 5 4 Copyright 2015 by the American Bar Association.
*Lesson will begin on Friday; Stations will begin on the following Wednesday*
 UDL Lesson Plan Template Instructor: Josh Karr Learning Domain: Algebra II/Geometry Grade: 10 th Lesson Objective/s: Students will learn to apply the concepts of transformations to an algebraic context
Using Blackboard.com Software to Reach Beyond the Classroom: Intermediate
 Using Blackboard.com Software to Reach Beyond the Classroom: Intermediate NESA Conference 2007 Presenter: Barbara Dent Educational Technology Training Specialist Thomas Jefferson High School for Science
An Empirical Analysis of the Effects of Mexican American Studies Participation on Student Achievement within Tucson Unified School District
 An Empirical Analysis of the Effects of Mexican American Studies Participation on Student Achievement within Tucson Unified School District Report Submitted June 20, 2012, to Willis D. Hawley, Ph.D., Special
National Longitudinal Study of Adolescent Health. Wave III Education Data
 National Longitudinal Study of Adolescent Health Wave III Education Data Primary Codebook Chandra Muller, Jennifer Pearson, Catherine Riegle-Crumb, Jennifer Harris Requejo, Kenneth A. Frank, Kathryn S.
Coimisiún na Scrúduithe Stáit State Examinations Commission LEAVING CERTIFICATE 2008 MARKING SCHEME GEOGRAPHY HIGHER LEVEL
 Coimisiún na Scrúduithe Stáit State Examinations Commission LEAVING CERTIFICATE 2008 MARKING SCHEME GEOGRAPHY HIGHER LEVEL LEAVING CERTIFICATE 2008 MARKING SCHEME GEOGRAPHY HIGHER LEVEL PART ONE: SHORT-ANSWER
Author's response to reviews
 Author's response to reviews Title: Global Health Education: a cross-sectional study among German medical students to identify needs, deficits and potential benefits(part 1 of 2: Mobility patterns & educational
VOL. 3, NO. 5, May 2012 ISSN Journal of Emerging Trends in Computing and Information Sciences CIS Journal. All rights reserved.
 Exploratory Study on Factors that Impact / Influence Success and failure of Students in the Foundation Computer Studies Course at the National University of Samoa 1 2 Elisapeta Mauai, Edna Temese 1 Computing
Preparing a Research Proposal
 Preparing a Research Proposal T. S. Jayne Guest Seminar, Department of Agricultural Economics and Extension, University of Pretoria March 24, 2014 What is a Proposal? A formal request for support of sponsored
Quantitative Study with Prospective Students: Final Report. for. Illinois Wesleyan University Bloomington, Illinois
 Quantitative Study with Prospective Students: Final Report for Illinois Wesleyan University Bloomington, Illinois September 25, 2007 Table of Contents INTRODUCTION & BACKGROUND 1-2 ASSIGNMENT 1 RESEARCH
EDUCATIONAL ATTAINMENT
 EDUCATIONAL ATTAINMENT By 2030, at least 60 percent of Texans ages 25 to 34 will have a postsecondary credential or degree. Target: Increase the percent of Texans ages 25 to 34 with a postsecondary credential.
Math Grade 3 Assessment Anchors and Eligible Content
 Math Grade 3 Assessment Anchors and Eligible Content www.pde.state.pa.us 2007 M3.A Numbers and Operations M3.A.1 Demonstrate an understanding of numbers, ways of representing numbers, relationships among
Name Class Date. Graphing Proportional Relationships
 Name Class Date Practice 5-1 Graphing Proportional Relationships 5-1 Graphing Proportional Relationships 1. An electronics store has a frequent shopper program. The buyer earns 4 points for every movie
Intel-powered Classmate PC. SMART Response* Training Foils. Version 2.0
 Intel-powered Classmate PC Training Foils Version 2.0 1 Legal Information INFORMATION IN THIS DOCUMENT IS PROVIDED IN CONNECTION WITH INTEL PRODUCTS. NO LICENSE, EXPRESS OR IMPLIED, BY ESTOPPEL OR OTHERWISE,
Quantitative Research Questionnaire
 Quantitative Research Questionnaire Surveys are used in practically all walks of life. Whether it is deciding what is for dinner or determining which Hollywood film will be produced next, questionnaires
Experience College- and Career-Ready Assessment User Guide
 Experience College- and Career-Ready Assessment User Guide 2014-2015 Introduction Welcome to Experience College- and Career-Ready Assessment, or Experience CCRA. Experience CCRA is a series of practice
Welcome to California Colleges, Platform Exploration (6.1) Goal: Students will familiarize themselves with the CaliforniaColleges.edu platform.
 Goal: Students will familiarize themselves with the CaliforniaColleges.edu platform.") Welcome to California Colleges, Platform Exploration (6.1) Goal: Students will familiarize themselves with the CaliforniaColleges.edu platform. Lesson Time Options This lesson requires one 45-60 minute
Welcome to California Colleges, Platform Exploration (6.1) Goal: Students will familiarize themselves with the CaliforniaColleges.edu platform. Lesson Time Options This lesson requires one 45-60 minute
EDUCATIONAL ATTAINMENT
 EDUCATIONAL ATTAINMENT By 2030, at least 60 percent of Texans ages 25 to 34 will have a postsecondary credential or degree. Target: Increase the percent of Texans ages 25 to 34 with a postsecondary credential.
Excel Formulas & Functions
 Microsoft Excel Formulas & Functions 4th Edition Microsoft Excel Formulas & Functions 4th Edition by Ken Bluttman Microsoft Excel Formulas & Functions For Dummies, 4th Edition Published by: John Wiley
HIGH SCHOOL PREP PROGRAM APPLICATION For students currently in 7th grade
 HIGH SCHOOL PREP PROGRAM APPLICATION For students currently in 7th grade APPLICATION CHECKLIST: Applications can be mailed, faxed, or dropped off to the address below. Proof of Income (Household income
Educational Attainment
 A Demographic and Socio-Economic Profile of Allen County, Indiana based on the 2010 Census and the American Community Survey Educational Attainment A Review of Census Data Related to the Educational Attainment
PEER EFFECTS IN THE CLASSROOM: LEARNING FROM GENDER AND RACE VARIATION *
 PEER EFFECTS IN THE CLASSROOM: LEARNING FROM GENDER AND RACE VARIATION * Caroline M. Hoxby NBER Working Paper 7867 August 2000 Peer effects are potentially important for understanding the optimal organization
Review of Student Assessment Data
 Reading First in Massachusetts Review of Student Assessment Data Presented Online April 13, 2009 Jennifer R. Gordon, M.P.P. Research Manager Questions Addressed Today Have student assessment results in
AGS THE GREAT REVIEW GAME FOR PRE-ALGEBRA (CD) CORRELATED TO CALIFORNIA CONTENT STANDARDS
 CORRELATED TO CALIFORNIA CONTENT STANDARDS") AGS THE GREAT REVIEW GAME FOR PRE-ALGEBRA (CD) CORRELATED TO CALIFORNIA CONTENT STANDARDS 1 CALIFORNIA CONTENT STANDARDS: Chapter 1 ALGEBRA AND WHOLE NUMBERS Algebra and Functions 1.4 Students use algebraic
AGS THE GREAT REVIEW GAME FOR PRE-ALGEBRA (CD) CORRELATED TO CALIFORNIA CONTENT STANDARDS 1 CALIFORNIA CONTENT STANDARDS: Chapter 1 ALGEBRA AND WHOLE NUMBERS Algebra and Functions 1.4 Students use algebraic
Malicious User Suppression for Cooperative Spectrum Sensing in Cognitive Radio Networks using Dixon s Outlier Detection Method
 Malicious User Suppression for Cooperative Spectrum Sensing in Cognitive Radio Networks using Dixon s Outlier Detection Method Sanket S. Kalamkar and Adrish Banerjee Department of Electrical Engineering
Longitudinal Analysis of the Effectiveness of DCPS Teachers
 F I N A L R E P O R T Longitudinal Analysis of the Effectiveness of DCPS Teachers July 8, 2014 Elias Walsh Dallas Dotter Submitted to: DC Education Consortium for Research and Evaluation School of Education
Demographic Survey for Focus and Discussion Groups
 Appendix F Demographic Survey for Focus and Discussion Groups Demographic Survey--Lesbian, Gay, and Bisexual Discussion Group Demographic Survey Faculty with Disabilities Discussion Group Demographic Survey
Van Andel Education Institute Science Academy Professional Development Allegan June 2015
 Van Andel Education Institute Science Academy Professional Development Allegan June 2015 Science teachers from Allegan RESA took part in professional development with the Van Andel Education Institute
Diagnostic Test. Middle School Mathematics
 Diagnostic Test Middle School Mathematics Copyright 2010 XAMonline, Inc. All rights reserved. No part of the material protected by this copyright notice may be reproduced or utilized in any form or by
U VA THE CHANGING FACE OF UVA STUDENTS: SSESSMENT. About The Study
 About The Study U VA SSESSMENT In 6, the University of Virginia Office of Institutional Assessment and Studies undertook a study to describe how first-year students have changed over the past four decades.
Statewide Framework Document for:
 Statewide Framework Document for: 270301 Standards may be added to this document prior to submission, but may not be removed from the framework to meet state credit equivalency requirements. Performance
Redirected Inbound Call Sampling An Example of Fit for Purpose Non-probability Sample Design
 Redirected Inbound Call Sampling An Example of Fit for Purpose Non-probability Sample Design Burton Levine Karol Krotki NISS/WSS Workshop on Inference from Nonprobability Samples September 25, 2017 RTI
Centre for Evaluation & Monitoring SOSCA. Feedback Information
 Centre for Evaluation & Monitoring SOSCA Feedback Information Contents Contents About SOSCA... 3 SOSCA Feedback... 3 1. Assessment Feedback... 4 2. Predictions and Chances Graph Software... 7 3. Value
National Survey of Student Engagement Spring University of Kansas. Executive Summary
 National Survey of Student Engagement Spring 2010 University of Kansas Executive Summary Overview One thousand six hundred and twenty-one (1,621) students from the University of Kansas completed the web-based
PROJECT MANAGEMENT AND COMMUNICATION SKILLS DEVELOPMENT STUDENTS PERCEPTION ON THEIR LEARNING
 PROJECT MANAGEMENT AND COMMUNICATION SKILLS DEVELOPMENT STUDENTS PERCEPTION ON THEIR LEARNING Mirka Kans Department of Mechanical Engineering, Linnaeus University, Sweden ABSTRACT In this paper we investigate
Abstract. Janaka Jayalath Director / Information Systems, Tertiary and Vocational Education Commission, Sri Lanka.
 FEASIBILITY OF USING ELEARNING IN CAPACITY BUILDING OF ICT TRAINERS AND DELIVERY OF TECHNICAL, VOCATIONAL EDUCATION AND TRAINING (TVET) COURSES IN SRI LANKA Janaka Jayalath Director / Information Systems,
InCAS. Interactive Computerised Assessment. System
 Interactive Computerised Assessment Administered by: System 015 Carefully follow the instructions in this manual to make sure your assessment process runs smoothly! InCAS Page 1 2015 InCAS Manual If there
CONSTRUCTION OF AN ACHIEVEMENT TEST Introduction One of the important duties of a teacher is to observe the student in the classroom, laboratory and
 CONSTRUCTION OF AN ACHIEVEMENT TEST Introduction One of the important duties of a teacher is to observe the student in the classroom, laboratory and in other settings. He may also make use of tests in
Principal vacancies and appointments
 Principal vacancies and appointments 2009 10 Sally Robertson New Zealand Council for Educational Research NEW ZEALAND COUNCIL FOR EDUCATIONAL RESEARCH TE RŪNANGA O AOTEAROA MŌ TE RANGAHAU I TE MĀTAURANGA
Beginning Blackboard. Getting Started. The Control Panel. 1. Accessing Blackboard:
 Beginning Blackboard Contact Information Blackboard System Administrator: Paul Edminster, Webmaster Developer x3842 or Edminster@its.gonzaga.edu Blackboard Training and Support: Erik Blackerby x3856 or
Relationships Between Motivation And Student Performance In A Technology-Rich Classroom Environment
 Relationships Between Motivation And Student Performance In A Technology-Rich Classroom Environment John Tapper & Sara Dalton Arden Brookstein, Derek Beaton, Stephen Hegedus jtapper@donahue.umassp.edu,
MGF 1106 Final Exam Review / (sections )
") MGF 1106 Final Exam Review / (sections ---------) Time of Common Final Exam: Place of Common Final Exam (Sections ----------- only): --------------- Those students with a final exam conflict (with another
MGF 1106 Final Exam Review / (sections ---------) Time of Common Final Exam: Place of Common Final Exam (Sections ----------- only): --------------- Those students with a final exam conflict (with another
UNIT ONE Tools of Algebra
 UNIT ONE Tools of Algebra Subject: Algebra 1 Grade: 9 th 10 th Standards and Benchmarks: 1 a, b,e; 3 a, b; 4 a, b; Overview My Lessons are following the first unit from Prentice Hall Algebra 1 1. Students
Thesis-Proposal Outline/Template
 Thesis-Proposal Outline/Template Kevin McGee 1 Overview This document provides a description of the parts of a thesis outline and an example of such an outline. It also indicates which parts should be
OUCH! That Stereotype Hurts Cultural Competence & Linguistic Training Summary of Evaluation Results June 30, 2014
 OUCH! That Stereotype Hurts Cultural Competence & Linguistic Training Summary of Evaluation Results June 30, 2014 > Participant demographics > Pre/post/3-month evaluation of participant: - knowledge about