Introduction to Functions. by Rachel McGuire
|
|
|
- Reynard Quinn
- 6 years ago
- Views:
Transcription
1 P a g e 1 Introduction to Functions 9 th Grade Algebra Unit by Rachel McGuire
2 P a g e 2 Table of Contents Context Analysis... 3 Content Analysis... 5 Content Outline... 7 Concept Map... 9 Common Core State Standards Pre-Test Pre Assessment Lesson Plans. 23 Lesson Plan 3.1 Relations and Functions, Domain and Range Lesson Plan 3.2 Linear vs Nonlinear Functions Lesson Plan 3.3 Function Notation Lesson Plan 3.4 Graphing Standard Form Lesson Plan 3.5 Graphing Slope-Intercept Form Lesson Plan 3.6 Transformations Unit Overview Post Test Post Assessment Reflection and Self Evaluation Teaching Materials Resources... 98
3 P a g e 3 Context Analysis Community Factors Milan High School is located in Milan, Michigan and part of the Milan Area Schools district. The building houses ninth through twelfth grade students. Milan is a small community with a population of about 14,253 people and is located about 15 miles south of the Ypsilanti/Ann Arbor area. Most of the area consists of farms and many students work on their parents land. Only 14.6% of adult men over 25 and 18.5% of women went on to college after high school. Of those percentages, only about half of them graduated with a bachelor s degree. The median household income is about $82,000 and the average family size is 3. A majority of students come from two parent households and 92% of the student body (out of about 600 students) is Caucasian. Classroom Factors In my classroom we have 36 individual student desks. Most of the classes are relatively full, with only 1 or 2 desks left empty. In my class I like to promote cooperative learning. Most days the desks are arranged into groups of 4 in order to do so. Unfortunately we have very limited technology available to us. We are limited to a classroom set of TI-84 calculators. Every day in class the agenda is written on a side whiteboard and materials for the day are on the front board typically accompanied by a do-now startup problem. The students know to come in, pick up any handouts, a calculator, and their binder that they are allowed to keep in the classroom. Student Characteristics A majority of my algebra classes are freshman students. Many of them are still getting used to high school and can tend to be lacking in maturity levels. This being the case, I have to keep the class as structured as possible and I can t put too much responsibility on the students. I also have a high number of students on IEP plans and another portion of students are retaking the class. For many students, algebra is a new concept and students do not have very much prior knowledge relevant to the class material. A lot of these characteristics will play a significant role when it comes to planning my unit.
4 P a g e 4 Implications for Instruction Due to the high level of IEPs and students retaking algebra, my unit will need to move at a slower pace. Most of this material is brand new and I will have to demonstrate a lot of the concepts. Unfortunately this will limit the opportunities for inductive and cooperative lessons. Also due to the characteristics of the class, I believe cooperative group work may be difficult for some students. Many students tend to have issues focusing and staying on task when they are permitted to work in a group. I will need to make sure I give very clear directions and explain what my expectations are for the class periods when we are working in groups. Rationale Students: Have you ever wondered how much it would cost you for every minute you talk on the phone? How about how long it will take to fill up that pool you ve been thinking about all summer? In this unit we will discover how we can model real life problems with linear relationships. We will also learn how to graph these functions in order to visualize the relationship. Several of the problems we encounter on a daily basis can be modeled using a linear function and we don t even realize we are doing it. Teachers: This unit covers all of the material pertaining to the introduction of linear functions including domain and range, function notation, graphing, and transformations. The unit directly reflects several of the High School Functions Common Core State Standards and aligns with the school district s benchmarks. The material is presented in a variety of ways including group work, hands-on activities, and individual work to monitor personal progress and to prepare students for the summative assessment.
5 P a g e 5 Content Analysis Common Core State Standards HSF-IF.A.1 Understand that a function from one set (called the domain) to another set (called the range) assigns to each element of the domain exactly one element of the range. If f is a function and x is an element of its domain, then f(x) denotes the output of f corresponding to the input x. The graph of f is the graph of the equation y = f(x). HSF-IF.A.2 Use function notation, evaluate functions for inputs in their domains, and interpret statements that use function notation in terms of a context. HSF-IF.C.7a Graph linear and quadratic functions and show intercepts, maxima, and minima. HSA-CED.A.2 Create equations in two or more variables to represent relationships between quantities; graph equations on coordinate axes with labels and scales. HSF-IF-LE.A.1b Recognize situations in which one quantity changes at a constant rate per unit interval relative to another. HSF-IF-LE.A.2 Construct linear and exponential functions, including arithmetic and geometric sequences, given a graph, a description of a relationship, or two inputoutput pairs (include reading these from a table). HSF-BF.1a Write a function that describes a relationship between two quantities. HSF-BF.B.3 Identify the effect on the graph of replacing f(x) by f(x) + k, k f(x), f(kx), and f(x + k) for specific values of k (both positive and negative); find the value of k given the graphs. Experiment with cases and illustrate an explanation of the effects on the graph using technology. Include recognizing even and odd functions from their graphs and algebraic expressions for them. Generalizations We can model real world situations with linear functions. Focus Question: Can you think of any problems that have a linear relationship? A linear function has two variables and has a constant rate of change. Focus Question: How can I determine if two objects will have a linear relationship? Function Notation can be used as another way to write a function to easily represent the input and output.
6 P a g e 6 Focus Question: How can I represent an application problem using function notation? Graphs help to visualize information and allows us to easily read facts from the graph Focus Question: In what type of problems will it help me to visualize the information? Concepts Functions Domain and Range Linear functions Standard form of equations Slope-Intercept form Graphing Slope Linear transformations Application Facts Ordered pairs, graphs, mapping diagrams, and tables are representations of functions. The domain is a list of the inputs of a function and the range is a list of the outputs. A linear function has a constant rate of change. A linear function has two variables. The standard form of a linear equation is Ax + By = C. The y-intercept of a function is where it crosses the y-axis on a graph and when x = 0. The x-intercept of a function is where it crosses the x-axis and when y = 0. The slope-intercept form of a linear equation is y = mx + b. In the slope-intercept form, m represents the slope and b is the y-intercept. The slope of a line is rise over run and represents the rate of change. The linear equation y = x (or f(x) = x) is the parent function for all linear equations. A series of transformations can be performed on y = x to obtain every other linear function. Many real world problems can be modeled by linear functions.
7 P a g e 7 Content Outline I. Relations a. Pairs inputs with outputs i. A function pairs an input with only one output 1. Vertical line test ii. The domain is the set of the input values iii. The range is the set of the output values b. Can be represented multiple ways i. Ordered Pairs ii. Input/Output Tables iii. Coordinate Planes (Graphs) iv. Mapping Diagrams II. Linear Functions a. Two variables and a constant rate of change i. X and Y ii. Slope b. Tables i. Follow an addition or subtraction pattern c. Graphs i. Graph is a straight line d. Equations i. Can be written in the form y = mx + b. III. Function Notation a. Another way to name an equation i. Replaces y with f(x) in an equation ii. Can use any letter, most commonly f. b. Can easily visualize the input and output i. Example: f(2) = represents the input, 1 is the output IV. Graphing a. Standard Form Ax + By = C i. Find the x-intercept by plugging 0 in for y. (x, 0) ii. Find the y-intercept by plugging 0 in for x. (0, y) iii. Graph both intercepts on the same coordinate plane iv. Connect the points with a line b. Slope-Intercept Form y = mx + b i. M is the slope typically represented as a fraction (rise / run) 1. Rise how many units to go up or down 2. Run how many units to go left or right ii. B is the y-intercept 1. A point on the y-axis iii. Graph the y-intercept (0, b) iv. Do the slope starting at the y-intercept in both directions
8 P a g e 8 1. If positive, go up and right, and go down and left 2. If negative, go up and left, and go down and right v. Connect the three points with a line V. Transformations a. The parent function of all linear functions is f(x) = x or y = x b. Perform transformations on the parent function to obtain new lines i. Translations 1. Move up or down: g(x) = f(x) + k 2. Move left or right: g(x) = f(x+k) ii. Shrinks and Stretches 1. A shrink makes the slope of a line smaller or shallower. a. g(x) = f(ax) b. 0 < a < 1 2. A stretch makes the slope larger or steeper a. g(x) = f(ax) b. a > 1 iii. Reflections 1. Flips the graph over an axis a. Y-axis: g(x) = f(-x) b. X-axis: g(x) = -f(x) VI. Applications a. Model real-world problems with linear functions. b. Interpret what a linear equation in a contextual problem means.

9 Concept Map P a g e 9
10 P a g e 10 Common Core State Standards Unit Outcomes: (SWBAT) *HSF-IF.A.1 Understand that a function from one set (called the domain) to another set (called the range) assigns to each element of the domain exactly one element of the range. If f is a function and x is an element of its domain, then f(x) denotes the output of f corresponding to the input x. The graph of f is the graph of the equation y = f(x). HSF-IF-LE.A.1b Recognize situations in which one quantity changes at a constant rate per unit interval relative to another. Identify a function as a relation that pairs one input to exactly one output List the set of the domain and range for a function represented multiple ways Identify a function as linear based on the rate of change Create a table of values that represents a linear function and a nonlinear function HSF-IF.A.1 Understand that a function from one set (called the domain) to another set (called the range) assigns to each element of the domain exactly one element of the range. If f is a function and x is an element of its domain, then f(x) denotes the output of f corresponding to the input x. The graph of f is the graph of the equation y = f(x) *HSF-IF.A.2 Use function notation, evaluate functions for inputs in their domains, and interpret statements that use function notation in terms of a context. Find the output, y, when given the input, x, and vice versa when given a graph or a set of ordered pairs Write equations using function notation. Evaluate functions for the input or output when given the equation of the function Interpret the meaning of an input or output relevant to the context of a problem
11 P a g e 11 Common Core State Standards Unit Outcomes: (SWBAT) *HSF-IF.C.7a Graph linear and quadratic functions and show intercepts, maxima, and minima. Graph a line when given the x- and y- intercepts Graph the standard form (Ax + By = C) of a linear equation using the x- and y- intercepts HSA-CED.A.2 Create equations in two or more variables to represent relationships between quantities; graph equations on coordinate axes with labels and scales. Graph linear equations in standard form (Ax + By = C) on a coordinate plane HSA-CED.A.2 Create equations in two or more variables to represent relationships between quantities; graph equations on coordinate axes with labels and scales. Write the equation of a line when given the graph using the y-intercept and slope Graph a line when given the slope and y-intercept HSF-IF.C.7a Graph linear and quadratic functions and show intercepts, maxima, and minima. Graph a linear equation in slope-intercept form (y = mx + b) Identify the slope and y- intercept of a line when given the equation y = mx + b HSF-IF-LE.A.2 Construct linear and exponential functions, including arithmetic and geometric sequences, given a graph, a description of a relationship, or two input-output pairs (include reading these from a table). HSF-BF.1a Write a function that describes a relationship between two quantities. Write the linear equation of a line in the slope-intercept form when given a graph of the line Write the equation of a line in standard form when given the x- and y- intercepts
12 P a g e 12 Common Core State Standards Unit Outcomes: (SWBAT) HSF-IF.C.7a Graph linear and quadratic functions and show intercepts, maxima, and minima. Graph lines when given the equation in function notation or given a table of values Identify the slope and y- intercept from the graph of the line HSF-BF.B.3 Identify the effect on the graph of replacing f(x) by f(x) + k, k f(x), f(kx), and f(x + k) for specific values of k (both positive and negative); find the value of k given the graphs. Experiment with cases and illustrate an explanation of the effects on the graph using technology. Include recognizing even and odd functions from their graphs and algebraic expressions for them. Identify transformations on f(x) as either a translation, shrink, stretch, or reflection Identify a vertical translation as f(x) + k Identify a shrink as f(kx) when 0 < k < 1 Identify a stretch as f(kx) when 0 < k Identify a reflection over the y- axis as f(-x) Interpret the transformations from one equation to another and graph the functions on the same coordinate plane

 D:")
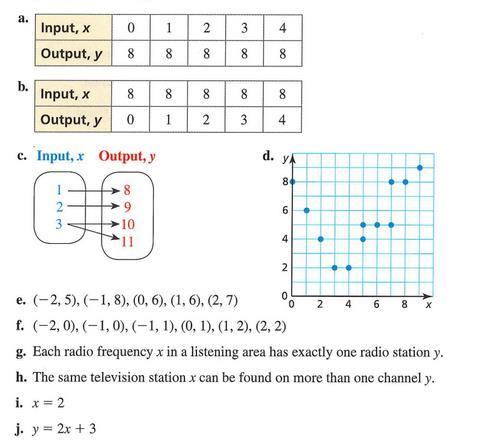
 D: {-2, -1, 3} R: {1 < y < 4} R: {-2, 1, 5} 3.")
13 P a g e 13 Algebra 1 Pre-test Answers in Red NAME KEY Unit 3: Introduction to Functions Block 1. Determine if each relation is a function: a) b) Yes No c) d) Yes No 2. For each relation/function shown in number 1, state the domain and range: a) D: {-5, -2, 1, 4} b) D: {-3, -2, -1, 0} R: {-3, -1, 1, 3} R: {12, 13, 14, 15 } c) D: {0 < x < 3} d) D: {-2, -1, 3} R: {1 < y < 4} R: {-2, 1, 5} 3. Determine if the given function is linear or non-linear a) b) Yes No c) y = 3x + 2 d) y = x Yes No
 = 2 x = 1 d) g = { (2,1) (5, 8) (7, 15) }, find g(5) g(5) = 8 5.")
14 P a g e 14 4 a) Rewrite using function notation as a function f of x the linear equation y = 2x 1 f(x) = 2x - 1 b) For g(x) = 10 3x find g(2) g(2) = 10 3(2) = 4 c) The function f is graphed below. Find x so that f(x) = 2 x = 1 d) g = { (2,1) (5, 8) (7, 15) }, find g(5) g(5) = 8 5. a) For 3x + 4y = 12, find the x and y intercepts: x 4 y 3 b) graph the function in part a) c) graph x = 3
 slope 2/3 y-intercept 1 b) y = 1 x 3 c) graph 2 y = 1 x 3 2 slope 1/2 y-intercept -3 7.")
 describe the transformation from f to h stretch by a factor of 2 c) describe the")
15 P a g e a) slope 2/3 y-intercept 1 b) y = 1 x 3 c) graph 2 y = 1 x 3 2 slope 1/2 y-intercept f(x) = 3x + 1 g(x) = f(x) 2 h(x) = f(2x) a) describe the transformation from f to g shifts down 2 units b) describe the transformation from f to h stretch by a factor of 2 c) describe the transformation of the parent function p(x) = x to f shifts up 1 unit stretch by a factor of 3
 graph the function and identify its domain and range D: {0 < x < 9} R: (6 < y < 10.")
16 P a g e The function d(t) = 1 t + 6 models the depth d (in inches) of snow on the ground during the 2 first 9 hours of a snowstorm, where t is the time (in hours) after the snowstorm begins. a) graph the function and identify its domain and range D: {0 < x < 9} R: (6 < y < 10.5} b) interpret the slope and the d-intercept slope: 1/2 1 inch of snow accumulates on the ground every 2 hours d-intercept: 6 when the snowstorm starts there is 6 inches of snow on the ground
17 P a g e 17 Pre Assessment Students were given a pre-test that was modeled after the test to measure how much the students knew about the topics of the unit before we began. I focused on three main objectives from the test and rated the students with a 1, 2, or 3 on these sections. 1 = none or very little understanding, 2 = limited understanding, and 3 = substantial understanding. After the pre-test, students will be given a plotting points practice worksheet to demonstrate their prior knowledge of graphing ordered pairs. There is limited prior knowledge needed for this unit, so this instrument will be used to determine if they have those necessary skills. Objective 1 Objective 2 Objective 3 (Test Questions 1 & 2) (Test Questions 4 & 8) (Test Questions 5 & 6) 0-3 examples = examples = examples = examples = examples = examples = examples = examples = examples = 3 Objective 1 HSF-IF.A.1 Understand that a function from one set (called the domain) to another set (called the range) assigns to each element of the domain exactly one element of the range. If f is a function and x is an element of its domain, then f(x) denotes the output of f corresponding to the input x. The graph of f is the graph of the equation y = f(x). Objective 2 HSF-IF.A.2 Use function notation, evaluate functions for inputs in their domains, and interpret statements that use function notation in terms of a context. Objective 3 HSF-IF.C.7a Graph linear and quadratic functions and show intercepts, maxima, and minima.
18 P a g e 18 Student Summary of Pre-Assessment Information Student Number Objective 1 Objective 2 Objective
19 P a g e 19
20 P a g e 20 Pre-Assessment Planning for Instruction Objective/Outcome Pre-Assessment Strategy Summary of Results Implications for Instruction HSF-IF.A.1 Understand that a function from one set (called the domain) to another set (called the range) assigns to each element of the domain exactly one element of the range. If f is a function and x is an element of its domain, then f(x) denotes the output of f corresponding to the input x. The graph of f is the graph of the equation y = f(x). Students were given a pencil and paper pretest of the entire unit. This outcome was measured by questions 1 and 2. Question 1 had four relations and students were ask to identify if they were a function or not. Question 2 had four relations and students were asked to list the domain and range of each. Students receive a 1 rating for 0-3 correct answers, a 2 for 4-6 correct answers, and a 3 for 7-8 correct. On the pre-test, 32 students were able to correctly answer 0-3 questions and 25 students were able to answer 4-6 questions. A little over half of the students do not understand the topic, and the others have some knowledge. The activities I design will have a varying level of difficult to accommodate all students. Objective/Outcome Pre-Assessment Strategy Summary of Results Implications for Instruction HSF-IF.A.2 Use function notation, evaluate functions for inputs in their domains, and interpret statements that use function notation in terms of a context. Students were given a pencil and paper pre-test of the entire unit. This outcome was measured by questions 4 and 8. Question 4 had four questions involving function notation. Question 8 had two parts for students to answer and interpret meanings. Students receive a 1 rating for 0-2 correct answers, a 2 for 3-4 correct answers, and a 3 for 5-6 correct. On the pre-test, all 57 students were only able to score a rating of 1, indicating at most 2 right answers out of 6. This concept is new for the entire class and I will need to spend an ample amount of class time teaching this topic. I will most likely need a variety of activities and practice.
21 P a g e 21 Objective/Outcome Pre-Assessment Strategy Summary of Results Implications for Instruction HSF-IF.C.7a Graph linear and quadratic functions and show intercepts, maxima, and minima. Students were given a pencil and paper pre-test of the entire unit. This outcome was measured by questions 5 and 6. Both of these questions were related to graphing either standard form or slopeintercept form of linear equations. Students receive a 1 rating for 0-2 correct answers, a 2 for 3-4 correct answers, and a 3 for 5-6 correct. On the pre-test, 52 students received a rating of 1 and 5 students received a rating of 2. This concept is new for almost the entire class. The few students who scored a 2 may have had a little more prior knowledge. We will spend a lot of class time on graphing equations until a majority of the class understands the topic. Pre-Assessment Data Summary Number of Students who received each rating for each objective Rating Objective 1 Objective 2 Objective
22 P a g e 22 Students of Special Concern Most students did not do very well on the pre-test, and a few did exceptionally better than their peers, so there are a few students I will have special concerns for. The first student I am concerned about left most of the pre-test blank and received a rating of 1 on the few questions he did answer. This student is repeating Algebra and should have been able to complete most of the test or at least attempt to. I think math does not come naturally to him so he allows himself to get easily distracted as not to have to do the work. Another student I am concerned will almost never do any work. He didn t even turn the pre-test in, but I know he also didn t try any of it. We have a para pro in the room that offers to help him, but most of the time he refuses. He consistently puts his head time and does not participate. I am concerned that he will deter from other students learning. A third student of concern is highly intelligent. He catches on to topics very quickly. However, part of the problem is that he thinks he already knows all of the material. He did better than most students on his pre-test, but he did not receive any ratings of 3 so he still has more to learn than he thinks he does. It tends to be hard to get him to stop talking and pay attention to the lecture because of this ego boost. There are several other students that tend to have the same characteristics of these three students, but not to the extreme of these three. Student for Learning Analysis The student I have chosen for my student has potential to do very well, however he has ADHD and can tend to become disruptive in class. He is very talkative and is quick to go off topic because he wants to tell a story rather than work on his math assignment. When he focuses and asks questions, he tends to do well. However, getting him to that point of working on the task at hand can be very difficult. I know he has to work a little bit to understand the material because it doesn t come as naturally as it does for other students, but he tends to take any distraction he can find. If I am standing or sitting with him he does his work, but the moment I walk away he stops. Sometimes he even tries to draw me into a story but I am quick to deter him from that and get back to his assignment. Like most students on the pretest, he had a rating of 1 for all three objectives. Most of the problems he did not attempt because he didn t know how to answer them.
23 P a g e 23 Lesson Plan 3.1 Relations and Functions, Domain and Range Topic: Duration: Purpose: Materials: In this lesson we will discuss what a relation, function, domain, and range is. Students will complete two activities in order to understand these concepts. Two 50-minute class periods In the real world, we can represent many problems by using functions. In order to understand what a function is, we need to know what a relation is. We also need a way to talk about functions intelligently so we use things like the domain and range to specify what values we want to look at. It is important for students to see how they can model situations mathematically to get logical answers to their problems. Colored paper to make flip books Scissors (in group supply box) Glue (in group supply box) Colored pencils / markers (optional) (in group supply box) Dice Standards: 3.1 Function activity worksheet Function sort activity Notes Elmo (document projector) HSF-IF.A.1 Objectives: Identify a function as a relation that pairs one input to exactly one output List the set of the domain and range for a function represented multiple ways Assessment: Formative completion of flip book, group activity sheet, and function sort
24 P a g e 24 Anticipatory Set: Do-Now Input What and How Modeling Pick up colored paper and group supply box Review plotting points practice from pre-assessment Review ordered pairs as (x, y) Ordered pairs represented by a table Graphing points on coordinate plane Teacher will model how to make the flip book while students follow along Students will then have time to work on the activity sheet and complete the function sort We will come together to do a mini lecture on the first part of the notes. Teacher will demonstrate flip book 1. Demonstrate each fold for the students: a. Fold the paper in half (hamburger style) b. Repeat 3 more times c. Unfold paper 2. Cut the two small creases on each side of the paper (hotdog sides) a. This creates four flaps that can be folded in to cover up the inside. 3. Label the outside of each flap with these four labels: a. Ordered Pairs b. Input/Output Table c. Coordinate Plane (graph) d. Mapping Diagram 4. The inside of the flap part gets the following words to define a. Relation b. Function c. Domain d. Range 5. The four other boxes (in the center of the paper) that get covered by the flaps are for examples of each type of relation listed on the front of the flaps.
25 P a g e Start the discussion by defining what a relation is: it pairs inputs with outputs. The students can write a definition in their own words in the relation box. 7. I will demonstrate each type of relation while the students watch, and then students will create their own examples for their books. Students are sitting in groups of 4 and each person will be responsible to create one of the example types to share with the group. (ordered pair, table, graph, mapping diagram). 8. We will come back together as a class and discuss the examples and now define how we can express the domain of a relation. I will allow the students to reason that if the domain is the inputs (or x values) then the range must be the outputs (or y values). Students will then have the opportunity to go back and list the domain and range for each of their relations. 9. Finally, we will talk about the definition of a function and how it is a particular type of relation. Once we define a function as a relation that assigns one input to only one output, the students will be responsible to look at their examples and determine which ones are functions. 10.For the remainder of the time the students will work on an activity worksheet in their groups. a. The first page has the students determine whether each relation is a function. b. The second page starts with the students rolling dice to create ordered pairs. Each student in each group will roll the dice twice to create an ordered pair. There will be four all together since students are seated in groups of four. The group will then decide if their set of ordered pairs makes and function and state the domain and range. c. Each group will share the relation their dice made. d. The last three problems give students sets of ordered pairs to again decide if it is a function and state the domain and range. 11.This activity will take up all of the first day of the lesson. The second day we will wrap up any sharing or problems left from the activity. 12.I will now pass out a function sort for the students to complete. They will get a red sheet of relations (12) to cut apart and a yellow sheet that is divided into two columns: function and not a function. The students will need to paste the relations in the appropriate column. 13.At the completion of the sort, we will go over the answers. 14.Now we will look at the short notes for this topic. The flip book is the bulk of the notes, so the sheet will introduce the vertical line
26 P a g e 26 Checking for Understanding test and how to write the domain and range of a continuous function rather than just individual points. While the students are completing the flip book examples, I will walk around to make sure they are correctly creating examples. I will also answers questions as they come up. The activity worksheet will be another opportunity for me to quickly identify whether or not the students are understanding the concepts. The second day I will monitor how much of the material sunk in while the students are completing the function sort. Finally we will come together to summarize the lesson with the notes. Guided Practice Closure The students will have several opportunities to practice with my supervision when they complete the flip book, the activity worksheet, and the sort. If students are continuing to struggle with the problems, I will create additional work and problems for them to practice before we move on to the next lesson. At the end of the class period for day 1, we will come together the last few minutes of class to summarize what we have learned. I will ask the students to define a relation, domain, range, and a function without looking that their flip books. The second day we will end with the small lecture of notes that will tie the entire lesson together. Independent Practice As long as students complete to assigned work in class, there will not be additional independent work to complete. However, any uncompleted work must be taken home and finished. Adaptations: There is a variety of learning styles that can be met with these activities as it has been originally been designed. If any students struggle with motor skills, the folding and cutting may be difficult for them, so I will pre-make the book for them so they can just do the writing portion. Other students may have difficulty keep up with the writing, so I will pre-write basic information for them. These students will still be able to fold and cut the book, but some panels will already be filled in. this should not be a problem if the students follow the instructions, the book will line up.
27 P a g e 27

28 P a g e 28
29 3.1 Function Exploration P a g e 29
30 P a g e 30
31 Function Sort Activity P a g e 31


32 P a g e 32 Algebra Notes Functions & Linear vs Non-Linear Domain and Range
.")
33 P a g e 33 Linear vs Non-Linear Functions Linear functions have a constant rate of change which means the quantity that changes by equal amounts over equal intervals. When graphed linear functions will form a straight line (non-vertical). Any linear equation can be written in the form: y = mx + b Examples: y = 2 x y = 8
34 P a g e 34 Lesson Plan 3.2 Linear vs Nonlinear Functions Topic: Duration: Purpose: Materials: Standards: Determine whether or not a function is linear or nonlinear when given a graph, table, or equation. One 50-minute class period, partial of a second if necessary There are several real-world problems that can be modeled with a linear function. In order to model and graph these functions, we need to be able to identify whether or not a function is linear. Objectives: Notes Functions & Linear vs Nonlinear Practice 3.2 Linear Functions Calculator (class set TI-84) Elmo (document projector) HSF-LE.A.1b Identify a function as linear based on the rate of change Create a table of values that represents a linear function and a nonlinear function Assessment Formative 3.2 practice worksheet Anticipatory Set Do-Now: Take out notes from yesterday and pick up practice sheet Review the definition of a function Given two mapping diagrams, determine if they are a function: No 6 7 Yes 7 9
35 P a g e 35 Input What and How Modeling Mini-Lecture on the notes sheet projected on the document projector (Elmo) Teacher will walk through most of the examples with the students while allowing them time to answer one or two on their own Students should be writing notes down and asking questions Teacher will go through notes: 1. The first side was already completed in the previous lesson, so we will start with the back 2. Read definition at top of page and explain in simpler words 3. Look at first 2 examples (graphs) and ask the students if the first graph forms a straight line. (Students should respond with yes ) 4. Look at the 2 nd graph, does it form a straight line? a. There may be mixed responses here b. Explain that even though the graph is made up by 2 straight lines, it is not just 1 line so it is not a linear function 5. Take any questions students have 6. Example 3 displays a table of values. Show that there is a constant rate of change so it is a linear function. You can add 1 between each x value and you can add 2 between each y value. 7. Explain that a linear function will follow a constant addition or subtraction pattern. The value added to each x does not have to be the same number that is added to each y. 8. Allow students time to independently try example 4 before giving the answer that it is not a linear function and demonstrating that it does not follow a pattern. 9. Examples 5-8 give equations and we need to determine if they are linear. Explain that a linear equation can always be written into the form y = mx + b. 10.Demonstrate number 5 by showing you can distribute and the equation will take that form, so it is linear. 11.Instruct the students to try and decide if 6-8 are linear or not and go over answers. (6 and 7 are no, 8 is yes since it is a special case) Checking for Understanding During step 7 of modeling, walk around while students are trying example 4 and see how they are doing. When going over the problem, ask for students input that will lead to the correct answer.
36 P a g e 36 Step 10 is another opportunity to check for understand as students try to answer examples 6-8. If necessary, add an additional examples before giving students practice time. Guided Practice Closure Students may work in groups of 4 to complete a practice worksheet about linear functions. There are seven graphs, four tables, and six equations for the students to determine if they are linear or not. The teacher will circulate the room checking students work and answering questions when necessary. If there seemed to be a repeating question or continuous misconception, the problem should be addressed with the entire class. Toward the end of the class period, we will come back together to discuss the worksheet. If most students have finished, we will share out the answers. However, if a majority of students have not finished then the worksheet will become homework. We will review what we have learned for the day: the graphs of linear functions will form a straight line, tables will have an addition or subtract pattern, and equations will be in the form y = mx + b. Independent Practice There will not be additional practice for this lesson. If students do not finish the worksheet in class, they will be responsible to take it home and finish it. At the beginning of the next day we will go over the answers if we don t during class. Adaptations Some students work at a much slower pace than others. For these students, I will cut back the numbers of problems they must complete on the worksheet. The students groups are arranged by ability. This way, low-ability students can be assisted by higher-ability students. The high-ability students are then challenged by the necessity to become a pseudo-teacher in helping their classmates. For students that are struggling with the mathematical portion of the tables and equations, I will provide graph paper. The students will, if they chose, be able to sketch a graph of the problem to help them determine linearity.


37 P a g e 37 Algebra Practice 3.2 Linear Functions Name Determine whether or not each graph is a linear function:
38 P a g e 38 Determine whether or not each table represents a linear function: Determine whether or not each equation represents a linear function: (hint: remember linear functions can be written as y = mx + b) 1. y = x x + 2y = x + 4 = y 4. 2(y + 3) + x = 4x y = 8 6. x = 9
39 P a g e 39 Lesson Plan 3.3 Function Notation Topic: Duration: Purpose: Materials: Standards: Rewrite linear equations using function notation and use them to evaluate functions for a given value. One or two 50-minute class periods Sometimes it can be confusing and hard to identify which value is the input and which is the output. Function notation creates an easier method for identifying which variable is independent and which is dependent. This notation also creates an easy way to evaluate functions while still seeing the input and output. For example, y = 5 tells me the output is 5. Whereas f(1) = 5 still tells us the output is 5, but we also know the input was 1, and that gave us an output of 5. Notes 3.3 Function Notation Practice 3.3 Function Notation Calculator (class set TI-84) Elmo (document projector) HSF-IF.A.1 HSF-IF.A.2 Objectives: Find the output, y, when given the input, x, and vice versa when given a graph or a set of ordered pairs Write equations using function notation. Evaluate functions for the input or output when given the equation of the function Interpret the meaning of an input or output relevant to the context of a problem Assessment Formative 3.3 practice worksheet Summative Quiz Anticipatory Set
40 P a g e 40 Do-Now: Take out worksheet from yesterday and pick up new notes Review the answers from the previous lesson Are these linear functions: 1. y = x(x + 1) No 2. y 2x = 4 Yes Input What and How Modeling Lecture on the notes sheet projected on the document projector (Elmo) Teacher will walk through most of the examples with the students while allowing them time to answer one or two on their own Students should be writing notes down and asking questions Teacher will go through notes: 12.Read definition at top of page and explain in simpler words 13.Explain the two diagrams. One displays an input of x with an output of y. The second shows the same type of function machine but instead of getting out y we get out f(x) 14.Complete example 1 a. Re-write the function y = x + 3 as f(x) = x + 3. b. Fill in the tables with the same values. This shows that the equations are exactly the same, just written a different way. 15.Take any questions students have 16.Move on to example 2. For the first problem, demonstrate how to plug in 2 everywhere there is an x and solve the problem by doing f(2) = 4(2) + 1 = Emphasize that with an input of 2, we got an output of 9 so that students can see the relationship. 18.Have the students try the next problem on the right. Walk and check students work and allow one to share how they did the problem and what the answer is. 19.Repeat this process (6 and 7) with the next two problems. 20.When the students flip the page, have them try the example at the top on their own first. There is a high likelihood there will be a lot of confusion on the third and fourth problems. Once the students have all reached that point, go over the problems together. 21.Example 3 works backward showing that we can solve for x when we are given a value for f(x). Demonstrate the first and have students try the second.
41 P a g e Take any questions students have. 23.Example 4 uses table and graph reading ability. When we are given an input/output, we can find the corresponding input/output value. Checking for Understanding Multiple times during the modeling process the students will have a chance to do a you try problem as explained. This allows the teacher to quickly assess whether or not they are comprehending the information. If students are struggling with doing problems on their own, then there needs to be further explanation and possibly another example. Guided Practice Closure Students may work in groups of 4 to complete a practice worksheet using function notation. The worksheet is quite long and has several problems. This will likely take the remainder of the class period and most of the next class as well. The worksheet has several problems just like the ones modeled in the notes, in addition there are 2 application problems. We will go over all of the directions together so that it is clear of what the students are required to do for each problem. The teacher will circulate the room checking students work and answering questions when necessary. If there seemed to be a repeating question or continuous misconception, the problem should be addressed with the entire class. Toward the end of the class period, we will come back together to discuss the worksheet. The notes will take a lot of time so the students will not have had very long to work on it. I will assure them that we will continue to work on it the next day. We will review what we have learned for the day: function notation is just a new way to write an equation and it helps us evaluate functions for given values. Independent Practice There will not be additional practice for this lesson. The students will be given ample class time to continue the worksheet. At the end of the next class period we will go over the answers, especially for the application problems. Adaptations Some students work at a much slower pace than others. For these students, I will cut back the numbers of problems they must complete on the
42 P a g e 42 worksheet. The students groups are arranged by ability. This way, low-ability students can be assisted by higher-ability students. The high-ability students are then challenged by the necessity to become a pseudo-teacher in helping their classmates.


 = 4x + 1.")
43 P a g e 43 Algebra Notes 3.3 Function Notation Function Notation is another name for y. We use f(x) to represent y, and it is read as f of x. In a function, x represents the independent variable. The dependent variable is represented by y or f(x). Example 1: Re-write using function notation 1. y = x + 3 Example 2: We can evaluate functions when we are given a value of x. f(x) = 4x + 1. let x = 2 g(x) = 6 2x let x = 5 h(x) = 3 x 1 Find h(4) f(x) = 2 (1 )x + 10 Find f(9) 3
 = 12 3x find x so that f(x) = 9 g(x) = -2x + 4 find x when g(x) = -2 Example 4: Using a graph, table, or coordinate points 1. (2, 1), (3, 4), (-5, 9), (0, -2), (10, -4) Find f(-5). 2.")
44 P a g e 44 f(x) = x 2 g(x) = 2x 1 f(3) = g(4) = f(n) = g(4) f(3) = Example 3: We can also work backward to solve for x when given a value of f(x). f(x) = 12 3x find x so that f(x) = 9 g(x) = -2x + 4 find x when g(x) = -2 Example 4: Using a graph, table, or coordinate points 1. (2, 1), (3, 4), (-5, 9), (0, -2), (10, -4) Find f(-5). 2. Find x when f(x) = 9 3. f(5) = if f(x) = 0, then x =
45 P a g e 45 Algebra Name 3.3 Practice Function Notation Evaluate each function for when x = 3, -1, 0, and f(x) = 8x 4 find x when f(x) = g(x) = 15 3x find x when g(x) = h(x) = 2(x + 3) + 1 find x when h(x) = 7 Evaluate the following compositions: 4. f(0) h(-1) 5. g(5) + h(3) 6. h(0) f(3) + g(-1) 7. g( f(5) ) 8. h( f(x) )

46 Use the graph of f(x) to answer the following: P a g e 46
47 P a g e 47 Lesson Plan 3.4 Graphing Standard Form Topic: Duration: Purpose: Materials: Graphing linear equations that are in standard form Ax + By = C One 50-minute class period Being able to graph data is a skill that can come in handy in several fields of study. Standard form is one way in which we will come across linear equations. In this lesson we will learn the skills necessary to graph this type of linear equation. Notes 3.4 Graphing Equations in Standard Form Practice 3.4 Graphing Standard Form Rulers Standards: Objectives: Calculator (class set TI-84) Elmo (document projector) HSA-CED.A.2 HSF-IF.C.7a Graph a line when given the x- and y- intercepts Graph the standard form (Ax + By = C) of a linear equation using the x- and y- intercepts Graph linear equations in standard form (Ax + By = C) on a coordinate plane Assessment Formative 3.4 practice worksheet Summative Quiz Anticipatory Set Do-Now: Pick up new notes and practice sheets Graph the following points on a coordinate plane:
48 P a g e 48 (0, 1) (1, 0) (2, -1) (-1, 2) (3, 4) Check answers, remind students ordered pairs are always (x, y) and we move left or right first, and then up or down. Input What and How Modeling Lecture on the notes sheet projected on the document projector (Elmo) Teacher will walk through one example and have the students try the next one. The second part of the notes are special cases. I will allow the students to first speculate about how the line should look before giving the answer. Students should be writing notes down and asking questions Teacher will go through notes: 24.Read definition at top of page and explain in simpler words 25.Explain what the x- and y- intercepts are and how to find them from an equation 26.Start the first example by plugging in 0 for y to find the x-intercept and plot that point. 27.Repeat for the y-intercept by plugging in 0 for x. 28.Using a straight edge, connect the two points with a line. 29.Ask for questions the students may have and instruct them to attempt the next problem on their own. 30.Walk around and check student progress before discussing the answer. 31.If there are still no questions, move on to discuss the special cases of vertical and horizontal lines. 32.Graph the two examples together. 33.If there are no questions then students may begin the practice worksheet. Checking for Understanding During the modeling process the students will have a chance to do a you try problem as explained. This allows the teacher to quickly assess whether or not they are comprehending the information. If students are struggling with doing problems on their own, then there needs to be further explanation and possibly another example.
49 P a g e 49 Guided Practice Closure Students may work in groups of 4 to complete a practice worksheet. The practice consists of 12 problems in standard form to graph the line. The students must find the x- and y- intercept in order to graph the problem. The teacher will circulate the room checking students work and answering questions when necessary. If there seemed to be a repeating question or continuous misconception, the problem should be addressed with the entire class. Toward the end of the class period, we will come back together to discuss the worksheet. There should be plenty of class time for the students to complete this task. I will have each group come up to share out an answer and then I will post the answers to any remaining questions. We will review that to graph standard form equations we must find the x- and y- intercepts by plugging in zeros before we can graph. Independent Practice There will not be additional practice for this lesson. The students will be given ample class time to finish the worksheet. Adaptations Some students work at a much slower pace than others. For these students, I will cut back the numbers of problems they must complete on the worksheet. The students groups are arranged by ability. This way, low-ability students can be assisted by higher-ability students. The high-ability students are then challenged by the necessity to become a pseudo-teacher in helping their classmates.
 and x and y are the variables. We can graph lines in this form by using the x- and y- intercepts.")
50 P a g e 50 Algebra Notes 3.4 Graphing Equations in Standard Form The standard form of a linear equation is Ax + By = C. In this equation, A, B, and C are constants (numbers) and x and y are the variables. We can graph lines in this form by using the x- and y- intercepts. Example 1: Graph 3x + 4y = 12 x-intercept: y-intercept:
51 P a g e 51 You Try: 2x y = 4 x-intercept: y-intercept: Example 2: Special Cases Consider what happens when either A = 0 or when B = 0. Graph: x = 3 y = -2
52 P a g e 52
53 P a g e 53
54 P a g e 54
55 P a g e 55 Lesson Plan 3.5 Graphing Slope-Intercept Form Topic: Duration: Materials: Students will learn how to graph linear equations in the form y = mx + b. One to two 50 minute class periods 3.5a Slope Notes 3.5a Slope Practice 3.5 Slope-Intercept Exploration 3.5 Practice Slope-Intercept Rulers Calculator (class set TI-84) Elmo (document projector) Common Core State Standards: HSA-CED.A.2 HSF-IF.C.7a HSF-IF-LE.2 HSF-BF.1a Objectives: Write the equation of a line when given the graph using the y-intercept and slope Graph a line when given the slope and y-intercept Graph a linear equation in slope-intercept form (y = mx + b) Identify the slope and y-intercept of a line when given the equation y = mx + b Write the linear equation of a line in the slope-intercept form when given a graph of the line Purpose: One of the most common forms of a linear equation is y = mx + b. For graphing and reading information from the equation, this is the easiest form to work with. This lesson has been designed to be inductive so that the students can discover what the equation tells us for themselves. (the slope and y-intercept)
56 P a g e 56 Anticipatory Set Do Now: Exploration: Students will pick up slope notes and practice Review the concept of slope (students should have prior knowledge) Slope = Rise / Run = (y 2 y 1) / (x 2 x 1) We will go over the notes on slope fairly quickly and students will have an opportunity to practice finding the slope for 8 lines. This activity will serve as a refresh of how to find the slope of a line. The goal of the exploration is to discover the slope-intercept form of linear equations and how easy it is to use to graph. To start the exploration, I will ask students how we can graph a line. The responses should explain that we have to find the x- and y- intercept by plugging in 0 for x or y before we can graph. I will pose the question of whether or not we can find an easier way. The exploration has four equations for the students to try and graph. The table at the top of the page has four columns. The first reads the equation, then the x-intercept, y-intercept, and finally slope from graph. The equations are already given in slope-intercept form instead of the standard form that the students are used to. The students should start to realize the y- intercept is the same as the number that is in the position of b in y = mx + b. They may also start to notice the slope is the same as the number in front of x (m). Metacognition Opportunities After the students fill in the table and graph each line, there will be three questions they are going to try to answer. These should be easy if they already noticed the pattern. If they haven t already made the connection, the table should make it easy to see. Applying Knowledge 1. Do you notice anything about the y intercept and the equation of the line? 2. Do you notice anything about the slope and the equation of the line? 3. In the equation y = mx + b, what is the slope and what is the y intercept? The last portion of the exploration asks students to graph two equations. I do not ask them for the x- or y- intercept. The directions say graph the equation using only the slope and y-intercept. Then they are given steps as a
57 P a g e 57 guideline: 1. Graph the y- intercept, 2. do the slope starting at that point to graph another point, and 3. draw the line. Students should recognize that the equation is in the slope-intercept form, y = mx + b, so they don t have to do any algebra or solving. They can automatically read the y- intercept and slope. After the completion of the exploration students will be given a practice worksheet of several equations to graph using the slope and y- intercept. Checking for Understanding I will walk around as students are working on the exploration and help them follow the right path. I will check there work as they go and I will also ask some students to explain their answers to the three questions for me. Assessment Closure Formative completion of exploration and practice worksheet Summative Quiz When all students have completed the exploration, we will come back together as a class to discuss what they have discovered and learned. I will project the questions and table at the same time. The students will help me fill in the table with their answers and explain the answers to the three questions. We will also cover one of the graphing problems together to make sure all students understand the concept and are using it correctly. The students will be given a practice to independently work on, most likely at home. We will also be taking a quiz on sections the following day in class and students will have the opportunity to demonstrate the skills they have learned from each lesson. Adaptations This activity has been set up so that it is complex enough for my advanced learners but yet simplistic to follow. For students that need additional assistance I will give them more direction instructions and steps to follow in order to successfully complete the exploration. The students will also be working in groups and can help one another. The groups are typically paired by learning ability so advanced workers can help students in need. If need be, I will cut back the number of problems some students need to do. Instead of working on four equations to see the pattern, I may allow them to try only two and see what they discover.


58 P a g e 58 Algebra Notes 3.5a Slope m represents the slope of a line. We can find slope given a table, two points, a graph, or from an equation of a line.
59 P a g e 59
60 P a g e 60
61 P a g e 61 Algebra 3.5 Slope-Intercept Exploration Name Directions: 1. Find the x-intercept and y-intercept for the equation. 2. Graph the intercepts and draw the line. 3. Find the slope of the line. a. y = 1 2 x 2 Equation X-intercept Y-intercept Slope from Graph b. y = 3 2 x + 3 c. y = 5 3 x + 5 d. y = 7 4 x 7 a. b. c. d.
62 P a g e 62 Questions: 1. Do you notice anything about the y-intercept and the equation of the line? 2. Do you notice anything about the slope and the equation of the line? 3. In the equation y = mx + b, what is the slope and what is the y-intercept? Graph the equation using only the slope and y-intercept 1. Graph the y-intercept 2. Do the slope starting at that point to graph another point 3. Draw the line 1. y = 4 3 x y = x 3 3 5
63 P a g e 63
64 P a g e 64
65 P a g e 65 Algebra Graphing Cheat Sheet Name Standard Form: Ax + By = C 1. Find x-intercept (plug in 0 for y) 2. Find y-intercept (plug in 0 for x) 3. Graph intercepts Slope-Intercept Form: 1. Graph the y-intercept 2. Do the slope starting from b 3. Do the slope in the other direction from b to find third point 4. Connect 3 dots Algebra Graphing Cheat Sheet Name Standard Form: Ax + By = C 1. Find x-intercept (plug in 0 for y) 2. Find y-intercept (plug in 0 for x) 3. Graph intercepts Slope-Intercept Form: 1. Plot the y-intercept 2. Do the slope starting from b 3. Do the slope in the other direction from b to find third point 4. Connect 3 dots
66 P a g e 66 Algebra Name Quiz Function Notation and Graphing Block 1. f(x) = 6x 4 a. Find f(3) b. If f(x) = 20, find x. 2. Graph 5x + 3y = 15 a. X-intercept: b. Y-intercept: 3. Graph y = 3 4 x 5 a. Y-intercept: b. Slope:
67 P a g e 67 Lesson Plan 3.6 Transformations Topic: Duration: Purpose: Materials: Standards: This lesson focuses on the parent function f(x) = x and transformations made to the function to obtain a new function. The will take two full 50-minute class periods The purpose of learning transformations is to see how different things can actually be related. We may have two items that look completely different, however, typically there are underlying similarities that can be hard to identify. We will use lines to visualize the similarities between equations of lines. 3.6 Transformations Exploration Notes and Practice 3.6 Transformations Colored Pencils and Rulers Calculator (class set TI-84) Elmo (document projector) HSF-IF.C.7a HSF-BF.B.3 Objectives: Graph lines when given the equation in function notation or given a table of values Identify the slope and y-intercept from the graph of the line Identify transformations on f(x) as either a translation, shrink, stretch, or reflection Identify a vertical translation as f(x) + k Identify a shrink as f(kx) when 0 < k < 1 Identify a stretch as f(kx) when 0 < k Identify a reflection over the y-axis as f(-x) Interpret the transformations from one equation to another and graph the functions on the same coordinate plane
68 P a g e 68 Assessment: Formative completion of exploration and 3.6 practice sheet Anticipatory Set Do-Now: Social Objective Class will begin with a quiz on lessons Following the quiz students will pick up the exploration packet to work on. Once all students have completed the quiz they will work cooperatively to complete the activity. Every student will have a voice in their group for this activity. Students must remember to be respectful when one of their classmates is speaking. They are to actively listen and respond to one another s thoughts. The focus must also be on the task at hand. Face to Face Interaction As for most activities in our classroom, the desks will be arranged in to groups of four. We have enough desks for nine groups. Two students will be seated side by and side and facing the other pair that is also side by side. Each student will be directly across and next to another student in order to promote cooperative learning. Positive Interdependence Each student will have a role in their group. One student will be responsible for keeping track of time and making sure the group is on task. Another will be responsible for getting and putting away all group materials. The third will serve as the official recorder. Every student should be completing the activity, but if the group is asked to share out their work, the recorded will be the one whose work is displayed so it must be clear and easy to follow. The fourth student will be the speaker or voice of the group. They will do any explaining when the group shares and answers questions. Individual Accountability In addition to the group roles, each student in the group will have a number assigned to them 1-4. There are four equations per section on the exploration. Each student will start with the equation corresponding to their number and explain to their group how to do that problem. Through each group member s problem and explanation, the group will end up with a completed exploration and they should all have similar findings in noticing
69 P a g e 69 the patterns. If each student can successfully explain their problem, it will demonstrate that they are meeting the lesson objectives. Group Accountability Each group will be responsible for sharing and explaining a problem to the class. If the group cannot provide a clear explanation to the class, then disciplinary actions may be taken. This activity is a formative assessment and if the group doesn t complete it and cannot demonstrate a clear understanding of the concept, then they will be assigned additional work to complete and turn in. Input What and How Modeling Transformations are a completely new and different topic for the students. Along with the cooperative exploration activity, we will have a set of formal notes. If the exploration is completed, the students should have a somewhat appropriate level of understanding of the topic. The lecture should be interactive and students should be able to help lead and answer questions. We will go through the notes together, projected on the board. Students should be writing down the notes and asking questions to further understand the concept. Teacher will go through notes: 1. The exploration demonstrates a good portion of the topic and how the transformations work, but it does not give any formal names or explanations for each type of transformation. 2. The first transformation we will cover is a translation. For linear equations we will only be looking at vertical translations, so as to not confuse the students. 3. Work through the example together by filling out the table by plugging in values and then graphing each function. 4. The general form of a vertical translation is g(x) = f(x) + k where the graph shifts up when k is positive and down when it s negative. 5. Take questions about translations before moving on 6. The next transformation is shrinks and stretches. The students should recognize this as a change in the slope of the line. When the slope is bigger than 1, it is a stretch, and when it is a fraction between 0 and 1 it is a shrink. 7. Once again work through the example together. If students are confident, they may work ahead and complete the table and graph on their own.
70 P a g e The last transformation we will look at is reflections over the y-axis which are notated as g(x) = f(-x) 9. The next example we will work through to identify the transformations that have occurred from one equation to another. 10.These are the kind of problems the students will be expected to be able to complete. 11.Take questions about these problems before assigned the students the practice portion which is the next section of the notes packet. Checking for Understanding Throughout the exploration activity, I will be walking around and checking each groups work. When I notice misconceptions I will point them out and help redirect the students to where they should be. Each group should be able to explain the exploration. If there is a lot of confusion, then I know we will have to take the notes at a slower pace and possibly add additional examples. During the notes, students should be actively participate because the exploration set them up for this concept. If there is hesitation we will slow down and I will answer any questions the students have. If necessary, we will complete two or three of the practice problems together before the students are given time to work in groups and on their own. Guided Practice Closure As explained, the last page of the notes is a practice exercise worksheet. The students will be able to work together to complete these problems under my supervision. If there tends to be common mistakes, we will come together to look at a particular problem to clear up the misconception. Students will be able to ask for help during this practice to insure that they understand the problems they are working on. Once the class period for the exploration is ending we will come together for each group to have a chance to demonstrate and explain their findings in the exploration. I will review with the class that we can notice each new line we added originated from the parent function and just moved around. At the end of the notes and practice class period, we will come together to recap and summarize the types of transformations we know. Translations represented by g(x) = f(x) + k Shrinks/Stretches represented by g(x) = f(ax) Reflections represented by g(x) = f(-x)
71 P a g e 71 Independent Practice The students will be responsible to take home and do any problems not finished in class on the practice sheet. The next day in class we will go over the answers. Adaptations Some students work at a much slower pace than others. For these students, I will cut back the numbers of problems they must complete on the worksheet because there are several. The students groups are arranged by ability. This way, low-ability students can be assisted by higher-ability students. The high-ability students are then challenged by the necessity to become a pseudo-teacher to help their classmates learn, rather than just doing the work for them.
72 P a g e 72 Algebra Name 3.6 Transformations Exploration You will need: 1. A ruler or straight edge 2. 4 different colored pencils 3. Regular pencil EXPLORATION 1 Step 1: Graph the equation f(x) = x (Remember f(x) is another name for y) Step 2: Graph each of the following functions on the same coordinate plane above. Use a different color for each function. 1. g(x) = x g(x) = x 2 3. g(x) = x 4 4. g(x) = x + 4 Step 3: What patterns do you notice?
73 P a g e 73 EXPLORATION 2 Step 1: Graph the equation f(x) = x (Remember f(x) is another name for y) Step 2: Graph each of the following functions on the same coordinate plane above. Use a different color for each function. 1. h(x) = 1 x 2. h(x) =3x 3 3. h(x) = 1 x 4. h(x) = 3x 3 Step 3: What patterns do you notice?
 Step 3: Compare the function f(x) = x to the functions below. Explain how the graphs would be different.")
74 P a g e 74 EXPLORATION 3 Step 1: Match each function with the appropriate graph. Step 2: Compare each graph to the graph of f(x) = x. (use exploration 1 and 2 to help you) Step 3: Compare the function f(x) = x to the functions below. Explain how the graphs would be different. a) g(x) = f(x) + c b) h(x) = c f(x)
 = x. A transformation changes the size, shape, position, or orientation of a graph.")
75 P a g e 75 Algebra Notes 3.6 Linear Transformations The function f(x) = x can be called the parent function for all other linear functions. We can get any linear graph by doing a transformation on f(x) = x. A transformation changes the size, shape, position, or orientation of a graph. Translations A translation shifts a graph left, right, up, or down. For linear graphs, we will shift the line up or down. Start with: f(x) = x To move up or down: g(x) = f(x) + k We are adding k to the outputs of the function f(x) to move to g(x). Note: k is a number. If k > 0, the graph will shift up. If k < 0, the graph will shift down. Example 1: f(x) = 2x 1 g(x) = f(x) + 3 h(x) = f(x) 3 x f(x) g(x) h(x)

76 P a g e 76 Stretches and Shrinks Stretches and Shrinks are a transformation that changes how close a line is to the x or y axis. For linear graphs, a stretch or shrink can be thought of as making the line steeper or shallower. Start with: f(x) = x To Stretch or Shrink: g(x) = f(ax) We are multiplying x by a to change the slope Note: a is a number If a > 1 the graph will stretch up and become steeper If 0 < a < 1 the graph with shrink down and become shallower Example 2: f(x) = x + 2 g(x) = f(2x) h(x) = f ( 1 2 x) x f(x) g(x) h(x)
 = x To Reflect: g(x) = f(- x ) The graph will reflect over the y-axis. Example 3: Combining Transformations f (x) = x and g(x) = - 2 x + 3 Describe the transformation from the function f to g.")
77 P a g e 77 Reflection Start with: A reflection is a transformation that flips a graph over a line. For linear graphs, a reflection changes the sign of the slope. f(x) = x To Reflect: g(x) = f(- x ) The graph will reflect over the y-axis. Example 3: Combining Transformations f (x) = x and g(x) = - 2 x + 3 Describe the transformation from the function f to g. f(x) = 1 x + 4 g(x) = f (5x) -2 Describe the transformation from f to g. 3 Write in function notation the function g(x) which is a transformation of f (x) up 5 units and a shrink by a factor of 1 4
78 P a g e 78 Practice 3.6 Linear Transformations Describe the transformation from the first function to the second function. 1. f(x) = x 2. f(x) = x 3. f(x) = x + 1 g(x) = x 4 g(x) = 6x g(x) = - x f(x) = x 5. f(x) = 3x 6. f(x) = x g(x) = 1 x g(x) = - 3x 5 2 g(x) = 3 7. f(x) = 4x 8 8. f(x) = -2x 4 9. f(x) = 3 4 x + 2 g(x) = f(x) + 1 g(x) = f(2x) g(x) = f( 1 2 x) - 9 Write in function notation the function g(x) which is a transformation of f (x). 10. Shifts down 3 units and is a stretch by a factor of 12. g(x) = 11. A reflection and shrink by a factor of 2 3 g(x) = 12. Shifts up 6 units, is a reflection, and a stretch by a factor of 5. g(x) = 13. Shifts down 3 units and is a shrink by a factor of 4 5 g(x) =


79 Algebra Unit 3 Word Problems Practice P a g e 79

")

80 The table shows your earnings y (in dollars) for working x hours. P a g e 80


81 P a g e 81 Algebra Unit 3 Review Name Determine if each relation is a function: 1a. 2a. 3a. 4a. State the domain and range for each question above. 1b. D: 2b. D: R: R: 3b. D: 4b. D: R: R: Determine if the function is linear or non-linear
 = -1 Graph the following lines. 11. 4x 2y = 8 12.")
82 P a g e 82 Evaluate each function as directed. 8. For g(x) = {( 0, 2), (-2, 6), (8, 3), (3, 5), (1, -4)}, find g( -2 ) 9. Forf(x) = 2(x + 1) 3, find f ( 5 ) 10. The function h is graphed at the right Find x so that h(x) = -1 Graph the following lines x 2y = y = 3 4 x + 3 x-intercept: y-intercept: y-intercept: Slope:
 to g(x). 17.")
 in function notation that is a transformation of f(x) shifted down 1")
83 P a g e 83 Graph: 13. x = y = 3 Given the graph, list the slope and y-intercept Slope: Slope: int: Y-int: Y- Describe the transformation from f(x) to g(x). 17. f(x) = x g(x) = 4x f(x) = -2x + 3 g(x) = f(-x) Write the function g(x) in function notation that is a transformation of f(x) shifted down 1 unit, a shrink by a factor of 1, and a reflection. 4 g(x) =
84 P a g e 84 Unit Overview Monday Tuesday Wednesday Thursday Friday Unit 3 Pre- Assessment Unit 3 Intro to Functions Exploration and Flip Book 3 Finished Intro Exploration Function Sort 4 Begin 3.2 Notes Linear Functions 5 Wrapped up Linear Function Notes and Practice in class Notes Function Notation 7 Practice Function Notation 10 Began 3.4 Notes Graphing with intercepts 11 Finish 3.4 Notes 3.5a Slopes 12 Slope Intercept Exploration (3.5) Notes and Practice 14 Quiz Started Exploration Transformations 18 Finished 3.6 Practice 19 Word Problems Review 20 Unit 3 Test 21 Test analysis and wrap up Summative Assessment At the end of the unit, student will be assessed with a pencil and paper test that is modeled after the pre-test. The first part will have 3 questions per topic that we covered. The second part will have 2 application word problems. Rubric for Summative Assessment The point of the test is to assess the skills the students have developed over the course of the unit and how well they can apply those skills. Students will receive one point per question they answer correctly. There is a maximum of 3 points available per topic and a total of 31 points for the entire test. Students will be able to retake any portion of the test that they do not do well on.


")
")

85 P a g e 85 Algebra 1 Post Test Answers in Red NAME Key Unit 3: Linear Functions 1. Determine if each relation is a function: a) b) Yes Yes c) No 2. State the domain and range of each: a) b) D: {0, 1, 2, 3, 4} R: {-5, -3, -1, 1} D: {- 3 < x < 3} R: { -1 < y < 3} c) D: {-10, -8, -6} R: {2, 3, 5, 6, 8} 3. Determine if the given function is linear or nonlinear: a) b) Yes No c) 2(y 3) + 4 = 5x + 7 Yes
86 P a g e a) For g(x) = x+2, find g ( 10 ) 3 g(10) = 4 b) For h(x) = { ( -2, 4), (-1, 1), (0,0), (1,1), (2, 4) }, find h(1) h(1) = 1 c) The function f is graphed at the right Find x so that f(x) = 5 X = Use 2x + 3y = 6to answer a & b a) give the x- & y- intercepts for the linear equation x-intercept 3 y-intercept -2 b) using the intercepts, graph 2x + 3y = 6 c) graph y = 4
87 P a g e a) Identify the slope and y-intercept slope -1 y-intercept 4 b) graph w(x) = 3 x 1 c) graph y = 6x slope 3/5 y-intercept -1 slope -6 y-intercept 3 7. f(x) = 2x 5 g(x) = f( 3 x) + 1 h(x) = f( x) 3 4 a) describe the transformation from f(x) to g(x) shifts up 1 shrink by a factor of 3/4 b) describe the transformation from f(x) to h(x) shifts down 3 reflection c) write in function notation the function j(x) that is a transformation of f(x) shifted up 2 units and is a stretch by a factor of 6. j(x) = f(6x) + 2
 identify the slope and interpret its meaning 125, the mountain climber goes up 125 feet every hour b) find f(3) and interpret its meaning 425, in")
88 P a g e A mountain climber is scaling a 500 ft cliff. The graph shows the climbers elevation over time: a) identify the slope and interpret its meaning 125, the mountain climber goes up 125 feet every hour b) find f(3) and interpret its meaning 425, in 3 hours the mountain climber has reached 425 feet c) identify the y-intercept and interpret its meaning 50, the mountain climber starts climbing at 50 feet


89 P a g e 89 Algebra Test Answers in Red Name Unit 3 Part B 1. Answers will vary Possible answers: Your Claim: X = 1, 2, 3, 4 Friend s Claim: X = 1, 2, 3, 4 Y= -1, -2, -3, -4 Y = -2, 0, 1, 5 2. A = -4 B = 5-4x + 5y = 40
90 P a g e 90 Post Assessment Students were given a post-test to measure how much the students learned about the topics of the unit after we finished. I focused on three main objectives from the test and rated the students with a 1, 2, or 3 on these sections. 1 = none or very little understanding, 2 = limited understanding, and 3 = substantial understanding. After the test, if students are not happy with how they did on any portion of the test, they will be permitted to come after school and retake those portions on a new, similar test. Objective 1 Objective 2 Objective 3 (Test Questions 1 & 2) (Test Questions 4 & 8) (Test Questions 5 & 6) 0-2 examples = examples = examples = examples = examples = examples = examples = examples = examples = 3 Objective 1 HSF-IF.A.1 Understand that a function from one set (called the domain) to another set (called the range) assigns to each element of the domain exactly one element of the range. If f is a function and x is an element of its domain, then f(x) denotes the output of f corresponding to the input x. The graph of f is the graph of the equation y = f(x). Objective 2 HSF-IF.A.2 Use function notation, evaluate functions for inputs in their domains, and interpret statements that use function notation in terms of a context. Objective 3 HSF-IF.C.7a Graph linear and quadratic functions and show intercepts, maxima, and minima.
91 P a g e 91 Student Summary of Post-Assessment Information Student Number Objective 1 Objective 2 Objective
92 P a g e 92
93 P a g e 93 Group Analysis of Student Learning Objective/Outcome HSF-IF.A.1 Understand that a function from one set (called the domain) to another set (called the range) assigns to each element of the domain exactly one element of the range. If f is a function and x is an element of its domain, then f(x) denotes the output of f corresponding to the input x. The graph of f is the graph of the equation y = f(x). Assessment Strategy Summary of Results Students were given a paper and pencil test and this objective was assessed by questions 1 and 2. Each question had three parts and students had to identify if the relation was a function and the domain and range of given relations. A rating of 1 was given for 0-2 correct, 2 was given for 3-4 correct, and 3 was given for 5-6 correct. On the test, 9 students still receive a rating of 1, 27 students received a 2, and 21 students received a 3. Most students still in the 2 range were only short of a 3 by one question. Objective/Outcome Assessment Strategy Summary of Results HSF-IF.A.2 Use function notation, evaluate functions for inputs in their domains, and interpret statements that use function notation in terms of a context. Students were given a paper and pencil test and this objective was assessed by questions 4 and 8. Each question had three parts. Question 4 used function notation to evaluate for given values. Question 8 used function notation to model a real problem. Students had to evaluate and interpret meanings. A rating of 1 was given for 0-2 correct, 2 was given for 3-4 correct, and 3 was given for 5-6 correct. The data for this outcome were even across the board, 19 students received a 1, 19 students received a 2, and 19 students received a 3. The issue here was many students made silly mathematical errors and also forgot the interpretation portions of question 8. Objective/Outcome Assessment Strategy Summary of Results HSF-IF.C.7a Graph linear and quadratic functions and show intercepts, maxima, and minima. Students were given a paper and pencil test and this objective was assessed by questions 5 and 6. Each question had three parts. Both questions involved graphing and identifying the slope and intercepts of lines. A rating of 1 was given for 0-2 For this outcome, 14 students still received a 1, 22 students received a 2, and 21 students received a 3. Many students received partial credit for some of these problems, but it was

94 P a g e 94 correct, 2 was given for 3-4 correct, and 3 was given for 5-6 correct. not enough to bump them up to the next rating. Post Assessment Data Summary Number of Students who received each rating for each objective Rating Objective 1 Objective 2 Objective
Cal s Dinner Card Deals
 Cal s Dinner Card Deals Overview: In this lesson students compare three linear functions in the context of Dinner Card Deals. Students are required to interpret a graph for each Dinner Card Deal to help
Mathematics Success Level E
 T403 [OBJECTIVE] The student will generate two patterns given two rules and identify the relationship between corresponding terms, generate ordered pairs, and graph the ordered pairs on a coordinate plane.
Grade 2: Using a Number Line to Order and Compare Numbers Place Value Horizontal Content Strand
 Grade 2: Using a Number Line to Order and Compare Numbers Place Value Horizontal Content Strand Texas Essential Knowledge and Skills (TEKS): (2.1) Number, operation, and quantitative reasoning. The student
Characteristics of Functions
 Characteristics of Functions Unit: 01 Lesson: 01 Suggested Duration: 10 days Lesson Synopsis Students will collect and organize data using various representations. They will identify the characteristics
Statewide Framework Document for:
 Statewide Framework Document for: 270301 Standards may be added to this document prior to submission, but may not be removed from the framework to meet state credit equivalency requirements. Performance
AGS THE GREAT REVIEW GAME FOR PRE-ALGEBRA (CD) CORRELATED TO CALIFORNIA CONTENT STANDARDS
 CORRELATED TO CALIFORNIA CONTENT STANDARDS") AGS THE GREAT REVIEW GAME FOR PRE-ALGEBRA (CD) CORRELATED TO CALIFORNIA CONTENT STANDARDS 1 CALIFORNIA CONTENT STANDARDS: Chapter 1 ALGEBRA AND WHOLE NUMBERS Algebra and Functions 1.4 Students use algebraic
AGS THE GREAT REVIEW GAME FOR PRE-ALGEBRA (CD) CORRELATED TO CALIFORNIA CONTENT STANDARDS 1 CALIFORNIA CONTENT STANDARDS: Chapter 1 ALGEBRA AND WHOLE NUMBERS Algebra and Functions 1.4 Students use algebraic
Function Tables With The Magic Function Machine
 Brief Overview: Function Tables With The Magic Function Machine s will be able to complete a by applying a one operation rule, determine a rule based on the relationship between the input and output within
AP Statistics Summer Assignment 17-18
 AP Statistics Summer Assignment 17-18 Welcome to AP Statistics. This course will be unlike any other math class you have ever taken before! Before taking this course you will need to be competent in basic
Notetaking Directions
 Porter Notetaking Directions 1 Notetaking Directions Simplified Cornell-Bullet System Research indicates that hand writing notes is more beneficial to students learning than typing notes, unless there
2 nd grade Task 5 Half and Half
 2 nd grade Task 5 Half and Half Student Task Core Idea Number Properties Core Idea 4 Geometry and Measurement Draw and represent halves of geometric shapes. Describe how to know when a shape will show
Grade 6: Correlated to AGS Basic Math Skills
 Grade 6: Correlated to AGS Basic Math Skills Grade 6: Standard 1 Number Sense Students compare and order positive and negative integers, decimals, fractions, and mixed numbers. They find multiples and
Dublin City Schools Mathematics Graded Course of Study GRADE 4
 I. Content Standard: Number, Number Sense and Operations Standard Students demonstrate number sense, including an understanding of number systems and reasonable estimates using paper and pencil, technology-supported
Spinners at the School Carnival (Unequal Sections)
") Spinners at the School Carnival (Unequal Sections) Maryann E. Huey Drake University maryann.huey@drake.edu Published: February 2012 Overview of the Lesson Students are asked to predict the outcomes of
Spinners at the School Carnival (Unequal Sections) Maryann E. Huey Drake University maryann.huey@drake.edu Published: February 2012 Overview of the Lesson Students are asked to predict the outcomes of
Classroom Connections Examining the Intersection of the Standards for Mathematical Content and the Standards for Mathematical Practice
 Classroom Connections Examining the Intersection of the Standards for Mathematical Content and the Standards for Mathematical Practice Title: Considering Coordinate Geometry Common Core State Standards
TabletClass Math Geometry Course Guidebook
 TabletClass Math Geometry Course Guidebook Includes Final Exam/Key, Course Grade Calculation Worksheet and Course Certificate Student Name Parent Name School Name Date Started Course Date Completed Course
Case study Norway case 1
 Case study Norway case 1 School : B (primary school) Theme: Science microorganisms Dates of lessons: March 26-27 th 2015 Age of students: 10-11 (grade 5) Data sources: Pre- and post-interview with 1 teacher
Curriculum Design Project with Virtual Manipulatives. Gwenanne Salkind. George Mason University EDCI 856. Dr. Patricia Moyer-Packenham
 Curriculum Design Project with Virtual Manipulatives Gwenanne Salkind George Mason University EDCI 856 Dr. Patricia Moyer-Packenham Spring 2006 Curriculum Design Project with Virtual Manipulatives Table
Getting Started with TI-Nspire High School Science
 Getting Started with TI-Nspire High School Science 2012 Texas Instruments Incorporated Materials for Institute Participant * *This material is for the personal use of T3 instructors in delivering a T3
PHYSICS 40S - COURSE OUTLINE AND REQUIREMENTS Welcome to Physics 40S for !! Mr. Bryan Doiron
 PHYSICS 40S - COURSE OUTLINE AND REQUIREMENTS Welcome to Physics 40S for 2016-2017!! Mr. Bryan Doiron The course covers the following topics (time permitting): Unit 1 Kinematics: Special Equations, Relative
1.11 I Know What Do You Know?
 50 SECONDARY MATH 1 // MODULE 1 1.11 I Know What Do You Know? A Practice Understanding Task CC BY Jim Larrison https://flic.kr/p/9mp2c9 In each of the problems below I share some of the information that
If we want to measure the amount of cereal inside the box, what tool would we use: string, square tiles, or cubes?
 String, Tiles and Cubes: A Hands-On Approach to Understanding Perimeter, Area, and Volume Teaching Notes Teacher-led discussion: 1. Pre-Assessment: Show students the equipment that you have to measure
Pre-AP Geometry Course Syllabus Page 1
 Pre-AP Geometry Course Syllabus 2015-2016 Welcome to my Pre-AP Geometry class. I hope you find this course to be a positive experience and I am certain that you will learn a great deal during the next
The Evolution of Random Phenomena
 The Evolution of Random Phenomena A Look at Markov Chains Glen Wang glenw@uchicago.edu Splash! Chicago: Winter Cascade 2012 Lecture 1: What is Randomness? What is randomness? Can you think of some examples
Unit Lesson Plan: Native Americans 4th grade (SS and ELA)
") Unit Lesson Plan: Native Americans 4th grade (SS and ELA) Angie- comments in red Emily's comments in purple Sue's in orange Kasi Frenton-Comments in green-kas_122@hotmail.com 10/6/09 9:03 PM Unit Lesson
Unit Lesson Plan: Native Americans 4th grade (SS and ELA) Angie- comments in red Emily's comments in purple Sue's in orange Kasi Frenton-Comments in green-kas_122@hotmail.com 10/6/09 9:03 PM Unit Lesson
UNIT ONE Tools of Algebra
 UNIT ONE Tools of Algebra Subject: Algebra 1 Grade: 9 th 10 th Standards and Benchmarks: 1 a, b,e; 3 a, b; 4 a, b; Overview My Lessons are following the first unit from Prentice Hall Algebra 1 1. Students
Arizona s College and Career Ready Standards Mathematics
 Arizona s College and Career Ready Mathematics Mathematical Practices Explanations and Examples First Grade ARIZONA DEPARTMENT OF EDUCATION HIGH ACADEMIC STANDARDS FOR STUDENTS State Board Approved June
Foothill College Fall 2014 Math My Way Math 230/235 MTWThF 10:00-11:50 (click on Math My Way tab) Math My Way Instructors:
 Math My Way Instructors:") This is a team taught directed study course. Foothill College Fall 2014 Math My Way Math 230/235 MTWThF 10:00-11:50 www.psme.foothill.edu (click on Math My Way tab) Math My Way Instructors: Instructor:
This is a team taught directed study course. Foothill College Fall 2014 Math My Way Math 230/235 MTWThF 10:00-11:50 www.psme.foothill.edu (click on Math My Way tab) Math My Way Instructors: Instructor:
Mathematics process categories
 Mathematics process categories All of the UK curricula define multiple categories of mathematical proficiency that require students to be able to use and apply mathematics, beyond simple recall of facts
Contents. Foreword... 5
 Contents Foreword... 5 Chapter 1: Addition Within 0-10 Introduction... 6 Two Groups and a Total... 10 Learn Symbols + and =... 13 Addition Practice... 15 Which is More?... 17 Missing Items... 19 Sums with
Algebra 2- Semester 2 Review
 Name Block Date Algebra 2- Semester 2 Review Non-Calculator 5.4 1. Consider the function f x 1 x 2. a) Describe the transformation of the graph of y 1 x. b) Identify the asymptotes. c) What is the domain
Grades. From Your Friends at The MAILBOX
 From Your Friends at The MAILBOX Grades 5 6 TEC916 High-Interest Math Problems to Reinforce Your Curriculum Supports NCTM standards Strengthens problem-solving and basic math skills Reinforces key problem-solving
What's My Value? Using "Manipulatives" and Writing to Explain Place Value. by Amanda Donovan, 2016 CTI Fellow David Cox Road Elementary School
 What's My Value? Using "Manipulatives" and Writing to Explain Place Value by Amanda Donovan, 2016 CTI Fellow David Cox Road Elementary School This curriculum unit is recommended for: Second and Third Grade
Ohio s Learning Standards-Clear Learning Targets
 Ohio s Learning Standards-Clear Learning Targets Math Grade 1 Use addition and subtraction within 20 to solve word problems involving situations of 1.OA.1 adding to, taking from, putting together, taking
Math-U-See Correlation with the Common Core State Standards for Mathematical Content for Third Grade
 Math-U-See Correlation with the Common Core State Standards for Mathematical Content for Third Grade The third grade standards primarily address multiplication and division, which are covered in Math-U-See
Algebra 1, Quarter 3, Unit 3.1. Line of Best Fit. Overview
 Algebra 1, Quarter 3, Unit 3.1 Line of Best Fit Overview Number of instructional days 6 (1 day assessment) (1 day = 45 minutes) Content to be learned Analyze scatter plots and construct the line of best
Foothill College Summer 2016
 Foothill College Summer 2016 Intermediate Algebra Math 105.04W CRN# 10135 5.0 units Instructor: Yvette Butterworth Text: None; Beoga.net material used Hours: Online Except Final Thurs, 8/4 3:30pm Phone:
The Indices Investigations Teacher s Notes
 The Indices Investigations Teacher s Notes These activities are for students to use independently of the teacher to practise and develop number and algebra properties.. Number Framework domain and stage:
Evidence-based Practice: A Workshop for Training Adult Basic Education, TANF and One Stop Practitioners and Program Administrators
 Evidence-based Practice: A Workshop for Training Adult Basic Education, TANF and One Stop Practitioners and Program Administrators May 2007 Developed by Cristine Smith, Beth Bingman, Lennox McLendon and
P-4: Differentiate your plans to fit your students
 Putting It All Together: Middle School Examples 7 th Grade Math 7 th Grade Science SAM REHEARD, DC 99 7th Grade Math DIFFERENTATION AROUND THE WORLD My first teaching experience was actually not as a Teach
Teaching a Discussion Section
 Teaching a Discussion Section Sample Active Learning Techniques: Clarification Pauses: This simple technique fosters active listening. Throughout a lecture, pause to allow students time to think about
WHAT ARE VIRTUAL MANIPULATIVES?
 by SCOTT PIERSON AA, Community College of the Air Force, 1992 BS, Eastern Connecticut State University, 2010 A VIRTUAL MANIPULATIVES PROJECT SUBMITTED IN PARTIAL FULFILLMENT OF THE REQUIREMENTS FOR TECHNOLOGY
Measurement. When Smaller Is Better. Activity:
 Measurement Activity: TEKS: When Smaller Is Better (6.8) Measurement. The student solves application problems involving estimation and measurement of length, area, time, temperature, volume, weight, and
Mathematics Assessment Plan
 Mathematics Assessment Plan Mission Statement for Academic Unit: Georgia Perimeter College transforms the lives of our students to thrive in a global society. As a diverse, multi campus two year college,
Mathematics Success Grade 7
 T894 Mathematics Success Grade 7 [OBJECTIVE] The student will find probabilities of compound events using organized lists, tables, tree diagrams, and simulations. [PREREQUISITE SKILLS] Simple probability,
Why Misquitoes Buzz in People s Ears (Part 1 of 3)
") Name: Melissa DiVincenzo Date: 10/25/01 Content Area: Reading/Writing Unit Topic: Folktales Today s Lesson: Summarizing Grade Level: 2 nd Why Misquitoes Buzz in People s Ears (Part 1 of 3) Duration: 1
Name: Melissa DiVincenzo Date: 10/25/01 Content Area: Reading/Writing Unit Topic: Folktales Today s Lesson: Summarizing Grade Level: 2 nd Why Misquitoes Buzz in People s Ears (Part 1 of 3) Duration: 1
Extending Place Value with Whole Numbers to 1,000,000
 Grade 4 Mathematics, Quarter 1, Unit 1.1 Extending Place Value with Whole Numbers to 1,000,000 Overview Number of Instructional Days: 10 (1 day = 45 minutes) Content to Be Learned Recognize that a digit
GCSE Mathematics B (Linear) Mark Scheme for November Component J567/04: Mathematics Paper 4 (Higher) General Certificate of Secondary Education
 Mark Scheme for November Component J567/04: Mathematics Paper 4 (Higher) General Certificate of Secondary Education") GCSE Mathematics B (Linear) Component J567/04: Mathematics Paper 4 (Higher) General Certificate of Secondary Education Mark Scheme for November 2014 Oxford Cambridge and RSA Examinations OCR (Oxford Cambridge
GCSE Mathematics B (Linear) Component J567/04: Mathematics Paper 4 (Higher) General Certificate of Secondary Education Mark Scheme for November 2014 Oxford Cambridge and RSA Examinations OCR (Oxford Cambridge
Edexcel GCSE. Statistics 1389 Paper 1H. June Mark Scheme. Statistics Edexcel GCSE
 Edexcel GCSE Statistics 1389 Paper 1H June 2007 Mark Scheme Edexcel GCSE Statistics 1389 NOTES ON MARKING PRINCIPLES 1 Types of mark M marks: method marks A marks: accuracy marks B marks: unconditional
Lesson Plan. Preliminary Planning
 Lesson Plan Date: 01.20.15 Subject: Social Studies Grade Level: 7th Time Needed: 20 Mins. Preliminary Planning Topic/Central Focus: Examining the history and significance of the Day of the Dead Mexican
Page 1 of 11. Curriculum Map: Grade 4 Math Course: Math 4 Sub-topic: General. Grade(s): None specified
: None specified") Curriculum Map: Grade 4 Math Course: Math 4 Sub-topic: General Grade(s): None specified Unit: Creating a Community of Mathematical Thinkers Timeline: Week 1 The purpose of the Establishing a Community
Curriculum Map: Grade 4 Math Course: Math 4 Sub-topic: General Grade(s): None specified Unit: Creating a Community of Mathematical Thinkers Timeline: Week 1 The purpose of the Establishing a Community
*Lesson will begin on Friday; Stations will begin on the following Wednesday*
 UDL Lesson Plan Template Instructor: Josh Karr Learning Domain: Algebra II/Geometry Grade: 10 th Lesson Objective/s: Students will learn to apply the concepts of transformations to an algebraic context
Mathematics subject curriculum
 Mathematics subject curriculum Dette er ei omsetjing av den fastsette læreplanteksten. Læreplanen er fastsett på Nynorsk Established as a Regulation by the Ministry of Education and Research on 24 June
South Carolina College- and Career-Ready Standards for Mathematics. Standards Unpacking Documents Grade 5
 South Carolina College- and Career-Ready Standards for Mathematics Standards Unpacking Documents Grade 5 South Carolina College- and Career-Ready Standards for Mathematics Standards Unpacking Documents
LESSON PLANS: AUSTRALIA Year 6: Patterns and Algebra Patterns 50 MINS 10 MINS. Introduction to Lesson. powered by
 Year 6: Patterns and Algebra Patterns 50 MINS Strand: Number and Algebra Substrand: Patterns and Algebra Outcome: Continue and create sequences involving whole numbers, fractions and decimals. Describe
Exploring Derivative Functions using HP Prime
 Exploring Derivative Functions using HP Prime Betty Voon Wan Niu betty@uniten.edu.my College of Engineering Universiti Tenaga Nasional Malaysia Wong Ling Shing Faculty of Health and Life Sciences, INTI
GUIDE TO THE CUNY ASSESSMENT TESTS
 GUIDE TO THE CUNY ASSESSMENT TESTS IN MATHEMATICS Rev. 117.016110 Contents Welcome... 1 Contact Information...1 Programs Administered by the Office of Testing and Evaluation... 1 CUNY Skills Assessment:...1
Backwards Numbers: A Study of Place Value. Catherine Perez
 Backwards Numbers: A Study of Place Value Catherine Perez Introduction I was reaching for my daily math sheet that my school has elected to use and in big bold letters in a box it said: TO ADD NUMBERS
Number Line Moves Dash -- 1st Grade. Michelle Eckstein
 Number Line Moves Dash -- 1st Grade Michelle Eckstein Common Core Standards CCSS.MATH.CONTENT.1.NBT.C.4 Add within 100, including adding a two-digit number and a one-digit number, and adding a two-digit
Montana Content Standards for Mathematics Grade 3. Montana Content Standards for Mathematical Practices and Mathematics Content Adopted November 2011
 Montana Content Standards for Mathematics Grade 3 Montana Content Standards for Mathematical Practices and Mathematics Content Adopted November 2011 Contents Standards for Mathematical Practice: Grade
Evaluating Statements About Probability
 CONCEPT DEVELOPMENT Mathematics Assessment Project CLASSROOM CHALLENGES A Formative Assessment Lesson Evaluating Statements About Probability Mathematics Assessment Resource Service University of Nottingham
UDL AND LANGUAGE ARTS LESSON OVERVIEW
 UDL AND LANGUAGE ARTS LESSON OVERVIEW Title: Reading Comprehension Author: Carol Sue Englert Subject: Language Arts Grade Level 3 rd grade Duration 60 minutes Unit Description Focusing on the students
Problem of the Month: Movin n Groovin
 : The Problems of the Month (POM) are used in a variety of ways to promote problem solving and to foster the first standard of mathematical practice from the Common Core State Standards: Make sense of
TOPICS LEARNING OUTCOMES ACTIVITES ASSESSMENT Numbers and the number system
 Curriculum Overview Mathematics 1 st term 5º grade - 2010 TOPICS LEARNING OUTCOMES ACTIVITES ASSESSMENT Numbers and the number system Multiplies and divides decimals by 10 or 100. Multiplies and divide
Calculators in a Middle School Mathematics Classroom: Helpful or Harmful?
 University of Nebraska - Lincoln DigitalCommons@University of Nebraska - Lincoln Action Research Projects Math in the Middle Institute Partnership 7-2008 Calculators in a Middle School Mathematics Classroom:
Rover Races Grades: 3-5 Prep Time: ~45 Minutes Lesson Time: ~105 minutes
 Rover Races Grades: 3-5 Prep Time: ~45 Minutes Lesson Time: ~105 minutes WHAT STUDENTS DO: Establishing Communication Procedures Following Curiosity on Mars often means roving to places with interesting
Focus of the Unit: Much of this unit focuses on extending previous skills of multiplication and division to multi-digit whole numbers.
 Approximate Time Frame: 3-4 weeks Connections to Previous Learning: In fourth grade, students fluently multiply (4-digit by 1-digit, 2-digit by 2-digit) and divide (4-digit by 1-digit) using strategies
How to make an A in Physics 101/102. Submitted by students who earned an A in PHYS 101 and PHYS 102.
 How to make an A in Physics 101/102. Submitted by students who earned an A in PHYS 101 and PHYS 102. PHYS 102 (Spring 2015) Don t just study the material the day before the test know the material well
Kindergarten - Unit One - Connecting Themes
 The following instructional plan is part of a GaDOE collection of Unit Frameworks, Performance Tasks, examples of Student Work, and Teacher Commentary for the Kindergarten Social Studies Course. Kindergarten
Learning to Think Mathematically With the Rekenrek
 Learning to Think Mathematically With the Rekenrek A Resource for Teachers A Tool for Young Children Adapted from the work of Jeff Frykholm Overview Rekenrek, a simple, but powerful, manipulative to help
Lesson #1: Mapping the Nation s Capitol Name: Sarah Faszewski Cooperating Teacher: Dormire School: Magruder Elementary Audience: Primary (1st Grade)
") Lesson #1: Mapping the Nation s Capitol Name: Sarah Faszewski Cooperating Teacher: Dormire School: Magruder Elementary Audience: Primary (1st Grade) Standards: History and Social Science Standards of Learning
Lesson #1: Mapping the Nation s Capitol Name: Sarah Faszewski Cooperating Teacher: Dormire School: Magruder Elementary Audience: Primary (1st Grade) Standards: History and Social Science Standards of Learning
Sight Word Assessment
 Make, Take & Teach Sight Word Assessment Assessment and Progress Monitoring for the Dolch 220 Sight Words What are sight words? Sight words are words that are used frequently in reading and writing. Because
preassessment was administered)
") 5 th grade Math Friday, 3/19/10 Integers and Absolute value (Lesson taught during the same period that the integer preassessment was administered) What students should know and be able to do at the end
5 th grade Math Friday, 3/19/10 Integers and Absolute value (Lesson taught during the same period that the integer preassessment was administered) What students should know and be able to do at the end
Standard 1: Number and Computation
 Standard 1: Number and Computation Standard 1: Number and Computation The student uses numerical and computational concepts and procedures in a variety of situations. Benchmark 1: Number Sense The student
Improving Conceptual Understanding of Physics with Technology
 INTRODUCTION Improving Conceptual Understanding of Physics with Technology Heidi Jackman Research Experience for Undergraduates, 1999 Michigan State University Advisors: Edwin Kashy and Michael Thoennessen
SMARTboard: The SMART Way To Engage Students
 SMARTboard: The SMART Way To Engage Students Emily Goettler 2nd Grade Gray s Woods Elementary School State College Area School District esg5016@psu.edu Penn State Professional Development School Intern
Kindergarten Lessons for Unit 7: On The Move Me on the Map By Joan Sweeney
 Kindergarten Lessons for Unit 7: On The Move Me on the Map By Joan Sweeney Aligned with the Common Core State Standards in Reading, Speaking & Listening, and Language Written & Prepared for: Baltimore
Are You Ready? Simplify Fractions
 SKILL 10 Simplify Fractions Teaching Skill 10 Objective Write a fraction in simplest form. Review the definition of simplest form with students. Ask: Is 3 written in simplest form? Why 7 or why not? (Yes,
Digital Fabrication and Aunt Sarah: Enabling Quadratic Explorations via Technology. Michael L. Connell University of Houston - Downtown
 Digital Fabrication and Aunt Sarah: Enabling Quadratic Explorations via Technology Michael L. Connell University of Houston - Downtown Sergei Abramovich State University of New York at Potsdam Introduction
Mathematics. Mathematics
 Mathematics Program Description Successful completion of this major will assure competence in mathematics through differential and integral calculus, providing an adequate background for employment in
Airplane Rescue: Social Studies. LEGO, the LEGO logo, and WEDO are trademarks of the LEGO Group The LEGO Group.
 Airplane Rescue: Social Studies LEGO, the LEGO logo, and WEDO are trademarks of the LEGO Group. 2010 The LEGO Group. Lesson Overview The students will discuss ways that people use land and their physical
SAT MATH PREP:
 SAT MATH PREP: 2015-2016 NOTE: The College Board has redesigned the SAT Test. This new test will start in March of 2016. Also, the PSAT test given in October of 2015 will have the new format. Therefore
SURVIVING ON MARS WITH GEOGEBRA
 SURVIVING ON MARS WITH GEOGEBRA Lindsey States and Jenna Odom Miami University, OH Abstract: In this paper, the authors describe an interdisciplinary lesson focused on determining how long an astronaut
Stacks Teacher notes. Activity description. Suitability. Time. AMP resources. Equipment. Key mathematical language. Key processes
 Stacks Teacher notes Activity description (Interactive not shown on this sheet.) Pupils start by exploring the patterns generated by moving counters between two stacks according to a fixed rule, doubling
 Math 150 Syllabus Course title and number MATH 150 Term Fall 2017 Class time and location INSTRUCTOR INFORMATION Name Erin K. Fry Phone number Department of Mathematics: 845-3261 e-mail address erinfry@tamu.edu
MAT 122 Intermediate Algebra Syllabus Summer 2016
 Instructor: Gary Adams Office: None (I am adjunct faculty) Phone: None Email: gary.adams@scottsdalecc.edu Office Hours: None CLASS TIME and LOCATION: Title Section Days Time Location Campus MAT122 12562
Functional Skills Mathematics Level 2 assessment
 Functional Skills Mathematics Level 2 assessment www.cityandguilds.com September 2015 Version 1.0 Marking scheme ONLINE V2 Level 2 Sample Paper 4 Mark Represent Analyse Interpret Open Fixed S1Q1 3 3 0
Me on the Map. Standards: Objectives: Learning Activities:
 Me on the Map Grade level: 1 st Grade Subject(s) Area: Reading, Writing, and Social Studies Materials needed: One sheet of construction paper per child, yarn or string, crayons or colored pencils, pencils,
Common Core Standards Alignment Chart Grade 5
 Common Core Standards Alignment Chart Grade 5 Units 5.OA.1 5.OA.2 5.OA.3 5.NBT.1 5.NBT.2 5.NBT.3 5.NBT.4 5.NBT.5 5.NBT.6 5.NBT.7 5.NF.1 5.NF.2 5.NF.3 5.NF.4 5.NF.5 5.NF.6 5.NF.7 5.MD.1 5.MD.2 5.MD.3 5.MD.4
Sample Problems for MATH 5001, University of Georgia
 Sample Problems for MATH 5001, University of Georgia 1 Give three different decimals that the bundled toothpicks in Figure 1 could represent In each case, explain why the bundled toothpicks can represent
Common Core State Standards
 Common Core State Standards Common Core State Standards 7.NS.3 Solve real-world and mathematical problems involving the four operations with rational numbers. Mathematical Practices 1, 3, and 4 are aspects
Activities for School
 Activities for School Label the School Label the school in the target language and then do a hide-n-seek activity using the directions in the target language. Label the Classroom I label my room (these
Teaching a Laboratory Section
 Chapter 3 Teaching a Laboratory Section Page I. Cooperative Problem Solving Labs in Operation 57 II. Grading the Labs 75 III. Overview of Teaching a Lab Session 79 IV. Outline for Teaching a Lab Session
Some Basic Active Learning Strategies
 Some Basic Active Learning Strategies Engaging students in individual or small group activities pairs or trios especially is a low-risk strategy that ensures the participation of all. The sampling of basic
Office Hours: Mon & Fri 10:00-12:00. Course Description
 1 State University of New York at Buffalo INTRODUCTION TO STATISTICS PSC 408 4 credits (3 credits lecture, 1 credit lab) Fall 2016 M/W/F 1:00-1:50 O Brian 112 Lecture Dr. Michelle Benson mbenson2@buffalo.edu
Paper Reference. Edexcel GCSE Mathematics (Linear) 1380 Paper 1 (Non-Calculator) Foundation Tier. Monday 6 June 2011 Afternoon Time: 1 hour 30 minutes
 1380 Paper 1 (Non-Calculator) Foundation Tier. Monday 6 June 2011 Afternoon Time: 1 hour 30 minutes") Centre No. Candidate No. Paper Reference 1 3 8 0 1 F Paper Reference(s) 1380/1F Edexcel GCSE Mathematics (Linear) 1380 Paper 1 (Non-Calculator) Foundation Tier Monday 6 June 2011 Afternoon Time: 1 hour
Centre No. Candidate No. Paper Reference 1 3 8 0 1 F Paper Reference(s) 1380/1F Edexcel GCSE Mathematics (Linear) 1380 Paper 1 (Non-Calculator) Foundation Tier Monday 6 June 2011 Afternoon Time: 1 hour
Instructor: Matthew Wickes Kilgore Office: ES 310
 MATH 1314 College Algebra Syllabus Instructor: Matthew Wickes Kilgore Office: ES 310 Longview Office: LN 205C Email: mwickes@kilgore.edu Phone: 903 988-7455 Prerequistes: Placement test score on TSI or
Leader s Guide: Dream Big and Plan for Success
 Leader s Guide: Dream Big and Plan for Success The goal of this lesson is to: Provide a process for Managers to reflect on their dream and put it in terms of business goals with a plan of action and weekly
Honors Mathematics. Introduction and Definition of Honors Mathematics
 Honors Mathematics Introduction and Definition of Honors Mathematics Honors Mathematics courses are intended to be more challenging than standard courses and provide multiple opportunities for students
PREP S SPEAKER LISTENER TECHNIQUE COACHING MANUAL
 1 PREP S SPEAKER LISTENER TECHNIQUE COACHING MANUAL IMPORTANCE OF THE SPEAKER LISTENER TECHNIQUE The Speaker Listener Technique (SLT) is a structured communication strategy that promotes clarity, understanding,