El-Shorouk Academy Acad. Year : 2013 / Higher Institute for Computer & Statistics & Probabilities. Section # 1
|
|
|
- Giles Ryan
- 5 years ago
- Views:
Transcription


1 El-Shorouk Academy Acad. Year : 2013 / 2014 Higher Institute for Computer & Information Technology Term : Second Year : Second Department of Computer Science Statistics Two Meanings Specific number Statistics & Probabilities Section # 1 - Numerical measurement determined by a set of data. Example: Twenty-three percent of people polled believed that there are too many polls. Method of analysis - A collection of methods for planning experiments, obtaining data, and then organizing, summarizing, presenting, analyzing, interpreting, and drawing conclusions based on the data. Ta.M.3ed Statistics & Probabilities (Section (1)) Page 1 of 13
2 Definitions Population - The complete collection of all elements (scores, people, measurements, and so on) to be studied. The collection is complete in the sense that it includes all subjects to be studied. Finite population: We can count the elements of the population. Infinite population: We cannot count the elements of the population Census Sample - The collection of data from every element in a population Parameter - A sub-collection of elements drawn from a population Statistic - A numerical measurement describing some characteristic of a population - A numerical measurement describing some characteristic of a sample Types of data Data can be classified into: Quantitative data - Numbers representing counts or measurements Example: the incomes of college graduates Ta.M.3ed Statistics & Probabilities (Section (1)) Page 2 of 13
3 OR Qualitative (or categorical or attribute) data - Can be separated into different categories that are distinguished by some nonnumeric characteristics Example: the genders (male/female) of college graduates Discrete - Data result when the number of possible values is either a finite number or a countable number of possible values 0, 1, 2, 3,... Example: The number of eggs that hens lay; for example, 3 eggs a day. Continuous - (Numerical) data result from infinitely many possible values that correspond to some continuous scale that covers a range of values without gaps, interruptions, or jumps Example: The amounts of milk that cows produce; for example, gallons a day. Levels of measurement nominal level of measurement (categories only) - Characterized by data that consist of names, labels, or categories only. The data cannot be arranged in an ordering scheme (such as low to high) Example: survey responses yes, no, undecided ordinal level of measurement (categories with some order) - Involves data that may be arranged in some order, but differences between data values either cannot be determined or are meaningless Example: Course grades A, B, C, D, or F Ta.M.3ed Statistics & Probabilities (Section (1)) Page 3 of 13
 Example: Years 1000, 2000, 1776, and 1492 ratio level of measurement (differences and a natural starting")

4 interval level of measurement (differences but no natural starting point) - Like the ordinal level, with the additional property that the difference between any two data values is meaningful. However, there is no natural zero starting point (where none of the quantity is present) Example: Years 1000, 2000, 1776, and 1492 ratio level of measurement (differences and a natural starting point) - The interval level modified to include the natural zero starting point (where zero indicates that none of the quantity is present). For values at this level, differences and ratios are meaningful. Example: Prices of college textbooks Methods of Sampling Random Sampling - Selection so that each has an equal chance of being selected Systematic Sampling - Select some starting point and then select every K th element in the population Ta.M.3ed Statistics & Probabilities (Section (1)) Page 4 of 13


5 Convenience Sampling - Use results that are readily available Stratified Sampling - Subdivide the population into subgroups that share the same characteristic, then draw a sample from each stratum Ta.M.3ed Statistics & Probabilities (Section (1)) Page 5 of 13


6 Cluster Sampling - Divide the population into sections (or clusters); randomly select some of those clusters; choose all members from selected clusters Definitions Sampling Error - The difference between a sample result and the true population result; such an error results from chance sample fluctuations. Non-sampling Error - Sample data that are incorrectly collected, recorded, or analyzed (such as by selecting a biased sample, using a defective instrument, or copying the data incorrectly). Ta.M.3ed Statistics & Probabilities (Section (1)) Page 6 of 13


7 Tabulating and Graphing Data Firstly: Categorical Data Ta.M.3ed Statistics & Probabilities (Section (1)) Page 7 of 13
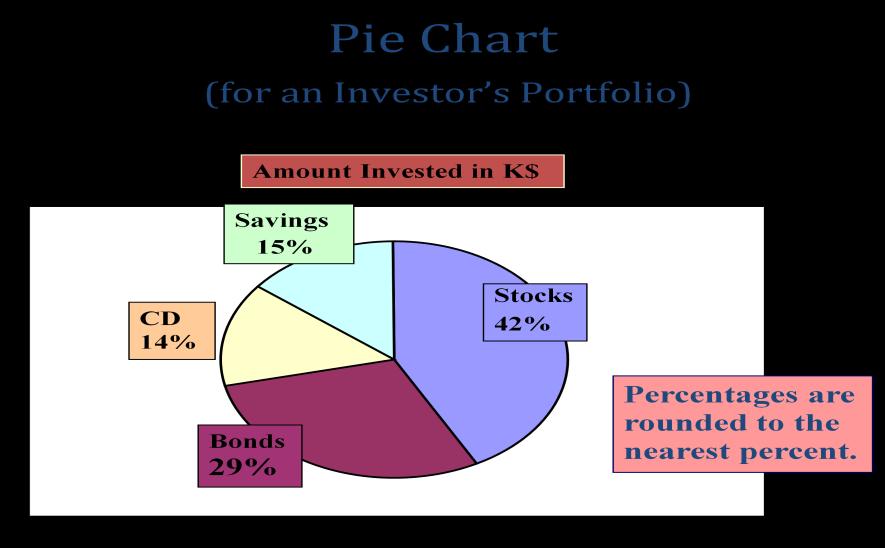

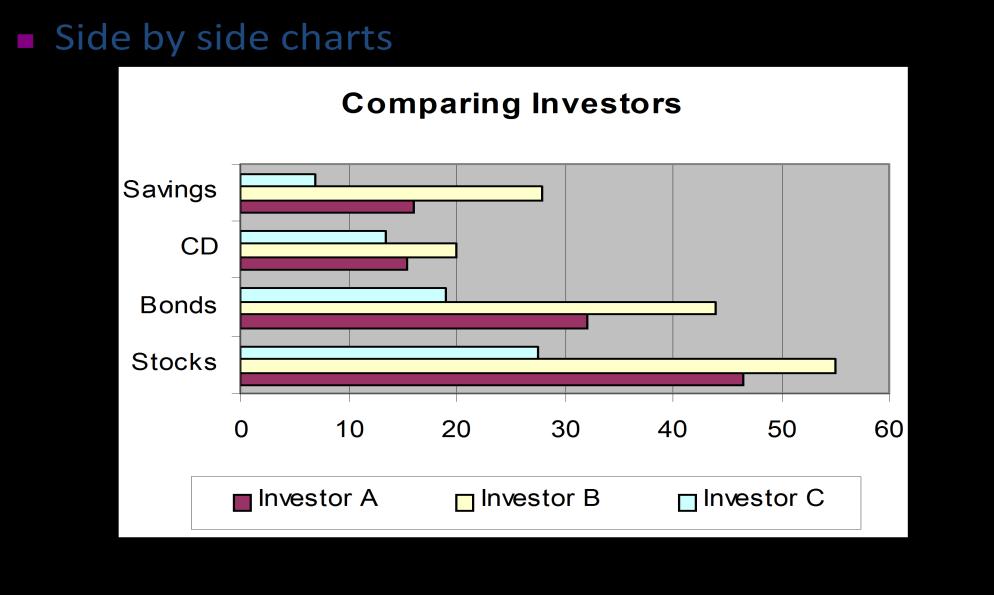

8 Ta.M.3ed Statistics & Probabilities (Section (1)) Page 8 of 13
9 Secondly: Numerical Data Tabulating Numerical Data: Frequency Distributions Sort raw data in ascending order: 12, 13, 17, 21, 24, 24, 26, 27, 27, 30, 32, 35, 37, 38, 41, 43, 44, 46, 53, 58 Find range: = 46 Select number of classes: 5 (usually between 5 and 15) Compute class interval (width): 10 (46/5 then round up) Determine class boundaries (limits): 10, 20, 30, 40, 50, 60 Compute class midpoints: 15, 25, 35, 45, 55 Count observations & assign to classes Frequency Table Class Frequency Relative Frequency Percentage 10 but under but under but under but under but under Total Ta.M.3ed Statistics & Probabilities (Section (1)) Page 9 of 13

10 Cumulative Frequency Class Frequency Cumulative Frequency Cumulative %Frequency 10 but under but under but under but under but under Total 20 Graphing Numerical Data Ta.M.3ed Statistics & Probabilities (Section (1)) Page 10 of 13


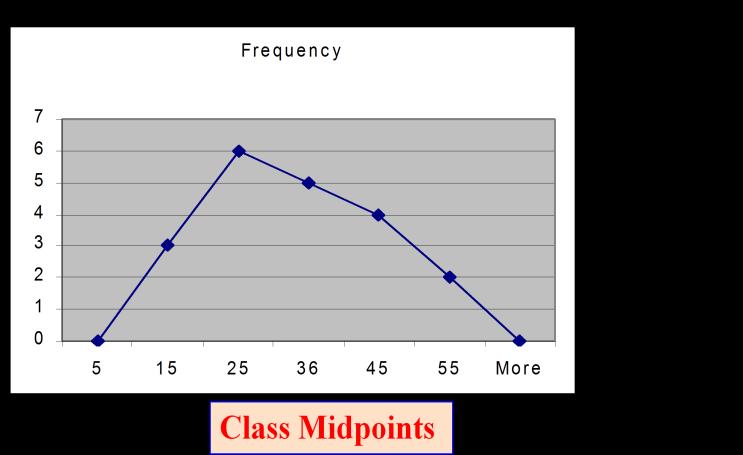
11 Frequency Histogram Frequency Polygon Ta.M.3ed Statistics & Probabilities (Section (1)) Page 11 of 13
 3.")

12 O-give Dot Plot Box Plots 5 - number summary: 1. Minimum 2. first quartile (Q 1 ) 3. Median (Q 2 ) 4. third quartile (Q 3 ) 5. Maximum Ta.M.3ed Statistics & Probabilities (Section (1)) Page 12 of 13
13 Total Year to Date Return (%) Graphing Bivariate Numerical Data (Scatter Plot) Mutual Funds Scatter Plot Net Asset Values Reference These sections based on: - Triola, ELEMENTARY STATISTICS, Eighth Edition. Copyright Addison Wesley Longman. Ta.M.3ed Statistics & Probabilities (Section (1)) Page 13 of 13
Probability and Statistics Curriculum Pacing Guide
 Unit 1 Terms PS.SPMJ.3 PS.SPMJ.5 Plan and conduct a survey to answer a statistical question. Recognize how the plan addresses sampling technique, randomization, measurement of experimental error and methods
STA 225: Introductory Statistics (CT)
") Marshall University College of Science Mathematics Department STA 225: Introductory Statistics (CT) Course catalog description A critical thinking course in applied statistical reasoning covering basic
Marshall University College of Science Mathematics Department STA 225: Introductory Statistics (CT) Course catalog description A critical thinking course in applied statistical reasoning covering basic
AP Statistics Summer Assignment 17-18
 AP Statistics Summer Assignment 17-18 Welcome to AP Statistics. This course will be unlike any other math class you have ever taken before! Before taking this course you will need to be competent in basic
Measures of the Location of the Data
 OpenStax-CNX module m46930 1 Measures of the Location of the Data OpenStax College This work is produced by OpenStax-CNX and licensed under the Creative Commons Attribution License 3.0 The common measures
Lesson M4. page 1 of 2
 Lesson M4 page 1 of 2 Miniature Gulf Coast Project Math TEKS Objectives 111.22 6b.1 (A) apply mathematics to problems arising in everyday life, society, and the workplace; 6b.1 (C) select tools, including
Introduction to the Practice of Statistics
 Chapter 1: Looking at Data Distributions Introduction to the Practice of Statistics Sixth Edition David S. Moore George P. McCabe Bruce A. Craig Statistics is the science of collecting, organizing and
Quantitative Research Questionnaire
 Quantitative Research Questionnaire Surveys are used in practically all walks of life. Whether it is deciding what is for dinner or determining which Hollywood film will be produced next, questionnaires
Chapters 1-5 Cumulative Assessment AP Statistics November 2008 Gillespie, Block 4
 Chapters 1-5 Cumulative Assessment AP Statistics Name: November 2008 Gillespie, Block 4 Part I: Multiple Choice This portion of the test will determine 60% of your overall test grade. Each question is
Simple Random Sample (SRS) & Voluntary Response Sample: Examples: A Voluntary Response Sample: Examples: Systematic Sample Best Used When
 & Voluntary Response Sample: Examples: A Voluntary Response Sample: Examples: Systematic Sample Best Used When") Simple Random Sample (SRS) & Voluntary Response Sample: In statistics, a simple random sample is a group of people who have been chosen at random from the general population. A simple random sample is
Simple Random Sample (SRS) & Voluntary Response Sample: In statistics, a simple random sample is a group of people who have been chosen at random from the general population. A simple random sample is
MULTIPLE CHOICE. Choose the one alternative that best completes the statement or answers the question.
 Ch 2 Test Remediation Work Name MULTIPLE CHOICE. Choose the one alternative that best completes the statement or answers the question. Provide an appropriate response. 1) High temperatures in a certain
Research Design & Analysis Made Easy! Brainstorming Worksheet
 Brainstorming Worksheet 1) Choose a Topic a) What are you passionate about? b) What are your library s strengths? c) What are your library s weaknesses? d) What is a hot topic in the field right now that
Functional Maths Skills Check E3/L x
 Functional Maths Skills Check E3/L1 Name: Date started: The Four Rules of Number + - x May 2017. Kindly contributed by Nicola Smith, Gloucestershire College. Search for Nicola on skillsworkshop.org Page
Broward County Public Schools G rade 6 FSA Warm-Ups
 Day 1 1. A florist has 40 tulips, 32 roses, 60 daises, and 50 petunias. Draw a line from each comparison to match it to the correct ratio. A. tulips to roses B. daises to petunias C. roses to tulips D.
Shockwheat. Statistics 1, Activity 1
 Statistics 1, Activity 1 Shockwheat Students require real experiences with situations involving data and with situations involving chance. They will best learn about these concepts on an intuitive or informal
Grade 6: Correlated to AGS Basic Math Skills
 Grade 6: Correlated to AGS Basic Math Skills Grade 6: Standard 1 Number Sense Students compare and order positive and negative integers, decimals, fractions, and mixed numbers. They find multiples and
Algebra 1, Quarter 3, Unit 3.1. Line of Best Fit. Overview
 Algebra 1, Quarter 3, Unit 3.1 Line of Best Fit Overview Number of instructional days 6 (1 day assessment) (1 day = 45 minutes) Content to be learned Analyze scatter plots and construct the line of best
Edexcel GCSE. Statistics 1389 Paper 1H. June Mark Scheme. Statistics Edexcel GCSE
 Edexcel GCSE Statistics 1389 Paper 1H June 2007 Mark Scheme Edexcel GCSE Statistics 1389 NOTES ON MARKING PRINCIPLES 1 Types of mark M marks: method marks A marks: accuracy marks B marks: unconditional
The lab is designed to remind you how to work with scientific data (including dealing with uncertainty) and to review experimental design.
 and to review experimental design.") Name: Partner(s): Lab #1 The Scientific Method Due 6/25 Objective The lab is designed to remind you how to work with scientific data (including dealing with uncertainty) and to review experimental design.
Name: Partner(s): Lab #1 The Scientific Method Due 6/25 Objective The lab is designed to remind you how to work with scientific data (including dealing with uncertainty) and to review experimental design.
Mathacle PSet Stats, Concepts in Statistics and Probability Level Number Name: Date:
 1 st Quarterly Exam ~ Sampling, Designs, Exploring Data and Regression Part 1 Review I. SAMPLING MC I-1.) [APSTATSMC2014-6M] Approximately 52 percent of all recent births were boys. In a simple random
University of Waterloo School of Accountancy. AFM 102: Introductory Management Accounting. Fall Term 2004: Section 4
 University of Waterloo School of Accountancy AFM 102: Introductory Management Accounting Fall Term 2004: Section 4 Instructor: Alan Webb Office: HH 289A / BFG 2120 B (after October 1) Phone: 888-4567 ext.
Introducing the New Iowa Assessments Mathematics Levels 12 14
 Introducing the New Iowa Assessments Mathematics Levels 12 14 ITP Assessment Tools Math Interim Assessments: Grades 3 8 Administered online Constructed Response Supplements Reading, Language Arts, Mathematics
Math 121 Fundamentals of Mathematics I
 I. Course Description: Math 121 Fundamentals of Mathematics I Math 121 is a general course in the fundamentals of mathematics. It includes a study of concepts of numbers and fundamental operations with
Interpreting ACER Test Results
 Interpreting ACER Test Results This document briefly explains the different reports provided by the online ACER Progressive Achievement Tests (PAT). More detailed information can be found in the relevant
Statewide Framework Document for:
 Statewide Framework Document for: 270301 Standards may be added to this document prior to submission, but may not be removed from the framework to meet state credit equivalency requirements. Performance
The Editor s Corner. The. Articles. Workshops. Editor. Associate Editors. Also In This Issue
 The S tatistics T eacher N etwork www.amstat.org/education/stn Number 73 ASA/NCTM Joint Committee on the Curriculum in Statistics and Probability Fall 2008 The Editor s Corner We hope you enjoy Issue 73
Statistics and Probability Standards in the CCSS- M Grades 6- HS
 Statistics and Probability Standards in the CCSS- M Grades 6- HS Grade 6 Develop understanding of statistical variability. -6.SP.A.1 Recognize a statistical question as one that anticipates variability
Student s Edition. Grade 6 Unit 6. Statistics. Eureka Math. Eureka Math
 Student s Edition Grade 6 Unit 6 Statistics Eureka Math Eureka Math Lesson 1 Lesson 1: Posing Statistical Questions Statistics is about using data to answer questions. In this module, the following four
Numeracy Medium term plan: Summer Term Level 2C/2B Year 2 Level 2A/3C
 Numeracy Medium term plan: Summer Term Level 2C/2B Year 2 Level 2A/3C Using and applying mathematics objectives (Problem solving, Communicating and Reasoning) Select the maths to use in some classroom
Level 1 Mathematics and Statistics, 2015
 91037 910370 1SUPERVISOR S Level 1 Mathematics and Statistics, 2015 91037 Demonstrate understanding of chance and data 9.30 a.m. Monday 9 November 2015 Credits: Four Achievement Achievement with Merit
Functional Skills Mathematics Level 2 assessment
 Functional Skills Mathematics Level 2 assessment www.cityandguilds.com September 2015 Version 1.0 Marking scheme ONLINE V2 Level 2 Sample Paper 4 Mark Represent Analyse Interpret Open Fixed S1Q1 3 3 0
MINUTE TO WIN IT: NAMING THE PRESIDENTS OF THE UNITED STATES
 MINUTE TO WIN IT: NAMING THE PRESIDENTS OF THE UNITED STATES THE PRESIDENTS OF THE UNITED STATES Project: Focus on the Presidents of the United States Objective: See how many Presidents of the United States
DIDACTIC MODEL BRIDGING A CONCEPT WITH PHENOMENA
 DIDACTIC MODEL BRIDGING A CONCEPT WITH PHENOMENA Beba Shternberg, Center for Educational Technology, Israel Michal Yerushalmy University of Haifa, Israel The article focuses on a specific method of constructing
Certified Six Sigma Professionals International Certification Courses in Six Sigma Green Belt
 Certification Singapore Institute Certified Six Sigma Professionals Certification Courses in Six Sigma Green Belt ly Licensed Course for Process Improvement/ Assurance Managers and Engineers Leading the
Association Between Categorical Variables
 Student Outcomes Students use row relative frequencies or column relative frequencies to informally determine whether there is an association between two categorical variables. Lesson Notes In this lesson,
Physics 270: Experimental Physics
 2017 edition Lab Manual Physics 270 3 Physics 270: Experimental Physics Lecture: Lab: Instructor: Office: Email: Tuesdays, 2 3:50 PM Thursdays, 2 4:50 PM Dr. Uttam Manna 313C Moulton Hall umanna@ilstu.edu
What s Different about the CCSS and Our Current Standards?
 The Common Core State Standards and CPM Educational Program The Need for Change in Our Educational System: College and Career Readiness Students are entering into a world that most of us would have found
Missouri Mathematics Grade-Level Expectations
 A Correlation of to the Grades K - 6 G/M-223 Introduction This document demonstrates the high degree of success students will achieve when using Scott Foresman Addison Wesley Mathematics in meeting the
The Efficacy of PCI s Reading Program - Level One: A Report of a Randomized Experiment in Brevard Public Schools and Miami-Dade County Public Schools
 The Efficacy of PCI s Reading Program - Level One: A Report of a Randomized Experiment in Brevard Public Schools and Miami-Dade County Public Schools Megan Toby Boya Ma Andrew Jaciw Jessica Cabalo Empirical
How to Design Experiments
 September 14, 2015 1 www.learning4doing.com TABLE OF CONTENTS Lesson 1 - Experiments, Data, and Measurement 3 1.1 - The Experiment 3 1.2 - Data, Primary Data, Secondary Data 4 1.3 - Data: Quantitative,
Extending Place Value with Whole Numbers to 1,000,000
 Grade 4 Mathematics, Quarter 1, Unit 1.1 Extending Place Value with Whole Numbers to 1,000,000 Overview Number of Instructional Days: 10 (1 day = 45 minutes) Content to Be Learned Recognize that a digit
CHAPTER 4: REIMBURSEMENT STRATEGIES 24
 CHAPTER 4: REIMBURSEMENT STRATEGIES 24 INTRODUCTION Once state level policymakers have decided to implement and pay for CSR, one issue they face is simply how to calculate the reimbursements to districts
The Good Judgment Project: A large scale test of different methods of combining expert predictions
 The Good Judgment Project: A large scale test of different methods of combining expert predictions Lyle Ungar, Barb Mellors, Jon Baron, Phil Tetlock, Jaime Ramos, Sam Swift The University of Pennsylvania
STT 231 Test 1. Fill in the Letter of Your Choice to Each Question in the Scantron. Each question is worth 2 point.
 STT 231 Test 1 Fill in the Letter of Your Choice to Each Question in the Scantron. Each question is worth 2 point. 1. A professor has kept records on grades that students have earned in his class. If he
Suggested Citation: Institute for Research on Higher Education. (2016). College Affordability Diagnosis: Maine. Philadelphia, PA: Institute for
. College Affordability Diagnosis: Maine. Philadelphia, PA: Institute for") MAINE Suggested Citation: Institute for Research on Higher Education. (2016). College Affordability Diagnosis: Maine. Philadelphia, PA: Institute for Research on Higher Education, Graduate School of Education,
MAINE Suggested Citation: Institute for Research on Higher Education. (2016). College Affordability Diagnosis: Maine. Philadelphia, PA: Institute for Research on Higher Education, Graduate School of Education,
AGS THE GREAT REVIEW GAME FOR PRE-ALGEBRA (CD) CORRELATED TO CALIFORNIA CONTENT STANDARDS
 CORRELATED TO CALIFORNIA CONTENT STANDARDS") AGS THE GREAT REVIEW GAME FOR PRE-ALGEBRA (CD) CORRELATED TO CALIFORNIA CONTENT STANDARDS 1 CALIFORNIA CONTENT STANDARDS: Chapter 1 ALGEBRA AND WHOLE NUMBERS Algebra and Functions 1.4 Students use algebraic
AGS THE GREAT REVIEW GAME FOR PRE-ALGEBRA (CD) CORRELATED TO CALIFORNIA CONTENT STANDARDS 1 CALIFORNIA CONTENT STANDARDS: Chapter 1 ALGEBRA AND WHOLE NUMBERS Algebra and Functions 1.4 Students use algebraic
Iowa School District Profiles. Le Mars
 Iowa School District Profiles Overview This profile describes enrollment trends, student performance, income levels, population, and other characteristics of the public school district. The report utilizes
Unit 3 Ratios and Rates Math 6
 Number of Days: 20 11/27/17 12/22/17 Unit Goals Stage 1 Unit Description: Students study the concepts and language of ratios and unit rates. They use proportional reasoning to solve problems. In particular,
CONSTRUCTION OF AN ACHIEVEMENT TEST Introduction One of the important duties of a teacher is to observe the student in the classroom, laboratory and
 CONSTRUCTION OF AN ACHIEVEMENT TEST Introduction One of the important duties of a teacher is to observe the student in the classroom, laboratory and in other settings. He may also make use of tests in
Ryerson University Sociology SOC 483: Advanced Research and Statistics
 Ryerson University Sociology SOC 483: Advanced Research and Statistics Prerequisites: SOC 481 Instructor: Paul S. Moore E-mail: psmoore@ryerson.ca Office: Sociology Department Jorgenson JOR 306 Phone:
READY TO WORK PROGRAM INSTRUCTOR GUIDE PART I
 READY TO WORK PROGRAM INSTRUCTOR GUIDE PART I LESSON TITLE: Problem Solving Tools Method: Informal Lecture, Guided Discussion EDUCATIONAL OBJECTIVE: Comprehend the many different uses of quality/problem
Algebra 2- Semester 2 Review
 Name Block Date Algebra 2- Semester 2 Review Non-Calculator 5.4 1. Consider the function f x 1 x 2. a) Describe the transformation of the graph of y 1 x. b) Identify the asymptotes. c) What is the domain
CS Machine Learning
 CS 478 - Machine Learning Projects Data Representation Basic testing and evaluation schemes CS 478 Data and Testing 1 Programming Issues l Program in any platform you want l Realize that you will be doing
GCSE Mathematics B (Linear) Mark Scheme for November Component J567/04: Mathematics Paper 4 (Higher) General Certificate of Secondary Education
 Mark Scheme for November Component J567/04: Mathematics Paper 4 (Higher) General Certificate of Secondary Education") GCSE Mathematics B (Linear) Component J567/04: Mathematics Paper 4 (Higher) General Certificate of Secondary Education Mark Scheme for November 2014 Oxford Cambridge and RSA Examinations OCR (Oxford Cambridge
GCSE Mathematics B (Linear) Component J567/04: Mathematics Paper 4 (Higher) General Certificate of Secondary Education Mark Scheme for November 2014 Oxford Cambridge and RSA Examinations OCR (Oxford Cambridge
Minitab Tutorial (Version 17+)
") Minitab Tutorial (Version 17+) Basic Commands and Data Entry Graphical Tools Descriptive Statistics Outline Minitab Basics Basic Commands, Data Entry, and Organization Minitab Project Files (*.MPJ) vs.
Minitab Tutorial (Version 17+) Basic Commands and Data Entry Graphical Tools Descriptive Statistics Outline Minitab Basics Basic Commands, Data Entry, and Organization Minitab Project Files (*.MPJ) vs.
2013 TRIAL URBAN DISTRICT ASSESSMENT (TUDA) RESULTS
 RESULTS") 3 TRIAL URBAN DISTRICT ASSESSMENT (TUDA) RESULTS Achievement and Accountability Office December 3 NAEP: The Gold Standard The National Assessment of Educational Progress (NAEP) is administered in reading
3 TRIAL URBAN DISTRICT ASSESSMENT (TUDA) RESULTS Achievement and Accountability Office December 3 NAEP: The Gold Standard The National Assessment of Educational Progress (NAEP) is administered in reading
Math-U-See Correlation with the Common Core State Standards for Mathematical Content for Third Grade
 Math-U-See Correlation with the Common Core State Standards for Mathematical Content for Third Grade The third grade standards primarily address multiplication and division, which are covered in Math-U-See
On-the-Fly Customization of Automated Essay Scoring
 Research Report On-the-Fly Customization of Automated Essay Scoring Yigal Attali Research & Development December 2007 RR-07-42 On-the-Fly Customization of Automated Essay Scoring Yigal Attali ETS, Princeton,
Cal s Dinner Card Deals
 Cal s Dinner Card Deals Overview: In this lesson students compare three linear functions in the context of Dinner Card Deals. Students are required to interpret a graph for each Dinner Card Deal to help
An Empirical Analysis of the Effects of Mexican American Studies Participation on Student Achievement within Tucson Unified School District
 An Empirical Analysis of the Effects of Mexican American Studies Participation on Student Achievement within Tucson Unified School District Report Submitted June 20, 2012, to Willis D. Hawley, Ph.D., Special
School Size and the Quality of Teaching and Learning
 School Size and the Quality of Teaching and Learning An Analysis of Relationships between School Size and Assessments of Factors Related to the Quality of Teaching and Learning in Primary Schools Undertaken
Python Machine Learning
 Python Machine Learning Unlock deeper insights into machine learning with this vital guide to cuttingedge predictive analytics Sebastian Raschka [ PUBLISHING 1 open source I community experience distilled
OVERVIEW OF CURRICULUM-BASED MEASUREMENT AS A GENERAL OUTCOME MEASURE
 OVERVIEW OF CURRICULUM-BASED MEASUREMENT AS A GENERAL OUTCOME MEASURE Mark R. Shinn, Ph.D. Michelle M. Shinn, Ph.D. Formative Evaluation to Inform Teaching Summative Assessment: Culmination measure. Mastery
Norms How were TerraNova 3 norms derived? Does the norm sample reflect my diverse school population?
 Frequently Asked Questions Today s education environment demands proven tools that promote quality decision making and boost your ability to positively impact student achievement. TerraNova, Third Edition
University of Groningen. Systemen, planning, netwerken Bosman, Aart
 University of Groningen Systemen, planning, netwerken Bosman, Aart IMPORTANT NOTE: You are advised to consult the publisher's version (publisher's PDF) if you wish to cite from it. Please check the document
Informal Comparative Inference: What is it? Hand Dominance and Throwing Accuracy
 Informal Comparative Inference: What is it? Hand Dominance and Throwing Accuracy Logistics: This activity addresses mathematics content standards for seventh-grade, but can be adapted for use in sixth-grade
Montana Content Standards for Mathematics Grade 3. Montana Content Standards for Mathematical Practices and Mathematics Content Adopted November 2011
 Montana Content Standards for Mathematics Grade 3 Montana Content Standards for Mathematical Practices and Mathematics Content Adopted November 2011 Contents Standards for Mathematical Practice: Grade
15-year-olds enrolled full-time in educational institutions;
 CHAPTER 4 SAMPLE DESIGN TARGET POPULATION AND OVERVIEW OF THE SAMPLING DESIGN The desired base PISA target population in each country consisted of 15-year-old students attending educational institutions
May To print or download your own copies of this document visit Name Date Eurovision Numeracy Assignment
 1. An estimated one hundred and twenty five million people across the world watch the Eurovision Song Contest every year. Write this number in figures. 2. Complete the table below. 2004 2005 2006 2007
Trends in College Pricing
 Trends in College Pricing 2009 T R E N D S I N H I G H E R E D U C A T I O N S E R I E S T R E N D S I N H I G H E R E D U C A T I O N S E R I E S Highlights Published Tuition and Fee and Room and Board
Centre for Evaluation & Monitoring SOSCA. Feedback Information
 Centre for Evaluation & Monitoring SOSCA Feedback Information Contents Contents About SOSCA... 3 SOSCA Feedback... 3 1. Assessment Feedback... 4 2. Predictions and Chances Graph Software... 7 3. Value
(I couldn t find a Smartie Book) NEW Grade 5/6 Mathematics: (Number, Statistics and Probability) Title Smartie Mathematics
 NEW Grade 5/6 Mathematics: (Number, Statistics and Probability) Title Smartie Mathematics") (I couldn t find a Smartie Book) NEW Grade 5/6 Mathematics: (Number, Statistics and Probability) Title Smartie Mathematics Lesson/ Unit Description Questions: How many Smarties are in a box? Is it the
(I couldn t find a Smartie Book) NEW Grade 5/6 Mathematics: (Number, Statistics and Probability) Title Smartie Mathematics Lesson/ Unit Description Questions: How many Smarties are in a box? Is it the
Progress Monitoring for Behavior: Data Collection Methods & Procedures
 Progress Monitoring for Behavior: Data Collection Methods & Procedures This event is being funded with State and/or Federal funds and is being provided for employees of school districts, employees of the
Financial aid: Degree-seeking undergraduates, FY15-16 CU-Boulder Office of Data Analytics, Institutional Research March 2017
 CU-Boulder financial aid, degree-seeking undergraduates, FY15-16 Page 1 Financial aid: Degree-seeking undergraduates, FY15-16 CU-Boulder Office of Data Analytics, Institutional Research March 2017 Contents
Northern Kentucky University Department of Accounting, Finance and Business Law Financial Statement Analysis ACC 308
 Northern Kentucky University Department of Accounting, Finance and Business Law Financial Statement Analysis ACC 308 SEMESTER: Fall 2014 INSTRUCTOR: Dr. J.C. Thompson, e-mail duke@qx.net OFFICE HOURS:
Mathematics subject curriculum
 Mathematics subject curriculum Dette er ei omsetjing av den fastsette læreplanteksten. Læreplanen er fastsett på Nynorsk Established as a Regulation by the Ministry of Education and Research on 24 June
(Includes a Detailed Analysis of Responses to Overall Satisfaction and Quality of Academic Advising Items) By Steve Chatman
 By Steve Chatman") Report #202-1/01 Using Item Correlation With Global Satisfaction Within Academic Division to Reduce Questionnaire Length and to Raise the Value of Results An Analysis of Results from the 1996 UC Survey
Report #202-1/01 Using Item Correlation With Global Satisfaction Within Academic Division to Reduce Questionnaire Length and to Raise the Value of Results An Analysis of Results from the 1996 UC Survey
LA1 - High School English Language Development 1 Curriculum Essentials Document
 LA1 - High School English Language Development 1 Curriculum Essentials Document Boulder Valley School District Department of Curriculum and Instruction April 2012 Access for All Colorado English Language
Visit us at:
 White Paper Integrating Six Sigma and Software Testing Process for Removal of Wastage & Optimizing Resource Utilization 24 October 2013 With resources working for extended hours and in a pressurized environment,
MODULE 4 Data Collection and Hypothesis Development. Trainer Outline
 MODULE 4 Data Collection and Hypothesis Development Trainer Outline The following trainer guide includes estimated times for each section of the module, an overview of the information to be presented,
Mathematics (JUN14MS0401) General Certificate of Education Advanced Level Examination June Unit Statistics TOTAL.
 General Certificate of Education Advanced Level Examination June Unit Statistics TOTAL.") Centre Number Candidate Number For Examiner s Use Surname Other Names Candidate Signature Examiner s Initials Mathematics Unit Statistics 4 Tuesday 24 June 2014 General Certificate of Education Advanced
Centre Number Candidate Number For Examiner s Use Surname Other Names Candidate Signature Examiner s Initials Mathematics Unit Statistics 4 Tuesday 24 June 2014 General Certificate of Education Advanced
Mathematics Scoring Guide for Sample Test 2005
 Mathematics Scoring Guide for Sample Test 2005 Grade 4 Contents Strand and Performance Indicator Map with Answer Key...................... 2 Holistic Rubrics.......................................................
Intra-talker Variation: Audience Design Factors Affecting Lexical Selections
 Tyler Perrachione LING 451-0 Proseminar in Sound Structure Prof. A. Bradlow 17 March 2006 Intra-talker Variation: Audience Design Factors Affecting Lexical Selections Abstract Although the acoustic and
Case study Norway case 1
 Case study Norway case 1 School : B (primary school) Theme: Science microorganisms Dates of lessons: March 26-27 th 2015 Age of students: 10-11 (grade 5) Data sources: Pre- and post-interview with 1 teacher
Mathematics Success Level E
 T403 [OBJECTIVE] The student will generate two patterns given two rules and identify the relationship between corresponding terms, generate ordered pairs, and graph the ordered pairs on a coordinate plane.
Preliminary Chapter survey experiment an observational study that is not a survey
 1 Preliminary Chapter P.1 Getting data from Jamie and her friends is convenient, but it does not provide a good snapshot of the opinions held by all young people. In short, Jamie and her friends are not
Office Hours: Mon & Fri 10:00-12:00. Course Description
 1 State University of New York at Buffalo INTRODUCTION TO STATISTICS PSC 408 4 credits (3 credits lecture, 1 credit lab) Fall 2016 M/W/F 1:00-1:50 O Brian 112 Lecture Dr. Michelle Benson mbenson2@buffalo.edu
Speech Recognition at ICSI: Broadcast News and beyond
 Speech Recognition at ICSI: Broadcast News and beyond Dan Ellis International Computer Science Institute, Berkeley CA Outline 1 2 3 The DARPA Broadcast News task Aspects of ICSI
RESEARCH METHODOLOGY AND STATISTICAL TOOLS
 MASTER OF BUSINESS ADMINISTRATION (JNTU) A MATERIAL FOR RESEARCH METHODOLOGY AND STATISTICAL TOOLS (According to JNTU Syllabus) Prepared by, S. Venkata Siva Kumar; MBA (HR/MRKTG), MSc (Statistics). 1 Meaning
NCEO Technical Report 27
 Home About Publications Special Topics Presentations State Policies Accommodations Bibliography Teleconferences Tools Related Sites Interpreting Trends in the Performance of Special Education Students
Pre-AP Geometry Course Syllabus Page 1
 Pre-AP Geometry Course Syllabus 2015-2016 Welcome to my Pre-AP Geometry class. I hope you find this course to be a positive experience and I am certain that you will learn a great deal during the next
Common Core Standards Alignment Chart Grade 5
 Common Core Standards Alignment Chart Grade 5 Units 5.OA.1 5.OA.2 5.OA.3 5.NBT.1 5.NBT.2 5.NBT.3 5.NBT.4 5.NBT.5 5.NBT.6 5.NBT.7 5.NF.1 5.NF.2 5.NF.3 5.NF.4 5.NF.5 5.NF.6 5.NF.7 5.MD.1 5.MD.2 5.MD.3 5.MD.4
Malicious User Suppression for Cooperative Spectrum Sensing in Cognitive Radio Networks using Dixon s Outlier Detection Method
 Malicious User Suppression for Cooperative Spectrum Sensing in Cognitive Radio Networks using Dixon s Outlier Detection Method Sanket S. Kalamkar and Adrish Banerjee Department of Electrical Engineering
The Impacts of Regular Upward Bound on Postsecondary Outcomes 7-9 Years After Scheduled High School Graduation
 Contract No.: EA97030001 MPR Reference No.: 6130-800 The Impacts of Regular Upward Bound on Postsecondary Outcomes 7-9 Years After Scheduled High School Graduation Final Report January 2009 Neil S. Seftor
SAT MATH PREP:
 SAT MATH PREP: 2015-2016 NOTE: The College Board has redesigned the SAT Test. This new test will start in March of 2016. Also, the PSAT test given in October of 2015 will have the new format. Therefore
Business 712 Managerial Negotiations Fall 2011 Course Outline. Human Resources and Management Area DeGroote School of Business McMaster University
 B712 - Fall 2011-1 of 10 COURSE OBJECTIVE Business 712 Managerial Negotiations Fall 2011 Course Outline Human Resources and Management Area DeGroote School of Business McMaster University The purpose of
Lecture 1: Machine Learning Basics
 1/69 Lecture 1: Machine Learning Basics Ali Harakeh University of Waterloo WAVE Lab ali.harakeh@uwaterloo.ca May 1, 2017 2/69 Overview 1 Learning Algorithms 2 Capacity, Overfitting, and Underfitting 3
Guide to the Uniform mark scale (UMS) Uniform marks in A-level and GCSE exams
 Uniform marks in A-level and GCSE exams") Guide to the Uniform mark scale (UMS) Uniform marks in A-level and GCSE exams This booklet explains why the Uniform mark scale (UMS) is necessary and how it works. It is intended for exams officers and
Guide to the Uniform mark scale (UMS) Uniform marks in A-level and GCSE exams This booklet explains why the Uniform mark scale (UMS) is necessary and how it works. It is intended for exams officers and
Firms and Markets Saturdays Summer I 2014
 PRELIMINARY DRAFT VERSION. SUBJECT TO CHANGE. Firms and Markets Saturdays Summer I 2014 Professor Thomas Pugel Office: Room 11-53 KMC E-mail: tpugel@stern.nyu.edu Tel: 212-998-0918 Fax: 212-995-4212 This
Sample Problems for MATH 5001, University of Georgia
 Sample Problems for MATH 5001, University of Georgia 1 Give three different decimals that the bundled toothpicks in Figure 1 could represent In each case, explain why the bundled toothpicks can represent