Report on the Effects of the Hopwood Decision on Minority Applications, Offers, and Enrollments at Public Institutions of Higher Education in Texas
|
|
|
- Grant Patterson
- 6 years ago
- Views:
Transcription
1 Report on the Effects of the Hopwood Decision on Minority Applications, Offers, and Enrollments at Public Institutions of Higher Education in Texas Table of Contents Executive Summary Purpose of the Report Major Findings Coordinating Board Recommendations Summary of Report Impact of Hopwood at: Public Undergraduate Institutions of Higher Education Eight Most Selective Universities Graduate Schools Medical Schools Public Law Schools The Diversity of Public Universities in Texas The Diversity of Graduate, Medical and Law Schools Identification of Factors Related to African-American and Hispanic Under-Representation in Higher Education PipelineRepresentation in Higher Education The Educational Academic Preparation Economic Background Changing Demographics Conclusions Recommendations A. Help Public Schools Create a Diverse and Academically Prepared Undergraduate Applicant Pool B. Promote Full Participation in Higher Education C. Increase Retention and Graduation Rates Appendices A. Data and Analytical Considerations
2 B. Texas Public University Undergraduate Minority Applications, Offers, and Enrollments C. Texas Public University Undergraduate Minority Applications, Offers, and Enrollments at the Eight Most Selective Institutions D. Texas Public University Graduate School Applications, Offers, and Enrollments E. Texas Medical School Applications, Offers, and Enrollments F. Texas Public Law School Applications, Offers, and Enrollments G. Texas Public University Undergraduate Diversity H. Texas Public Graduate, Law, and Medical School Diversity
3 EXECUTIVE SUMMARY Purpose of the Report In March 1996, the Fifth Circuit Court of Appeals ruled in the case Hopwood v. State of Texas (Hopwood) that The University of Texas at Austin law school's consideration of race or ethnicity in the admissions process violated the Fourteenth Amendment of the U.S. Constitution. The case was appealed to the U.S. Supreme Court, which denied the State of Texas' petition for certiorari on July 1, In August 1996, Texas Attorney General Dan Morales advised Texas higher education institutions that Hopwood required that admissions, financial aid and student retention programs be administered on a race-neutral basis. In February 1997, Attorney General Morales finalized that advice in an official opinion. The Texas Legislature, in House Bill 2146, directed the Coordinating Board to conduct this study on the impact of the Hopwood case on applications, offers, and admissions to minorities in public institutions of higher education in Texas, and to deliver this study for the Legislature's review by December 1, Major Findings The commitment to diversity in higher education must be decisive and must happen now if Texas is to remain economically competitive. The Texas population is becoming increasingly diverse. It is estimated that by 2010, no one racial or ethnic group will be in the majority. A failure to act now will result in a large part of the Texas population being under-prepared to compete in and contribute to our highly complex and technical work world and society. The Hopwood decision has had a negative impact on the number of African-Americans and Hispanics applying for, being admitted to, and enrolling in the most prestigious and the most selective public higher education institutions and programs in Texas - undergraduate and graduate programs at the most selective universities, medical schools, and law schools. The impact of Hopwood on African-American and Hispanic enrollments in higher education must be viewed in the context of overall participation rates at public universities in Texas. Statewide, the higher education student body is becoming more diverse over time, particularly for community colleges, as the number of African-American and Hispanic students continue to increase. Since 1986 Hispanics have grown from 15 percent to 23 percent of the student body, African-Americans from nine to 10 percent of the student body. Despite the statewide growth in overall diversity, public universities in Texas, by virtue of mission, history and locale, remain racially/ethnically differentiated. As such, the impact of Hopwood is of even greater concern since it is concentrated at the most selective schools in which minorities are already under-represented. The diversity of the student body decreases at each step of the educational pipeline as
4 students move from high school, to community college and/or university, and on to the graduate and professional schools. Since professional and graduate schools rely on the population of baccalaureate degree holders for their applicant pool, they are disadvantaged by the lack of diversity among university graduates. The under-representation of African-American and Hispanic students at public institutions of higher education in Texas is grounded in a wider social, economic and educational system that cannot be addressed adequately by any one institution or group of institutions. This helps explain why a generation of institution-based affirmative action programs have not created a student body that reflects the Texas population. It may also explain the inability of any single institution-based program or set of programs to fully counter the impact of Hopwood at those institutions that had used race or ethnicity as an admissions criteria before Hopwood. The two biggest factors responsible for the failure of any student in higher education are the lack of academic preparation in public school and the lack of financial resources. To the extent these conditions exist disproportionally in the minority community, minority student success in higher education will continue to be affected. Accordingly, a statewide effort to ensure adequate academic preparation and economic resources for all Texans is the most effective way of ensuring that minorities and other under-represented students are prepared for and receive the benefits of higher education. Coordinating Board Recommendations The Coordinating Board makes the following recommendations: A. Help public schools create a diverse and academically prepared undergraduate applicant pool 1. Encourage all high schools to offer the college preparatory core curriculum and encourage all high school students to take the core curriculum 2. Support efforts to encourage young people to prepare for and attend college 3. Support programs that increase the quality of public school principals and the quality and quantity of public school teachers in Texas B. Promote full participation in higher education 1. Fund a need-based grant program that could eventually be linked to high school academic preparation 2. Support research and development of alternative predictors of success
5 3. Study and evaluate the effects of distance education opportunities on under-represented groups in Texas C. Increase retention and graduation rates 1. Reward institutions for recruiting, retaining and graduating students 2. Increase state funding for the Texas College Work-Study program 3. Ease the transition for students transferring from a community college to an upper-level institution SUMMARY OF REPORT Impact of Hopwood at Public Undergraduate Institutions of Higher Education Statewide, Hopwood appears to be just one of several factors that impact African-American and Hispanic enrollment at public institutions of higher education in Texas. A review of post-hopwood admissions applications, offers of admission, and first-time enrollments in 1997 at Texas public institutions of higher education shows that African-American first-time enrollments have continued to increase at both community colleges and universities. Hispanic first-time enrollments decreased in 1997 across all Texas public universities. Hispanic first-time enrollments at community colleges have been declining since peaking in Since African-American enrollments continue to increase and the decline in Hispanic enrollments pre-dates the Hopwood decision, there appears to be no direct evidence that Hopwood resulted in a decrease in African-American and Hispanic first-time enrollment statewide at either community colleges or universities. All public institutions were surveyed to determine the impact of Hopwood on recruitment, admissions, and financial aid. The impact at community colleges was limited to four institutions, which modified or abandoned financial aid programs based on race or ethnicity. All universities reported modifications in their recruitment and/or financial aid programs to conform to the Hopwood decision. Although five of the eight most selective institutions reported a direct impact of Hopwood on admissions, only two of these had actually used race or ethnicity as a factor in admissions decisions.
6 Impact of Hopwood at the Eight Most Selective Universities The impact of Hopwood on African-American and Hispanic enrollment at the eight most selective public universities in Texas ranged from none to profound. The only two institutions that used race or ethnicity as an admissions factor before Hopwood, The University of Texas at Austin and Texas A&M University, were the most affected by the ruling. The University of Texas at Dallas, the University of Houston, and Texas A&M University - Corpus Christi reported no post-hopwood declines in African-American or Hispanic applications, offers, or first-time enrollments in In 1998 both the University of Houston and Texas A&M University-Corpus Christi reported an increase African American and Hispanic first-time enrollment while The University of Texas at Dallas reported a decrease in African-American firsttime enrollment and a continued increase in Hispanic first-time enrollment. The University of North Texas and Southwest Texas State University reported a decline in African-American and Hispanic first-time enrollments in 1997, but applications, offers, and firsttime enrollments at these schools in 1998 equaled or exceeded pre-1997 levels. None of these schools have used race or ethnicity as a factor in admissions decisions. These schools credit aggressive recruiting efforts and/or ethnically diverse surrounding communities for their continued success in African-American and Hispanic participation. Texas Tech University reported a continuing decline in African-American and Hispanic first-time enrollments before Hopwood that was reversed in 1998 for Hispanics, but not for African- Americans. The institution reported that its geographic isolation from significant populations of minority group members, particularly African-Americans, continues to be a problem. It also reported that race or ethnicity has not been a factor in admissions decisions. Both The University of Texas at Austin and Texas A&M University reported that race or ethnicity was a factor in admissions decisions prior to Hopwood. Both reported significant declines in offers and enrollments in 1997 for African-Americans and Hispanics. It should be noted, however, that both institutions had reported decreases in first-time enrollments for African- Americans since 1994 and for Hispanics since As a result of Hopwood, both The University of Texas at Austin and Texas A&M University restructured their admissions procedures to eliminate race or ethnicity as a factor and to consider the alternative admissions criteria offered in House Bill 588, which provides automatic admission at public universities to any student in the top 10 percent of his or her high school graduating class. Both institutions also report that they increased their recruitment efforts to help compensate for the effects of Hopwood. In 1998, applications from African-Americans at The University of Texas at Austin increased and at Texas A&M University decreased. Although the number of offers to African-Americans at both
7 schools continued to decrease, first-time enrollments increased, although not to a level that approached pre-hopwood first-time enrollment levels. For Hispanics, the number of applications and offers in 1998 increased for The University of Texas at Austin and decreased for Texas A&M University. Both institutions reported a 1998 increase in Hispanic first-time enrollments. Impact of Hopwood at the Graduate Schools Overall, first-time enrollments of African-American and Hispanic graduate students have continued to increase. For all public graduate schools in Texas, African-American applications and offers declined after Hopwood, although first-time enrollments continued to increase, as they have since In 1997, applications and offers to graduate school were down for African-Americans at The University of Texas at Austin and Texas A&M University, but while The University of Texas saw a decline in first-time enrollments, Texas A&M University's African-American enrollment increased by two students. First-time applications and enrollments of Hispanics at public graduate schools have continued to rise since 1991; however, the number of offers declined after Hopwood. The University of Texas at Austin and Texas A&M University reported declines in graduate school offers and first-time enrollments of Hispanics in Impact of Hopwood on Medical Schools Medical schools report that the number of Hispanic and African-American first-time entering medical school students increased in 1994 and 1995, remained constant in 1996, and declined in 1997 to levels close to those reported in In 1998, offers and applications for both African- Americans and Hispanics increased to levels higher than 1993 but less than Collectively, medical schools have reversed in 1998 the post-hopwood impact in first-time enrollments reported in 1997, but have not reached the levels in the years immediately preceding the Hopwood decision. Six of the eight medical schools reported a decrease in both offers to and enrollments of African- Americans in The remaining two increased their enrollment by three (one at one school and two at another) for a combined total first-time enrollment at these two medical schools of six African-Americans in In 1998, five of the eight medical schools report an increase in first-time enrollments over 1997, two report no change (in both years, no African-Americans enrolled), and one reported a decline from three to one student. More significantly, African-American first-time enrollments for 1998 at four schools - The University of Texas Health Science Center at San Antonio (4), the University of North Texas
8 Health Science Center at Fort Worth (1), Texas A&M University Medical School (0), and Texas Tech University Health Sciences Center (0) - account for fewer students together (5) than any one of the other four, and constitute only nine percent of the African-American entering class (55). The University of Texas Medical Branch at Galveston enrolled 23 African-American medical students in 1998, Baylor College of Medicine enrolled 14, The University of Texas Southwestern Medical Center at Dallas enrolled seven, and The University of Texas Health Science Center at Houston enrolled six. Six of the eight institutions reported a decrease in both offers to and enrollments of Hispanics in The remaining two increased their enrollment by one Hispanic student each. In 1998, four of the six institutions reporting a decrease in 1997 increased their enrollments, and three of these reported an increase in offers. Both institutions that reported an increase in Hispanic first-time enrollments in 1997 reported a significant decrease in enrollments in Hispanic first-time enrollments are not distributed evenly across institutions. Four schools - Baylor College of Medicine (15), the University of North Texas Health Science Center at Fort Worth (6), Texas Tech University Health Sciences Center (4), and Texas A&M University Medical School (3) - account for only 17 percent of the total Hispanic first-time entering students (161) at Texas' medical schools. The University of Texas Medical Branch at Galveston enrolled 56 Hispanic medical students in 1998, The University of Texas Health Science Center at San Antonio enrolled 36, The University of Texas Health Science Center at Houston enrolled 21, and The University of Texas Southwestern Medical Center at Dallas enrolled 20. Impact of Hopwood on Public Law Schools Overall, law school offers and enrollments declined for African-Americans and Hispanics in In 1998, offers and enrollments for Hispanics increased to pre-hopwood levels but numbers for African-Americans did not increase to those levels. During the past six years, African-Americans entering a public law school in Texas have chosen Texas Southern University School of Law over the other three law schools combined at a ratio that has reached 10 to one. Texas Southern University School of Law also has the highest entry rate for Hispanics. Texas Southern University School of Law experienced little, if any, impact from Hopwood, thereby serving as a buffer and moderating the overall impact of Hopwood on the entry of African-American and Hispanic students into public law schools in Texas. The University of Houston Law Center also experienced little, if any, impact from Hopwood. The number of African-American first-time entering students dropped from 11 in 1996 to nine in 1997 and eight in 1998, compared to a high of 17 in both 1994 and Both Texas Southern University and the University of Houston reported that they made no significant changes in their recruitment and admissions policies as a result of Hopwood. At Texas Tech University Law School, Hopwood had a negative impact on first-time African-
9 American and Hispanic enrollment in 1997 which was surmounted in Hispanic first-time enrollment dropped to 17 in 1997 but rose to 28 in 1998, higher than any level since The number of offers to Hispanics has remained constant before and after Hopwood. African- American first-time enrollment at Texas Tech University dropped from four in 1996 to one in 1997 but rose to five in The University of Texas School of Law reported a significant decline in offers and enrollments of African-Americans and Hispanics in 1997, although in 1998, Hispanic offers and enrollments were back to pre-hopwood levels. Offers and first-time enrollments of African-Americans in 1998 doubled the 1997 levels but remain about one-third or less of first-time enrollments reported in Both Texas Tech University Law School and The University of Texas School of Law have reported increasing recruitment efforts and changing admissions procedures to counter the immediate impact of Hopwood. The Diversity of Public Universities in Texas The effect of Hopwood on African-American and Hispanic first-time enrollment in higher education must be viewed in the context of current overall participation rates at public universities in Texas. Statewide, the university student body is 62 percent White, 9 percent African-American, 19 percent Hispanic, and five percent Asian American. The public university student body is slowly becoming more diverse over time, particularly with respect to Hispanics. But despite the statewide growth in overall diversity, public universities in Texas, by virtue of mission, history and locale, remain racially/ethnically differentiated. No university in Texas has a racial/ethnic makeup that resembles the Texas college-aged population. In fact, most public universities in Texas have an undergraduate student body that is comprised of 75 percent or more of one racial/ethnic group. In other words, 75 percent or more of the undergraduate students at most of Texas' public universities are either White, African- American, or Hispanic. In 1997, only two universities did not have a single ethnic group constituting more than 50 percent of the student body - The University of Texas at San Antonio and The University of Houston-Downtown. In this context, the impact of Hopwood is of even greater concern since it is concentrated at the most selective schools in which minorities are already under-represented. The Diversity of Graduate, Medical and Law Schools African-American and Hispanic enrollment at public graduate schools in Texas in 1997 was the highest ever, although only seven percent of the graduate student body was African-American and only 12 percent was Hispanic, compared to 63 percent for Whites.
10 Overall, the public law school student body in 1997 was 12 percent African-American and 11 percent Hispanic compared to 69 percent for Whites. Like the racial/ethnic differentiation in undergraduate institutions, this diversity has been gained by over-representation in one program, Texas Southern University, and under-representation in the others. Total enrollment in Texas medical schools was 61 percent White, five percent African-American and 14 percent Hispanic in For African-Americans and Hispanics, these are the same percentage as in Identification of Factors Related to African-American and Hispanic Under-Representation in Higher Education In this section, factors related to African-American and Hispanic under-representation at Texas colleges and universities are identified. These factors provide a fuller context for understanding the impact of Hopwood and provide direction for developing strategies to successfully increase African-American and Hispanic participation in higher education. The Educational Pipeline As diverse as the higher education student body may be as a whole, it is not as diverse as Texas' year-old population. In fact, the diversity of the student body decreases as students move through the educational pipeline from high school, to community college and/or university, and on to the graduate and professional schools. At the end of this pipeline are professional and graduate schools that require the highest level of academic preparation and cost the most to attend. Since professional and graduate schools rely on the population of baccalaureate degree holders for their applicant pool, they are disadvantaged by any lack of diversity among baccalaureate degree holders. Figure 1 is a snapshot of each population in 1997 and shows that diversity diminishes at each step of the educational pipeline. Beginning with data on the left side of the graph, the Texas population as a whole is less diverse than the college-aged population and that the public high school graduating class is less diverse than the year-old population. Again, there is increasingly less diversity moving up the educational pipeline from university enrollments to university graduation rates to graduate school, medical school and law school enrollments.
11 Each juncture or step in the educational pipeline is characterized by two features. First, the academic rigor increases. Second, each successive step is increasingly more of a financial burden on the student. In the following sections, we examine the relationship between academic preparation, financial ability, and African-American and Hispanic participation in higher education. Academic Preparation The better the academic preparation a student receives in K-12, the more likely that student will be able to perform at college level and earn a baccalaureate degree. Data from the major
12 national testing services show that in Texas and nationally, the more core classes a student takes, the higher his or her scores are likely to be on the college entrance exams. Coordinating Board studies show that students who take more core courses in high school and who earn higher-level high school diplomas perform at higher levels on the Texas Academic Skills Program test, a measure of college readiness. Another study has shown that students in the top 10 percent of their class graduate from college within six years at a higher rate than others. Moreover, in all these studies, the same results were found regardless of whether the students were African-American, Hispanic, or White. Unfortunately, African-American and Hispanic students take fewer core classes than White students. Economic Background College participation rates nationwide decrease as family income decreases. While more than 46 percent of the households in Texas have incomes below $25,000, the figure for African-American and Hispanic households is 62 percent. Given the apparent link between income and academic preparation, tying financial aid to the completion of a core curriculum in high school should increase college participation. However, it is important to recognize that it will be several years before all high schools in Texas are prepared to offer the full core curriculum. Furthermore, financial aid should also be provided for those students who have not just recently completed high school. Changing Demographics Texas is rapidly becoming more diverse. In 1990, Hispanics made up 26 percent and African- Americans made up 12 percent of the Texas population. Although the percentage of African- Americans has not changed, Hispanics now make up 29 percent of the Texas population. Correspondingly, the percentage of Whites in the Texas population has dropped from 61 percent in 1990 to 57 percent in Projections of the population of Texas show that by as soon as 2010, Texas could become a state where no racial or ethnic group is in the majority. Under this prediction, Hispanics would make up 36 percent of the Texas population and African-Americans 11 percent. Even with the most conservative estimates, Texas is expected to be a state where there is no racial or ethnic majority by the year These demographic forecasts indicate that Hopwood's negative impact on the rate at which Hispanics and African-Americans enter public institutions of higher education in Texas will become even more pronounced. The loss of diversity over the entire educational pipeline could be problematic for the economy of the state. Although it can be done, It will take time to diversify public institutions of higher education in Texas. Unless clear and decisive efforts are made to diversify higher education right now, the result will be an increasingly larger portion of the Texas population who are not prepared to
13 engage productively in the economic opportunities this great state can provide. Conclusions As academic rigor and costs of attendance increase at each step in the educational pipeline, African-American and Hispanic participation declines. Moreover, as academic rigor and costs of attendance increase at any given step in the educational pipeline, African-American and Hispanic participation declines. Thus, for example, not only is a university more academically demanding and costly than high school, public universities differ from each other in their academic rigor (i.e., their admissions requirements) and costs. This analysis is consistent with the data examined in this report. Inadequate academic preparation for young African-American and Hispanic people could explain the underrepresentation of these groups at community colleges, which are open admission institutions that present no admission requirement obstacles. To the extent that inadequate academic preparation contributes to not meeting admissions criteria, the institutions with relatively more stringent admissions criteria also have relatively less diversity. Selective institutions that compensated by using race or ethnicity as an admissions criterion saw a dramatic decrease in offers and first-time enrollments when Hopwood disallowed the use of race or ethnicity in admission decisions. This analysis suggests that the decrease in African-American and Hispanic participation at Texas' most selective institutions resulting from Hopwood and the under-representation of African-American and Hispanic students in public institutions of higher education statewide is in large part due to inequities among these ethnic groups in academic preparation and financial ability. The problems of inadequate academic preparation and financial ability that minorities face are grounded in a wider social, economic, educational, and political system of public policies that cannot be addressed adequately by any one sector, or any one institution in any one sector. This is one explanation for the fact that a decade of institution-based affirmative action programs have not proven entirely effective in creating a diverse student body. It may also explain the inability of any single institution based program or set of programs to fully counter the impact of Hopwood at those institutions that had used race or ethnicity as an admissions criteria before Hopwood. In light of the deep-rooted and cumulative nature of these problems, the Coordinating Board focuses its recommendations on the three critical areas along the education pipeline where the problems of academic preparedness and financial ability appear to act as barriers to higher education for Texas citizens of color. In particular, the Coordinating Board makes specific recommendations to: Help public schools create a diverse and academically prepared undergraduate applicant pool. Promote full participation in higher education. Increase retention and graduation rates.
14 We must act now if Texas is to remain an economic leader.
15 RECOMMENDATIONS A. Help Public Schools Create a Diverse and Academically Prepared Undergraduate Applicant Pool 1. Encourage all high schools to offer the college preparatory core curriculum and encourage all high school students to take the core curriculum Studies show that success in college is related to academic preparation. An important component of academic preparation is taking the recommended core curriculum while in high school. In January 1992, the Coordinating Board adopted a resolution endorsing a model college preparatory curriculum, and during the 73rd legislative session, the Texas Legislature passed a concurrent resolution endorsing a college preparatory curriculum. In 1998, the recommended core curriculum adopted by the State Board of Education went into effect. The State Board also authorized two diplomas that incorporate this curriculum - the "recommended" and the "distinguished achievement" curricula. However, because of a lack of resources, the recommended high school curriculum is not available to all high school students. In addition, some school districts lack the teachers qualified to teach all of the courses. Also, while some schools may have the resources to offer the curriculum to a percentage of their students, they may not have the capacity to offer the curriculum to all students, if every student chose to enroll. The Coordinating Board recommends that the Legislature address these deficiencies so that every high school student in Texas can be encouraged to take and complete the recommended core curriculum. All high schools should be encouraged to provide the recommended high school curriculum to all students. High schools that do not currently have the capability of providing all courses "in-house" should take advantage of distance education opportunities until such time as they do. High schools with distance education capabilities and qualified teachers should consider providing courses throughout the state via instructional telecommunications. The Coordinating Board recommends that if the Legislature creates a new substantially funded state grant program (as recommended in B.1), completion of the recommended high school curriculum should be required as condition for eligibility for recent high school graduates; however, the requirement should be phased in as all high schools develop the capacity to provide the curriculum to all students and as all high school students are made aware of the requirement. 2. Support efforts to encourage young people to prepare for and attend college Past experience has shown that a well-researched and developed media campaign can be
16 effective in changing people's behavior. In addition, collaborative efforts between higher education and public education can reach students directly to make an impact on their choices. The Commission on a Representative Student Body headed by former Lieutenant Governor Bill Hobby is recommending that the Legislature explore ways of financing a market research plan for a statewide media campaign that encourages our young people to attend college, tells them how to prepare for college and directs potential students to resources that will help them once they decide to attend college, such as financial aid. The Coordinating Board endorses that recommendation and urges the Legislature to send a powerful and convincing message to the young people of Texas to prepare for and attend a college or university. The Legislature should continue to encourage collaborative partnerships, such as the Texas Awareness Initiative and the S.T.A.R. (School Teachers as Recruiters) Program, between higher education and public education that spread the message. The Texas Awareness Initiative is a partnership between the Texas Guaranteed Student Loan Corporation and the Coordinating Board in collaboration with the Texas Education Agency, high school counselors and teachers, and higher education institutions to help students and their parents select a college or university, plan a career, and apply for financial aid. The S.T.A.R. Program brings high school and middle school teachers onto local college and university campuses with the goal of enabling them to better counsel their students on the opportunities available from higher education. 3. Support programs that increase the quality of public school principals and the quality and quantity of public school teachers in Texas The impact of teacher effectiveness has been persuasively demonstrated in a number of studies. These studies show, for example, that teachers with strong verbal and math skills and with deep content knowledge produce students who score higher on tests of achievement such as the Iowa Test of Basic Skills than teachers who are weak in these areas. Moreover, many teachers in Texas are not certified in the areas in which they are teaching. Texas' universities play a key role in educating the state's teachers. Therefore, it is incumbent on those universities to do all they can to produce teachers who meet high standards and who are well prepared to enter the state's classrooms. The Coordinating Board recommends that the Legislature increase the formula funding rates for educator preparation at the state's general academic institutions to more accurately reflect the costs of providing that instruction. As part of the goal to improve teacher preparation in the state, the Coordinating Board will: Join with the State Board of Education and the State Board for Educator
17 Certification (SBEC) to focus attention of the universities on Reading Education as one of the state's highest priorities. Specifically, the Coordinating Board will conduct a review of selected educator preparation programs utilizing written inventories of current practices, staff and Board member site visits, and expert outof-state consultants. Join with the SBEC to assure that all educator preparation becomes and remains a high priority for every public university in the state. Specifically, direct the staff to work with SBEC and others to review all educator preparation programs. Require institutions with students scoring below SBEC-mandated averages [on the ExCET] to submit plans to raise student test scores, with these plans to be considered by the Board when it reviews requests for new degree programs in all disciplines. Invite proposals from universities to offer complete educator preparation degree and certificate programs via distance education across the state, and especially to under-served areas. B. Promote Full Participation in Higher Education 1. Fund a need-based grant program that could eventually be linked to high school academic preparation At its July meeting, the Coordinating Board adopted recommendations to the Legislature to strengthen financial aid programs in Texas to ensure all citizens have access to higher education. The Coordinating Board recommended that: Funds for state grants to college students should be substantially increased. Eligibility for the grant should be based on financial need, with a requirement of satisfactory academic progress towards a degree or certificate to maintain eligibility. However, as noted in Recommendation A.1., a requirement for completion of the recommended high school curriculum should be phased in. 2. Support research and development of alternative predictors of success House Bill 588, 75th Legislature, provided an extensive list of alternative selection criteria to help institutions devise more comprehensive admissions procedures. An advisory committee to
18 the Coordinating Board that studied the issue following the Hopwood ruling helped to develop the list. However, it is possible that there are other selection criteria or means of identifying potential students that also better predict student success that have not yet been identified. The Coordinating Board recommends higher education institutions conduct a collaborative study to identify and develop alternative admissions criteria and supporting methodologies that predict success as well or better than traditional admissions tests and that will help create a more diverse student body at Texas' select universities, graduate programs, and professional schools. 3. Study and evaluate the effects of distance education opportunities on underrepresented groups in Texas Distance education technology is creating an educational delivery system that provides access to people who have never before had access to higher education. While distance education may substantially increase accessibility, it may be at the cost of diversity because members of groups under-represented in higher education are also the least likely to be able to afford the technology. The Coordinating Board recommends that higher education institutions study and evaluate the accessibility and effects of distance education for under-represented groups in Texas. C. Increase Retention and Graduation Rates 1. Reward institutions for retaining and graduating students Many children in this state grow up believing that a college education is beyond their reach. This may be because they come from families in which attending college is not a tradition. Or, they may come from economically disadvantaged backgrounds that make the expense of going to college difficult to manage. However, studies have found that outreach and intervention programs can be successful in persuading those students to aspire to postsecondary education. Institutions of higher education vary in their approaches to recruiting students and they vary in their attempts to reach students before they get to high school. The Commission on a Representative Student Body has recommended that the Legislature create a fund to provide supplementary financing for recruitment programs that meet certain standards of success. The Coordinating Board agrees with the Commission's recommendation and
19 recommends that the Legislature consider creating a competitive grant program that tests creative models for improving student recruitment and retention rates. The grants could be awarded for innovative programs aimed at improving these rates. As part of the grant conditions, the programs receiving the grants would be measured for effectiveness with the goal of eventually replicating successful programs throughout the state. Once a student is admitted to an institution, the institution is responsible for providing the support services that ensures that all of its students graduate. However, the retention and graduation rates for economically disadvantaged students are generally below the rates for other students. The Coordinating Board believes that an institution's commitment to its students makes a difference in retention and that this commitment can be strengthened by tying institutional funding to retention. At its April meeting, the Coordinating Board adopted a recommendation as part of its formula funding recommendations for fiscal years for a supplement to the Instruction and Operations Formula to assist institutions that enroll and retain economically disadvantaged students. The supplement is designed to provide the support necessary for institutions to enhance advising, counseling, and other programs to increase the retention and graduation rates of economically disadvantaged students. The Coordinating Board recommends that the Legislature approve the supplement to assist institutions that enroll and retain economically disadvantaged students to the formula for funding the general academic institutions in Texas. 2. Increase state funding for the Texas College Work-Study program A work-study job can be an effective retention tool by providing income for a student as well as a support system while attending school. Also, a student benefits from exposure to work and job skills while the employer benefits since part of the wages are paid through the program. The Commission on a Representative Student Body has recommended a substantial increase in funding. The Coordinating Board agrees with the Commission and recommends that funding for the Texas Work-Study Program be increased considerably and targeted to those with the greatest financial need, and that adequate funds be provided for the administration of the program. 3. Ease the transition for students transferring from a community college to an upperlevel institution Because of cost and convenience, community colleges have become the institutions of choice for many under-represented students. However many of the students who begin community
20 college do not receive a degree of any kind, much less go on to receive a baccalaureate degree at an upper-level institution. The Commission on a Representative Student Body has recommended that incentives be created for community college students to earn associate's degrees and/or transfer to four-year institutions, and the Coordinating Board endorses the creation of such incentives.
21 APPENDIX A: DATA AND ANALYTICAL CONSIDERATIONS The Coordinating Board maintains a variety of databases related to participation in higher education in Texas. The major sources of data used in this study are: 1) Coordinating Board (CBM series) records of enrollment, retention, and graduation, updated annually; 2) Texas Plan data submitted by institutions in 1991, 1993, 1995, and 1997 which includes information on fall term applications, offers, and enrollments (1) ; 3) non-certified applications, offers, and enrollment figures from 1994 through 1998 supplied by institutions requested specifically for this study; 4) minority participation and high school graduation rates supplied by the Texas Education Agency; and 5) national and other studies focused on minority participation rates in higher education. The Coordinating Board maintains fall semester application, offers, and enrollment data from institutions as required by the Access and Equity 2000 plan, which is the third consecutive Texas Educational Opportunity Plan for Public Higher Education, or Texas Plan. The purpose of all three plans is to desegregate and increase the representation of African-Americans and Hispanics in Texas institutions of higher education. The first plan was implemented by the State of Texas in 1983 in response to an investigation of higher education in Texas conducted by the U.S. Department of Education's Office for Civil Rights (OCR) between 1978 and The plan was approved by OCR in 1983 and was effective from 1983 until 1988, at which time the Coordinating Board approved a second plan, which was effective from 1989 until In 1994, the Board approved the Access and Equity 2000 Plan, which is currently in effect, although institutions' ability to implement that plan has been restricted by the Hopwood decision. Notwithstanding Hopwood, the Coordinating Board continues to collect data from all public institutions of higher education. Data collected in 1991, 1993, 1995 and 1997 is the basis for the undergraduate and graduate analyses in this report, with 1997 representing the first post- Hopwood impact year. For purposes of this study, the eight universities with the strictest admissions standards were asked to report their application, offers, and enrollment data from 1994 through These eight schools are: The University of Texas at Austin The University of Texas at Dallas
22 Texas A&M University Texas A&M University at Corpus Christi Texas Tech University Southwest Texas State University University of Houston University of North Texas Each of these eight schools were provided with the following definitions for reporting their applications, offers, and enrollments. Applications: Report students who have completed an application for admissions, who have never attended any college (or post secondary institution). Include students enrolled in the fall term who attended a postsecondary institution for the first time at the same level in the prior summer term. Also includes students who entered with advanced standing (college credit earned before graduation from high school). (Do not include transient student applications.) Offers: Report the number of offers made to the applicant cohort as defined above. Enrollments: Report entering freshmen who have never attended any college (or post secondary institution). Include students enrolled in the fall term who attended a postsecondary institution for the first time in the prior summer term. Also include students who entered with advanced standing (college credit earned before graduation from high school). Because this data was collected outside of the normal reporting protocols established for this type of reporting the normal certification procedures could not be implemented. However, in order to check the data provided by the institutions, the Coordinating Board generated first time freshmen enrollments based on yearly institutional reporting on the CBM-001. (Application and offer data are not collected yearly by the Coordinating Board.) The CBM-001 enrollment data is certified for every year but 1998 for which the verification process could not be completed in time for this report. The certified CBM-001 enrollment data was compared to the enrollment data reported directly by the eight institutions. A number of discrepancies were identified for each institution, but all were small and did not substantially change the nature of the results. In order to maintain consistency with other reporting by the Coordinating Board and ensure appropriate comparisons across these institutions, the certified enrollment data from the CBM-001 is used in this report
23 rather than the enrollment numbers reported directly by the institutions (2). The eight medical and four public law schools provided data for their first time entering students for the years 1993 through Institutions were also surveyed for their written assessment of Hopwood's impact on recruiting, admissions, and financial aid programs in an effort to identify programs that might be especially useful in creating a diverse student body. 1. Six institutions include summer students who enroll in the fall in reporting first-time applicants because many, if not all, of these students are provisionally admitted in the fall based on their performance during the summer. 2. This does not prevent institutions from reporting in other arenas application, offers, and enrollment figures that differ from those in this report.
24 APPENDIX B: TEXAS PUBLIC UNIVERSITY UNDERGRADUATE MINORITY APPLICATIONS, OFFERS, AND ENROLLMENTS This appendix describes the number of African-American and Hispanics making application to, receiving offers from, and enrolling for the first time in the public institutions of higher education in Texas. Institutions reported the number of applications, offers, and fall (1) admissions to the Coordinating Board in 1991, 1993, 1995, and Data are reported for all public institutions of higher education and separately for both community and technical colleges and universities. African-American Students Figure 2 shows the number of applications, offers, and enrollments for African-Americans in all public institutions of higher education in Texas for 1991, 1993, 1995, and Applications
25 and offers have increased since Actual first-time enrollments, however, declined between 1991 and 1995 but increased in 1997, the year following the Hopwood decision. Applications, offers, and enrollments in community and technical colleges for African- Americans are shown in Figure 3. These numbers vary between 1991 and In 1997, however, the increase in all categories is quite clearly above any previous year examined.
26 For universities, African-American applications, offers, and enrollments have all increased each reporting period since 1993 (see Figure 4). There appears to be no impact on first-time enrollment of African-Americans from Hopwood at either community colleges or universities.
27 Hispanic Students Figure 5 shows the number of applications, offers and enrollments at all public institutions of higher education in Texas for Hispanics. Institutions report an increase in applications and offers from 1991 through 1995, with a decline in Enrollments declined in 1995 and again in 1997 after a gain in While the decline in enrollments is a concern, it is not a decline that is obviously related to the Hopwood decision. Still, first-time enrollments for Hispanics in 1997 were about 5,000 more than reported in 1991.
28 For community and technical colleges, Hispanic applications and offers climbed to a peak in 1995 and subsequently fell in 1997 (see Figure 6). However, first-time enrollments of Hispanics have been declining since their peak in 1993, again making it difficult to directly link Hopwood and declining enrollment.
29 Applications, offers, and enrollments for Hispanics at public universities in Texas are shown in Figure 7. Applications and offers have seen a steady rise since The number of Hispanics enrolled peaked in 1995 and declined by about 5,000 in Institutional Responses to Hopwood Institutions were asked to describe the impact of Hopwood and any changes made in recruitment, admissions, retention, financial aid or other programs as a result. Four community colleges reported the need to modify a financial aid program by either removing ethnicity as a factor (Alamo Community College District and Northeast Texas Community College), transferring the program to a private organization to administer (Alvin Community College), or discontinuing the program (Grayson Community College). Grayson
30 Community College reported that the only effect of the Hopwood decision would be "a possible slight decrease in Black and Hispanic enrollment." Otherwise, no impact was reported by community colleges. Most universities also report no impact on minority admissions from Hopwood. In fact, none of the universities outside of the eight most selective institutions (examined in Appendix C) reported any significant impact on minority admissions. Many of these schools have reported adjusting their recruitment, admissions, and financial aid processes as a result of the Hopwood decision. Some report fluctuations in minority applications, offers, and enrollments, but attribute those fluctuations to a variety of factors (e.g., declining overall enrollment, differences in population areas served and their demographic makeup) rather than a direct effect of the Hopwood decision. This data supports the idea that the effects of Hopwood are generally limited to institutions with more stringent selection criteria. In Appendix C, minority applications, offers, and enrollments at the eight most selective institutions are examined. 1. It was discovered in 1998 that six universities had included provisionally admitted summer enrolled students in their counts, making some comparisons inappropriate. These institutions argue that fall enrollment figures (without the summer enrollment figures) provide a less accurate picture of diversity at institutions with summer programs designed to encourage and facilitate minority enrollment and success since these minority students could not be counted as first-time enrolled in the fall. In the appendix following this one, the summer/fall data from 1993 through 1998 for the eight most selective institutions are examined separately.
31 APPENDIX C: TEXAS PUBLIC UNIVERSITY UNDERGRADUATE MINORITY APPLICATIONS, OFFERS, AND ENROLLMENTS AT THE EIGHT MOST SELECTIVE INSTITUTIONS This appendix describes the number of African-American and Hispanics making application to, receiving offers from, and enrolling in the eight most selective undergraduate universities in Texas. Institutions reported the number of applications, offers, and fall admissions to the Coordinating Board for the five years 1994 through Data are reported for the eight institutions collectively and individually. African-American Students Figure 8 shows the number of applications, offers, most first-time freshmen enrollments for
32 African-American students at the eight selective public universities combined. Applications and offers have continued to increase each year from 1994 through 1998, although between 1996 and 1997 that rate of growth slowed considerably. First-time enrollments of African-Americans at the eight most selective institutions collectively declined in 1997 after a previous period of steady growth, but rebounded to an all-time high in There are major differences between the eight most selective institutions in African-American applications, offers, and enrollments before and after Hopwood. Five schools reported a decline in first-time enrollment for African-Americans in 1997, although for a number of these this decline began in the years before Hopwood. At The University of Texas at Austin (see Figure 9), the number of applications, offers and firsttime enrollments of African-Americans declined in Note, however, that first-time
33 enrollments had been declining since 1994, despite increases in the number of applications from 1994 through First-time enrollments increased in 1998, although the number of offers continued to decline. Applications also increased in 1998 over the previous year, however, in 1998 the number of applications and offers are among the lowest of the five years reported. Figure 10 shows that Texas A&M University also experienced a drop in applications, offers, and first-time African-American freshmen enrollments (1) in The drop in first-time enrollments in 1997 was part of a decline that goes back to at least 1994, despite an increase in the number of applications from 1994 through First-time enrollments of African-Americans increased in 1998 but not enough to reach any pre-hopwood level. Also in 1998, the number of applications and offers are the lowest among the five years reported.
34 Texas Tech University (see Figure 11) experienced a decrease in both the number of offers made to African-Americans and their first-time enrollment in 1997, despite an increase in the number of applications. This decrease in offers and enrollments contrasted with the preceding year, in which both offers and enrollments increased. In 1998, however, offers and enrollments continued to decrease, and the number of applications also declined.
35 At the University of North Texas, first-time enrollments of African-Americans decreased in 1997 but climbed again in 1998 to a level much greater than any pre-hopwood year reported (see Figure 12). Applications and offers have continued to increase since 1994.
36 Figure 13 shows that Southwest Texas State University experienced a decline in the number of offers and first-time enrollments for African-Americans in 1997 despite an increase in the number of applications. This contrasts with 1996, when the number of applications, offers, and enrollments all increased, which itself contrasts with 1995 when these numbers all decreased in comparison to the previous year. This flip-flop continues in 1998 with an increase in the number of applications, offers, and first-time enrollments of African-Americans. The 1998 increase in African-American enrollment exceeds any pre-hopwood level.
37 The University of Texas at Dallas (see Figure 14) showed an increase in 1997 over the previous year in the number of African-Americans who applied, were offered admission, and enrolled. This increase is in contrast to the decline in applications, offers and admissions that occurred both in the previous year, 1996, and the year after Hopwood, 1998.
38
39 Two schools clearly unaffected by Hopwood are Texas A&M University-Corpus Christi (2) (see Figure 15) and the University of Houston (see Figure 16). Both schools have seen no declines in the number of African-American applications, offers, and first-time enrollments over each year examined in this report.
40 Hispanic Students Figure 17 shows that Hispanic applications, offers, and first-time enrollments for the eight most selective public universities in Texas all declined in In 1998, applications, offers, and firsttime enrollments again increased to the highest levels in the reporting period.
41 The University of Texas at Austin (see Figure 18) reported decreases in the number of Hispanic applications, offers, and enrollments in 1997, but only the number of offers had consistently increased since In 1998, the number of applications, offers, and first time enrollments all increased.
42 At Texas A&M University, the number of Hispanic applications, offers, and enrollments (3) all decreased in 1997 from the previous year (see Figure 19), a continuation of decreases in the previous year and in contrast to the increases in In 1998, the number of applications and offers continued to decrease but first-time Hispanic enrollments increased.
43 Texas Tech University also reported a decline in applications, offers, and first-time enrollments for Hispanics in 1997 (see Figure 20). This decline, also seen in 1996, contrasts with the increases reported for In 1998, the number of applications declined by one, while both offers and enrollments increased. However, 1998 Hispanic first-time enrollments do not approach pre-hopwood levels.
44 First-time enrollments of Hispanics declined in 1997 at Southwest Texas State University, although applications and offers increased (see Figure 21). While the highest levels for applications, offers, and first-time enrollments were reported in 1994, by 1998 the university reported the highest levels since then.
45 At the University of North Texas (see Figure 22), both the number of offers and first-time enrollments of Hispanics decreased in With these two exceptions, however, the number of applications, offers, and enrollments have increased since 1994 with the highest levels reported in 1998.
46 Figure 23 shows the applications, offers, and first-time enrollments of Hispanics at The University of Texas at Dallas. No declines in applications, offers, or first-time enrollments were reported for The number of applications, offers, and first-time enrollments in 1998 were the highest in the reporting period.
47 With the single exception of a decline in offers to Hispanics in 1995, the University of Houston (see Figure 24) has shown a consistent increase in Hispanic applications, offers and first-time enrollments over the reporting period.
48 This same consistent yearly increase in the number of applications, offers, and enrollments of Hispanics is reported by Texas A&M University-Corpus Christi (see Figure 25). As with African- American enrollments, Hopwood has not prevented the University of Houston and Texas A&M University-Corpus Christi from continuing to increase their enrollment of minority students. Institutional Responses to Hopwood While all eight universities have had a number of programs in place since 1994 to attract and retain African-American and Hispanic students, only The University of Texas at Austin and Texas A&M University used race/ethnicity as a factor for admissions purposes prior to Hopwood in 1994, 1995, and Both of these institutions reported declines in minority enrollment before Hopwood -- declines that continued into Both, however, also report increases in first-time minority enrollment in 1998, although the gains are relatively small.
49 Three of the eight most selective institutions show continued increases in minority applications, offers and enrollments -- The University of Texas at Dallas, the University of Houston, and Texas A&M University-Corpus Christi. These institutions cite the diversity of the regions they serve as a major factor in these increases. Regional factors are also cited by Texas Tech University, which saw declines in both Hispanic and African-American offers and enrollments since before Hopwood. In 1998, Texas Tech University managed to increase its first-time enrollments of Hispanics, but a decline in African- American first-time enrollments continued. The University of North Texas and Southwest Texas State saw slight declines in minority firsttime offers and enrollment following the Hopwood decision in 1997 but have increased their numbers to equal or surpass the 1996, pre-hopwood levels. These institutions credit aggressive and comprehensive recruitment activities. In fact, each of the eight most selective institutions report more aggressive and comprehensive recruitment activities as a major response to Hopwood. 1. Texas A&M University asked that we show their calculations of the enrollment figures. Their numbers are printed in the graph above the enrollment line. The enrollment figures from the CBM-001 report are shown below the enrollment line. 2. Texas A&M University-Corpus Christi could only provide complete applications, offers, and first-time enrollment data for 1996 and subsequent years due to the loss of data that occurred as a result of implementing a new admissions data management system in Texas A&M University asked that we show their calculations of the enrollment figures. Their numbers are printed in the graph above the enrollment line. The enrollment figures from the CBM-001 report are shown below the enrollment line.
50 APPENDIX D: TEXAS PUBLIC UNIVERSITY GRADUATE SCHOOL APPLICATIONS, OFFERS, AND ENROLLMENTS This appendix describes the number of African-American and Hispanics making application to, receiving offers from, and enrolling in graduate schools in the public universities in Texas. Data are reported for all graduate institutions as a group, and The University of Texas at Austin and Texas A&M University graduate schools. African-American Students Applications, offers, and enrollments of first-time entering African-American graduate students in public universities in Texas are shown in Figure 26. The number of applications and offers decreased in 1997, the first post-hopwood year, but the number of enrollments continued to
51 increase. Figure 27 shows the graduate school figures for African-Americans at The University of Texas at Austin. A definite Hopwood effect is noted in 1997 for applications, offers, and enrollments. However, offers to African-Americans have been declining since 1991.
52 Figure 28 shows the graduate school application data for African-Americans at Texas A&M University. In 1997, enrollments increased by two students despite the decrease in both applications and offers. However, the decrease in applications, offers, and enrollments in 1995, before Hopwood, is more dramatic than the post-hopwood effects noted. In summary, African-Americans applications and offers decreased after Hopwood, although firsttime enrollments across all graduate schools continued to increase. The two most selective graduate institutions saw a decline in applications and offers in 1997 but Texas A&M University first-time African-American enrollments increased by two students over the previous, pre- Hopwood, year while The University of Texas at Austin saw a decline from 87 to 51 students over the same period. Hispanic Students
53 Figure 29 shows the applications, offers, and enrollments of first-time entering Hispanic graduate students at public universities in Texas. The number of offers was down slightly in 1997, although the numbers of applications and enrollments increase substantially. Previously, the number of applications, offers, and enrollments of Hispanics steadily increased in 1991, 1993, and 1995.
54 At The University of Texas at Austin (Figure 30), the number of applications, offers, and enrollments of Hispanics decreased in 1997 after steadily increasing each previous reporting period.
55 Applications from Hispanics at Texas A&M University have hovered around 248 students except in 1993, where it peaked at 280 (see Figure 31). Offers and enrollments of Hispanics declined by five and eight students, respectively, in While the number of offers has been declining since its peak year in 1993, the number of Hispanics enrolled as first-time freshmen increased each year through In summary, while Hispanic first-time enrollment in public graduate schools continued to increase after Hopwood, enrollment declined at the most selective institutions, The University of Texas at Austin, and Texas A&M University. Institutional Responses to Hopwood Institutional responses to Hopwood vary a great deal. Some institutions, such as the University
56 of Houston, claim that no programmatic changes have been necessary since they have been successful at maintaining a diverse graduate student body. Others, such as Texas Tech University, describe a multitude of adapted or newly created programs to increase diversity in the wake of Hopwood. These programs include the development and distribution of written recruitment material, streamlining application procedures, campus visits, networking with professional and student groups, special conferences, mentoring, revision of selection criteria and procedures, and focused use of technology (e.g., web pages). It is difficult to discern which programs at a particular institution are most successful. It is also unclear why some programs are successful at one institution but not at others. Two reasons are consistently cited by institutions that are struggling to maintain what diversity they had before Hopwood - a lack of applicants and the inability to target financial aid. Much work has been focused on these challenges.
57 APPENDIX E: TEXAS MEDICAL SCHOOL APPLICATIONS, OFFERS, AND ENROLLMENTS This appendix describes the number of African-Americans and Hispanics making application to, receiving offers from, and enrolling in medical schools in Texas. Texas medical schools saw a dramatic decline in minority participation in 1997, the year after Hopwood. Generally, the 1998 application and offers data show a slight rebound in minority participation from the significant declines in 1997 but there are still problems. Institutions are working to adjust their admissions and recruitment processes to increase the numbers; however, their success has been limited. Figure 32 shows that 665 of medical school applicants did not provide race or ethnicity information on their applications. This represents only 3.6 percent of the almost 19,000
58 applications for the year. This is consistent with previous years. In fact, the number of applications with unreported race or ethnicity data was about 3 percent of the applications for each of the previous years. African-American Students Figure 33 shows the offers and enrollments for African-Americans at the eight medical schools in Texas for each year since With one exception (the number of offers did not change from 1995 to 1996), the number of offers to and enrollments of African-Americans have continued to increase since There was, however, a dramatic decline in offers to African- Americans -- from 110 in 1996 to 60 in In 1998, the number of offers rebounded - 92 offers were made to African-Americans by the medical schools. A similar decline in first-time enrollment was noted in 1997, when 40 African-Americans enrolled in medical school for the
59 first-time, down from 67 the year before. First-time enrollments increased again in 1998 to 55. These 55 African-Americans make up 4 percent of the 1,266 first-time students in The University of Texas Medical Branch at Galveston has for the past several years admitted and enrolled in their entering classes more African-Americans per year than any other medical school (Figure 34). A similar number of applications is received by The University of Texas Health Science Center at Houston, and only about 20 fewer applications are received per year from The University of Texas Health Science Center at San Antonio and The University of Texas Southwestern Medical School at Dallas, all of whom, as will be shown, offer and enroll fewer African-Americans. Nevertheless, applications, offers, and enrollments of African-Americans at The University of Texas Medical Branch in Galveston declined between 1996 and While applications
60 continued to decline in 1998 and offers were only up by one, first-time enrollment of African- Americans new students -- is similar to pre-hopwood numbers and represents 42 percent of the 55 total first-time students in medical school. Figure 35 shows the applications, offers, and enrollments for African-Americans at Baylor College of Medicine. Pre-Hopwood, the number of offers to African-Americans climbed within the range of those of The University of Texas Medical Branch at Galveston, although enrollment was somewhat less. While applications from African-Americans rose by two in 1997, both offers and enrollments declined. In 1998, the number of offers continued to decline, but first-time enrollment is up one student, to 14 of the 55 African-Americans (25 percent) admitted to all medical schools in Texas in 1998.
61 The University of Texas Southwestern Medical Center at Dallas is another medical school that makes offers to substantial numbers of African-Americans. Figure 36 shows that the number African-Americans who enroll is typically much less than those offered admittance. Between 1996 and 1997, the offers dropped from 21 to two and enrollment decreased from eight to one. Nevertheless, offers and enrollments have increased in 1998 to pre-hopwood levels at 17 offers, and seven of the total 55 African-American enrollments at all medical schools.
62 As noted, The University of Texas Health Science Center at Houston (Figure 37) receives almost as many applications from African-Americans as The University of Texas Medical Branch at Galveston. But the number to whom offers are made is relatively low and the number who enroll even lower. A post-hopwood decline in 1997 resulted in offers to three applicant resulting in the enrollment of one student. In 1998, the number of offers to African-Americans increased to pre-hopwood levels at 13 and the number of first-time enrolled increased to six students.
63 Figure 38 shows the number of applications, offers, and enrollments for African-Americans at The University of Texas Health Science Center at San Antonio. Again, the number of applications is among the highest of the medical schools, but the number of offers and enrollments is among the lowest. In fact, the major drop in offers and enrollments occurred in Since then, an increase in offers and enrollments of one or two students a year has not brought the numbers to pre-1996 levels. The four first-time enrolled African-American students represent 7 percent of the 55 admitted statewide.
64 Figure 39 shows the applications, offers, and enrollments for African-Americans at Texas A&M University Medical School. Hopwood's effects resulted in no offers, and subsequently no enrollments, of African-Americans in In 1998, six offers were made but no African- American enrolled at this school.
65 Figure 40 shows the number of applications, offers, and enrollments of African-Americans at Texas Tech University Health Sciences Center. Offers and enrollments of African-Americans have never numbered above four, so any Hopwood effect is difficult to discern. For the two years post-hopwood, however, no African-American has enrolled at this medical school.
66 The University of North Texas Health Science Center at Fort Worth (see Figure 41) reports eight or fewer offers or enrollments for African-American students over the reporting period. In 1997, first-time enrollment of African-Americans increased by one in 1997, but decreased by two in The one African-American enrolled in 1998 represents 2 percent of the 55 statewide. For 1998, four medical schools - The University of Texas Health Science Center at San Antonio, Texas A&M University Medical School, Texas Tech University Health Sciences Center, and the University of North Texas Health Science Center at Fort Worth - together enrolled six African-American students, accounting for 11 percent of all 55 first-time enrolling African-Americans. The University of Texas Medical Branch at Galveston and Baylor College of Medicine, with 37
67 entering African-Americans between them, account for 67 percent of African-Americans entering the 1998 medical school classes. Hispanic Students Figure 42 shows Hispanic applications, offers, and enrollments at the eight medical schools. Applications were down in 1997 and 1998 after a steady rise in previous years. There was a post-hopwood impact in 1997 with the number of offers to Hispanics dropping from 307 to 213. Both offers and first-time enrollments increased in 1998 to 245 and 161, respectively. The 161 first-time Hispanic enrollment in 1998 is 13 percent of the 1,266 first-time enrollees statewide.
68 Figure 43 shows the number of applications, offers, and enrollments for Hispanics at The University of Texas Medical Branch at Galveston. The Medical Branch is a leading enroller of Hispanics in medical schools in Texas, with 57 first-time entering Hispanics in A post- Hopwood dip in the number of offers and enrollments in 1997 was reversed in 1998 to numbers close to the high levels of The 56 first-time enrollees at The University of Texas Medical Branch at Galveston is 35 percent of the 161 first-time entering Hispanic statewide.
69 Figure 44 shows that the University of Texas Health Science Center at San Antonio has bounced back after a setback in Hispanic offers and enrollments in The number of offers and first-time enrollments of Hispanics is within the pre-hopwood range. The 1998 first-time entering Hispanic students is 36, 22 percent of the 161 statewide.
70 The University of Texas Health Science Center at Houston has also been a leading enroller of Hispanics at medical schools in Texas. Figure 45, however, shows a steady decline in offers for Hispanics since 1994 and continuing to First-time Hispanic enrollment declined from a high of 51 in 1994 to 36 in 1996, 37 in 1997, and 21 in The 21 first-time entering Hispanic students in 1998 represent 13 percent of the 161 first-time entering Hispanic students statewide.
71 At The University of Texas Southwestern Medical Center at Dallas (see Figure 46), a steep post-hopwood decline in offers for 1997 resulted in a loss of only three students. Despite a continuing decrease in applications in 1998, the 42 offers approached the 46 of Also, the 20 first-time entering Hispanics, 12 percent of the statewide total, is the highest ever.
72 Baylor College of Medicine also showed a decline in applications, offers, and enrollments of Hispanics in Figure 47 shows that in 1998, 15 Hispanics entered the medical school, an increase of one over the previous year. These 15 first-time enrollees is 9 percent of the 161 Hispanic first-time entering students statewide.
73 Figure 48 shows the applications, offers, and enrollments of Hispanics for the University of North Texas Health Science Center at Fort Worth. This school saw a decline in the number of offers for Hispanics since First-time enrollment of Hispanics increased by one student in 1997, but declined to six, or 4 percent of the 161 statewide.
74 The number of applications, offers, and enrollments of Hispanics at the Texas Tech University Health Sciences Center are shown in figure 49. Post-Hopwood declines in applications, offers, and enrollments continued into Note, however, that the largest decline in first-time enrollments occurred between 1995 and 1996, before Hopwood. Four first-time entering Hispanic students, 2 percent of the 161 statewide, are reported for 1998.
75 Texas A&M University Medical School showed a decline in the number of enrollments of Hispanics since 1996 (see Figure 50). After a decline from 24 to 13 in 1997, the number of offers held steady at 13 in 1998, despite a concurrent drop in the number of applications from Hispanics; however, enrollments dropped from seven to three, or 2 percent of the Hispanic firsttime medical school enrollees across the state. Two schools accounted for 57 percent of the incoming Hispanic medical school students - The University of Texas Medical Branch at Galveston and The University of Texas Health Science Center at San Antonio. Adding Hispanic first-time enrollments at The University of Texas Health Science Center at Houston or The University of Texas Southwestern Medical Center at Dallas brings this total to approximately 70 percent of the 161 first-time entering Hispanic medical school students.
76 Three medical schools - the University of North Texas Health Sciences Center at Fort Worth, Texas Tech University Health Sciences Center, and Texas A&M University Medical School - account for about 8 percent of the 161 first-time enrolling Hispanic students.
77 APPENDIX F: TEXAS PUBLIC LAW SCHOOL ENROLLMENTS, OFFERS, AND ENROLLMENTS This appendix describes the number of African-Americans and Hispanics making application to, receiving offers from, and enrolling in public law schools in Texas. The data are shown for all schools combined and for each school separately. There are four public law schools in Texas: The University of Texas at Austin School of Law, Texas Tech University Law School, University of Houston Law School, and Texas Southern University School of Law. Over the past six years, Texas Southern University, an historically Black institution, has accounted for two to ten times more African-Americans first-time entering students than the other three law schools combined. It also has the highest entry rate for Hispanics. Texas Southern University School of Law experienced little, if any impact from
78 Hopwood, thereby serving as a buffer, moderating the overall impact of Hopwood on the entry of minority students into public law schools in Texas. Because of the unique role of Texas Southern University School of Law, its numbers are also compared to the three other law schools combined. Applicants Whose Race/Ethnicity is Not Known Figure 51 shows the number of applicants statewide who have not provided race and ethnicity information on their applications to law school. Preliminary figures show a large increase in the number beginning in 1997 and continuing into In the context of all applications received, the percentage of those not reporting their ethnicity hovered at about 3 or 4 percent through 1996, rising to 8 percent in 1997 and 15 percent in This year, with 7,344 total applications, approximately one in seven applicants to law school did not report their race or ethnicity. African-American Students
79 Figure 52 shows the pre- and post-hopwood numbers for African-Americans at all the law schools combined. Texas Southern University's law school was unable to provide the number of offers made to applicants for the years 1993 through 1995, so only the 1996 (pre-hopwood) through 1998 data are shown. In 1997, about 100 fewer offers were made and about 50 fewer students enrolled. Applications, not shown in the figure, also declined from 1,423 to 1,066. In 1998, applications to all public law schools from African-Americans dropped by about 200 to 858, but the number of offers rose by 16 and the number of first-time enrollments increased by 22. In terms of first-time enrollment, almost one-half of the loss of 1997 was regained in 1998.
80 When Texas Southern University School of Law is omitted from the analysis, a somewhat different picture emerges (see Figure 53). In 1997, less than one-half as many offers were made to African-American applicants and only one-third as many enrollments were seen compared to the pre-hopwood year 1996 (which itself showed declining numbers). The 14 enrollments at the three schools are one-tenth of the 145 students enrolled at Texas Southern University School of Law. The 14 first-time entering African-American students in 1997 were among 997 students entering at these three law schools. In 1998, the number of offers to African-Americans at the three predominately White law schools increased by 26 from 47 in First-time enrollments increased from 14 to 21. The 21 enrollments compare to the 160 first-time enrollments at the Texas Southern University School of Law and to the 1,027 combined total first-time enrollments at the three other law schools.
81 Figure 54 shows the applications, offers, and enrollments for African-Americans at Texas Southern University School of Law. In 1997, about 40 fewer offers were made and 16 fewer African-Americans enrolled compared to In 1998, the number of offers continued to decline, but first-time enrollments totaled only one less than occurred in As noted, Texas Southern University School of Law has played a particularly important function in the diversity of the public law school student body because it has traditionally been responsible for educating a great many of the African-American law students in Texas. The following table shows the percentage of the total African-American public law school student body that applies, is offered, and enrolls at TSU School of Law. Year Applications Offers Enrollment
82 percent Not available 70.6 percent percent Not available 68.4 percent percent Not available 70.4 percent percent 72.2 percent 77.8 percent percent 83.8 percent 91.2 percent percent 76.2 percent 87.4 percent The major decrease in offers to African-Americans in 1997 occurred at The University of Texas at Austin School of Law (see Figure 55), down from 65 offers in 1996 to 11 offers in Offers in 1998 are more than twice those in 1997, for an increase of 14, which is still substantially less than the 65 offers in 1996.
83 There was also a decrease in enrollments of African-Americans at The University of Texas at Austin School of Law from 31 in 1996 to four in Enrollments increased by 100 percent, to eight, in Both offers to and enrollments of African-Americans at The University of Texas at Austin School of Law have declined since The number of applications in 1998 is less than one-half of what they were in Texas Tech University Law School (see Figure 56) saw declines in applications, offers, and enrollments of African-Americans in 1997, but had seen similar declines in The number of applications in 1998 remained constant, but both offers and enrollments increased in 1998 to above 1996 levels. The five first-time entering African-American students in 1998 are part of a total entering class of 217 at the law school and a total entering class of 1,027 at all the public law schools in Texas.
84 Figure 57 shows that the University of Houston Law School saw a steep decline in applications in 1997 but managed to hold the line on the number of offers that year over the previous year. Enrollments of African-Americans were down by two in 1997 and another one in 1998, but had been declining since The eight enrollments in 1998 are part of the total entering class of 342 at the law school. Hispanic Students
85 Figure 58 shows that for Hispanics (1), enrollments at the public law schools in Texas declined slightly, from 163 in 1996 to 132 in 1997, although the number of offers declined only by one. Both offers and enrollments increased in 1998 to surpass those of The number of applications, however, declined from 1,182 in 1996 to 1,045 in 1997 and 1,023 in 1998.
86 Figure 59 shows the number of Hispanic applicants, offers, and enrollees at the three predominately White law schools. First-time enrollments of Hispanics decreased from 1993 through 1997 but 1998 shows an increase equivalent to the total decline in the three previous years. The number of offers shows a similar pattern.
87 Texas Southern University School of Law (see Figure 60) continues to enroll the highest number of Hispanic first-time entering students, showing no post-hopwood drop in 1997 and an increase of three in The following table shows that TSU has, until 1998, been responsible for an increasingly larger percentage of Hispanics applying, offered admission, and enrolling in all public law schools in Texas. Year Applications Offers Enrollment percent Unavailable 29.5 percent percent Unavailable 32.7 percent percent Unavailable 34.6 percent
88 percent 35.0 percent 40.5 percent percent 40.3 percent 43.2 percent percent 33.7 percent 37.6 percent Figure 61 shows the number of applications, offers, and enrollments of Hispanics to the University of Houston Law School. The number of applications from Hispanics has declined since A relatively large decrease in offers is observed after the peak of 100 offers in 1994 to 77 offers in The number of offers increased over the Hopwood period from 78 in 1996 to 90 in The number of offers, however, declined by eight in The number of Hispanic first-time enrollees remained constant from 1996 to 1997 and increased by three in 1998.
89 Figure 62 shows that for The University of Texas at Austin law school, the applications, offers, and enrollments of Hispanics declined from 1995 to 1996 and again, more markedly, from 1996 to In 1998, the number of applications, offers, and enrollments all increased to pre- Hopwood levels.
90 Texas Tech University Law School (see Figure 63) has increased the number of offers made to Hispanics each year since 1995, despite a drop in applications beginning in There were six fewer first-time enrollees in 1997, but five more first-time enrollees in 1998 compared to Institutional Responses to Hopwood Institutions were asked to describe the impact of Hopwood and any changes in recruitment, admissions, retention, financial aid, or other programs at their law schools made as a result. Texas Southern University reported no Hopwood impact and no changes in its programs as a result of Hopwood.
91 The University of Texas at Austin School of Law, Texas Tech University School of Law, and University of Houston Law School all report modifications of their admissions procedures, placing more weight on factors other than grade point average and scores on the primary law school admissions test, the LSAT. The University of Texas listed 19 "other" factors; Texas Tech University listed 15. The University of Houston noted that "other" factors now comprise 70 percent of its admission index, as compared to 30 percent devoted to the LSAT and grade point average, a reversal of earlier weighting. These three law schools also report an expansion of recruitment activities, including alumni contact with prospective students, direct faculty contact both on and off campus, active involvement by student groups, private scholarship development, and efforts to work with undergraduate institutions to develop and encourage participation in pre-law curriculums. The inability to target financial aid to minority students was considered a major challenge to attracting more minority students by these three law schools. The University of Texas cited numerous efforts to encourage private scholarship funds for minority students. Efforts to recruit minorities seem limited in their effectiveness, based on declines in applications from minority students. The efforts focused on admissions, on the other hand, appear to be somewhat effective, showing an increase in offers to minority students in the year immediately following Hopwood. Many law school officials say that the lack of targeted financial aid is responsible for the lag in enrollments, despite the increase in offers in 1998, although no direct proof is available. Collectively, these efforts have been more fruitful for Hispanics than African-Americans in terms of offers and enrollments in the public law schools in Texas. But while the data from 1998 showed Hispanic participation at pre-hopwood levels, the fact is that both Hispanics and African-Americans are well under-represented in three of the four public law schools in Texas, a fact demonstrated even more clearly when total student body enrollment is considered in Appendix H of this report. 1. The University of Texas at Austin School of Law reported only Mexican-American students in the "Hispanic" category. The university chose to count Hispanics other than Mexican Americans in the "Other" category. Since the "Other" category is predominately, and, at least for 1998 enrollments, exclusively non-mexican-american Hispanic, the "Other" category is included in the "Hispanic" counts for The University of Texas School of Law.
92 APPENDIX G: TEXAS PUBLIC UNIVERSITY UNDERGRADUATE DIVERSITY The impact of Hopwood, as observed at the most prestigious of the public institutions of higher education in Texas, is marked, negative, and apparently difficult to remedy. The impact is even more troubling when it is understood that its greatest impact is felt at schools with student bodies in which minorities have historically been under-represented. This appendix describes the diversity of each public undergraduate university in Texas. Also shown are the five institutions with the highest percentage and the five institutions with the highest number of each racial/ethnic group. Minority Participation in Higher Education Statewide, the university student body is 62 percent White, 9 percent African-American, 19 percent Hispanic, and five percent Asian American. However, no university in Texas has a similar racial/ethnic makeup. In fact, there is a great deal of variation in the diversity of student bodies across institutions, reflecting differences in institutional mission, size, admissions criteria, campus climate, and catchment area (i.e., areas of the state from which students are recruited). As seen in Figure 64, eight schools have 85 percent or more of their student body comprised of one racial or ethnic group. Four are predominately White, two are predominately Hispanic, and two are predominately African-American. None of the eight most selective schools are in this group.
93 Figure 65 shows the 10 universities in Texas that have 75 percent to 84 percent of their student body comprised of one racial or ethnic group. Nine of these institutions are predominately White with the other predominately Hispanic. Three of the most selective institutions are included in this group: Texas Tech University, the University of North Texas, and Texas A&M University. Thus, 18 of the 35 public universities (51 percent) in the state have student bodies in which at least three out of four students are of a single racial or ethnic group.
94 Another nine institutions have 66 percent to 74 percent of their student body comprised of a single racial or ethnic group (see Figure 66). Thus, 27, or 77 percent, of the 35 public universities in Texas have student populations in which approximately two of three students are of one racial or ethnic group. One of the most selective schools, Southwest Texas State University, is included in this group.

95 Figure 67 shows the seven universities that have 50 percent to 66 percent of their student body comprised of a single ethnic group. Four of the most selective schools - The University of Texas at Austin, The University of Texas at Dallas, Texas A&M University-Corpus Christi, and the University of Houston - are represented in this group.
96 Demographic trends predict that within the first decade of the next century, the Texas population as a whole will not have any ethnic group that is in the majority (i.e., that constitutes more than 50 percent of the population). As of 1997, only two universities do not have a single ethnic group constituting more than 50 percent of the student body - The University of Texas at San Antonio and the University of Houston-Downtown. Enrollment Clustering of Minorities Table 1 Institutions with the Highest Percentage of Institutions with the Highest Number of
97 African-American Students Percent African-American Students Total Number 35,808 Prairie View A&M University 86% Texas Southern University 6,247 Texas Southern University 86% Prairie View A&M University 5,166 University of Houston-Downtown 26% University of Houston 3,573 Lamar University 16% University of Houston-Downtown 2,097 Texas A&M Uni. -Commerce 14% University of North Texas 1,871 Total of these five institutions 15,892 (44%) Total of these five institutions 18,954 (53%) Hispanic Students Percent Hispanic Students Total Number 74,367 Texas A&M International Univ. 88.8% UT-Pan American 10,735 UT-Pan American 85.9% UT-El Paso 10,038 UT-Brownsville 82.7% UT-San Antonio 7,092 Sul Ross-Rio Grande College 70.8% UT-Austin 6,148 UT-El Paso 66.1% University of Houston 4,704 Total of these five institutions 26,389 (35%) Total of these five institutions 38,717 (52%) White Students Percent White Students Total Number 245,634 Tarleton State University 90.4% UT-Austin 32,069 Texas A&M at Galveston 88.9% Texas A&M University 29,440 Texas A&M at Texarkana 87.4% Texas Tech University 20,536 UT-Tyler 85.9% University of North Texas 19,426 Stephen F. Austin State Univ. 84.3% University of Houston 16,062 Total of these five institutions 20,743 (8%) Total of these five institutions 117,533 (48%)
98 Asian Students Percent Asian Students Total Number 20,897 5,300 University of Houston 15.7% UT-Austin UT-Dallas 15.2% University of Houston 4,971 University of Houston-Downtown 11.5% UT-Arlington 2,084 UT-Austin 10.8% UT-Dallas 1,417 UT-Arlington 10.8% Texas A&M University 1,211 Total of these five institutions 14,706 (70%) Total of these five institutions 14,983 (72%) Table 1 lists the five institutions with the highest percentage and the five institutions with the highest number of each racial/ethnic group of the 35 institutions examined. The number of students enrolled at the five institutions is listed for each set and the percentage of all students enrolled of that racial/ethnic group is shown in parentheses. The total number of students enrolled is listed under the heading "Total Number" for each group. African-American Students: The five campuses with the largest percentage of African-American students include two with specific historical and mission-related service to this group - Prairie View A&M University (86 percent) and Texas Southern University (86 percent). With the exception of these two schools, the highest percentage of African-American students at any school is no more than 26 percent (University of Houston-Downtown), with the remaining schools having 16 percent or less. Altogether, these five institutions account for 44 percent of all African-American students in public universities in Texas. All five institutions are within 100 miles of a major metropolitan city; four are within 100 miles of Houston with one close to the Dallas-Fort Worth Metroplex. The five campuses with the largest number of African-American students include three with the highest percentage - Texas Southern University, Prairie View A&M University, and the University of Houston-Downtown. The University of Houston and the University of North Texas are also on this list and together the five universities account for 53 percent of all African- American students at public universities in Texas. The same geographic pattern holds for schools with the highest number of African-American students. Four are concentrated in the Houston area; one is near Dallas. Hispanic Students: The five universities with the largest percentage of Hispanic students are located along the border from El Paso to Brownsville. Together these schools enrolled 35 percent of all the Hispanic students attending universities in With respect to the five
99 institutions with the highest number of Hispanic students, the large border-area universities -- The University of Texas-Pan American and The University of Texas at El Paso - are included, as well as The University of Texas at San Antonio, The University of Texas at Austin and the University of Houston. These five schools enroll 52 percent of all Hispanics enrolled in public universities in Texas. White Students: The five universities with the largest percentage of White students enrolled 8 percent of all those students enrolled in public universities in Texas. With the exception of Stephen F. Austin State University, these are all relatively small institutions - total enrollment of these five institutions together is 23,983 students, which is 6 percent of all students enrolled in universities. Four of the institutions are located in East Texas; Tarleton State University is located near the Dallas-Fort Worth Metroplex. The five universities with the largest number of White students are also the five largest universities in total enrollment. Together, these five schools enroll 48 percent of all White students enrolled in public universities in Texas. Three are in the large metropolitan areas of Houston, the Dallas-Fort Worth Metroplex, and Austin, while two are located in Lubbock and Bryan/College Station. Asian Students: The five universities with the largest percentage of Asian students are, with one exception (The University of Houston-Downtown), the same universities with the largest number of Asian students (Texas A&M University is the exception). Most of these universities are located in the large metropolitan areas of Houston, the Metroplex, or Austin with the exception of Texas A&M University, located in the more rural setting of Bryan/College Station. The five universities with the highest percentage of Asian students account for 70 percent of all Asian students enrolled in public universities. The five universities with the highest number of Asian students account for 72 percent of all Asian students enrolled. Summary: For African-American students, attendance is primarily concentrated in the Houston region, primarily at the two historically black institutions, Prairie View A&M University and Texas Southern University. Hispanic students are the largest percentage of the student body in schools along the Rio Grande, but the largest number of them go to the largest institutions on the Border, San Antonio, Houston and Austin. White students are the largest percentage of the student body at relatively smaller institutions in East Texas, but most are enrolled at the five largest and most selective universities in Texas. Asian students make up a large percentage of the student body and are concentrated in larger and more selective universities, primarily in Houston, the Metroplex, and Central Texas. Of the eight most selective universities in Texas, none are included in the top five institutions with the highest percentage of African-American students, Hispanic students, or White students. The University of Houston, The University of Texas at Dallas, and The University of Texas at Austin are on the list of the top five institutions with the highest percentage of Asian
100 students. With respect to the number of students, the University of Houston is represented in the top five institutions for each racial/ethnic group examined. For White students, five of the eight most selective institutions are represented in the top five and for Asian students, four of the eight most selective institutions are represented. The University of North Texas is on the top five list for the number of African-American students and The University of Texas at Austin is on the top five list for the number of Hispanic students.
101 APPENDIX H: TEXAS PUBLIC GRADUATE, LAW, AND MEDICAL SCHOOL DIVERSITY This appendix describes the diversity of the public graduate and professional schools in Texas. Figure 68 shows that African-American and Hispanic enrollment at public graduate schools in Texas in 1997 was the highest it has ever been. Nevertheless, as seen in Figure 69, only 7 percent of the graduate student body is African-American and only 12 percent is Hispanic.
102
103 The number and percentage of African-American and Hispanic students in public law schools in Texas are shown in Figures 70 and 71, respectively. Overall, the law school student body in 1997 was 12 percent African-American and 11 percent Hispanic. Like the ethnic differentiation in undergraduate institutions, this diversity is gained by over-representation in one program (Texas Southern University) and under-representation in the others.
104 Figures 72 and 73 show the number and percentage of African-American and Hispanic students in medical institutions in Texas. Medical school enrollment was 5 percent African- American and 14 percent Hispanic in 1997, again a high, the same percentage as in 1996 and, again, the highest it has ever been.
105
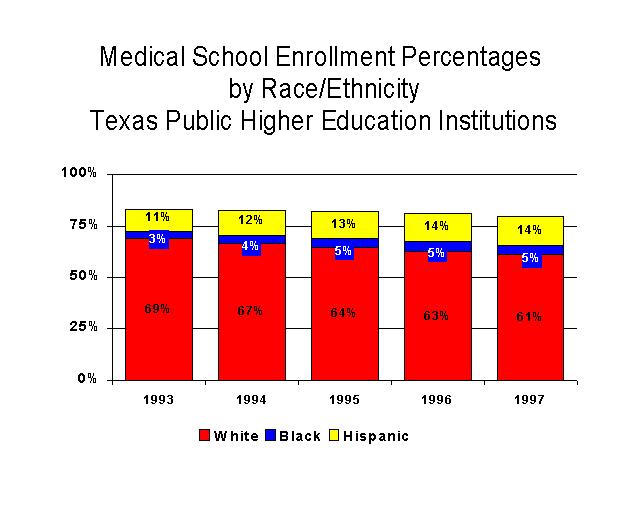
106
EDUCATIONAL ATTAINMENT
 EDUCATIONAL ATTAINMENT By 2030, at least 60 percent of Texans ages 25 to 34 will have a postsecondary credential or degree. Target: Increase the percent of Texans ages 25 to 34 with a postsecondary credential.
GRADUATE STUDENTS Academic Year
 Financial Aid Information for GRADUATE STUDENTS Academic Year 2017-2018 Your Financial Aid Award This booklet is designed to help you understand your financial aid award, policies for receiving aid and
EDUCATIONAL ATTAINMENT
 EDUCATIONAL ATTAINMENT By 2030, at least 60 percent of Texans ages 25 to 34 will have a postsecondary credential or degree. Target: Increase the percent of Texans ages 25 to 34 with a postsecondary credential.
Moving the Needle: Creating Better Career Opportunities and Workforce Readiness. Austin ISD Progress Report
 Moving the Needle: Creating Better Career Opportunities and Workforce Readiness Austin ISD Progress Report 2013 A Letter to the Community Central Texas Job Openings More than 150 people move to the Austin
The University of North Carolina Strategic Plan Online Survey and Public Forums Executive Summary
 The University of North Carolina Strategic Plan Online Survey and Public Forums Executive Summary The University of North Carolina General Administration January 5, 2017 Introduction The University of
Governors and State Legislatures Plan to Reauthorize the Elementary and Secondary Education Act
 Governors and State Legislatures Plan to Reauthorize the Elementary and Secondary Education Act Summary In today s competitive global economy, our education system must prepare every student to be successful
U VA THE CHANGING FACE OF UVA STUDENTS: SSESSMENT. About The Study
 About The Study U VA SSESSMENT In 6, the University of Virginia Office of Institutional Assessment and Studies undertook a study to describe how first-year students have changed over the past four decades.
A Diverse Student Body
 A Diverse Student Body No two diversity plans are alike, even when expressing the importance of having students from diverse backgrounds. A top-tier school that attracts outstanding students uses this
Race, Class, and the Selective College Experience
 Race, Class, and the Selective College Experience Thomas J. Espenshade Alexandria Walton Radford Chang Young Chung Office of Population Research Princeton University December 15, 2009 1 Overview of NSCE
Practices Worthy of Attention Step Up to High School Chicago Public Schools Chicago, Illinois
 Step Up to High School Chicago Public Schools Chicago, Illinois Summary of the Practice. Step Up to High School is a four-week transitional summer program for incoming ninth-graders in Chicago Public Schools.
Final. Developing Minority Biomedical Research Talent in Psychology: The APA/NIGMS Project
 Final Report Developing Minority Biomedical Research Talent in Psychology: A Collaborative and Systemic Approach for Strengthening Institutional Capacity for Recruitment, Retention, Training, and Research
Kansas Adequate Yearly Progress (AYP) Revised Guidance
 Revised Guidance") Kansas State Department of Education Kansas Adequate Yearly Progress (AYP) Revised Guidance Based on Elementary & Secondary Education Act, No Child Left Behind (P.L. 107-110) Revised May 2010 Revised May
Kansas State Department of Education Kansas Adequate Yearly Progress (AYP) Revised Guidance Based on Elementary & Secondary Education Act, No Child Left Behind (P.L. 107-110) Revised May 2010 Revised May
Cuero Independent School District
 Cuero Independent School District Texas Superintendent: Henry Lind Primary contact: Debra Baros, assistant superintendent* 1,985 students, prek-12, rural District Description Cuero Independent School District
Data Glossary. Summa Cum Laude: the top 2% of each college's distribution of cumulative GPAs for the graduating cohort. Academic Honors (Latin Honors)
") Institutional Research and Assessment Data Glossary This document is a collection of terms and variable definitions commonly used in the universities reports. The definitions were compiled from various
Institutional Research and Assessment Data Glossary This document is a collection of terms and variable definitions commonly used in the universities reports. The definitions were compiled from various
An Empirical Analysis of the Effects of Mexican American Studies Participation on Student Achievement within Tucson Unified School District
 An Empirical Analysis of the Effects of Mexican American Studies Participation on Student Achievement within Tucson Unified School District Report Submitted June 20, 2012, to Willis D. Hawley, Ph.D., Special
Invest in CUNY Community Colleges
 Invest in Opportunity Invest in CUNY Community Colleges Pat Arnow Professional Staff Congress Invest in Opportunity Household Income of CUNY Community College Students
ADMISSION TO THE UNIVERSITY
 ADMISSION TO THE UNIVERSITY William Carter, Director of Admission College Hall 140. MSC 128. Extension 2315. Texas A&M University-Kingsville adheres to high standards of academic excellence and admits
Evaluation of Teach For America:
 EA15-536-2 Evaluation of Teach For America: 2014-2015 Department of Evaluation and Assessment Mike Miles Superintendent of Schools This page is intentionally left blank. ii Evaluation of Teach For America:
NBER WORKING PAPER SERIES WOULD THE ELIMINATION OF AFFIRMATIVE ACTION AFFECT HIGHLY QUALIFIED MINORITY APPLICANTS? EVIDENCE FROM CALIFORNIA AND TEXAS
 NBER WORKING PAPER SERIES WOULD THE ELIMINATION OF AFFIRMATIVE ACTION AFFECT HIGHLY QUALIFIED MINORITY APPLICANTS? EVIDENCE FROM CALIFORNIA AND TEXAS David Card Alan B. Krueger Working Paper 10366 http://www.nber.org/papers/w10366
BASIC EDUCATION IN GHANA IN THE POST-REFORM PERIOD
 BASIC EDUCATION IN GHANA IN THE POST-REFORM PERIOD By Abena D. Oduro Centre for Policy Analysis Accra November, 2000 Please do not Quote, Comments Welcome. ABSTRACT This paper reviews the first stage of
The Talent Development High School Model Context, Components, and Initial Impacts on Ninth-Grade Students Engagement and Performance
 The Talent Development High School Model Context, Components, and Initial Impacts on Ninth-Grade Students Engagement and Performance James J. Kemple, Corinne M. Herlihy Executive Summary June 2004 In many
University of Essex Access Agreement
 University of Essex Access Agreement Updated in August 2009 to include new tuition fee and bursary provision for 2010 entry 1. Context The University of Essex is academically a strong institution, with
Transportation Equity Analysis
 2015-16 Transportation Equity Analysis Each year the Seattle Public Schools updates the Transportation Service Standards and bus walk zone boundaries for use in the upcoming school year. For the 2014-15
Core Strategy #1: Prepare professionals for a technology-based, multicultural, complex world
 Wright State University College of Education and Human Services Strategic Plan, 2008-2013 The College of Education and Human Services (CEHS) worked with a 25-member cross representative committee of faculty
Iowa School District Profiles. Le Mars
 Iowa School District Profiles Overview This profile describes enrollment trends, student performance, income levels, population, and other characteristics of the public school district. The report utilizes
TRENDS IN. College Pricing
 2008 TRENDS IN College Pricing T R E N D S I N H I G H E R E D U C A T I O N S E R I E S T R E N D S I N H I G H E R E D U C A T I O N S E R I E S Highlights 2 Published Tuition and Fee and Room and Board
SEARCH PROSPECTUS: Dean of the College of Law
 SEARCH PROSPECTUS: Dean of the College of Law TABLE OF CONTENTS 3 The College of Law 4 Mission of the College of Law Academics and Curriculum at the College of Law 5 History, Accreditation and Enrollment
CONNECTICUT GUIDELINES FOR EDUCATOR EVALUATION. Connecticut State Department of Education
 CONNECTICUT GUIDELINES FOR EDUCATOR EVALUATION Connecticut State Department of Education October 2017 Preface Connecticut s educators are committed to ensuring that students develop the skills and acquire
Evaluation of a College Freshman Diversity Research Program
 Evaluation of a College Freshman Diversity Research Program Sarah Garner University of Washington, Seattle, Washington 98195 Michael J. Tremmel University of Washington, Seattle, Washington 98195 Sarah
Trends in Tuition at Idaho s Public Colleges and Universities: Critical Context for the State s Education Goals
 1 Trends in Tuition at Idaho s Public Colleges and Universities: Critical Context for the State s Education Goals June 2017 Idahoans have long valued public higher education, recognizing its importance
FACTORS THAT INFLUENCE THE COLLEGE CHOICE PROCESS FOR AFRICAN AMERICAN STUDENTS. Melanie L. Hayden. Thesis submitted to the Faculty of the
 FACTORS THAT INFLUENCE THE COLLEGE CHOICE PROCESS FOR AFRICAN AMERICAN STUDENTS by Melanie L. Hayden Thesis submitted to the Faculty of the Virginia Polytechnic Institute and State University In partial
Educational Attainment
 A Demographic and Socio-Economic Profile of Allen County, Indiana based on the 2010 Census and the American Community Survey Educational Attainment A Review of Census Data Related to the Educational Attainment
An Introduction to School Finance in Texas
 An Introduction to School Finance in Texas May 12, 2010 Sheryl Pace TTARA Research Foundation space@ttara.org (512) 472-8838 Texas Public Education System 1,300 school districts (#1 in the nation) 1,025
5 Programmatic. The second component area of the equity audit is programmatic. Equity
 5 Programmatic Equity It is one thing to take as a given that approximately 70 percent of an entering high school freshman class will not attend college, but to assign a particular child to a curriculum
New Jersey Institute of Technology Newark College of Engineering
 New Jersey Institute of Technology Newark College of Engineering AND IN ELECTRICAL AND COMPUTER ENGINEERING Program Review Last Update: Nov. 23, 2005 MISSION STATEMENTS DOCTOR OF PHILOSOPHY IN ELECTRICAL
SUPPORTING COMMUNITY COLLEGE DELIVERY OF APPRENTICESHIPS
 The apprenticeship system is evolving to meet the needs of today s and tomorrow s economy. The two significant goals that have emerged involve broadening the roles of apprenticeship partners and increasing
2012 ACT RESULTS BACKGROUND
 Report from the Office of Student Assessment 31 November 29, 2012 2012 ACT RESULTS AUTHOR: Douglas G. Wren, Ed.D., Assessment Specialist Department of Educational Leadership and Assessment OTHER CONTACT
AGENDA Symposium on the Recruitment and Retention of Diverse Populations
 AGENDA Symposium on the Recruitment and Retention of Diverse Populations Tuesday, April 25, 2017 7:30-8:30 a.m. Symposium Check-in and Continental Breakfast Foyer 8:30-9:30 a.m. Opening Keynote Session
10/6/2017 UNDERGRADUATE SUCCESS SCHOLARS PROGRAM. Founded in 1969 as a graduate institution.
 UNDERGRADUATE SUCCESS SCHOLARS PROGRAM THE UNIVERSITY OF TEXAS AT DALLAS Founded in 1969 as a graduate institution. Began admitting upperclassmen in 1975 and began admitting underclassmen in 1990. 1 A
Supplemental Focus Guide
 A resource created by The Delphi Project on the Changing Faculty and Student Success www.thechangingfaculty.org Supplemental Focus Guide Non-Tenure-Track Faculty on our Campus Supplemental Focus Guide
Trends & Issues Report
 Trends & Issues Report prepared by David Piercy & Marilyn Clotz Key Enrollment & Demographic Trends Options Identified by the Eight Focus Groups General Themes 4J Eugene School District 4J Eugene, Oregon
Massachusetts Juvenile Justice Education Case Study Results
 Massachusetts Juvenile Justice Education Case Study Results Principal Investigator: Thomas G. Blomberg Dean and Sheldon L. Messinger Professor of Criminology and Criminal Justice Prepared by: George Pesta
Program Change Proposal:
 Program Change Proposal: Provided to Faculty in the following affected units: Department of Management Department of Marketing School of Allied Health 1 Department of Kinesiology 2 Department of Animal
Improving recruitment, hiring, and retention practices for VA psychologists: An analysis of the benefits of Title 38
 Improving recruitment, hiring, and retention practices for VA psychologists: An analysis of the benefits of Title 38 Introduction / Summary Recent attention to Veterans mental health services has again
OFFICE OF ENROLLMENT MANAGEMENT. Annual Report
 2014-2015 OFFICE OF ENROLLMENT MANAGEMENT Annual Report Table of Contents 2014 2015 MESSAGE FROM THE VICE PROVOST A YEAR OF RECORDS 3 Undergraduate Enrollment 6 First-Year Students MOVING FORWARD THROUGH
u Articulation and Transfer Best Practices
 Articulation and Trevor Chandler Houston Community College December 17, 2014 What is an Articulation Agreement Content of an Articulation Agreement What is the purpose of an Articulation Agreement What
ASCD Recommendations for the Reauthorization of No Child Left Behind
 ASCD Recommendations for the Reauthorization of No Child Left Behind The Association for Supervision and Curriculum Development (ASCD) represents 178,000 educators. Our membership is composed of teachers,
State Budget Update February 2016
 State Budget Update February 2016 2016-17 BUDGET TRAILER BILL SUMMARY The Budget Trailer Bill Language is the implementing statute needed to effectuate the proposals in the annual Budget Bill. The Governor
The Condition of College & Career Readiness 2016
 The Condition of College and Career Readiness This report looks at the progress of the 16 ACT -tested graduating class relative to college and career readiness. This year s report shows that 64% of students
Shelters Elementary School
 Shelters Elementary School August 2, 24 Dear Parents and Community Members: We are pleased to present you with the (AER) which provides key information on the 23-24 educational progress for the Shelters
Denver Public Schools
 2017 Candidate Surveys Denver Public Schools Denver School Board District 4: Northeast DPS District 4 - Introduction School board elections offer community members the opportunity to reflect on the state
Systemic Improvement in the State Education Agency
 Systemic Improvement in the State Education Agency A Rubric-Based Tool to Develop Implement the State Systemic Improvement Plan (SSIP) Achieve an Integrated Approach to Serving All Students Continuously
Effective Recruitment and Retention Strategies for Underrepresented Minority Students: Perspectives from Dental Students
 Critical Issues in Dental Education Effective Recruitment and Retention Strategies for Underrepresented Minority Students: Perspectives from Dental Students Naty Lopez, Ph.D.; Rose Wadenya, D.M.D., M.S.;
Multiple Measures Assessment Project - FAQs
 Multiple Measures Assessment Project - FAQs (This is a working document which will be expanded as additional questions arise.) Common Assessment Initiative How is MMAP research related to the Common Assessment
The number of involuntary part-time workers,
 University of New Hampshire Carsey School of Public Policy CARSEY RESEARCH National Issue Brief #116 Spring 2017 Involuntary Part-Time Employment A Slow and Uneven Economic Recovery Rebecca Glauber The
1.0 INTRODUCTION. The purpose of the Florida school district performance review is to identify ways that a designated school district can:
 1.0 INTRODUCTION 1.1 Overview Section 11.515, Florida Statutes, was created by the 1996 Florida Legislature for the purpose of conducting performance reviews of school districts in Florida. The statute
This Access Agreement is for only, to align with the WPSA and in light of the Browne Review.
 University of Essex Access Agreement 2011-12 The University of Essex Access Agreement has been updated in October 2010 to include new tuition fee and bursary provision for 2011 entry and account for the
Guidelines for the Use of the Continuing Education Unit (CEU)
") Guidelines for the Use of the Continuing Education Unit (CEU) The UNC Policy Manual The essential educational mission of the University is augmented through a broad range of activities generally categorized
Guidelines for the Use of the Continuing Education Unit (CEU) The UNC Policy Manual The essential educational mission of the University is augmented through a broad range of activities generally categorized
Financing Education In Minnesota
 Financing Education In Minnesota 2016-2017 Created with Tagul.com A Publication of the Minnesota House of Representatives Fiscal Analysis Department August 2016 Financing Education in Minnesota 2016-17
Higher Education. Pennsylvania State System of Higher Education. November 3, 2017
 November 3, 2017 Higher Education Pennsylvania s diverse higher education sector - consisting of many different kinds of public and private colleges and universities - helps students gain the knowledge
PCG Special Education Brief
 PCG Special Education Brief Understanding the Endrew F. v. Douglas County School District Supreme Court Decision By Sue Gamm, Esq. and Will Gordillo March 27, 2017 Background Information On January 11,
This Access Agreement is for only, to align with the WPSA and in light of the Browne Review.
 University of Essex Access Agreement 2011-12 The University of Essex Access Agreement has been updated in October 2010 to include new tuition fee and bursary provision for 2011 entry and account for the
Master of Science (MS) in Education with a specialization in. Leadership in Educational Administration
 in Education with a specialization in. Leadership in Educational Administration") Master of Science (MS) in Education with a specialization in Leadership in Educational Administration Effective October 9, 2017 Master of Science (MS) in Education with a specialization in Leadership in
Master of Science (MS) in Education with a specialization in Leadership in Educational Administration Effective October 9, 2017 Master of Science (MS) in Education with a specialization in Leadership in
Enrollment Trends. Past, Present, and. Future. Presentation Topics. NCCC enrollment down from peak levels
 Presentation Topics 1. Enrollment Trends 2. Attainment Trends Past, Present, and Future Challenges & Opportunities for NC Community Colleges August 17, 217 Rebecca Tippett Director, Carolina Demography
INDEPENDENT STATE OF PAPUA NEW GUINEA.
 Education Act 1983 (Consolidated to No 13 of 1995) [lxxxiv] Education Act 1983, INDEPENDENT STATE OF PAPUA NEW GUINEA. Being an Act to provide for the National Education System and to make provision (a)
Northwest-Shoals Community College - Personnel Handbook/Policy Manual 1-1. Personnel Handbook/Policy Manual I. INTRODUCTION
 Northwest-Shoals Community College - Personnel Handbook/Policy Manual 1-1 Personnel Handbook/Policy Manual I. INTRODUCTION Northwest-Shoals Community College - Personnel Handbook/Policy Manual 1-2 I. INTRODUCTION
Like much of the country, Detroit suffered significant job losses during the Great Recession.
 36 37 POPULATION TRENDS Economy ECONOMY Like much of the country, suffered significant job losses during the Great Recession. Since bottoming out in the first quarter of 2010, however, the city has seen
Teacher Supply and Demand in the State of Wyoming
 Teacher Supply and Demand in the State of Wyoming Supply Demand Prepared by Robert Reichardt 2002 McREL To order copies of Teacher Supply and Demand in the State of Wyoming, contact McREL: Mid-continent
Delaware Performance Appraisal System Building greater skills and knowledge for educators
 Delaware Performance Appraisal System Building greater skills and knowledge for educators DPAS-II Guide for Administrators (Assistant Principals) Guide for Evaluating Assistant Principals Revised August
Graduate Division Annual Report Key Findings
 Graduate Division 2010 2011 Annual Report Key Findings Trends in Admissions and Enrollment 1 Size, selectivity, yield UCLA s graduate programs are increasingly attractive and selective. Between Fall 2001
1GOOD LEADERSHIP IS IMPORTANT. Principal Effectiveness and Leadership in an Era of Accountability: What Research Says
 B R I E F 8 APRIL 2010 Principal Effectiveness and Leadership in an Era of Accountability: What Research Says J e n n i f e r K i n g R i c e For decades, principals have been recognized as important contributors
November 6, Re: Higher Education Provisions in H.R. 1, the Tax Cuts and Jobs Act. Dear Chairman Brady and Ranking Member Neal:
 The Honorable Kevin Brady The Honorable Richard Neal Chairman Ranking Member Ways and Means Committee Ways and Means Committee United States House of Representatives United States House of Representatives
TACOMA HOUSING AUTHORITY
 TACOMA HOUSING AUTHORITY CHILDREN s SAVINGS ACCOUNT for the CHILDREN of NEW SALISHAN, Tacoma, WA last revised July 10, 2014 1. SUMMARY The Tacoma Housing Authority (THA) plans to offer individual development
Cooper Upper Elementary School
 LIVONIA PUBLIC SCHOOLS http://cooper.livoniapublicschools.org 215-216 Annual Education Report BOARD OF EDUCATION 215-16 Colleen Burton, President Dianne Laura, Vice President Tammy Bonifield, Secretary
National Survey of Student Engagement Spring University of Kansas. Executive Summary
 National Survey of Student Engagement Spring 2010 University of Kansas Executive Summary Overview One thousand six hundred and twenty-one (1,621) students from the University of Kansas completed the web-based
Paying for. Cosmetology School S C H O O L B E AU T Y. Financing your new life. beautyschoolnetwork.com pg 1
 Paying for Cosmetology School B E AU T Y S C H O O L Financing your new life. beautyschoolnetwork.com beautyschoolnetwork.com pg 1 B E AU T Y S C H O O L Table of Contents How to Pay for Cosmetology School...
Table of Contents Welcome to the Federal Work Study (FWS)/Community Service/America Reads program.
/Community Service/America Reads program.") Table of Contents Welcome........................................ 1 Basic Requirements for the Federal Work Study (FWS)/ Community Service/America Reads program............ 2 Responsibilities of All Participants
Table of Contents Welcome........................................ 1 Basic Requirements for the Federal Work Study (FWS)/ Community Service/America Reads program............ 2 Responsibilities of All Participants
RAISING ACHIEVEMENT BY RAISING STANDARDS. Presenter: Erin Jones Assistant Superintendent for Student Achievement, OSPI
 RAISING ACHIEVEMENT BY RAISING STANDARDS Presenter: Erin Jones Assistant Superintendent for Student Achievement, OSPI Agenda Introductions Definitions History of the work Strategies Next steps Debrief
Connecting to the Big Picture: An Orientation to GEAR UP
 Connecting to the Big Picture: An Orientation to GEAR UP About the National Council for Community and Education Partnerships (NCCEP) Our mission is to build the capacity of communities to ensure that underserved
FTE General Instructions
 Florida Department of Education Bureau of PK-20 Education Data Warehouse and Office of Funding and Financial Reporting FTE General Instructions 2017-18 Questions and comments regarding this publication
Undergraduates Views of K-12 Teaching as a Career Choice
 Undergraduates Views of K-12 Teaching as a Career Choice A Report Prepared for The Professional Educator Standards Board Prepared by: Ana M. Elfers Margaret L. Plecki Elise St. John Rebecca Wedel University
Upward Bound Program
 SACS Preparation Division of Student Affairs Upward Bound Program REQUIREMENTS: The institution provides student support programs, services, and activities consistent with its mission that promote student
Suggested Citation: Institute for Research on Higher Education. (2016). College Affordability Diagnosis: Maine. Philadelphia, PA: Institute for
. College Affordability Diagnosis: Maine. Philadelphia, PA: Institute for") MAINE Suggested Citation: Institute for Research on Higher Education. (2016). College Affordability Diagnosis: Maine. Philadelphia, PA: Institute for Research on Higher Education, Graduate School of Education,
MAINE Suggested Citation: Institute for Research on Higher Education. (2016). College Affordability Diagnosis: Maine. Philadelphia, PA: Institute for Research on Higher Education, Graduate School of Education,
Unequal Opportunity in Environmental Education: Environmental Education Programs and Funding at Contra Costa Secondary Schools.
 Unequal Opportunity in Environmental Education: Environmental Education Programs and Funding at Contra Costa Secondary Schools Angela Freitas Abstract Unequal opportunity in education threatens to deprive
Innovating Toward a Vibrant Learning Ecosystem:
 KnowledgeWorks Forecast 3.0 Innovating Toward a Vibrant Learning Ecosystem: Ten Pathways for Transforming Learning Katherine Prince Senior Director, Strategic Foresight, KnowledgeWorks KnowledgeWorks Forecast
Financial aid: Degree-seeking undergraduates, FY15-16 CU-Boulder Office of Data Analytics, Institutional Research March 2017
 CU-Boulder financial aid, degree-seeking undergraduates, FY15-16 Page 1 Financial aid: Degree-seeking undergraduates, FY15-16 CU-Boulder Office of Data Analytics, Institutional Research March 2017 Contents
National Survey of Student Engagement (NSSE) Temple University 2016 Results
 Temple University 2016 Results") Introduction The National Survey of Student Engagement (NSSE) is administered by hundreds of colleges and universities every year (560 in 2016), and is designed to measure the amount of time and effort
Introduction The National Survey of Student Engagement (NSSE) is administered by hundreds of colleges and universities every year (560 in 2016), and is designed to measure the amount of time and effort
Segmentation Study of Tulsa Area Higher Education Needs Ages 36+ March Prepared for: Conducted by:
 Segmentation Study of Tulsa Area Higher Education Needs Ages 36+ March 2004 * * * Prepared for: Tulsa Community College Tulsa, OK * * * Conducted by: Render, vanderslice & Associates Tulsa, Oklahoma Project
Foundations of Bilingual Education. By Carlos J. Ovando and Mary Carol Combs
 Foundations of Bilingual Education T tb k Bili l d ESL Cl Textbook: Bilingual and ESL Classrooms By Carlos J. Ovando and Mary Carol Combs Chapter 2 Policy and Programs The Politics of Bilingual Education
File Print Created 11/17/2017 6:16 PM 1 of 10
 Success - Key Measures Graduation Rate: 4-, 5-, and 6-Year 9. First-time, full-time entering, degree-seeking, students enrolled in a minimum of 12 SCH their first fall semester who have graduated from
IUPUI Office of Student Conduct Disciplinary Procedures for Alleged Violations of Personal Misconduct
 IUPUI Office of Student Conduct Disciplinary Procedures for Alleged Violations of Personal Misconduct Preamble IUPUI disciplinary procedures determine responsibility and appropriate consequences for violations
Status of Women of Color in Science, Engineering, and Medicine
 Status of Women of Color in Science, Engineering, and Medicine The figures and tables below are based upon the latest publicly available data from AAMC, NSF, Department of Education and the US Census Bureau.
Definitions for KRS to Committee for Mathematics Achievement -- Membership, purposes, organization, staffing, and duties
 158.842 Definitions for KRS 158.840 to 158.844 -- Committee for Mathematics Achievement -- Membership, purposes, organization, staffing, and duties of committee -- Report to Interim Joint Committee on
Executive Summary. Laurel County School District. Dr. Doug Bennett, Superintendent 718 N Main St London, KY
 Dr. Doug Bennett, Superintendent 718 N Main St London, KY 40741-1222 Document Generated On January 13, 2014 TABLE OF CONTENTS Introduction 1 Description of the School System 2 System's Purpose 4 Notable
For the Ohio Board of Regents Second Report on the Condition of Higher Education in Ohio
 Facilities and Technology Infrastructure Report For the Ohio Board of Regents Second Report on the Condition of Higher Education in Ohio Introduction. As Ohio s national research university, Ohio State
Kahului Elementary School
 Kahului Elementary Code: 405 Status and Improvement Report Year 2014-15 Focus On Standards Grades K-5 Focus on Standards Description Contents Setting Student Profile Community Profile Improvement Summary
Executive Summary. Sidney Lanier Senior High School
 Montgomery County Board of Education Dr. Antonio Williams, Principal 1756 South Court Street Montgomery, AL 36104 Document Generated On October 7, 2015 TABLE OF CONTENTS Introduction 1 Description of the
GUIDE TO EVALUATING DISTANCE EDUCATION AND CORRESPONDENCE EDUCATION
 GUIDE TO EVALUATING DISTANCE EDUCATION AND CORRESPONDENCE EDUCATION A Publication of the Accrediting Commission For Community and Junior Colleges Western Association of Schools and Colleges For use in
Miami-Dade County Public Schools
 ENGLISH LANGUAGE LEARNERS AND THEIR ACADEMIC PROGRESS: 2010-2011 Author: Aleksandr Shneyderman, Ed.D. January 2012 Research Services Office of Assessment, Research, and Data Analysis 1450 NE Second Avenue,
Testimony to the U.S. Senate Committee on Health, Education, Labor and Pensions. John White, Louisiana State Superintendent of Education
 Testimony to the U.S. Senate Committee on Health, Education, Labor and Pensions John White, Louisiana State Superintendent of Education October 3, 2017 Chairman Alexander, Senator Murray, members of the