THE EFFECTIVENESS OF THE SALVO PEDAGOGY ON
|
|
|
- Rosamund Haynes
- 6 years ago
- Views:
Transcription


1 THE EFFECTIVENESS OF THE SALVO PEDAGOGY ON STUDENTS PERFORMANCE ON PROPORTIONALITY Master s Thesis (30 ECTS) Author: Margot C. A. van Es ( ) Supervisors: Drs. Ad. H. Mooldijk & Dr. Gjalt T. Prins Utrecht University
2 Colophon: University: Institute: Utrecht University, The Netherlands Freudenthal Institute for Science and Mathematics Education (FIsme) Princetonplein 5, 3584 CC Utrecht, The Netherlands Master s Program: Science Education and Communication Date: January 28, 2016 Word count: words (14,515 excluding references and appendices) Intention to publish in Teaching and Teacher Education (Elsevier) Abstract 1 The aim of this study is measuring the effectiveness of the SaLVO pedagogy, coherent educational material. The main research question was: To what extend is the SaLVO pedagogy effective on cognitive level for dealing with proportionality problems? This was tested with a Dutch 8 th grade SaLVO maths group and a maths control group that used the Numbers & Space material. Both groups took the same newly developed test. No differences in test scores were found, overall and on question-level. The SaLVO pedagogy was not more effective on cognitive learning gains than the Numbers & Space material for proportionality problems. Keywords: SaLVO pedagogy ~ Coherent education ~ Proportionality 1 A maximum of 100 words is permitted by Teaching and Teacher Education. 2
3 TABLE OF CONTENTS 1. Introduction Theory Background Forms of coherent education Why coherent education? Pedagogical coherent education: The SaLVO material Proportionality The SaLVO pedagogy Analysis Comparing the SaLVO pedagogy Assessing the learning goals: Developing a survey Hypotheses Method Data gathering Analyzing the data Results The effect of Group on performance The effect of Approach on performance Conclusion Discussion Not using the SaLVO approach The research setting: limitations Suggestions for further research References Appendices
4 1. INTRODUCTION The coherence of science and mathematics education has been an important topic for many years (Geraedts, Boersma, Huis, & Eijkelhof, 2001). This can be established in three different ways: on organizational level, on content level and on pedagogical level 2 (Lake, 1994; Mooldijk, 2013). Some examples of organizational coherence are found in American schools (Kali, Linn, & Roseman, 2008). Some examples of content coherence are found in the Netherlands. There are not many examples of pedagogical coherent education. When the curriculum is not pedagogically coherent, students will not apply the acquired knowledge in another course (Mooldijk, 2013). Due to the need for pedagogical coherent education, the Freudenthal Institute (Utrecht University) started the SaLVO project in SaLVO stands for Coherent Learning Secondary Education 3. In the SaLVO project this educational material is developed for the topic proportionality, a topic students were found to have difficulties with (Mooldijk & Sonneveld, 2010). For example, students sometimes have the tendency to reason from a direct proportional (linear) scheme in situations where this is not appropriate (de Bock, van Dooren, Janssens, & Verschaffel, 2003; van Dooren, de Bock, Hessels, Janssens, & Verschaffel, 2005). Furthermore, they have difficulties with applying the acquired problem solving methods. In science courses the underlying mathematical conceptual knowledge about proportion is taken for granted (van der Valk, Wijers, & Frederik, 2000). Since the methods in science textbooks often differ from those in the mathematics textbooks, students do not know how to solve proportionality problems. Expected is that the SaLVO material offers a solution for these conceptual and transfer problems since it is pedagogical coherent. There is some evidence for this claim; three years after the SaLVO material was implemented at various schools teachers noticed improvements in students work on proportionality problems (Mooldijk & Sonneveld, 2010). A few years later, some teachers saw improvements on final exam scores for questions about proportion, which they claim to be the effect of the SaLVO material. The research question in this study is: To what extend is the SaLVO pedagogy effective on cognitive level for dealing with proportionality problems? This study aims to measure the effectiveness of the SaLVO pedagogy, where effectiveness is defined as cognitive learning outcomes. Can students better deal with proportionality problems after the same amount of instruction? The relevance of this study is twofold. When the SaLVO pedagogy turns out to be an effective way of learning proportionality, it can be implemented at more schools in the Netherlands. Generalizing, more pedagogical coherent educational material like SaLVO can be developed and implemented. This links to the maths test (rekentoets) and the mathematical thinking activities (WDA) that are interwoven in the high school examination. On the other hand, this study contributes to the knowledge base about pedagogical coherent education. The remainder of this thesis is split up into seven chapters. Chapter two presents the theoretical foundation of this study, with sections on coherent education; the observed problems with proportionality and pedagogies for teaching proportionality. Chapter three focusses on the SaLVO 2 Pedagogical is in this context best translated as didactisch in Dutch. 3 Samenhangend Leren Voortgezet Onderwijs 4
5 pedagogy. Chapter four analyses the SaLVO material and eventually presents the hypotheses for this study. Chapter five describes the qualitative and quantitative approaches that are used in this study. The results of this study are shown in chapter six. This study ends with its conclusion and discussion in chapter seven and eight. Some Dutch terms in this thesis were difficult to translate. To make it more understandable for Dutch readers, sometimes the original Dutch terms are added (like this). 5
6 2. THEORY This chapter consists of five paragraphs. Section 2.1 gives an overview of the curriculum reforms in the Dutch secondary education, in relation to coherency. Section 2.2 follows with an overview of the different types of coherent education. Section 2.3 takes a short side path where arguments and effects of coherent education are mentioned. Section 2.4 continues with an illustration of the pedagogical coherent material that will be researched in this study (the SaLVO material). Section 2.5 gives the theoretical background of proportionality BACKGROUND In 1986 the Dutch Scientific Council for Government Policy 4 advised to reform the first three years of secondary education, now known as the basic education (basisvorming). They advised to offer all students the same 14 separate courses and not to integrate multiple subjects into one, since the advantages of integrated subjects were unclear (Geraedts et al., 2001; Geraedts, Boersma, & Eijkelhof, 2006). The basic education was introduced in For higher streams, another curriculum reform was introduced in , called Studiehuis. In 10 th grade (4 havo/vwo) students choose between four clusters (profielen) instead of choosing a number of freely chosen subjects. There are two science and two social clusters and each cluster includes a combination of (clustered) subjects. For example: chemistry + physics and geography + history. Studiehuis was implemented to prepare students better for different fields of study in higher/academic education, as well as to help them acquire a more independent way of learning, and coherency. The need for co-operation between the science and mathematics teachers in the Netherlands further increased due to the reform of (van der Valk et al., 2000). Since the 1978 conference titled Integrated science education worldwide by the International Council of Associations for Science Education (ICASE) was held in Nijmegen, the Netherlands, coherent science education became more and more topic of discussion in the Netherlands (Geraedts et al., 2001). After the introduction of the reform in , the first five years of basic education were evaluated in Two major points were that 1) students thought of their curriculum as incoherent and shredded (Geraedts et al., 2001) and 2) students did not see the relevance of mathematics for their science courses (Mooldijk & Sonneveld, 2010). Point 1 aligns with the early 20 th century research results by Thorndike & Woodworth (1901) that interactions between knowledge areas malfunction because students store their knowledge in different places in the memory a process described by Van Parreren (1982) as system separation (as cited in Vos, den Braber, Roorda, & Goedhart, 2010, p. 38). As for point 2 (the relevance), Mathematics... provides the tools by which quantitative relationships in the natural sciences can be modelled, calculated, represented, and predicted, and the natural sciences provide relevant contexts in which mathematical and statistical knowledge can be applied, according to Dierdorp, Bakker, van Maanen, & Eijkelhof (2014). Thus students should experience coherence between mathematics and the sciences, to make these courses more meaningful to them (Dierdorp et al., 2014). A series of 50 school visits in showed that students in the higher grades also see the lack of alignment between science and mathematics teachers as a problem (Zegers, Boersma, Wijers, Pilot, & Eijkelhof, 2002). The reforms caused less coherence than expected. Yet, there 4 WRR, Wetenschappelijke Raad voor het Regeringsbeleid. 6
7 remains resistance against integrating multiple courses into one course as this might lead to a decreasing educational quality since teachers should teach in areas they were not trained for (Geraedts et al., 2001). However, there was still enthusiasm for coherent education. This need for co-operation in the sciences and the strive for coherent education was the reason the SONaTE-project was started in 2001 by the Freudenthal Institute 5, the Foundation for Curriculum Development (SLO) and the Axis foundation. SONaTE stands for coherent education in science and technology 6. In the project, first existing coherent educational projects in the Netherlands ( good practice ) were mapped in lower secondary education (Geraedts et al., 2001), then in the science clusters in upper secondary education (Zegers et al., 2002), and finally an overview was given of how five foreign countries formed their education to be more coherent (van Engelen, Boersma, & Eijkelhof, 2003) FORMS OF COHERENT EDUCATION Coherent education is in this thesis defined as a form of integration, in which there are still separate courses, but where teachers made agreements about the alignment of materials, skills or ways of instruction (Geraedts et al., 2001; Lake, 1994). In the words of Lederman and Niess the subject specific concepts remain recognizable (as cited in Dierdorp et al., 2014, p. 3). One can aim for coherence in different aspects of education: on organizational, content and pedagogical level. These forms of coherence can be obtained in the regular lessons or in special projects in which multiple courses are involved (Geraedts et al., 2001). Examples of coherence on organizational level are: a shared science lab where physics, chemistry or biology lessons are given or where students can work independently on assignments; agreements on how to use measuring equipment and calculators; and a school timetable where the science subjects are clustered in for example each Tuesday afternoon. On the content level, sometimes a distinction is made between the subject matter (vakinhoud) and skills (vaardigheden) taught (Huijs & Bruning, 2008). Examples of coherence on subject matter are agreements on which topics are treated when, how and by whom (mathematics, physics, etc.). The wish for this type of coherence was one of the reasons the examination programs changed (KNAW, 2003). In upper secondary school mathematics students first learn how to differentiate a power function before they need this knowledge in economics class. This is not always the case, as vectors are usually introduced in 11 th grade mathematics but already needed for physics in 10 th grade (Mooldijk & Sonneveld, 2010). A lack of time may be causing this lack of coherence. Other examples on content level are interdisciplinary courses and skills, for example research and arithmetic skills. Some schools offer the elective courses Science, NaSk 7, or Research & Design 8 (SLO, 2014). Some schools offer arithmetic lessons (next to or integrated in the mathematics lessons). In the Netherlands students approaching their graduation (9 th, 10 th or 11 th grade) work on a big assignment about something that fits in their chosen cluster (profielwerkstuk). Since 2007, 10 th grade students can choose the elective course Nature, Life and 5 At that time known as the Centre for Pedagogy of Mathematics and Natural sciences (CD-β). 6 Samenhangend Onderwijs in Natuur en Techniek 7 Contraction of the Dutch abbreviations for Science (Natuurkunde) and Physics (Scheikunde) 8 Onderzoek & Ontwerpen 7
8 Technology (NLT), which is an integrated science and mathematics course in the upper secondary education. It is a two year course for the senior general level (havo) and a three year course for the pre-university education level (vwo). Examples of coherence on pedagogical level, such as teachers from different courses using the same terminology, the same teaching materials or teaching the same problem solving strategy, are scarce in the Netherlands (Geraedts et al., 2001; Huijs & Bruning, 2008). In fact, the opposite is observed. For example, with no mention or introduction of the concepts in mathematics textbooks, in economic textbooks references are made to difference quotient and differential quotient whereas in physics textbooks the term differentials is used (Den Braber, 2007, as cited in Vos et al., 2010, p. 39). For the lower secondary part of the SONaTe project nine school visits were made. Two schools had a school-wide pedagogical/didactical vision: in one school students were clustered in groups in the classroom and in one school students worked independently a lot (Geraedts et al., 2001). Although these are pedagogical examples, this falls within teaching style more than in pedagogical coherent education. The SONaTe project concluded that in Canada, the USA and Israel, some concepts (for example change, energy, systems, interaction, model, scale) are approached in an interdisciplinary way (van Engelen et al., 2003) WHY COHERENT EDUCATION? Proponents of coherent education use amongst others the following arguments, according to Eijkelhof (1999, as cited in Geraedts et al., 2001, p ). - Through coherent education the subject matter is broadened or widened. (content level) - The students develop a coherent knowledge base, instead of separate knowledge elements. (content level / pedagogical level) - Coherent education is more efficient, since no overlapping content or skills are thought (content level) - Students do not experience confusion about the meaning of concepts or the learning/using of skills (pedagogical level) For the sciences and mathematics, there are two main reasons for coherency: mathematics offers the toolbox for the quantitative relationships in the sciences and the sciences offer contexts in which the mathematical knowledge can be applied (Boersma, Bulte, Krüger, Pieters, & Seller, 2011). Teachers and headmasters of the schools visited in the SONaTe project give the following motives for coherent education (Geraedts et al., 2001, p ). - Creating a less fragmented curriculum, whereby a subject can be approached from different angles and thus better connects with the career perspectives (or higher education) and the everyday environment. - Providing students more insight in the coherence on content level between the learning areas (leergebieden) - Making it easier for students to apply the learnt skills - Increasing student motivation Although there are a few comparison studies available thus far, the literature reports some positive effects of coherent education. For example, a meta-analysis of 50 studies found positive effects on student achievements on respectively science and mathematics grades (effects sizes 8
9 .37 and.27) (Hurley, 2001). Moreover, most students appreciate it when teachers collaborate in interdisciplinary courses (Boersma et al., 2011). Teachers having the same expectations across subject areas is a key factor for the performance of students (Lake, 1994, p. 9). Furthermore, students will get motivated when they see connections between different subjects (Lake, 1994). However, a previous master s thesis about the SaLVO material did not find a significant relation between using the SaLVO material and seeing the relevance of mathematics for science (Wolthoff, 2013) PEDAGOGICAL COHERENT EDUCATION: THE SALVO MATERIAL After two years of analysing the existing coherent science educational materials, the SONaTEproject continued with design research since there was not much material to be found. In 2004 this resulted in the SaLVO material, developed by the Freudenthal Institute in collaboration with teachers from four Dutch secondary schools. SaLVO stands for coherent learning in the secondary education 9. As mentioned before, the topic proportionality was chosen. This is a core topic in mathematics education, but also a common topic in the science subjects as many quantities (density, speed, concentration, etc.) have proportional properties (van der Valk et al., 2000). Research showed that proportional reasoning is required for students to understand concepts in science such as scale, and that it can be an indicator of students success in learning chemistry and biology (several authors as cited in Taylor & Jones, 2009, p. 1233). Furthermore, proportional reasoning is a difficult skill needed in daily life, but not mastered by many adults (Tourniaire & Pulos, 1985). The SaLVO material consists of 17 booklets (modules) which together form a continuous teaching/learning trajectory (doorlopende leerlijn) for students in 8 th 11 th grade on senior general level (havo) and pre-university education level (vwo). Considering the resistance for integrating courses each booklet can be used in one course; mostly in the mathematics and physics classes, but also some in chemistry, economics or Nature, Life and Technology class. The booklets partly replace and partly complement paragraphs in the textbooks used PROPORTIONALITY This section gives a theoretical background for the concept proportionality. In section the concepts ratio, proportionality and proportional reasoning are defined. Section discusses three types of proportionality problems and three types of assessment problems. In section six strategies for solving proportionality problems are discussed. Section continues with (the background of) problems that students encounter when solving proportionality problems and with some remarks on what was found in literature on teaching approaches DEFINING RATIO, PROPORTIONALITY AND PROPORTIONAL REASONING Ratio The ratio a b is the relationship between two numbers a and b. The numbers a and b are called terms, a being the antecedent and b being the consequent. It may be numbers of the same nature (e.g. 2 amounts of money) or numbers of a different kind (4 books : 20 dollars). Ratios of 9 Samenhangend Leren in het Voortgezet Onderwijs 9
10 quantities of the same kind are called internal ratios, ratios of quantities of different kinds are called external ratios (Tourniaire & Pulos, 1985). Ratios are often converted into fractions a. Turning the ratio into a single number (for example b 2 5 as 0.4) is loaded with difficulty, since the ratio then loses its meaning for every we have (Watson, Jones, & Pratt, 2013). There exists also ratios with three or more terms, the ratio of flour to sugar to eggs can be expressed as In this case the fraction or decimal notation cannot be used. Proportionality When two ratios are equal they are referred to as a proportion expression, a b = c d or in fraction notation a = c. This proportion a = c has two types of multiplicative relationships in it b d b d (Steinthorsdottir, 2006). The multiplicative relationship within the given ratio ( b a ) and between the ratios (c a). An integer ratio is a ratio in which both the within and the between ratio are an integer. For example, 2 = 12 is an integer ratio problem since the within multiple is integer (4 2 = 2) and the 4 x between multiple is integer (12 2 = 6). When at least one of the multiplicative relationships is not an integer, it concerns a non-integer ratio. For example, the problem 8 = 48 has an integer 5 multiple between the ratios (48 8 = 6) but the within ratio does not (5 8 = 5 8 ). The proportionality a b = c d is called direct proportionality (recht evenredig verband). Direct proportionality can also be represented as a function of the form y = kx, with k 0. If k > 0, this means that if one term of the ratio increases with a factor, the other one also increases with this factor. This is mostly the case in the contextual proportionality problems used in school and in research assessment. If k < 0 this means that if the one term increases with a factor, the other term decreases with this factor. More advanced forms of proportionality can be represented by functions but are not represented in the fraction or ratio notation. Inverse proportionality is represented by the formula y = k/x = kx 1, with k > 0. When one variable decreases, the other variable increases, given that their product stays constant (yx = k). Other more abstract examples of proportionality are square proportionality ( y = kx²) and exponential proportionality (y = k g x ). All types of proportionality can be represented by a graph or in a table. Proportional reasoning Proportional reasoning is the human ability to make use of an effective form of the proportional scheme (Ben-Chaim, Keret, & Ilany, 2012, p. 49). This means being able to construct and solve proportion problems with algebra (Lamon, 1993). x TYPES OF PROBLEMS AND ASSESSMENT PROBLEMS Ratio and Proportionality problems A ratio problem exists of comparing two ratios, with one of the terms being the unknown x. Ratio problems can be divided into three general categories (Ben-Chaim et al., 2012). 10
11 1. Comparing two parts of a single whole. The terms of the ratio are two disjoint subsets forming one set together. Most of the times the terms have the same unit. An example problem: a class consists of boys and girls. The ratio girls to boys is 3 2. In another class with the same ratio girls to boys are 18 boys. How many girls are in this class? 2. Comparing quantities of the same nature The terms of the ratio propose two magnitudes that are related, but are not 1 when added together. The terms can have the same unit. An example problem: paper sheets 10 have the same ratio length to width. You want to enlarge a piece of paper that is 297 mm long and 210 mm wide to one size bigger that is 420 mm long. What will be the width? 3. Comparing quantities of different natures The two terms in the ratio are not conceptually related, for example 4 books 20 dollars. They may have an interesting connection, then a new dimensional unit is often created, for example the ratio 42 km 1.5 hour (distance over time) represents speed (28 km/h). Lamon found that the first type of problem (she called this Part-Part-Whole problems ) did not elicit any proportional reasoning from 6 th grade students because the problems could be solved using less sophisticated methods (1993). Type 3 problems with the rate not being a new entity (she called this Associated sets ) presented with concrete pictures elicit the most sophisticated thinking (Lamon, 1993). Ratio and Proportionality Assessment problems The literature reports three types of a problem for assessing / evaluating the proportional reasoning (Ben-Chaim et al., 2012; English & Halford, 1995; Tourniaire & Pulos, 1985). 1. Missing value problems. Two ratios are given with three of the terms known. The task is to find the fourth missing term. For example, what is x when 2 = 12? 4 x 2. Numerical comparison problems. Two ratios are given with the question if they are equal, or if one is smaller/larger. For example, is 2 9 smaller/equal/bigger than? Estimation problems. A comparison problem in which no numerical values are used. Another answer possibility is added: not enough information to decide. For example, if I use less oranges and more water today, will my lemonade be stronger, weaker, the same as yesterday, or is there not enough information? In the missing value and numerical comparison problems, a memorized skill/trick can be used (English & Halford, 1995). In assessment problems types 2 and 3 the students should understand the meaning of proportion in order to solve it (English & Halford, 1995, p. 248). Lamon distinguished another type of assessment problems that she called Strechters and Shrinkers : situations that involved scaling up/scaling down (with a fixed ratio) a quantity that is typically measured as a distance (length, width, height). She found that these problems were the most difficult for 6 th grade students since they failed to recognize the multiplicative nature of the problems (1993). Another distinction can be made when looking at the semantics: symbolic problems and word problems (Steinthorsdottir, 2006; Tourniaire & Pulos, 1985). In symbolic problems the ratios 10 The A-series that is used in Europe (amongst others) have ratio
12 are presented in mathematical symbols ( 3 = x ) without context. Word problems can be given 7 28 with or without illustrations. Tourniaire and Pulos distinguish two types of word problems: rate problems and mixture problems (1985). In rate problems two ratios of dissimilar objects are compared (comparable with problem type 3). In mixture problems two ratios of mixtures have to be compared, which is a type 1 problem in which the whole is a new object (water + orange makes juice; red paint + white paint makes pink). In this case, the student should understand what happens when two elements are mixed in order to solve the problem (Tourniaire & Pulos, 1985). In most mixture problems the two terms of the ratio are given in the same unit, which may be more confusing for students than for example the problem of 4 books 20 dollar (Tourniaire & Pulos, 1985) STRATEGIES FOR SOLVING PROPORTION PROBLEMS Research mentions six strategies used by students for solving proportion problems (Avcu & Avcu, 2010; Cramer, Post, & Currier, 1993; Tourniaire & Pulos, 1985; Watson et al., 2013). Proportional reasoning develops from qualitative thinking to additive strategies to multiplicative strategies, each following strategy being a more sophisticated and abstract way of thinking about proportionality (Steinthorsdottir, 2006). Words as smaller, bigger, more and less characterize the qualitative thinking phase. It was found that the semantics and/or the context influenced the choice of strategy (Tourniaire & Pulos, 1985). Additive and multiplicative strategies have a quantitative nature. Below, each strategy will be further explained by the use of the sample problem If 3 apples cost 60 cents, find the costs of 12 apples (to the idea of Cramer et al., 1993, p. 167). Additive strategy In primary school students initially use a building-up strategy (1) (Tourniaire & Pulos, 1985). In this reasoning, the students use their knowledge of addition to solve the proportion problem. The students iterate the pattern found within the ratio to the unknown quantity. For example, for the earlier proposed problem the student would reason as follows. Three apples cost 60 cents. So three apples more makes 6 apples that will cost = 120 cents. Three apples more is 9 apples for = 180 cents. Three apples more is 12 apples for = 240 cents. The building up strategy works well for problems with integer ratios. You may expect problems when three apples cost cents (the addition becomes more complicated) or when the students are asked to find the costs of 10 apples (which only works well if the ratio cents apples is an integer or perhaps a simple fraction like ½ or ¼). The building-up strategy is used in higher grades for simple problems or for familiar contexts (Tourniaire & Pulos, 1985). Multiplicative strategies Identifying a unit rate (2) (terugrekenen naar 1 ). The key in this method is finding the multiplicative relationship within the given ratio (b/a). This ratio is the amount that stands for one unit of the quantity. This can be multiplied with the other known quantity to attain to the answer (Avcu & Avcu, 2010). For the sample problem, the cost for one apple is 60 3 = 20 cents. So the costs for twelve apples is = 240 cents. In a research including 12 to 14-year olds, this method was more used by the younger students (Cramer and Post, 1993, as cited in Watson et al., 2013, p. 54). 12
13 The unit rate method can easily be used when the within ratio is an integer. When using a calculator, this method also can be used with non-inter within ratios. Errors can occur when students round the calculated within ratio to 1 or 2 decimal numbers and then continue their calculation with this rounded ratio. For example when the 3 apples cost 62 cents the correct answer should be 248 cents for 12 apples. A student might reason that 62 3 = cents = 21 cents per apple. The context influences the rounding of the numbers in the problem. Identifying the scale factor (3) (also known as factor of change). The students look for the scale factor, i.e. how many times larger the quantity should be (Watson et al., 2013). They compute this factor by comparing the known parts of both ratios (that is to say or both the numerators or both the denominators). Then they multiply the factor with the value of the given quantity. For the sample problem, 12 apples are 4 times 3 apples. So the scale factor is 4. Thus the answer is 4 60 cents = 240 cents. This approach is easy to use when the scale could be expressed as an integer (English & Halford, 1995; Watson et al., 2013). Matching equivalent fractions (4). This strategy is a standalone method that does not rely on any context (Cramer et al., 1993). The pairs of ratios are treated as fractions. The multiplication rule is used ( a c = ac ) for matching the known part of one ratio with the corresponding known b c bc part of the other ratio by multiplying it with a fraction of the form c = 1. The product ratio will c have a term equal to the desired answer (Avcu & Avcu, 2010). In the sample problem, the student first writes the problem as 3 = 12. The multiplication rule tells the student that the numerator is 60? multiplied by 4, so the denominator should also be multiplied by 4. In algebra: 3 4 = 12, so the 60 4 answer is 240 cents. This method also works if the students writes the fraction as 60 =?, meaning 60 cents per apples. This method can be used disregarding any units. So the problem we ride 3 km per 2 hours, how many km in 5 hours? may also be written as 2 = 5, turning the unit of the fraction not 3? into speed but into hours/km. In the 1993 study by Cramer and Post, this method was used more by the older students in the 12 to 14-year old group (as cited in Watson et al., 2013, p. 54). 240 Matching equivalence class (5). This strategy also starts with writing the given rate as a fraction. Instead of multiplying at once, the student uses a number of equivalent fractions until the desired answer arises (Avcu & Avcu, 2010). For this problem, the fraction will be 3 and with 60 one intermediate step the student will arrive at the answer. Since 3 = 6 =
14 Cross-multiplying (6). This is a method that does not arise from the meaning of proportionality, but from combining several actions in the thinking process (Watson et al., 2013). If the proportion problem is a = c and the student has to solve for x, he would reason x = cb (Avcu & Avcu, 2010). b x a In our example, the student might write down 3 = 12 so x = 60 cents 12 apples 3 apples = 60 x 240 cents, or, more likely, without the units: = 240. This strategy is tented to be misapplied: cross-multiplying often is a trick that students do not understand (Broekman, van der Valk, & Wijers, 2000). In the before mentioned research, this method was only used by the 14-year olds (as cited in Watson et al., 2013, p. 54). Summary of the strategies for the sample problem Table 1 gives a summary of each strategy by giving a solution for the sample problem: If 3 apples cost 60 cents, find the costs of 12 apples (to the idea of Cramer et al., 1993, p. 167). Table 1 Summary of different problem solving strategies Strategy Problem solved in the following way 1. Building up 60 cents for 3 apples, 3 more is 120 cents for 6 apples, 3 more is 180 cents for 9 apples, 3 more is 240 cents for 12 apples. 2. Unit rate The cost for 1 apple is 60 3 = 20 cents The cost for 12 apples is = 240 cents 3. Scale factors I want four times as many apples, thus the cost will be four times as much. 4. Equivalent fractions = 240 cents 60 n n = 12? thus 3 4 = 12 thus 240 cents Matching equivalence class 3 = 6 = 12 thus 240 cents Cross-multiplying = 240 cents 14
15 PROBLEMS WITH PROPORTIONAL REASONING AND TEACHING APPROACHES Proportional reasoning ability is correlated with the developmental stage of the student (Taylor & Jones, 2009). Understanding informal methods for solving proportionality problems will strengthen the intuitive foundation of the proportional scheme and will encourage students to solve problems using informal strategies before formal instruction is given (Ben-Chaim et al., 2012, p. 52). In order to understand proportionality, the student has to understand the relationship a = c and to understand what happens to the other terms if one term changes b d (Watson et al., 2013). Incorrect use of strategies may be due to flawed procedural skills or due to lack of understanding proportional reasoning (Ben-Chaim et al., 2012). The experienced problems have different causes. Formal methods tend to be misapplied when dealing with non-integer ratios, co-prime denominators and unfamiliar contexts (Watson et al., 2013). Students can use a comparing strategy or difference strategy as fallback strategy (Steinthorsdottir, 2006). In the comparing strategy, students only compare the denominators of the proportion (Tourniaire & Pulos, 1985). For the sample problem in the previous section, a student might say that the apples will cost 6 cents more so = 69 cents since 12 3 = 9. In the difference strategy the student does not work with the fraction but with the difference of two parts of one ratio (Ben-Chaim et al., 2012). The student will argue that for 3 apples 60 cents it gives 60 3 = 57, so the 12 apples will cost = 69 cents. Another mistake can be ignoring part of the information in the problem (Steinthorsdottir, 2006). This of course leads to difficulties when solving a proportionality problem. The last problem arises when students learn the more advanced forms of proportionality. Students can stick with following the direct proportional scheme, when they are dealing with inverse proportion (Ben- Chaim et al., 2012) or square proportionality (van Dooren et al., 2005). Literature gives no clear answer on what is the best way to teach proportionality. However, some pedagogical considerations are found in different studies, covering different aspects of proportional reasoning and proportionality problems. Confrey found that time is a key factor when one wants to understand proportionality (1995, as cited in Watson et al., 2013, p. 61). The students need a repertoire of ideas, models, ways of talking and past experience. A range of question types is necessary for fully understanding proportional reasoning. Furthermore, language plays a role. Kaput & Maxwell-West found doing case studies that using the phrases for each and for every were critical in supporting understanding (1994, as cited in Watson et al., 2013, p. 56). Confrey started teaching with scaling recipes for different numbers of people, since it was found that this approach led to a strong understanding of proportional reasoning and the concept of distributivity. It was also found that an approach requiring the use of several different calculation methods, while maintaining the focus on ratio, improves this understanding (Watson et al., 2013). A way to do this is to pose a series of questions about a giant or a toy and their relationship to human dimensions. There has been some research about the contexts of the proportionality problems. Watson et. al found that children who had previously worked with measurement in contexts learnt decimals and fractions more easily than expected (2013, p. 61). Contexts where the quantities cannot be 15
16 counted by hand encourage the imaginary qualities of proportional reasoning (Watson et al., 2013, p. 65). Furthermore, students are more likely to use unitary methods ( the unit rate method ) with contextual problems where they can choose the unit themselves, i.e. the unit does not have to be 1 (Watson et al., 2013, p. 65). Hino found that when using a unit that gives insight into the situation, rather than just as a label, students can use multiplicative strategies in novel situations (instead of falling back to additive methods) (2002, as cited in Watson et al., 2013, p. 56). Lastly, one remark about calculators needs to be made. Calculators that give simplified answers hide the associated structure of the proportion (Watson et al., 2013). For example a slope is 3 2 = 1.5. The fraction 3/2 illustrates the meaning for every 2 steps to the right we go 3 steps upwards, while 1.5 does not give any meaning especially in the beginning of learning proportionality. Teaching approaches for proportionality did not gained enough attention as research subject. The SaLVO pedagogy matches some of the considerations mentioned above. There is a lot of time for the topic, since the booklets form a continuous teaching/learning trajectory. The booklets are used in several courses, leading to (meaningful) contexts and a range of question types. Whether the SaLVO pedagogy matches the other pedagogical considerations mentioned above, will become clear in the course of this research. In the next chapter the SaLVO pedagogy will be described in detail. For now we can assume that the SaLVO material meets sufficient conditions to be included in this research. 16
17 3. THE SALVO PEDAGOGY This remaining part of this research consists of three phases. The first phase of this study focuses on defining the SaLVO pedagogy and comparing it with the mathematics textbook used on school. A list of learning goals and the survey are developed in phase 2. The intervention took place in the third and final phase. For a schematic overview, see Figure 1. This chapter covers the SaLVO pedagogy. Phase 1 Defining the SaLVO pedagogy (Chapter 3) Comparing SaLVO and Numbers&Space ( 4.1) Phase 2 Developing a survey for assessing learning goals ( 4.2) Phase 3 Intervention period» Data gathering ( 5.1)» Data analyzing ( 5.2) Figure 1 Overview phases of this study As explained before, the main goal of the SaLVO material was providing coherent educational material for the topic of proportionality. Five pedagogical assumptions underlie the SaLVO pedagogy. These were found studying the SaLVO material. To ensure completeness and accuracy the assumptions have been checked by three of the main developers 11 of the SaLVO material. The assumptions learning by experiencing, the ratio table and group work may have a positive impact on the effectiveness (cognitive learning gains) of the SaLVO material. 1. Learning by experiencing When the students start learning a new concept in one of the SaLVO booklets, this does not start with reading a text explaining the concept. The SaLVO pedagogy is that learning by experiencing suits the process of learning and shaping a new concept (conceptontwikkeling). Students should not only apply knowledge, but also understand why the formula works the way it works. Every paragraph in every booklet is structured in the same way. It starts with one paragraph question that triggers the students thinking about the topic and gives them the feeling that they need more knowledge on the subject to answer the question. The students will be able to answer the paragraph question at the end of that paragraph. After this paragraph question an entry level question (instapvraag) follows. This is a question that the students are able to answer with their pre-knowledge. Mostly it is a context question that has numbers that are suitable for easy calculations. By answering this question, the students have already worked with the principle (e.g. formula, concept) that they will learn in the paragraph. It is the teacher s job to start a discussion afterwards in which he/she reflects on the question and the different problem solving strategies. The teacher guides the students from their (mostly) informal strategies to a general applicable formal principle/formula. 11 Kees Hooyman, Ad Mooldijk and Wim Sonneveld. 17
18 Another way of learning by experiencing is doing experiments. For physics and chemistry classes this is common, bur for mathematics it is generally not. For example in booklet 3, the students perform several experiments to relate the diameter of steel balls and the dimensions of a package of rice to the volume. After the experiments, the students are asked to formulate a general applicable formula: If all dimensions become a factor k larger, then the volume will become Ratio table The SaLVO pedagogy offers the ratio table as a tool for solving proportion problems. If a student wishes to solve the example problem from paragraph ( If 3 apples cost 60 cents, find the costs of 12 apples ) he would draw the two-row table below. Each row gets a label (quantity and unit) indicating the meaning of the numbers in that row (Broekman et al., 2000). The columns can now be filled with pairs of numbers that have the same ratio. Number of apples 3 12 Costs in cents 60 The students then essentially seeks the scale factor (12 3 = 4) and multiplies 60 with this factor. The reasoning behind this table is that students make less calculation errors and they always write down the units. The ratio table can also be used for the building up, unit rate and cross-multiplying strategy. An extensive description can be found in Broekman et al. (2000). The ratio-table is not limited to two rows. Van der Valk (2001) explains that multiple rows can be used when dealing with one quantity in several units, which can be the case in physics or chemistry. His example: calculating the combustion heat in J/g with information about the density in kg/l and the combustion heat in J/m³. In this case, it is extremely important that the student writes down the unit in the label for each row. The ratio table serves the coherent nature of the SaLVO material. The ratio table is not only used for questions on basic proportionality, fractions and percentages (through standardizing to 100), this is also done in some Dutch schoolbooks. The ratio table can also be used for questions on percentage change; for examining which kind of proportional relationship is presented in the table; and the mathematical transformation of coordinates. An example on percentage change: an increase of 150% is related to a scale factor / enlargement factor of 1.5. The students also use this method in the economics booklets and chemistry booklets. See Figure 2 for using the ratio table on calculations on VAT. Figure 2 The ratio table for calculations on VAT (Hooyman & Sonneveld, 2010, p. 16) 18
19 3. Group work The entry level question is a question that the students will answer in groups. First they think about it themselves; then they discuss their answers and, more important, their calculation methods. Students will learn that different methods lead to the same answer. Additionally, students can explain concepts to each other. Group work is not limited to the entry level question; also in other questions students are encouraged to discuss their work with other students. For example, students are asked for alternative calculation methods, or asked to compare their method with their classmates and choose the most convenient method. Most of the experiments will be done in groups as well. Following the SaLVO pedagogy; learning by experiencing leads to a better and more meaningful understanding and thus to better cognitive learning. The ratio table helps students to collate the information and causes less calculation errors. Due to the group process of comparing calculation methods, students will learn the underlying principles of the calculation and thus this influences the effectiveness of the SaLVO material. The assumptions continuous teaching/learning trajectory and coherency cover key elements of the pedagogy, but do not influence the cognitive effectiveness measured in this study. These last assumptions will not be referred to in the remainder of this study. 4. Continuous teaching/learning trajectory The SaLVO material is a continuous teaching/learning trajectory (doorlopende leerlijn) existing of 17 booklets. These booklets can be used next to the mathematics and physics textbooks, since SaLVO does not cover all topics for the final examination. The SaLVO booklets cover the topic of proportionality (with its formulas and graphs) with sideways to contexts in which proportionality is used. For example, there is a booklet on planets with a link to the scientific notation and density: the direct proportional relation between mass and volume. The booklets can be offered throughout the whole senior education. There are three booklets for 8 th grade, three for 8 th or 9 th grade, five for 9 th grade, four for 10 th grade and two for 11 th grade 12. The skills and insights are build up step by step. The material starts with ratio and direct proportionality (y = ax) and goes via inverse proportionality (y = ax 1 ), square proportionality (y = ax 2 ), inverse square proportionality (y = ax 2 ), exponential proportionality (y = b g x ) and percentages, to square root proportionality (y = a x), to end with periodic functions (y = a sin(b(x c)) + d). 5. Coherency Coherency is the most important characteristic of the material. The material is both coherent on content level as on pedagogical level. On content level, there are sets of consecutive books that directly connect to one another. These sets of books support the knowledge transfer from 12 Two of the 10 th grade booklets are only for senior general level (havo), and the two 11 th booklets are only for pre-university education level (vwo). 19
20 mathematics to physics. These sets are booklet 1 & 2; booklet 4 & 8 and booklet 11 & 12. That these sets are indeed coherent is shown by the following descriptions. Booklet 1 and 2. Booklet 1 is dealt with in the mathematics lessons. An introduction is given on the enlargement factor and the understanding that the ratio remains constant when enlarging a picture or recipe. In the end the students learn how to recognize a direct proportional relation by using the ratio table, and how to construct an appropriate formula y=ax. Booklet 2 is dealt with in the physics lessons. In an experimental setting, the students apply their knowledge of the proportional relation on the data they gather on mass and volume of several materials. Booklet 11 and 12. Here the first booklet is dealt with in the mathematics lessons also. It introduces different proportionalities to the students (inverse proportionality, square proportionality, square root proportionality and inverse square proportionality). It trains the students in converting formulas with the calculation rules for power functions. In the physics lessons booklet 12 continues with these proportionalities in visual form. Students should recognize the proportionality by its graphs and should construct a formula if they only get some numbers. The focus in this booklet is on practical situations and experiments. On pedagogical level the coherency manifests itself in teaching the same problem solving strategy (the ratio table), using the same terminology or making connections explicit if slightly different terminology is used. For example, in booklet 3 the relation between the mathematical multiplication factor k " (vermenigvuldigingsfactor) and the enlargement factor N (vergrotingsfactor) from physics is made explicit. In booklet 6 students see that calculating with percentages (VAT or discount) can be done the same way in their mathematics classes as in their economics lessons. This is also done in booklet 7, where students use the ratio table for their exercises in the chemistry lessons. 20
21 4. ANALYSIS 4.1. COMPARING THE SALVO PEDAGOGY To be able to answer the research question, the performance of a group of students that use the SaLVO material will be compared to the performance of a group of students that do not use it. The content of both materials should be equal or that is to say: the students should reach the same learning goals. The SaLVO material needs to be compared to the educational material used on the test school. Some boundaries need to be set on which SaLVO booklets to include in this thesis. Due to time limits not all booklets can be included. For the remainder of this research (comparing the content and the pedagogy) a limitation will be made to one or two booklets. A theoretical requirement is that all of the above mentioned underlying pedagogies are reflected in the chosen material. This is possible for all except the assumption coherency, since studying the entire SaLVO trajectory over multiple years is ruled out. Practical limitations are that this research took place in the first months of the academic year and that the research is carried out in the mathematics lessons. SaLVO booklet 1 was first selected for this research. All assumptions (except coherency) are reflected in this booklet. The booklet suits the first months of the academic year, the time period in which this research takes place. Furthermore, being the first booklet in the series, the students do not lack any pre-knowledge from previous SaLVO booklets. Part of the first SaLVO booklet matches with paragraph 8.4 of the mathematics textbook used at school 13. For the non-salvo group it will be desirable to also include the (on content connecting) paragraphs 8.5 and 8.6. Since these two paragraphs are covered in the mathematics part of SaLVO booklet 3, these are also included in this research. An additional advantage, is that this booklet has coherent characteristics on its own. The text box in Figure 3 explains how to calculate the enlargement factor k. The comparison to the enlargement factor N used in physics textbooks is made explicit. The Dutch text reads: The factor can be found using: k = new length corresponding old length Compare this to the enlargement in physics: N = size image size object 13 The (Dutch) 2008 edition of Numbers & Space. 21
 4.1.")
22 Figure 3 The enlargement factor k (Hooyman & Raterink, 2008, p. 17) COMPARING SALVO AND NUMBERS & SPACE ON CONTENT LEVEL To ensure that both groups of students have gained the same set of skills when assessed, the content of the SaLVO material is compared to the mathematics textbook used in the control group. The textbook used on the school where the intervention took place is the Dutch 2008 edition of Numbers & Space (Reichard et al., 2008a; Reichard et al., 2008b). First, every concept in the first and third SaLVO booklet is made explicitly in first column of Table 2. The second column indicates where the concept is handled in the material: in theory text boxes or in exercises. The number between brackets refers to exercises in the paragraph. The third column indicates if and where to find this concept in the Numbers & Space material. Numbers & Space is shortened to N&S. In the end, the paragraphs 4.1, 4.2, 8.3, 8.4 and 8.5 of Numbers & Space were checked whether some concepts were missing in the first column. The outcome of this comparison is that the content of the SaLVO material ( 1.1, 1.2, 1.3, 1.4 and 3B, D) is to large extent similar to the content of the Numbers & Space material ( 4.1, 4.2 and 8.3, 8.4, 8.5). There are five mismatches, indicated with the blue text. The asterisks refer to the solutions presented here: * The term ratio is not mentioned explicitly in the N&S material. This will be introduced to the N&S group after exercise 34 in 8.3. ** Paragraph 1.5 and 1.6 of the SaLVO booklet as well as the concept cube root will be excluded from this research. **** In the N&S book there are two exercises on calculating hours into minutes (how many minutes is 0.3 hours?). In the SaLVO material there is no exercise on this calculation. The exercise will be skipped in the N&S material and this skill will not be tested. This comparison leads us to a list of learning goals, which will be used for designing the test and which will be assessed in the test. This list can be found in Appendix A. 22
23 Table 2 Comparison of the SaLVO material with the Numbers & Space material on content level Content (concepts) SaLVO paragraph N&S paragraph Enlargement factor k 1.1 and Linking a given scale ( ) to 1.1 (5) 8.4 (43) enlarging with a certain factor and vice versa Ratio stays unchanged when enlarging 1.2 * Writing a percentage as a decimal 1.3 (13) 4.1 (2) number Calculate x percent of y 1.3 (15) 4.1 (3, 4, 5) Calculate how many percent x is out of y 1.3 (16) 4.2 (20, 22) Linking a percentage change of x 1.3 (14) 4.1 (9, 15) percent to enlarging with a certain factor and vice versa (150% means multiplying with 1.5) 1.4 (22) Calculate the new value y with a given 1.3 (18, 19, 20) 4.1 (10, 11, 12, 16) percentage change from x (both percentage increase as decrease) Calculate the percentage change from x (26-34) to y (both increase/decrease) Recognizing a direct proportional relation by using the ratio table Constructing a formula for the direct proportional relation: y =... x Draw an enlargement of an image with a given enlargement factor k Calculating enlargement factor k from two images using a ruler Relating enlargement factor to change in surface (k and k²) and calculate the new surface from a calculated or given k (k k²) Doing backwards calculations: what is the enlargement factor k (and the new length/width) if the surface is enlarged with factor p (k² k) Relating enlargement factor to change in volume (k and k³) and calculate the new volume from a calculated or given k (k k³) Doing backwards calculations: what is the enlargement factor k (and the new length/width) if the volume is enlarged with factor p. Using the cube root. (k³ k) Calculations on measurement of volume m³ dm³ (L) cm³ (ml) Calculations on measurement of time 0.3 hours = 0.3 x 60 = 18 minutes 1.5 Not in 8 th grade books. In 7 th grade in ** 1.6 Not in 8 th grade books. ** 3B (17) 8.3 (29) 3B 8.3 (30 33, 35) 3B 8.4 (38 42) 3B (25, 26) 8.4 (46, 47, 48, 49, 50) 3D 8.5 (52 58) Not in SaLVO material ** 3D (43, 44) 8.5 (54) **** 4.1 (6, 7) 8.5 (59, 60, 61, 62, 63) 23
24 COMPARING SALVO WITH NUMBERS & SPACE ON PEDAGOGICAL LEVEL The Numbers & Space material differs also on pedagogical level from the SaLVO material. It differs on the order in which the concepts are dealt with, how the concepts are explained, how the concepts are dealt with in the classroom (werkvormen), and which calculation methods are taught. This list is further discussed below. The order of concepts The order in which the different subjects are offered are different. In the Numbers & Space material chapter 4 is on percentages and on diagrams. Normally the students do this chapter in the beginning of January. The enlargement factor is covered in chapter 8, which also covers the formulas for calculating the volume of cones and cylinders. This is normally done in May/June. The difference with the SaLVO material is that the enlargement factor is introduced in an early stage. In booklet 1 percentages are introduced after the enlargement factor. The SaLVO material offers students one way of calculating both enlargements as percentage changes. Calculation methods In fact, the SaLVO material offers the ratio table as the only one calculation tool students need. In this table they should write down the numbers and think about what to calculate. They only start calculating after this is clear. For their calculations they can use a building up, unit rate or crossmultiplying strategy 14. Numbers & Space offers different calculation methods for percentages and for the enlargement factor. Both are based on the scale factor strategy. For percentages the students convert it first to a decimal number (the scale factor) and then calculate. The scale factor or enlargement factor NEW is also hidden in the rule NEW OLD OLD OLD Since NEW OLD OLD = NEW OLD OLD OLD 100%, which they learn to use for percentage change. they calculate the scale factor minus one. Multiplying this by 100% it gives the students their answer right away. With the ratio table the student will get the answer 113% or 88% and has to calculate that this comes down to a increase of 13% and a decrease of 12% respectively. The Numbers & Space book does not make it explicit to the students that this calculation is based on the scale factor. It justifies the formula by explaining that the value has increased with NEW OLD and that this number divided by OLD gives us how many percent the increase is of the total. When enlarging, Numbers & Space teaches to first calculate the enlargement factor (the scale factor) and then the new height/volume/surface. Outline of the book and included learning-activities The outline of the SaLVO booklets has been described in chapter 3. Here the outline of the Numbers & Space books is described and after this the differences are marked. In the Numbers & Space book every paragraph begins with an Orientation exercise (labeled O ). This exercise aims to activate pre-knowledge and to introduce the new subject to the students. In this exercise the students discover parts of the new theory by themselves. After this the book presents the theory. See the next subparagraph for more details on the theory boxes. Then there follow some exercises in which the student can practice with the new learnt knowledge, and one 14 See paragraph
25 or more closing exercises (afsluitend) labeled A which are generally of a higher level than the normal ones. The exercises are done by the students individually. Sometimes there is an exercise labeled S which means this is a game (spel) students can do in groups. This combination of orientation exercises, theory, exercises and closing exercises can be repeated multiple times in one paragraph. Then more paragraphs follow with the same structure. The paragraphs are followed by one paragraph called mixed questions. The exercises in this paragraph cover multiple parts of the theory, so that the student need to combine the knowledge learnt. Then follows a paragraph called Summary which sums up all the theory from the chapter. The chapter ends with two more paragraphs with extra questions to practice. The SaLVO booklets have a similar start as the Numbers & Space books with the entry level question (instapvraag). The difference is that the students have to do this exercise individually, compare their answers with their classmates and then discuss with the teacher. The group work assumption is not found in the Numbers & Space pedagogy. In some SaLVO paragraphs there follows a box with theory, in some paragraphs the theory is explained in text and in some paragraphs the entry level question continues so that the student discovers the theory by himself. There is only one entry level question per paragraph; but there can be more than one theory box in one paragraph. In general the SaLVO paragraphs are shorter than the Numbers & Space paragraphs. The SaLVO exercises in the end of each paragraph are not labeled as closing exercises, but they are more difficult than the ones in the beginning. What differs with the Numbers & Space exercises is that SaLVO also has experiment-exercises. See the assumption learning by experiencing in chapter 3. After all paragraphs with theory there are no paragraphs with extra exercises to practice and no Summary of all theory is given. Explaining the theory Both materials have boxes that explain the theory. In the Numbers & Space material there are more of these boxes. The SaLVO material has less theory boxes since the students only need to do calculations in the ratio table. Once they have learned how to do calculations in this table they can also do calculations on percentages and on k² and k³. The Numbers & Space theory boxes are more extensive than the SaLVO boxes. The Numbers & Space boxes are supplemented with an example on how to do the calculations. Only one theory box in the SaLVO material contains a calculation example. See the comparison in Figure 4. Numbers & Space uses two different theory boxes for percentage increase and percentage decrease. In SaLVO this is discussed in one theory box. Both the Numbers & Space as the SaLVO box explain that for example 115% = The Numbers & Space adds the calculation 1.15 times the price of the book and states this in a general formula: NEW = OLD. This is the case for all theory boxes. The Numbers & Space boxes display the theory with numerical examples and then give an example on how to solve a problem that the student will encounter in the exercises. Also emphasis is placed on the general rule or formula by displaying it in bold red text in a red framing. 25

26 Figure 4 Theory boxes on percentage increase and decrease in Numbers & Space (left) and SaLVO (right) 4.2. ASSESSING THE LEARNING GOALS: DEVELOPING A SURVEY These learning goals will be assessed with a survey test, which is based on already existing tests for the selected SaLVO booklet and the corresponding parts of the regular textbook. Tried was to make a well-balanced test, which assesses as many learning goals as possible. An overview of this analysis can be found in Appendix D. The test is also based on literature about testing (see next subparagraph on RTTI) and on the literature about ratio and proportionally. In paragraph three types of ratio and proportionality problems were discussed: comparing two parts of a single whole, comparing quantities of the same nature and comparing quantities of different natures. Since there was found that the first type did not elicit any proportional reasoning, no questions of this type were included in the survey. The other questions are of type 2 and 3, see Appendix E. As type of assessment, almost all questions are of type 1: missing value problems. The students need to calculate one missing value (the enlargement factor, the percentage change, etc.) and can do so with a memorized skill. Two questions are of the estimation type; here students need to compare information to make a statement. For this type students need to understand the meaning of proportion. All survey questions are word problems (in contrast to symbolic problems). The systematics used for developing the test is the Dutch system RTTI 15 which is comparable to Bloom s taxonomy. This is a way of distinguishing different levels of thinking skills assessed in 15 Dutch abbreviation for Reproductie, Toepassen1, Toepassen2, Inzicht. 26
27 questions. The R stands for reproduction: this are questions which can be answered by remembering. The first T stands for applying in familiar contexts: this are questions where the student should apply his knowledge in comparable situations as the ones he practiced with in the lessons. The second T stands for applying in new contexts: this are similar questions to T1 questions, only this are unfamiliar contexts for the students. The I stands for insight: this are questions where the student himself should construct a problem solving method that fits the given context. Drost & Verra (2013) have suggested guidelines for composing a test: at least 5% of the points should be earned with R-questions; at least 5% with I-questions. Furthermore, R-questions and T1-questions together should cover at least 30%; and T2-questions and I-questions should also cover at least 30%. Our survey has 20% R-questions, 48% T1-questions, 20% T2-questions and 12% I-questions and thus meets the criteria above. See Appendix F for a detailed analysis of all survey questions. The test is repeatedly checked by the two teachers who participated in this research, on appropriateness to assessing the learning goals in the SaLVO booklet and the regular textbook and on appropriateness for the chosen target audience (textual level). This final survey can be found in Appendix B. A score form was developed which shows how many points the students earns for their answers. Regardless of the solving strategy used, an equal amount of points could be gained by the SaLVO and Numbers & Space students. All points added up results in a final test score per student. For convenience there were made two versions of the score form since there is a difference in strategy, this helps classifying the answers the students gave in SaLVO pedagogy / Numbers & Space pedagogy / other pedagogy. This classification and score system will be used to credit possible differences in final test scores to the chosen pedagogy for answering the questions. The two versions of the score can be found in Appendix C HYPOTHESES The SaLVO pedagogy matches some of the pedagogical considerations (see paragraph 2.5.4) that were found to improve rational thinking. The SaLVO material matches these considerations: - The SaLVO material starts with scaling recipes which should lead to a strong understanding of proportional reasoning. - The students gain experience with several different calculation methods in the entry level questions which also improves the understanding. - The material contains a range of question types, in meaningful and realistic contexts. - Due to the structure the ratio table offers the students only use their calculators in the end of the solution process; they do not randomly multiply and divide numbers. Furthermore, these assumptions (see chapter 3) underlying the SaLVO pedagogy may also improve rational thinking: - Learning by experiencing: discussing problem solving strategies, measuring and doing experiments. - Using the ratio table as main problem solving strategy - Learning by doing group work, for example in the entry level questions but also in experiments. 27

28 For the Numbers & Space group the two topics (percentages & enlarging) remain separate. For the SaLVO group they form a coherent entity. We expect that the students in the SaLVO group can draw from one coherent knowledge base which makes it easier to apply the learnt skills, and we expect that there is less confusion about the meaning of concepts in this group. Given the knowledge we have now about proportionality and about the SaLVO pedagogy, we expect that the SaLVO group performs better on the survey test than the Numbers & Space group. The main research question To what extend is the SaLVO pedagogy effective on cognitive level for dealing with proportionality problems? is broken down in two sub-questions. The first sub-question is: Did the SaLVO group performed better than the Numbers & Space group on answering the questions? Following the reasoning above, we expect the SaLVO students to perform better on the test in general, whereby this difference is expressed in the questions that ask more insight from students. This leads to hypotheses 1, 2 and 3. H1: The SaLVO group performs better on the test than the Numbers & Space group. H2: The SaLVO group and the Numbers & Space group perform equally on the Reproduction and Applying 1 questions. H3: The SaLVO group performs better than the Numbers & Space group on the Applying 2 and Insight questions. Three more hypotheses are composed to better interpret possible differences in test scores: to account a difference in test score to using the SaLVO pedagogy. This is done to be able to answer the second sub-question: Did the SaLVO group performed better due to answering the questions using the SaLVO pedagogy? This gives us hypotheses 4, 5 and 6. H4: A SaLVO approach leads to a higher score than a Numbers & Space approach. H5: A SaLVO approach leads to an equally high score as a Numbers & Space approach on Reproduction and Applying 1 questions. H6: A SaLVO approach leads to a higher score than a Numbers & Space approach on Applying 2 and Insight questions. Figure 5 Schematic overview of the variables used in the hypotheses 28
29 5. METHOD This chapter describes phase 3 of this research: data gathering in the intervention period and the way this data is analyzed DATA GATHERING Selecting participants Data was gathered on the Sint Bonifatiuscollege in Utrecht, The Netherlands. Besides practical reasons, this school was selected because of its involvement in developing the SaLVO material. It is a Roman Catholic comprehensive school with approximately 1500 students in senior general secondary education (havo) and pre-university education (vwo). The school is located in an urban area: 95% of all students live in the city Utrecht (VO-raad, 2015). The intervention took place in two 8 th grade pre-university level classes; one using the SaLVO material and one using the Numbers & Space material. From now on these classes are referred to as the SaLVO group and the N&S group. First the two teachers were chosen to participate in this study. There is explicitly chosen for one teacher per group, since the risk exists with one teacher for both groups that the pedagogies get mixed. Now each teacher could focus on her ascribed pedagogy. Both teachers are female, and have comparable experience (20+ years) in teaching the subject matter. The teacher teaching the SaLVO group has affinity with this pedagogy: she partly developed the material and has used it for several years. The N&S teacher has worked with the Numbers & Space textbooks for many years and therefore knows this pedagogy well. Both teachers had already one 8 th grade class assigned to them by the school timetable. These classes were chosen for this study. In total 56 students aged years participated in this study. The SalVO group had 30 students (17 boys and 13 girls), the N&S group had 26 students (13 boys and 13 girls). The N&S group was a little bit older (M = 13.63, SD =.35) than the SaLVO group (M = 13.50, SD =.48). There was no inducement in any form to participate. The intervention period In the intervention period from 16 th September 14 th October the students followed 9 lessons of 50 minutes and 2 lessons of 40 minutes 16. Both groups had their lessons in the late morning/early afternoon on three consecutive days. The SaLVO group had class on Wednesday 3 rd hour, Thursday 6 th hour and Friday 5 th hour. The N&S group had class on Monday 7 th, Tuesday 6 th and Wednesday 5 th hour. The students knew they were participating in an experiment. They were told that the other group had another way of teaching and that the researcher was in the classroom to make observations and to eventually look at their tests. The SaLVO group received the (modified 17 ) SaLVO booklets in which they worked the entire intervention period. They did not know which paragraphs from their Numbers & Space textbook matched these booklets and thus could not use the textbook for their homework problems. With other words: the SaLVO group had to draw on SaLVO pedagogies to solve the homework problems. 16 Due to a shortened timetable (verkort lesrooster). 17 See section for a rationale on which parts to include/exclude. 29
30 Both teachers are instructed to stick to their pedagogy as much as possible. If students came up with other problem solving solutions they would acknowledge these but when explaining in front of the classroom they only worked with their specific pedagogies. The researcher observed the lessons to ensure that the teachers stick to their pedagogies. Also the researcher timed how long each teacher took the time to explain the concepts to the students; this instruction time included discussing homework. This is done to ensure that possible results cannot be ascribed to large differences in teaching style, since Confrey (1995) found that the length of instruction on proportionality was related to the success rate (as cited in Watson et al., 2013). These field notes can be found in Appendix G. These field notes show that both teachers used their designated pedagogies. See for some examples the notes students made during class. The intervention period ended with both groups doing the same test, the survey developed for this study. See Appendix B for the survey and Appendix C for the two versions of the score form. This resulted in two types of data for each student: a score per question (varying from zero to the maximum amount of points for that question) and a classification for their answer (SaLVO / Numbers & Space / non-discriminating or other pedagogy). To illustrate, the dataset looked like Table 3. Table 3 Illustrating the dataset Student Score01 Type01 Score02 Type02 etc SaLVO 0 Numbers & Space 02 0 Non-discr. 1 Numbers & Space 5.2. ANALYZING THE DATA Inter-rater reliability To ensure inter-rater reliability three coders independently rated four randomly chosen surveys with each 13 items, two from the SaLVO group and two from the N&S group. The raters coded each question with one of the following five codes: SaLVO, SaLVO?, non-discriminating, N&S? and N&S. Since this is nominal data and there were more than two raters involved a generalized version of Cohen s Kappa was used to analyze the inter-rater agreement (Geertzen, 2012). Three raters coding 4 13 = 52 items resulted in a high agreement, Fleiss Kappa =.883, which is above the threshold. Comparability of the two groups To ensure that the SaLVO group and the N&S group can be compared three factors were taken into account. The first factor is the heterogeneity of the two groups. If the groups are not heterogeneous, a difference found in test scores could possibly be due to the previous year (teacher) and the previous knowledge of the student. LastYearGroup is a nominal variable with seven possible outcomes. This variable is explored using a histogram which can be found in Appendix H. The second factor is the groups starting level. As an estimator of this level, last year s average grade of each student is used. LastYearGrade is an interval variable. LastYearGrade satisfies the normality condition for both groups. The groups means are compared using an independent t- test. On average, last year s grade in the SaLVO group (M = 7.71, SE = 0.73) did not differ significantly from the N&S group (M = 7.37, SE = 0.83), t(52) = -1.61, p >
31 As a third factor the test score on the first three questions is compared: Score123. There is no difference in answering method for these three questions, so the groups should score equally on these questions. The test score on the first three questions is an interval variable. However, Score123 does not meet the assumptions for a parametric test. The test score on the first three items is significantly non-normal for both the SaLVO group, D(29) =.19, p <.05, and the N&S group, D(25) =.31, p <.001. Furthermore, the variances in the two groups were significantly different, F(1, 52) = 5.70, p <.021, this made the Mann-Whitney test unsuitable. For the analysis the Kolmogorov-Smirnov test is used since it has no assumption on the distribution of the data. This test compares the cumulative distribution functions for the two populations. The Kolmogorov-Smirnov test shows no significant difference between the two distributions of the test score on the first three items (K-S =.738, ns). Comparing the two groups To answer hypotheses 1, 2 and 3 the overall test scores are compared. The test score is computed by adding up all scores for each questions. This results in a number between 0 and 30. TestScore is an interval variable. The test scores for the Reproduction & Applying1 questions (TestScoreRA1) are computed by adding up all scores for these types of questions. The same is done for the Applying2 & Insight questions, which results in TestScoreA2I. TestScore meets all assumptions for a parametric test. To test hypothesis 1 an independent t-test is used. TestScoreRA1 and TestScoreA2I are not normally distributed. However, the variances in the two groups are not significantly different for TestScoreRA1 (F(1, 52) =.271, ns) and for TestScoreA2I (F(1, 52) = 1.942, ns). Thus for testing hypotheses 2 and 3 the Mann-Whitney 2 independent samples test is used. Comparing the two approaches For hypotheses 4, 5 and 6 the analysis is more complicated. The variable Approach is not independent since the students choose which method to use. Since they can switch at every question, the number of students using a specific method differs per question. It is impossible to predict how large the N-values are for each question. Even if the numbers stay constant, it is very likely not the same group of students. Hypotheses 4, 5 and 6 will thus be analyzed on questionlevel with the most suitable option: a Chi-Square test. This test requires the conversion of the dependent variables ScoreXX 18 into binary variables. Chosen was to recode zero points into 0 and one or more points into 1. This way all variables were recoded the same way. The Chi-Square test has the underlying assumption that in 2 2 tables all expected frequencies should be greater than 5. Other tests were excluded due to two statistical reasons. The dependent variables were all not normally distributed because of the little variation in possible scores (0, 1, 2 or 3 points). Since there is so little variation (a lot of students with the same score), a rank sum test like the Mann- Whitney U would make no sense either. 18 XX being the question number, e.g. Score01 for the points scored on question 1. 31
32 6. RESULTS 6.1. THE EFFECT OF GROUP ON PERFORMANCE Hypothesis 1 is not supported. There is no statistical mean difference in test score between the SaLVO group and the Numbers & Space group, see Table 4. The SaLVO group did not perform better than the Numbers & Space group. Table 4 Results of t-test and Descriptive Statistics for overall test score Group SaLVO Numbers & Space 95% CI for Mean Difference M SD n M SD n t df Test score , Hypothesis 2 is supported. There is no statistical difference in test scores on the Reproduction and Applying 1 questions between the SaLVO group and the Numbers & Space group, see Table 5. The SaLVO group and the Numbers & Space group performed equally on these questions. Hypothesis 3 is not supported. There is no statistical difference in test scores on the Applying 2 and Insight questions between the SaLVO group and the Numbers & Space group. The SaLVO group did not perform better on these questions, in fact there is a small sized effect in favor of the Numbers & Space group. Table 5 Results of Mann-Whitney U test and Descriptive Statistics for Test Score on RA1 and A2I questions Group SaLVO Numbers & Space Mdn Mean Rank n Mdn Mean Rank n U Z r Test score Reproduction&Applying1 Test score Applying 2 & Insight THE EFFECT OF APPROACH ON PERFORMANCE Questions 6, 7, 9, 10, 11 and 13 will be taken into account for the analysis on question-level. On these questions more than 40% of the students used the approach from the pedagogy ascribed to them. On some questions the SaLVO students did not use the SaLVO approach. Questions 4, 5, 8 and 12 are excluded from this analysis for this reason. Question 1, 2 and 3 are excluded since no difference in answering approach was possible. Detailed information on the distribution of the chosen approaches per group can be found in Appendix I. 32
33 To give the reader an idea of how the approaches effected the performance on the test, Table 6 shows the mean, standard deviation and N 19 for each question. We can already see that these averages do not differ that much. To see these numbers visually and in comparison with the nondiscriminating approach, see Appendix J. Table 6 Descriptive statistics for several questions Approach RTTI type SaLVO Numbers & Space M SD n M SD n Question T1 Question T1 Question R Question R Question R Question I It turned out that for all questions the expected frequencies are too low to perform the Chi-Square test, except for question 11. There was no significant association between the type of approach and whether or not the students would gain points on question 11, χ 2 (1, N=45) =.076, ns. For this question, the odds of gaining points after using the SaLVO approach were 1.19 times higher than after using the Numbers & Space approach. Hypotheses 4, 5, and 6 are not supported for lack of statistical evidence. Two remarks on the numbers in Appendix J. When looking at the approaches used by students, we see that the SaLVO group only used the SaLVO approach on questions about percentages. For the three questions (4, 5, 8) on enlarging surfaces and volumes only in 6 out of 87 answers (7%) from the SaLVO group the SaLVO approach was found. For the questions on percentages (6, 7, 9, 10, 11, 12, 13) the SaLVO approach was found in 109 out of 203 answers (54%) from the SaLVO group. We do not see a clear distinction when looking at the RTTI-level of the questions. The SaLVO approach is used for all levels of questions. 19 The N-values do not add up to = 54 since the non-discriminating approach is left out of consideration. 33
34 7. CONCLUSION There was some evidence for the claim that the SaLVO material offers a solution for the conceptual and transfer problems students encounter on the topic of proportionality: teachers claimed they saw improvements in students work. This study presents a theoretical background which also gives rise to the claim that students would benefit from the SaLVO material. However this claim was never empirically tested. This study is testing this claim by an intervention period in which there were two groups. One group worked with the SaLVO material and one group worked with the Numbers & Spaces books. After several lessons on the topic proportionality both groups of students did the same test. This test was analysed on possible differences in scores. The aim of this study is measuring the effectiveness of the SaLVO pedagogy. The main research question was: To what extend is the SaLVO pedagogy effective on cognitive level for dealing with proportionality problems? This question was split into two sub-questions. 1) Did the SaLVO group performed better than the Numbers & Space group on answering the questions? 2) Did the SaLVO group performed better due to answering the questions using the SaLVO pedagogy? The results of this study show that there is no significant difference in the performance of both groups. There is no difference when looking at the overall score and there is no difference when looking at reproductive questions only and at insightful questions only. For the analysis of the approaches used by students (in contrast to in which group they were placed) the dataset was too small. The SaLVO pedagogy is equally effective on cognitive level as the Numbers & Space textbook used on schools for students dealing with proportionality problems. The results do however show that students do not use the SaLVO approach for questions on enlarging volumes and surfaces: they only use it on problems with percentages. Can we even draw conclusions if the SaLVO pedagogy is not used consistently? 34
35 8. DISCUSSION In this chapter three topics will be covered: 1) the SaLVO approach not being applied, 2) the research setting (survey test) and 3) suggestions for further research NOT USING THE SALVO APPROACH The results showed that the majority of the SaLVO students did not use the SaLVO approach on their tests (especially on the questions on the enlargement factor). This may partially be attributed to the design of the survey test (see paragraph 8.2), but mostly to the teaching. Appendix G shows that the SaLVO teacher gave instructions to the students following the SaLVO booklets conscientiously. The teacher always used a ratio table to explain and to answer the questions on percentages, as this is done in the booklet as well. The students got two notes with exercises to practice where they should fill in ratio tables. See Figure 6 below for an example. Figure 6 Student work, calculating with ratio tables Booklet 3 is not that strict anymore on using the ratio table. The ratio table is only twice shown as a way to present the data and to do the calculations. For the other exercises, the students can choose their own methods. Figure 7 shows that the students did not use the SaLVO approach in their exercises; and logically also not on their tests. Doing only the calculations and not writing down the ratio table was scored as Numbers & Space pedagogy in the score form. The researcher had not seen the student work when making the score form and when scoring the tests, since the booklets were not available to the researcher at that time. The teacher did followed the group work and learning by experiencing assumptions of the SaLVO pedagogy when teaching about enlargement factors. When explaining k² she brought DUPLO building blocks to school so the students would see the calculation rule. One of the other lessons the students did an experiment about k³ for enlarging surfaces. There was too little time left in class to discuss how to write down your answers for enlargement problems. 35
36 Figure 7 Work of two students on exercise 12 of the 3 rd SaLVO booklet That the students did not use the SaLVO approach the way it was labeled and scored in the score form caused that no conclusions could have been draw in this study. The main suggestion arising from this research is thus for the booklet and the teacher to be more strict on using the ratio table, especially for the enlargement problems. The booklet would have to be rewritten and future SaLVO teachers would have to be informed better about consistent use of the ratio table. Another option would be to give a (formative) test to the SaLVO group in between their lesson series to check whether they properly apply the SaLVO approach THE RESEARCH SETTING: LIMITATIONS Besides the non-using of the SaLVO approach, there are also some limitations on the setting of this research. For starters, the survey test has not been tested on (other) students before the final examination in this study. This should have been done one year before the final examination to the previous group of 8 th graders. This has not been done due to time-limitations. On the one hand this testing would have made the survey test better since minor ambiguities may have come to light; on the other hand no one of the students had any questions on the questioning in the survey. 36
37 Moreover the survey test has been checked several times by the researcher and the two senior teachers participating in this research. The survey test was not sufficient in discriminating between the two approaches. The test took place in the start of the second year of pre-university education, relatively early in the students school career. This is one of the reasons that many students used strategies they learnt in primary school for answering the questions on the test. Another reason is that the subject and the test gave the students the opportunity to do so, since doing calculations on percentages is a topic that is also covered in the elementary school curriculum. The learning goals were well distributed among the different questions in the test. Also there were different levels of thinking represented by the questions. The fact that the Numbers & Space students scored a lot higher on question 12 (see Appendix B) may have been that they recognized the context of this question more than the SaLVO students did. In both pedagogies there was a question on calculating a percentage of a percentage, but in the Numbers & Space booklet the context was a company that made profit as in the SaLVO booklet the context was on a photocopying machine SUGGESTIONS FOR FURTHER RESEARCH An alteration that could have been made in this research setting was the timeframe. Now there only was a short period of time between the lessons and the test. The last lessons the SaLVO students had was on a Friday with the test following the next Wednesday. For the Numbers & Space group this was a Tuesday and that same Wednesday. The hypothesis being that SaLVO students perform better on the insight questions, you would expect them to perform better than the Numbers & Space students after a certain amount of time passed. An underlying hypothesis is then that the SaLVO pedagogy sinks in (beklijft) better. Another alteration could be to test only after several SaLVO booklets and not after two; since the benefits of using the same method may only become visible after a longer time period in which students worked with the method in several courses. This way the coherency assumption is also taken into account. If this research was repeated more students (bigger dataset) should participate in the study to make sure that analyzing on question-level is possible. Since the claims teachers made about improvements in students work were stories about students in 10 th grade on the senior general secondary education level (4 havo) and not on 8 th grade pre-university grade level (2 vwo); it would be better to repeat this research on this group of students. In this research setting it was not possible due to practical reasons to do research on older students, since the 10 th grade students did not used the SaLVO booklets in 8 th and 9 th grade. This study has yielded on theoretical level: an overview of possible strategies for proportional problems (paragraph 2.5.3) and a description of the SaLVO pedagogy by means of five underlying assumptions (chapter 3). On practical level: this study was the first to empirically test the claim that the SaLVO pedagogy was more effective for proportionality problems. This study has not found statistical differences in effectiveness. However it can be used for further research as a theoretical and practical starting point implementing the suggestions described above. 37
38 REFERENCES Avcu, R., & Avcu, S. (2010). 6 th grade students' use of different strategies in solving ratio and proportion problems. Procedia Social and Behavioral Sciences, 9, Ben-Chaim, D., Keret, Y., & Ilany, B. S. (2012). Proportional reasoning. A psychological-didactical view. Ratio and proportion. research and teaching in mathematics teachers' education (preand in-service mathematics teachers of elementary and middle school classes). (pp ). Rotterdam: Sense Publishers. Boersma, K. T., Bulte, A., Krüger, J., Pieters, M., & Seller, F. (2011). Samenhang in het natuurwetenschappelijk onderwijs voor havo en vwo [Coherency in secondary science education]. Utrecht: Stichting Innovatie van Onderwijs in Bètawetenschappen en Technologie (IOBT). Broekman, H., van der Valk, T., & Wijers, M. (2000). Teacher knowledge needed to teach ratio and proportion in secondary school mathematics: On using the ratio table. 25th Annual Association for Teacher Education in Europe Conference, Barcelona, Spain. Cramer, K., Post, T., & Currier, S. (1993). Learning and teaching ratio and proportion: Research implications. In D. T. Owens (Ed.), Research ideas for the classroom. middle grades mathematics. (pp ). New York: Macmillan Publishing Company. de Bock, D., van Dooren, W., Janssens, D., & Verschaffel, L. (2003). Waarom lineariteit de leerlingen soms parten speelt. een dieptestudie in het voortgezet onderwijs. [Why proportionality sometimes works against students. An in-depth study in secondary education.] Nieuwe Wiskrant, 22(4), Dierdorp, A., Bakker, A., van Maanen, J. A., & Eijkelhof, H. M. C. (2014). Meaningful statistics in professional practices as a bridge between mathematics and science: An evaluation of a design research project. International Journal of STEM Education, 1(9) Drost, M., & Verra, P. (2013). Handboek RTTI [Handbook RTTI]. Bodegraven: Docentplus. English, L. D., & Halford, G. S. (1995). Proportional reasoning. Mathematics educaiton: Models and processes (pp ). Mahwah: NJ: Lawrence Erlbaum Associates. Geertzen, J. (2012). Inter-rater agreement with multiple raters and variables. Retrieved from Geraedts, C. L., Boersma, K. T., & Eijkelhof, H. M. C. (2006). Towards coherent science and technology education. Journal of Curriculum Studies, 38(3), Geraedts, C. L., Boersma, K. T., Huis, H., & Eijkelhof, H. M. C. (2001). Ruimte voor SONaTe. onderzoek naar good pratice op het gebied van samenhangend onderwijs in natuur en techniek in de basisvorming. [Opportunity for SONaTe. Research about good practice in the 38
39 field of coherent science and engineering education in the basic curriculum]. Delft: Stichting Axis. Hooyman, K., & Raterink, J. (2008). 3. Vergroten en verkleinen [3. enlargement and reduction]. Utrecht: Utrecht University. Hooyman, K., & Sonneveld, W. (2010). 6. Economie en procenten [6. Economics and percentages]. Utrecht: Utrecht University. Huijs, H., & Bruning, L. (2008). Op zoek naar samenhangend onderwijs nask en techniek in de basisvorming [Seeking coherent science and engineering education in the basic curriculum]. Enschede: SLO. Hurley, M. M. (2001). Reviewing integrated science and mathematics: The search for evidence and definitions from new perspectives. School Science and Mathematics, 101(5), Kali, Y., Linn, M. C., & Roseman, J. E. (2008). Designing coherent science education: Implications for curriculum, instruction, and policy. New York, NY: Teachers College Press. KNAW. (2003). Robuuste profielen in het voortgezet onderwijs [Robust clusters in secondary education]. Amsterdam: KNAW. Lake, K. (1994, Integrated curriculum. School Improvement Research Series, 8 (16), Lamon, S. J. (1993). Ratio and proportion: Connecting content and children's thinking. Journal for Research in Mathematics Education, 24(1), Mooldijk, A. H. (2013). Een leerlijn voor werken met verbanden [A teaching/learning trajectory for working with relations]. Retrieved from Mooldijk, A. H., & Sonneveld, W. (2010). Coherent education in mathematics and physics: The theme of proportionality in mathematics and physics. In N. Valadines (Ed.), Trends in science and mathematics education (TiSME) (pp ). Cyprus: Cassoulides. Reichard, L. A., Rozemond, S., Dijkhuis, J. H., Admiraal, C. J., te Vaarwerk, G. J., Verbeek, J. A., Wieringa, M. (2008a). Getal & Ruimte, 2 havo/vwo deel 1 [Numbers & space, 2 havo/vwo part 1] (3rd (2011) ed.). Houten: EPN. Reichard, L. A., Rozemond, S., Dijkhuis, J. H., Admiraal, C. J., te Vaarwerk, G. J., Verbeek, J. A., Wieringa, M. (2008b). Getal & Ruimte, 2 havo/vwo deel 2 [Numbers & space, 2 havo/vwo part 2] (3rd (2011) ed.). Houten: EPN. SLO. (2014). Onderzoek en ontwerpen (O&O) [research & design (R&D)]. Retrieved from 39
40 Steinthorsdottir, O. B. (2006). Proportional reasoning: Variable influencing the problems difficulty level and one's use of problem solving strategies. In J. Novotná, H. Moraová, M. Krátká & N. Sthelíková (Eds.), Proceedings 30 th conference of the international group for the psychology of mathematics education (5th ed., pp ). Prague: PME. Taylor, A., & Jones, G. (2009). Proportional reasoning ability and concepts of scale: Surface area to volume relationships in science. International Journal of Science Education, 31(9), Tourniaire, F., & Pulos, S. (1985). Proportional reasoning: A review of the literature. Educational Studies in Mathematics, 16(2), van der Valk, T. (2001). Ratio table with multiple rows: Combustion heat and density as an example. Unpublished manuscript. van der Valk, T., Wijers, M., & Frederik, I. (2000). Using ratio tables from mathematics in secondary school science. 25th Annual Association for Teachers Education in Europe Conference, Barcelona, Spain. van Dooren, W., de Bock, D., Hessels, A., Janssens, D., & Verschaffel, L. (2005). Not everything is proportional: Effects of age and problem type on propensities for overgeneralization. Cognition and Instruction, 23(1), van Engelen, M. P., Boersma, K. T., & Eijkelhof, H. M. C. (2003). SONaTe in het buitenland [SONaTe abroad]. Delft: Stichting Axis. VO-raad. (2015). Mapping of schools: SGM st. bonifatiuscollege. Retrieved from Vos, P., den Braber, N., Roorda, G., & Goedhart, M. (2010). Hoe begrijpen en gebruiken docenten van de schoolvakken natuurkunde, scheikunde en economie het wiskundig concept 'afgeleide'? [How do secondary school physics, chemistry and economics teachers understand and use the mathematical concept 'derivative'?] Tijdschrift Voor Didactiek Der Bètawetenschappen, 27(1-2), Watson, A., Jones, K., & Pratt, D. (2013). Ratio and proportional reasoning. Key ideas in teaching mathematics (pp ). Oxford: Oxford University Press. Wolthoff, M. F. (2013). Effects of coherency on students' science and mathematics perception, using the dutch SaLVO project for coherent science and mathematics education. (Unpublished MSc). Utrecht University, Utrecht. Zegers, G. E., Boersma, K. T., Wijers, M., Pilot, A., & Eijkelhof, H. M. C. (2002). SONaTe in het studiehuis. onderzoek naar good practice op het gebied van samenhangend onderwijs in natuur en techniek in de tweede fase. [SONaTe in upper secondary education. Reserach on good practice in the field of coherent education in science and engineering in the "Second Phase"]. Delft: Stichting Axis. 40
41 APPENDICES A. List of learning goals B. Survey (test) C. Score form D. Survey analysis Learning goals E. Survey analysis Types of problems F. Survey analysis RTTI G. Field notes H. Comparability the SaLVO group with the N&S Group I. Approaches used per student per question J. Points gained per approach per question
42 A. LIST OF LEARNING GOALS After working through the SaLVO booklets or through the Numbers & Space book the students are able to: 1) Doing calculations on ratios (e.g. a recipe with several ingredients) 2) Calculate the enlargement factor k by a) Dividing two given or measured lengths/widths/heights/numbers b) Converting a given scale and vice versa c) Converting a given growth percentage d) Taking the root of a given or calculated k² 3) Calculate the squared enlargement factor k² by a) Squaring a given or calculated enlargement factor k b) Dividing two given or calculated surfaces 4) Calculate the cubed enlargement factor k³ by a) Cubing a given or calculated enlargement factor k b) Dividing two given or calculated volumes 5) Calculate the asked length/width/height by using k (and knowing that k has to be used) 6) Calculate the asked surface by using k² (and knowing that k² has to be used) 7) Calculate the asked volume by using k³ (and knowing that k³ has to be used) 8) Draw an enlargement of a given image using a) A given enlargement factor k b) A given percentage 9) Write a percentage as a) a decimal number b) an enlargement factor 10) Calculations with percentages a) Calculate x% of y (e.g. what is 24% of 336?) b) Calculate how many percent x is out of y (e.g. how many % is 24 of 500?) c) Calculate the new value y with a given percentage change from x (both percentage increase as decrease) d) Calculate the percentage change from x to y (both increase/decrease) 42
43 B. SURVEY (TEST) 43
44 44
45 C. SCORE FORM The first score form covers the SaLVO approach, the second one covers the Numbers & Space approach. Both score forms give an equal amount of points for the same steps in the solution process. SaLVO approach Vergroten (4 punten) Schrijf als decimaal getal 1p. 1. Figuur C is een vergroting van figuur F. Bereken de vergrotingsfactor. k = 6 3 = 2 1p. 2. Figuur E is een verkleining van figuur D. Bereken de vergrotingsfactor. linker zijkant E k = linker zijkant D = 2 4 = 1 2 2p. 3. Is figuur B een vergroting van figuur A? Zo nee, leg uit. Zo ja, bereken de vergrotingsfactor. Nee, want de zijkant (of onderkant) is vergroot met factor k = 3 = 1,5, maar 2 de dikte van de uitsteeksels (of de ruimte er tussen) niet. Russische babushka poppen (5 punten) Hiernaast zie je drie gelijkvormige babushka poppen. Babushka 2 is 12 cm hoog en babushka 3 is 30 cm hoog. 3p. 4. De inhoud van babushka 2 is 0,8 liter. Bereken de inhoud van babushka 3. Babushka 2 Babushka 3 Hoogte (cm) Factor k k = 1 k = 2,5 Inhoud (l) 0,8 12,5-1p. bij vergeten eenheden in de tabel 45
46 2p. 5. De vergrotingsfactor van babushka 1 naar babushka 2 is 1,4. De oppervlakte van de onderkant van babushka 1 is 14,5 cm². Bereken de oppervlakte van de onderkant van babushka 2. Babushka 1 Babushka 2 Factor k k = 1 k = 1,4 Oppervlakte (cm²) 14,5 28,42-1p. bij vergeten eenheid cm² Vliegtickets (4 punten) Een vliegreis maken in de vakantieperiode is duur. Een reis naar Canada kost in november 500. Dezelfde reis kost in de kerstvakantie p. 6. Hoeveel procent bedraagt de prijsverhoging? Oude prijs Nieuwe prijs in procenten 100% 141% Bedrag in euro p. De prijsverhoging is 41% Twee weken na de kerstvakantie kost de reis van 705 nog maar 606, Hoeveel procent bedraagt de korting? Oude prijs Nieuwe prijs in procenten 100% 86% Bedrag in euro ,30 De korting is = 14% Tuinontwerp op schaal (4 punten) Hiernaast zie je een ontwerp van een tuin getekend. De schaal is helaas onleesbaar geworden door de modderhanden van de tuinman. In de tuin zie je een cirkelvormige vijver. De oppervlakte van de vijver op de plattegrond is 7 cm². De oppervlakte van de echte vijver is 15,75 m². 46
47 4p. 8. Bereken de schaal van het ontwerp, en schrijf je antwoord in de vorm: de schaal is 1:. Ontwerp Werkelijkheid Oppervlakte (cm²) Factor k² k 2 = Factor k k = 150 De schaal is (1p.) CD verzamelaar (3 punten) Johan, een liefhebber van muziek, luistert alleen nog maar muziek via Spotify. Hij besluit daarom zijn collectie van 480 CD s te verkopen via een winkel. Alle CD s samen worden voor 2500 euro verkocht. Johan heeft de 480 CD s een paar jaar geleden op een beurs voor verzamelaars gekocht voor 20% meer. 1p. 9. Hoeveel heeft Johan toen betaald voor zijn collectie CD s? Oude prijs Nieuwe prijs in procenten 120% 100% Bedrag in euro Hij betaalde toen 1, = 3000 euro. 1p. De winkeleigenaar houdt zelf 15% van het verkoopbedrag van 2500 euro. 10. Bereken hoeveel de winkeleigenaar krijgt. Hele bedrag Winkeleigenaar in procenten 100% 15% Bedrag in euro De winkeleigenaar houdt 0, = 375 euro 1p. De nieuwe eigenaar van de CD s is niet zo blij met zijn aankoop. Het blijkt dat 54 van de CD s beschadigd is. 11. Hoeveel procent van de collectie CD s is beschadigd? Alle CD s Beschadigd in procenten 100% 11,25% Bedrag in euro
48 Omzet (5 punten) In 2011 ging het goed met de PLUS aan de A. van Ostadelaan. Twee jaar achter elkaar nam de omzet met 10% per jaar toe. Door de komst van de Jumbo nam de omzet het jaar erop in één keer met 20% af. 3p. 12. Bereken of leg uit met hoeveel procent de omzet van de PLUS is gestegen/gedaald/gelijk gebleven na 3 jaar. Oude prijs Nieuwe prijs Nieuwe prijs Nieuwe prijs in procenten 100% 110% 121% 96,8% Bedrag in euro De omzet is dus gedaald met ,8 = 3,2%. Alleen conclusie gedaald zonder percentage = 1p. OF Uitleg + conclusie zonder percentage = 2p. De 20% gaat van een groter bedrag af, dus dit is meer dan twee keer 10% over een kleiner bedrag. De omzet is dus gedaald na drie jaar. OF Berekening + conclusie = 3p. De omzet is nog 1,1 1,1 0,8 = 0,968 = 96,8% van de oude omzet De omzet is dus gedaald met ,8 = 3,2% In 2014 bedroeg de omzet van deze PLUS 3,4 miljoen euro. Dit was 26% van de totale omzet van alle PLUS filialen in de hele stad Utrecht. 13. Bereken de omzet van 2014 van alle PLUS filialen uit Utrecht samen. 2p. PLUS Alle filialen in procenten 26% 100% Bedrag in euro 3,4 miljoen 13,07 miljoen 48
49 Numbers & Space group Vergroten (4 punten) Schrijf als decimaal getal 1p. 1. Figuur C is een vergroting van figuur F. Bereken de vergrotingsfactor. k = 6 3 = 2 1p. 2. Figuur E is een verkleining van figuur D. Bereken de vergrotingsfactor. linker zijkant E k = linker zijkant D = 2 4 = 1 2 2p. 3. Is figuur B een vergroting van figuur A? Zo nee, leg uit. Zo ja, bereken de vergrotingsfactor. Nee, want de zijkant (of onderkant) is vergroot met factor k = 3 2 = 1,5, maar de dikte van de uitsteeksels (of de ruimte er tussen) niet. Russische babushka poppen (5 punten) Hiernaast zie je drie gelijkvormige babushka poppen. Babushka 2 is 12 cm hoog en babushka 3 is 30 cm hoog. 3p. 4. De inhoud van babushka 2 is 0,8 liter. Bereken de inhoud van babushka 3. De vergrotingsfactor is k = 30 = 2,5. (1p) 12 We rekenen met inhoud dus nodig is k³ (1p voor gebruik k³) De inhoud van babushka 3 is 0,8 2,5 3 = 12,5 liter (1p) -1p. bij vergeten eenheid liter 2p. 5. De vergrotingsfactor van babushka 1 naar babushka 2 is 1,4. De oppervlakte van de onderkant van babushka 1 is 14,5 cm². Bereken de oppervlakte van de onderkant van babushka 2. We rekenen met oppervlakte dus nodig is k² (1p voor gebruik k²) De oppervlakte is 14,5 1,4 2 = 28,42 cm² (1p) -1p. bij vergeten eenheid cm² 49
50 Vliegtickets (4 punten) Een vliegreis maken in de vakantieperiode is duur. Een reis naar Canada kost in november 500. Dezelfde reis kost in de kerstvakantie p. 6. Hoeveel procent bedraagt de prijsverhoging? De prijsverhoging is = 0, = 41% 500 2p. Twee weken na de kerstvakantie kost de reis van 705 nog maar 606, Hoeveel procent bedraagt de korting? De prijsverandering is 606, = 0, = 14% 705 Dus de korting is 14% Tuinontwerp op schaal (4 punten) Hiernaast zie je een ontwerp van een tuin getekend. De schaal is helaas onleesbaar geworden door de modderhanden van de tuinman. In de tuin zie je een cirkelvormige vijver. De oppervlakte van de vijver op de plattegrond is 7 cm². De oppervlakte van de echte vijver is 15,75 m². 4p. 8. Bereken de schaal van het ontwerp, en schrijf je antwoord in de vorm: de schaal is 1:. De oppervlakte van de vijver is 15,75 m 2 = cm² (1p.) We weten k 2 = = (1p.) De vergrotingsfactor is dus k = = 150 (1p.) De schaal is (1p.) CD verzamelaar (3 punten) Johan, een liefhebber van muziek, luistert alleen nog maar muziek via Spotify. Hij besluit daarom zijn collectie van 480 CD s te verkopen via een winkel. Alle CD s samen worden voor 2500 euro verkocht. Johan heeft de 480 CD s een paar jaar geleden op een beurs voor verzamelaars gekocht voor 20% meer. 1p. 9. Hoeveel heeft Johan toen betaald voor zijn collectie CD s? Hij betaalde toen 1, = 3000 euro. De winkeleigenaar houdt zelf 15% van het verkoopbedrag van 2500 euro. 1p. 10. Bereken hoeveel de winkeleigenaar krijgt. 50
51 De winkeleigenaar houdt 0, = 375 euro 1p. De nieuwe eigenaar van de CD s is niet zo blij met zijn aankoop. Het blijkt dat 54 van de CD s beschadigd is. 11. Hoeveel procent van de collectie CD s is beschadigd? Er is = 11,25% beschadigd. 480 Omzet (5 punten) In 2011 ging het goed met de PLUS aan de A. van Ostadelaan. Twee jaar achter elkaar nam de omzet met 10% per jaar toe. Door de komst van de Jumbo nam de omzet het jaar erop in één keer met 20% af. 3p. 12. Bereken of leg uit met hoeveel procent de omzet van de PLUS is gestegen/gedaald/gelijk gebleven na 3 jaar. Alleen conclusie gedaald zonder percentage = 1p. OF Uitleg + conclusie zonder percentage = 2p. De 20% gaat van een groter bedrag af, dus dit is meer dan twee keer 10% over een kleiner bedrag. De omzet is dus gedaald na drie jaar. OF Berekening + conclusie = 3p. De omzet is nog 1,1 1,1 0,8 = 0,968 = 96,8% van de oude omzet De omzet is dus gedaald met ,8 = 3,2% In 2014 bedroeg de omzet van deze PLUS 3,4 miljoen euro. Dit was 26% van de totale omzet van alle PLUS filialen in de hele stad Utrecht. 2p. 13. Bereken de omzet van 2014 van alle PLUS filialen uit Utrecht samen. 3,4 miljoen euro = 26% Dus 1% = 0, miljoen euro (1p) Dus 100% = 13,07 miljoen euro (1p) 51
52 D. SURVEY ANALYSIS LEARNING GOALS Table 7 provides an overview of how the learning goals (see Appendix A) are reflected in the survey test. The number between brackets refers to the number of points that can be earned for each learning goal. Table 7 Analysis of presence of learning goals in survey test questions Learning goals 1 Doing calculations on ratios 2 a Question [points] Calculate the enlargement factor k by Dividing two given or measured lengths/widths/heights/numbers 1, 2, 3 [4] 4 [1] b Converting a given scale and vice versa 8 [1] c Converting a given growth percentage d Taking the root of a given or calculated k² 8 [1] Calculate the squared enlargement factor k² by Squaring a given or calculated enlargement factor k 5 [1] 3 a b Dividing two given or calculated surfaces 8 [1] 4 a Calculate the cubed enlargement factor k³ by Cubing a given or calculated enlargement factor k 4 [1] b Dividing two given or calculated volumes 5 Calculate the asked length/width/height by using k 6 Calculate the asked surface by using k² 5 [1] 7 Calculate the asked volume by using k³ 4 [1] 8 a b Draw an enlargement of a given image using A given enlargement factor k A given percentage 9 a b 10 a Write a percentage as a decimal number an enlargement factor Calculations with percentages Calculate x% of y 10 [1] 13 [2] b Calculate how many percent x is out of y 11 [1] c Calculate the new value y with a given percentage change from x 9 [1] d Calculate the percentage change from x to y 6, 7 [4] 12 [3] Furthermore, 1 point can be gained by calculating cm² to m². 52
53 E. SURVEY ANALYSIS TYPES OF PROBLEMS The first column of Table 8 refers to the numbers on the survey (see Appendix B). The numbers in the second and third column refer to the lists of problem types and the assessment problem types respectively. These lists are copied in a shortened way below. For a further description see paragraph (p.10). Type of Problem: 1. Comparing two parts of a single whole 2. Comparing quantities of the same nature 3. Comparing quantities of different natures Type of Assessment: 1. Missing value problems 2. Numerical comparison problems 3. Estimation problems Table 8 Analysis of type of (assessment) problems Question Type of Problem Type of Assessment
54 F. SURVEY ANALYSIS RTTI Table 9 RTTI characterization for each survey questiontable 9 shows for every question the RTTI label. Table 10 shows how many points can be gained in what level of the RTTI systematic. The question numbers refer to the numbers on the survey (see Appendix B). In total 25 points can be gained. Table 9 RTTI characterization for each survey question Question RTTI Type 1 R 2 R 3 T2 4 T1 5 T1 6 T1 7 T1 8 T1 & T2 9 R 10 R 11 R 12 I 13 T2 Table 10 Analysis of RTTI points for each survey question Question points for Reproduction points for Applying 1 (familiar context) points for Applying 2 (new context) points for Insight Total (%) 5 (20%) 12 (48%) 5 (20%) 3 (12%) 68% 32% 54
55 G. FIELD NOTES SaLVO group In total: 114 minutes of explaining. 1. Wednesday September 16 th 6 minutes The teacher explained that the class is part of a study. After this follows an introduction on the concept proportional. Together they start with the SaLVO booklet on page 5. Students homework: exercise Thursday September 17 th 11½ minutes Discussing the concept multiplying factor that the students encountered in their homework. The students do the Entry level on page 9 and after this they discuss it with the class. Students homework: exercise Friday September 18 th 5 minutes Explaining that the multiplying factor is smaller than one when you are reducing instead of enlarging. Students homework: exercise Wednesday September 23 th 21 minutes Discussing the 3 Entry level and the concept of using the multiplication factor for calculating percentages. Then how to calculate a percentage change. The students make this note in their booklets. 55
56 Students homework: exercise 18, 19, 20 again but with multiplication factor, instap blz. 20 and exercise 21, 22. * Thursday 24 th the students had a test on the previous chapter. 5. Friday September 25 th 12 minutes Discussing the Entry level on page 20, and the concept of backwards calculations. The students get a lot of time to do their homework. Students homework: Wednesday September 30 th 16 minutes The teacher starts with four example test exercises. The students get 9 minutes to do these exercises and afterwards the teacher explains them. The students all have to do the exercise with multiplication tables. After this the teacher introduces the subject of enlarging and decreasing surfaces, by asking what will happen if you set the copy machine on 50%. The students do the Instap on page 15 and afterwards discuss their methods with the teacher. Students homework: from booklet 3. 56

57 7. Thursday October 1 st 12½ minutes Explaining the concept of multiple reductions. How many percent is left when you decrease with 30% for two times? This means two times calculating with 70% thus with 0.7. After this explaining the concept of backwards calculation again. If you know that a decrease of 2.3% represents 350, how many is left? The students have to draw multiplication tables to find out. Then the teacher and students work on exercise 18. If you know k² how do you calculate k? And what happens if k² is smaller than 1? Students homework: (excl. 23). 8. Friday October 2 nd 12 minutes Discussing the homework problems. Introducing the concept of the multiplying factor with volumes. The teacher brought Duplo building blocks to explain. Students homework: Entry level page 36/37, exercise 36 and 38b 9. Wednesday October 7 th 4 minutes The teacher explains the experiment that the students will perform this lesson shortly. She discusses the general rule that the students had to fill in in exercise 36c: If all dimensions become k times as big, then the volume will become k³ times as big. The rest of the time the students work on the experiment. They work in groups of 4 or 5 students. They have to weigh how much rice fits in the cones they brought to class. They also have to measure and weigh clay balls to find the relationship they all filled in in exercise 36c. Students homework: finishing the calculations on the experiments (exercise 37 and 38). 10. Thursday October 8 th 7 minutes Discussing the results of the experiment done yesterday. The teacher remarks that there is a severe mistake in the booklet on page 43 and she lets the students find it. Students homework: Friday October 9 th 7 minutes Discussing the homework problems. The teacher lets the students make a note about length/surface/volume: the relation between adding 2 zeroes when going from m² to cm² and the multiplication factor. The students do exercise 44 in class. * Wednesday October 14 th the students made the survey test. 57
. How to calculate 20% of 400 with using a decimal number?")
58 Numbers & Space group In total: minutes of explaining. 1. Wednesday September 16 th 15 minutes The teacher explained that the class is part of a study and that they will work with their normal textbooks. The students start with percentages. The teacher explained the link between percentages and decimal numbers (pre-knowledge of students). How to calculate 20% of 400 with using a decimal number? The students come up with other ways, the teacher emphasizes that a decimal number needs to be used. The students work on exercises 2, 3, 4 and 5. After 10 minutes the teacher discusses exercises 2 and 3. Students homework: 4, 5, Monday September 21 st 5 minutes The teacher starts with discussing the answers on exercises 4, 5, and 8 and links this to the new theory: calculating the new value with a given percentage change. For example, an amount of 85 increases with 21%. The rest of the lesson the teacher talks about the previous chapter. Students homework: 10, 11, 12 * Tuesday 22 nd the students had a test on the previous chapter. 3. Wednesday September 23 rd 10 minutes The teacher starts with the answers for the questions 10, 11, 12. Afterwards they talk on percentage change when the amount is decreasing. The teacher also explains how the students should write their answers. They should use decimal numbers for percentages. The students work on their homework the rest of the lesson. Students homework: 15, 16, 17, read theory on p. 127, 20ab, 21, Monday September 28 th 6 minutes The teacher checks the exercises with the students by talking about the answers. The teacher gives the student an overview of the things they have learned so far, supplemented with the new concept of percentage change. The students learn (new old) / old x 100%. The students write the note below in their notebooks. Afterwards, students work on their homework. Students homework: 23, 24, theory blz. 129, 26 58

59 5. Tuesday September 29 th 9 minutes The teacher checks the exercises with the students. After this she gives the students five exercises to practice. The students make the exercises themselves. Afterwards the teachers asks a student for each question to give the answers. She writes this, with the required notation, on the whiteboard. After this note the students work on exercises 27, 28 and 29. You can see in this student note that this student made mistakes in the first two questions and wrote the right way underneath her own calculations. Students homework: 27, 28, 29, read theory between on p Wednesday September 30 th 15 minutes The teacher starts with discussing the answers on questions 27, 28 and 29. The rule (new old) / old x 100% is discussed; and the teacher makes a remark about rounding percentages on 1 decimal. The teacher gives again five exercises to practice, but now demands that the students calculate it by typing in it in their calculators in once. For example, when calculating how much you have to pay when you get 18% discount on 75, she wants the students to type in and not first and then 75 Ans. Regarding the last exercise the teacher makes the remark that the calculator says 13.3 so that this means a discount of 13.3%. See the note on the next page. The rest of the lesson students work on exercises Students homework: 30, 31, 32, 33 59
.")

60 7. Monday October 5 th 20 minutes Today the teacher starts with the second part of the booklet, the part about enlarging figures and other objects. The teacher explains the concept of enlargement factor and that they have to measure the original and the image. In class the students work on exercise 29, 30, 31, 32 (of chapter 8). Students homework: finish exercise 32, do 33, 34, Tuesday October 6 th 15 minutes The teacher starts with repeating yesterdays information about the enlargement factor. Which letter do we use? What do we know when 0 < k < 1? What do we call the original? After this the teacher gives the answers on questions 32, 33 and 34 so the students can check these. Then the students have to draw a rectangle of 1 4 cm and draw the rectangle that has been enlarged with factor 3. Then they have to calculate the surface and see if they see a relation between those surfaces. They learn that surface old k² = surface new. They check if this also holds when k < 1. It does. The students have to start working on exercise 38 but they do not know how to proceed. The teacher explains that they need to measure the images for calculating k. There still is some time left to work on exercise 39 and 40. Students homework: Wednesday October 7 th 7½ minutes The teacher starts with discussing the answers of 38 and 43. She makes some notes about notation; write down your measurements and the dimension (cm, cm²). She explains that in exercise 43 you know that scale means that k = 250 and that you have to convert cm² to m² by removing four zeroes. After this the teacher writes two rectangles on the whiteboard, one with surface 3 and one with surface 75. She tells the students they have to be able to calculate the enlargement 60


61 factor. One student immediately says k = 5. Together with the class they see that k² = 75 3 so this means that k² = 25 and that k = 25 = 5. Afterwards, the students read the theory on page 107 on their own and start working on exercises 47 and further. Students homework: Monday October 12 th 20 minutes The teacher starts with discussing the answers of the homework. After this she gives a summary that the students make a note of. In class students work on exercises 50 and 51. Students homework: 52, 53, 57ab 11. Tuesday October 13 th 5 minutes In the last lessons the students can ask their questions and work on more exercises to practice with chapter 8. The teacher gives five questions on the topic percentages to practice this again. * Wednesday October 14 th the students made the survey test. 61

62 H. COMPARABILITY THE SALVO GROUP WITH THE N&S GROUP Heterogeneity The graph in Figure 8 shows the amount of students in respectively the SaLVO and Numbers & Space group that was last year in a specific 7 th grade class. There are six different 7 th grade classes: 1A, 1B, 1C, 1D, 1E and 1F. Some students enrolled in the 8 th grade coming from another school, these are labeled extern. Figure 8 In which class were the students the previous year? 62
63 I. APPROACHES USED PER STUDENT PER QUESTION The tables below show how many students used which approach for every question in the SaLVO group (Table 11) and the Numbers & Space group (Table 12). The letters below the question numbers refer to the question topic: P for percentages and E for enlarging. Table 11 Approaches used by the SaLVO group Question Approach used 1 E 2 E 3 E 4 E 5 E SaLVO 4 2 [13.8%] [6.9%] Non-discriminating [100%] [100%] [100%] [3.4%] Numbers & Space [86.2%] [89.7%] 6 P 25 [86.2%] 4 [13.8%] 7 P 26 [89.7%] 2 [6.9%] 1 [3.4%] Approach used 8 E 9 P SaLVO 13 [44.8%] Non-discriminating 15 9 [51.7%] [31.0%] Numbers & Space 14 7 [48.3%] [24.1%] Question P P [44.8%] [58.6%] 8 5 [27.6%] [17.2%] 8 7 [27.6%] [24.1%] 12 P 2 [6.9%] 27 [93.1%] 13 P 13 [44.8%] 11 [37.9%] 5 [17.2%] Table 12 Approaches used in the Numbers & Space group Question Approach used 1 E 2 E 3 E 4 E 5 E 6 P SaLVO 1 [4%] Non-discriminating [100%] [100%] [100%] [4%] Numbers & Space [100%] [100%] [92%] 7 P 1 [4%] 1 [4%] 23 [92%] Question Approach used 8 E 9 P 10 P 11 P 12 P 13 P SaLVO 1 [4%] Non-discriminating 2 [8%] 4 [16%] 3 [12%] 4 [16%] 20 [80%] 14 [56%] Numbers & Space 23 [92%] 21 [84%] 22 [88%] 21 [84%] 5 [20%] 10 [40%] 63
64 J. POINTS GAINED PER APPROACH PER QUESTION Below are six histograms that show how many points were gained on average on the questions 6, 7, 9, 10, 11, and 13; by using the SaLVO, non-discriminating or Numbers & Space approach. 64
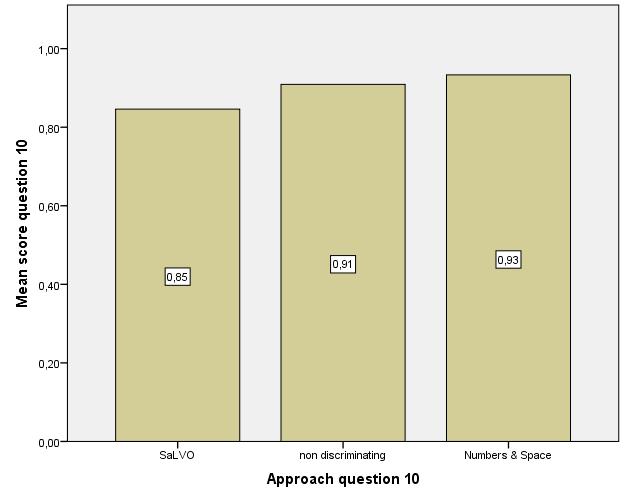
65 65
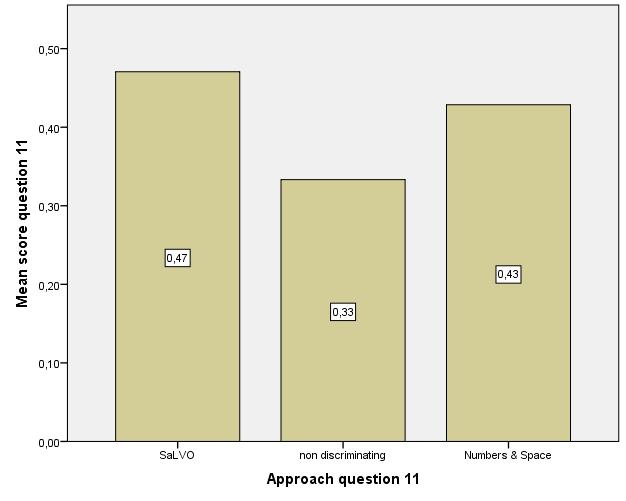
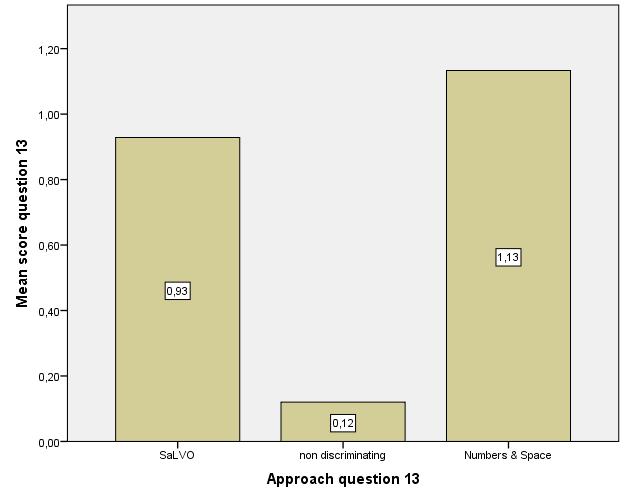
66 66
Extending Place Value with Whole Numbers to 1,000,000
 Grade 4 Mathematics, Quarter 1, Unit 1.1 Extending Place Value with Whole Numbers to 1,000,000 Overview Number of Instructional Days: 10 (1 day = 45 minutes) Content to Be Learned Recognize that a digit
AGS THE GREAT REVIEW GAME FOR PRE-ALGEBRA (CD) CORRELATED TO CALIFORNIA CONTENT STANDARDS
 CORRELATED TO CALIFORNIA CONTENT STANDARDS") AGS THE GREAT REVIEW GAME FOR PRE-ALGEBRA (CD) CORRELATED TO CALIFORNIA CONTENT STANDARDS 1 CALIFORNIA CONTENT STANDARDS: Chapter 1 ALGEBRA AND WHOLE NUMBERS Algebra and Functions 1.4 Students use algebraic
AGS THE GREAT REVIEW GAME FOR PRE-ALGEBRA (CD) CORRELATED TO CALIFORNIA CONTENT STANDARDS 1 CALIFORNIA CONTENT STANDARDS: Chapter 1 ALGEBRA AND WHOLE NUMBERS Algebra and Functions 1.4 Students use algebraic
Build on students informal understanding of sharing and proportionality to develop initial fraction concepts.
 Recommendation 1 Build on students informal understanding of sharing and proportionality to develop initial fraction concepts. Students come to kindergarten with a rudimentary understanding of basic fraction
Grade 6: Correlated to AGS Basic Math Skills
 Grade 6: Correlated to AGS Basic Math Skills Grade 6: Standard 1 Number Sense Students compare and order positive and negative integers, decimals, fractions, and mixed numbers. They find multiples and
Procedia - Social and Behavioral Sciences 197 ( 2015 )
") Available online at www.sciencedirect.com ScienceDirect Procedia - Social and Behavioral Sciences 197 ( 2015 ) 113 119 7th World Conference on Educational Sciences, (WCES-2015), 05-07 February 2015, Novotel
Available online at www.sciencedirect.com ScienceDirect Procedia - Social and Behavioral Sciences 197 ( 2015 ) 113 119 7th World Conference on Educational Sciences, (WCES-2015), 05-07 February 2015, Novotel
South Carolina College- and Career-Ready Standards for Mathematics. Standards Unpacking Documents Grade 5
 South Carolina College- and Career-Ready Standards for Mathematics Standards Unpacking Documents Grade 5 South Carolina College- and Career-Ready Standards for Mathematics Standards Unpacking Documents
Numeracy Medium term plan: Summer Term Level 2C/2B Year 2 Level 2A/3C
 Numeracy Medium term plan: Summer Term Level 2C/2B Year 2 Level 2A/3C Using and applying mathematics objectives (Problem solving, Communicating and Reasoning) Select the maths to use in some classroom
Algebra 1 Summer Packet
 Algebra 1 Summer Packet Name: Solve each problem and place the answer on the line to the left of the problem. Adding Integers A. Steps if both numbers are positive. Example: 3 + 4 Step 1: Add the two numbers.
Pedagogical Content Knowledge for Teaching Primary Mathematics: A Case Study of Two Teachers
 Pedagogical Content Knowledge for Teaching Primary Mathematics: A Case Study of Two Teachers Monica Baker University of Melbourne mbaker@huntingtower.vic.edu.au Helen Chick University of Melbourne h.chick@unimelb.edu.au
Using Proportions to Solve Percentage Problems I
 RP7-1 Using Proportions to Solve Percentage Problems I Pages 46 48 Standards: 7.RP.A. Goals: Students will write equivalent statements for proportions by keeping track of the part and the whole, and by
Mathematics subject curriculum
 Mathematics subject curriculum Dette er ei omsetjing av den fastsette læreplanteksten. Læreplanen er fastsett på Nynorsk Established as a Regulation by the Ministry of Education and Research on 24 June
prehending general textbooks, but are unable to compensate these problems on the micro level in comprehending mathematical texts.
 Summary Chapter 1 of this thesis shows that language plays an important role in education. Students are expected to learn from textbooks on their own, to listen actively to the instruction of the teacher,
Math 96: Intermediate Algebra in Context
 : Intermediate Algebra in Context Syllabus Spring Quarter 2016 Daily, 9:20 10:30am Instructor: Lauri Lindberg Office Hours@ tutoring: Tutoring Center (CAS-504) 8 9am & 1 2pm daily STEM (Math) Center (RAI-338)
Statewide Framework Document for:
 Statewide Framework Document for: 270301 Standards may be added to this document prior to submission, but may not be removed from the framework to meet state credit equivalency requirements. Performance
GCSE Mathematics B (Linear) Mark Scheme for November Component J567/04: Mathematics Paper 4 (Higher) General Certificate of Secondary Education
 Mark Scheme for November Component J567/04: Mathematics Paper 4 (Higher) General Certificate of Secondary Education") GCSE Mathematics B (Linear) Component J567/04: Mathematics Paper 4 (Higher) General Certificate of Secondary Education Mark Scheme for November 2014 Oxford Cambridge and RSA Examinations OCR (Oxford Cambridge
GCSE Mathematics B (Linear) Component J567/04: Mathematics Paper 4 (Higher) General Certificate of Secondary Education Mark Scheme for November 2014 Oxford Cambridge and RSA Examinations OCR (Oxford Cambridge
CAN PICTORIAL REPRESENTATIONS SUPPORT PROPORTIONAL REASONING? THE CASE OF A MIXING PAINT PROBLEM
 CAN PICTORIAL REPRESENTATIONS SUPPORT PROPORTIONAL REASONING? THE CASE OF A MIXING PAINT PROBLEM Christina Misailidou and Julian Williams University of Manchester Abstract In this paper we report on the
Montana Content Standards for Mathematics Grade 3. Montana Content Standards for Mathematical Practices and Mathematics Content Adopted November 2011
 Montana Content Standards for Mathematics Grade 3 Montana Content Standards for Mathematical Practices and Mathematics Content Adopted November 2011 Contents Standards for Mathematical Practice: Grade
Pre-Algebra A. Syllabus. Course Overview. Course Goals. General Skills. Credit Value
 Syllabus Pre-Algebra A Course Overview Pre-Algebra is a course designed to prepare you for future work in algebra. In Pre-Algebra, you will strengthen your knowledge of numbers as you look to transition
Alignment of Australian Curriculum Year Levels to the Scope and Sequence of Math-U-See Program
 Alignment of s to the Scope and Sequence of Math-U-See Program This table provides guidance to educators when aligning levels/resources to the Australian Curriculum (AC). The Math-U-See levels do not address
Edexcel GCSE. Statistics 1389 Paper 1H. June Mark Scheme. Statistics Edexcel GCSE
 Edexcel GCSE Statistics 1389 Paper 1H June 2007 Mark Scheme Edexcel GCSE Statistics 1389 NOTES ON MARKING PRINCIPLES 1 Types of mark M marks: method marks A marks: accuracy marks B marks: unconditional
Algebra 1, Quarter 3, Unit 3.1. Line of Best Fit. Overview
 Algebra 1, Quarter 3, Unit 3.1 Line of Best Fit Overview Number of instructional days 6 (1 day assessment) (1 day = 45 minutes) Content to be learned Analyze scatter plots and construct the line of best
Characteristics of Functions
 Characteristics of Functions Unit: 01 Lesson: 01 Suggested Duration: 10 days Lesson Synopsis Students will collect and organize data using various representations. They will identify the characteristics
Fourth Grade. Reporting Student Progress. Libertyville School District 70. Fourth Grade
 Fourth Grade Libertyville School District 70 Reporting Student Progress Fourth Grade A Message to Parents/Guardians: Libertyville Elementary District 70 teachers of students in kindergarten-5 utilize a
Page 1 of 11. Curriculum Map: Grade 4 Math Course: Math 4 Sub-topic: General. Grade(s): None specified
: None specified") Curriculum Map: Grade 4 Math Course: Math 4 Sub-topic: General Grade(s): None specified Unit: Creating a Community of Mathematical Thinkers Timeline: Week 1 The purpose of the Establishing a Community
Curriculum Map: Grade 4 Math Course: Math 4 Sub-topic: General Grade(s): None specified Unit: Creating a Community of Mathematical Thinkers Timeline: Week 1 The purpose of the Establishing a Community
Stacks Teacher notes. Activity description. Suitability. Time. AMP resources. Equipment. Key mathematical language. Key processes
 Stacks Teacher notes Activity description (Interactive not shown on this sheet.) Pupils start by exploring the patterns generated by moving counters between two stacks according to a fixed rule, doubling
CAAP. Content Analysis Report. Sample College. Institution Code: 9011 Institution Type: 4-Year Subgroup: none Test Date: Spring 2011
 CAAP Content Analysis Report Institution Code: 911 Institution Type: 4-Year Normative Group: 4-year Colleges Introduction This report provides information intended to help postsecondary institutions better
Functional Skills Mathematics Level 2 assessment
 Functional Skills Mathematics Level 2 assessment www.cityandguilds.com September 2015 Version 1.0 Marking scheme ONLINE V2 Level 2 Sample Paper 4 Mark Represent Analyse Interpret Open Fixed S1Q1 3 3 0
Cal s Dinner Card Deals
 Cal s Dinner Card Deals Overview: In this lesson students compare three linear functions in the context of Dinner Card Deals. Students are required to interpret a graph for each Dinner Card Deal to help
Guide to the Uniform mark scale (UMS) Uniform marks in A-level and GCSE exams
 Uniform marks in A-level and GCSE exams") Guide to the Uniform mark scale (UMS) Uniform marks in A-level and GCSE exams This booklet explains why the Uniform mark scale (UMS) is necessary and how it works. It is intended for exams officers and
Guide to the Uniform mark scale (UMS) Uniform marks in A-level and GCSE exams This booklet explains why the Uniform mark scale (UMS) is necessary and how it works. It is intended for exams officers and
The Indices Investigations Teacher s Notes
 The Indices Investigations Teacher s Notes These activities are for students to use independently of the teacher to practise and develop number and algebra properties.. Number Framework domain and stage:
MODULE FRAMEWORK AND ASSESSMENT SHEET
 MODULE FRAMEWORK AND ASSESSMENT SHEET LEARNING OUTCOMES (LOS) ASSESSMENT STANDARDS (ASS) FORMATIVE ASSESSMENT ASs Pages and (mark out of ) LOs (ave. out of ) SUMMATIVE ASSESSMENT Tasks or tests Ave for
What the National Curriculum requires in reading at Y5 and Y6
 What the National Curriculum requires in reading at Y5 and Y6 Word reading apply their growing knowledge of root words, prefixes and suffixes (morphology and etymology), as listed in Appendix 1 of the
Strategies for Solving Fraction Tasks and Their Link to Algebraic Thinking
 Strategies for Solving Fraction Tasks and Their Link to Algebraic Thinking Catherine Pearn The University of Melbourne Max Stephens The University of Melbourne
The New York City Department of Education. Grade 5 Mathematics Benchmark Assessment. Teacher Guide Spring 2013
 The New York City Department of Education Grade 5 Mathematics Benchmark Assessment Teacher Guide Spring 2013 February 11 March 19, 2013 2704324 Table of Contents Test Design and Instructional Purpose...
Paper 2. Mathematics test. Calculator allowed. First name. Last name. School KEY STAGE TIER
 259574_P2 5-7_KS3_Ma.qxd 1/4/04 4:14 PM Page 1 Ma KEY STAGE 3 TIER 5 7 2004 Mathematics test Paper 2 Calculator allowed Please read this page, but do not open your booklet until your teacher tells you
DIDACTIC MODEL BRIDGING A CONCEPT WITH PHENOMENA
 DIDACTIC MODEL BRIDGING A CONCEPT WITH PHENOMENA Beba Shternberg, Center for Educational Technology, Israel Michal Yerushalmy University of Haifa, Israel The article focuses on a specific method of constructing
Let s think about how to multiply and divide fractions by fractions!
 Let s think about how to multiply and divide fractions by fractions! June 25, 2007 (Monday) Takehaya Attached Elementary School, Tokyo Gakugei University Grade 6, Class # 1 (21 boys, 20 girls) Instructor:
Ohio s Learning Standards-Clear Learning Targets
 Ohio s Learning Standards-Clear Learning Targets Math Grade 1 Use addition and subtraction within 20 to solve word problems involving situations of 1.OA.1 adding to, taking from, putting together, taking
Math-U-See Correlation with the Common Core State Standards for Mathematical Content for Third Grade
 Math-U-See Correlation with the Common Core State Standards for Mathematical Content for Third Grade The third grade standards primarily address multiplication and division, which are covered in Math-U-See
Mathematics process categories
 Mathematics process categories All of the UK curricula define multiple categories of mathematical proficiency that require students to be able to use and apply mathematics, beyond simple recall of facts
Organising ROSE (The Relevance of Science Education) survey in Finland
 survey in Finland") 25.02.2004 1 Organising ROSE (The Relevance of Science Education) survey in Finland Researchers and support The Survey was organised by the following researchers at the Department of Teacher Education,
25.02.2004 1 Organising ROSE (The Relevance of Science Education) survey in Finland Researchers and support The Survey was organised by the following researchers at the Department of Teacher Education,
Learning Disability Functional Capacity Evaluation. Dear Doctor,
 Dear Doctor, I have been asked to formulate a vocational opinion regarding NAME s employability in light of his/her learning disability. To assist me with this evaluation I would appreciate if you can
Grade 2: Using a Number Line to Order and Compare Numbers Place Value Horizontal Content Strand
 Grade 2: Using a Number Line to Order and Compare Numbers Place Value Horizontal Content Strand Texas Essential Knowledge and Skills (TEKS): (2.1) Number, operation, and quantitative reasoning. The student
MASTER S THESIS GUIDE MASTER S PROGRAMME IN COMMUNICATION SCIENCE
 MASTER S THESIS GUIDE MASTER S PROGRAMME IN COMMUNICATION SCIENCE University of Amsterdam Graduate School of Communication Kloveniersburgwal 48 1012 CX Amsterdam The Netherlands E-mail address: scripties-cw-fmg@uva.nl
Unit 3 Ratios and Rates Math 6
 Number of Days: 20 11/27/17 12/22/17 Unit Goals Stage 1 Unit Description: Students study the concepts and language of ratios and unit rates. They use proportional reasoning to solve problems. In particular,
Relationships Between Motivation And Student Performance In A Technology-Rich Classroom Environment
 Relationships Between Motivation And Student Performance In A Technology-Rich Classroom Environment John Tapper & Sara Dalton Arden Brookstein, Derek Beaton, Stephen Hegedus jtapper@donahue.umassp.edu,
Math 121 Fundamentals of Mathematics I
 I. Course Description: Math 121 Fundamentals of Mathematics I Math 121 is a general course in the fundamentals of mathematics. It includes a study of concepts of numbers and fundamental operations with
The KAM project: Mathematics in vocational subjects*
 The KAM project: Mathematics in vocational subjects* Leif Maerker The KAM project is a project which used interdisciplinary teams in an integrated approach which attempted to connect the mathematical learning
Problem of the Month: Movin n Groovin
 : The Problems of the Month (POM) are used in a variety of ways to promote problem solving and to foster the first standard of mathematical practice from the Common Core State Standards: Make sense of
BENCHMARK MA.8.A.6.1. Reporting Category
 Grade MA..A.. Reporting Category BENCHMARK MA..A.. Number and Operations Standard Supporting Idea Number and Operations Benchmark MA..A.. Use exponents and scientific notation to write large and small
This scope and sequence assumes 160 days for instruction, divided among 15 units.
 In previous grades, students learned strategies for multiplication and division, developed understanding of structure of the place value system, and applied understanding of fractions to addition and subtraction
Written by Wendy Osterman
 Pre-Algebra Written by Wendy Osterman Editor: Alaska Hults Illustrator: Corbin Hillam Designer/Production: Moonhee Pak/Cari Helstrom Cover Designer: Barbara Peterson Art Director: Tom Cochrane Project
Focus of the Unit: Much of this unit focuses on extending previous skills of multiplication and division to multi-digit whole numbers.
 Approximate Time Frame: 3-4 weeks Connections to Previous Learning: In fourth grade, students fluently multiply (4-digit by 1-digit, 2-digit by 2-digit) and divide (4-digit by 1-digit) using strategies
1.11 I Know What Do You Know?
 50 SECONDARY MATH 1 // MODULE 1 1.11 I Know What Do You Know? A Practice Understanding Task CC BY Jim Larrison https://flic.kr/p/9mp2c9 In each of the problems below I share some of the information that
Are You Ready? Simplify Fractions
 SKILL 10 Simplify Fractions Teaching Skill 10 Objective Write a fraction in simplest form. Review the definition of simplest form with students. Ask: Is 3 written in simplest form? Why 7 or why not? (Yes,
Developing a concrete-pictorial-abstract model for negative number arithmetic
 Developing a concrete-pictorial-abstract model for negative number arithmetic Jai Sharma and Doreen Connor Nottingham Trent University Research findings and assessment results persistently identify negative
Mathematics. Mathematics
 Mathematics Program Description Successful completion of this major will assure competence in mathematics through differential and integral calculus, providing an adequate background for employment in
MERGA 20 - Aotearoa
 Assessing Number Sense: Collaborative Initiatives in Australia, United States, Sweden and Taiwan AIistair McIntosh, Jack Bana & Brian FarreII Edith Cowan University Group tests of Number Sense were devised
Introducing the New Iowa Assessments Mathematics Levels 12 14
 Introducing the New Iowa Assessments Mathematics Levels 12 14 ITP Assessment Tools Math Interim Assessments: Grades 3 8 Administered online Constructed Response Supplements Reading, Language Arts, Mathematics
THE PENNSYLVANIA STATE UNIVERSITY SCHREYER HONORS COLLEGE DEPARTMENT OF MATHEMATICS ASSESSING THE EFFECTIVENESS OF MULTIPLE CHOICE MATH TESTS
 THE PENNSYLVANIA STATE UNIVERSITY SCHREYER HONORS COLLEGE DEPARTMENT OF MATHEMATICS ASSESSING THE EFFECTIVENESS OF MULTIPLE CHOICE MATH TESTS ELIZABETH ANNE SOMERS Spring 2011 A thesis submitted in partial
An ICT environment to assess and support students mathematical problem-solving performance in non-routine puzzle-like word problems
 An ICT environment to assess and support students mathematical problem-solving performance in non-routine puzzle-like word problems Angeliki Kolovou* Marja van den Heuvel-Panhuizen*# Arthur Bakker* Iliada
Exploring Derivative Functions using HP Prime
 Exploring Derivative Functions using HP Prime Betty Voon Wan Niu betty@uniten.edu.my College of Engineering Universiti Tenaga Nasional Malaysia Wong Ling Shing Faculty of Health and Life Sciences, INTI
SURVIVING ON MARS WITH GEOGEBRA
 SURVIVING ON MARS WITH GEOGEBRA Lindsey States and Jenna Odom Miami University, OH Abstract: In this paper, the authors describe an interdisciplinary lesson focused on determining how long an astronaut
Physics 270: Experimental Physics
 2017 edition Lab Manual Physics 270 3 Physics 270: Experimental Physics Lecture: Lab: Instructor: Office: Email: Tuesdays, 2 3:50 PM Thursdays, 2 4:50 PM Dr. Uttam Manna 313C Moulton Hall umanna@ilstu.edu
Afm Math Review Download or Read Online ebook afm math review in PDF Format From The Best User Guide Database
 Afm Math Free PDF ebook Download: Afm Math Download or Read Online ebook afm math review in PDF Format From The Best User Guide Database C++ for Game Programming with DirectX9.0c and Raknet. Lesson 1.
TOPICS LEARNING OUTCOMES ACTIVITES ASSESSMENT Numbers and the number system
 Curriculum Overview Mathematics 1 st term 5º grade - 2010 TOPICS LEARNING OUTCOMES ACTIVITES ASSESSMENT Numbers and the number system Multiplies and divides decimals by 10 or 100. Multiplies and divide
COMPETENCY-BASED STATISTICS COURSES WITH FLEXIBLE LEARNING MATERIALS
 COMPETENCY-BASED STATISTICS COURSES WITH FLEXIBLE LEARNING MATERIALS Martin M. A. Valcke, Open Universiteit, Educational Technology Expertise Centre, The Netherlands This paper focuses on research and
UNIT ONE Tools of Algebra
 UNIT ONE Tools of Algebra Subject: Algebra 1 Grade: 9 th 10 th Standards and Benchmarks: 1 a, b,e; 3 a, b; 4 a, b; Overview My Lessons are following the first unit from Prentice Hall Algebra 1 1. Students
1 3-5 = Subtraction - a binary operation
 High School StuDEnts ConcEPtions of the Minus Sign Lisa L. Lamb, Jessica Pierson Bishop, and Randolph A. Philipp, Bonnie P Schappelle, Ian Whitacre, and Mindy Lewis - describe their research with students
Practices Worthy of Attention Step Up to High School Chicago Public Schools Chicago, Illinois
 Step Up to High School Chicago Public Schools Chicago, Illinois Summary of the Practice. Step Up to High School is a four-week transitional summer program for incoming ninth-graders in Chicago Public Schools.
First Grade Standards
 These are the standards for what is taught throughout the year in First Grade. It is the expectation that these skills will be reinforced after they have been taught. Mathematical Practice Standards Taught
Foothill College Fall 2014 Math My Way Math 230/235 MTWThF 10:00-11:50 (click on Math My Way tab) Math My Way Instructors:
 Math My Way Instructors:") This is a team taught directed study course. Foothill College Fall 2014 Math My Way Math 230/235 MTWThF 10:00-11:50 www.psme.foothill.edu (click on Math My Way tab) Math My Way Instructors: Instructor:
This is a team taught directed study course. Foothill College Fall 2014 Math My Way Math 230/235 MTWThF 10:00-11:50 www.psme.foothill.edu (click on Math My Way tab) Math My Way Instructors: Instructor:
Software Maintenance
 1 What is Software Maintenance? Software Maintenance is a very broad activity that includes error corrections, enhancements of capabilities, deletion of obsolete capabilities, and optimization. 2 Categories
Missouri Mathematics Grade-Level Expectations
 A Correlation of to the Grades K - 6 G/M-223 Introduction This document demonstrates the high degree of success students will achieve when using Scott Foresman Addison Wesley Mathematics in meeting the
Foothill College Summer 2016
 Foothill College Summer 2016 Intermediate Algebra Math 105.04W CRN# 10135 5.0 units Instructor: Yvette Butterworth Text: None; Beoga.net material used Hours: Online Except Final Thurs, 8/4 3:30pm Phone:
Changes to GCSE and KS3 Grading Information Booklet for Parents
 Changes to GCSE and KS3 Grading Information Booklet for Parents Changes to assessment in Years 10 & 11 As you are probably aware the government has made radical changes to the structure and assessment
Note: Principal version Modification Amendment Modification Amendment Modification Complete version from 1 October 2014
 Note: The following curriculum is a consolidated version. It is legally non-binding and for informational purposes only. The legally binding versions are found in the University of Innsbruck Bulletins
Developing an Assessment Plan to Learn About Student Learning
 Developing an Assessment Plan to Learn About Student Learning By Peggy L. Maki, Senior Scholar, Assessing for Learning American Association for Higher Education (pre-publication version of article that
Mathematics Scoring Guide for Sample Test 2005
 Mathematics Scoring Guide for Sample Test 2005 Grade 4 Contents Strand and Performance Indicator Map with Answer Key...................... 2 Holistic Rubrics.......................................................
Welcome to ACT Brain Boot Camp
 Welcome to ACT Brain Boot Camp 9:30 am - 9:45 am Basics (in every room) 9:45 am - 10:15 am Breakout Session #1 ACT Math: Adame ACT Science: Moreno ACT Reading: Campbell ACT English: Lee 10:20 am - 10:50
Mathematics Program Assessment Plan
 Mathematics Program Assessment Plan Introduction This assessment plan is tentative and will continue to be refined as needed to best fit the requirements of the Board of Regent s and UAS Program Review
Genevieve L. Hartman, Ph.D.
 Curriculum Development and the Teaching-Learning Process: The Development of Mathematical Thinking for all children Genevieve L. Hartman, Ph.D. Topics for today Part 1: Background and rationale Current
Paper ECER Student Performance and Satisfaction in Continuous Learning Pathways in Dutch VET
 Paper ECER 0 Student Performance and Satisfaction in Continuous Learning Pathways in Dutch VET Harm J.A. Biemans Education & Competence Studies Group Wageningen University & Research Centre P.O. Box 830
Dublin City Schools Mathematics Graded Course of Study GRADE 4
 I. Content Standard: Number, Number Sense and Operations Standard Students demonstrate number sense, including an understanding of number systems and reasonable estimates using paper and pencil, technology-supported
Math Grade 3 Assessment Anchors and Eligible Content
 Math Grade 3 Assessment Anchors and Eligible Content www.pde.state.pa.us 2007 M3.A Numbers and Operations M3.A.1 Demonstrate an understanding of numbers, ways of representing numbers, relationships among
FractionWorks Correlation to Georgia Performance Standards
 Cheryl Keck Educational Sales Consultant Phone: 800-445-5985 ext. 3231 ckeck@etacuisenaire.com www.etacuisenaire.com FractionWorks Correlation to Georgia Performance s Correlated to Georgia Performance
Chapter 4 - Fractions
 . Fractions Chapter - Fractions 0 Michelle Manes, University of Hawaii Department of Mathematics These materials are intended for use with the University of Hawaii Department of Mathematics Math course
Maximizing Learning Through Course Alignment and Experience with Different Types of Knowledge
 Innov High Educ (2009) 34:93 103 DOI 10.1007/s10755-009-9095-2 Maximizing Learning Through Course Alignment and Experience with Different Types of Knowledge Phyllis Blumberg Published online: 3 February
Paper Reference. Edexcel GCSE Mathematics (Linear) 1380 Paper 1 (Non-Calculator) Foundation Tier. Monday 6 June 2011 Afternoon Time: 1 hour 30 minutes
 1380 Paper 1 (Non-Calculator) Foundation Tier. Monday 6 June 2011 Afternoon Time: 1 hour 30 minutes") Centre No. Candidate No. Paper Reference 1 3 8 0 1 F Paper Reference(s) 1380/1F Edexcel GCSE Mathematics (Linear) 1380 Paper 1 (Non-Calculator) Foundation Tier Monday 6 June 2011 Afternoon Time: 1 hour
Centre No. Candidate No. Paper Reference 1 3 8 0 1 F Paper Reference(s) 1380/1F Edexcel GCSE Mathematics (Linear) 1380 Paper 1 (Non-Calculator) Foundation Tier Monday 6 June 2011 Afternoon Time: 1 hour
THE ROLE OF TOOL AND TEACHER MEDIATIONS IN THE CONSTRUCTION OF MEANINGS FOR REFLECTION
 THE ROLE OF TOOL AND TEACHER MEDIATIONS IN THE CONSTRUCTION OF MEANINGS FOR REFLECTION Lulu Healy Programa de Estudos Pós-Graduados em Educação Matemática, PUC, São Paulo ABSTRACT This article reports
Radius STEM Readiness TM
 Curriculum Guide Radius STEM Readiness TM While today s teens are surrounded by technology, we face a stark and imminent shortage of graduates pursuing careers in Science, Technology, Engineering, and
Introduction to the Common European Framework (CEF)
") Introduction to the Common European Framework (CEF) The Common European Framework is a common reference for describing language learning, teaching, and assessment. In order to facilitate both teaching
Introduction to the Common European Framework (CEF) The Common European Framework is a common reference for describing language learning, teaching, and assessment. In order to facilitate both teaching
Mathematics Assessment Plan
 Mathematics Assessment Plan Mission Statement for Academic Unit: Georgia Perimeter College transforms the lives of our students to thrive in a global society. As a diverse, multi campus two year college,
Using Realistic Mathematics Education with low to middle attaining pupils in secondary schools
 Using Realistic Mathematics Education with low to middle attaining pupils in secondary schools Paul Dickinson, Frank Eade, Steve Gough, Sue Hough Manchester Metropolitan University Institute of Education
Name: Class: Date: ID: A
 Name: Class: _ Date: _ Test Review Multiple Choice Identify the choice that best completes the statement or answers the question. 1. Members of a high school club sold hamburgers at a baseball game to
Running head: DEVELOPING MULTIPLICATION AUTOMATICTY 1. Examining the Impact of Frustration Levels on Multiplication Automaticity.
 Running head: DEVELOPING MULTIPLICATION AUTOMATICTY 1 Examining the Impact of Frustration Levels on Multiplication Automaticity Jessica Hanna Eastern Illinois University DEVELOPING MULTIPLICATION AUTOMATICITY
Update on Standards and Educator Evaluation
 Update on Standards and Educator Evaluation Briana Timmerman, Ph.D. Director Office of Instructional Practices and Evaluations Instructional Leaders Roundtable October 15, 2014 Instructional Practices
KENTUCKY FRAMEWORK FOR TEACHING
 KENTUCKY FRAMEWORK FOR TEACHING With Specialist Frameworks for Other Professionals To be used for the pilot of the Other Professional Growth and Effectiveness System ONLY! School Library Media Specialists
Math 098 Intermediate Algebra Spring 2018
 Math 098 Intermediate Algebra Spring 2018 Dept. of Mathematics Instructor's Name: Office Location: Office Hours: Office Phone: E-mail: MyMathLab Course ID: Course Description This course expands on the
Do students benefit from drawing productive diagrams themselves while solving introductory physics problems? The case of two electrostatic problems
 European Journal of Physics ACCEPTED MANUSCRIPT OPEN ACCESS Do students benefit from drawing productive diagrams themselves while solving introductory physics problems? The case of two electrostatic problems