RAISING QUALITY PROMOTING EQUITY
|
|
|
- Dennis Fox
- 6 years ago
- Views:
Transcription


1 RAISING QUALITY PROMOTING EQUITY An analysis of location, performance, and investment in Illinois public schools Strengthening nonprofits and the communities they serve.
2 PREFACE IFF is a nonprofit community development financial institution (CDFI) that provides comprehensive community development solutions across the Midwest. As part of the organization s mission to strengthen nonprofits and the communities they serve, IFF Research conducts analyses to facilitate strategic planning and resource allocation for states, municipalities, school districts, foundations, and nonprofits throughout the country. Over nearly fifteen years on the cutting edge of school improvement, IFF has developed a signature approach to education research that assesses need for quality K-12 public schools. IFF s school study methodology is distinctive in its spatial analysis of performing capacity at a local level. Its place-based approach helps education stakeholders craft data-driven interventions and maximize the reach of investments. Previous analyses have informed policy and decision-making such as investments in districts and schools, strategic facilities planning and site selection, identification of schools for potential turnarounds, solicitations and selection criteria for charter schools, and targeted communication regarding public school options. IFF s education needs assessments evolved out of a partnership with Chicago Public Schools (CPS). In 2003, CPS leaders recognized a need to identify neighborhoods to prioritize for the location of new performing schools. IFF s research enhanced the district s ability to target its school improvement efforts and led to a better distribution of K-12 options for families. The needs assessment methodology has evolved and been adapted to guide policy and practice in Cleveland, Denver, Indianapolis, Kansas City, Milwaukee, Minneapolis, St. Louis, and Washington, D.C. Raising Quality, Promoting Equity is IFF s second statewide school study, following an assessment of Indiana public schools in Raising Quality, Promoting Equity was conducted by IFF Research with financial support from the Joyce Foundation and from the Walton Family Foundation. The project s advisory committee included representatives from the offices of the Governor and Lieutenant Governor of Illinois, the Illinois State Board of Education (ISBE), Advance Illinois, the Archdiocese of Chicago, the Illinois Network of Charter Schools, New Schools for Chicago, Stand for Children Illinois, Thornton Fractional High School District 215, and Williamsfield Community Unit School District 210. ONLINE TOOL The data visualization suite that accompanies this report allows users to compare schools, districts, and study areas of their choosing with the state and with customizable sets of peers from a variety of perspectives. Users interested in their school, district, or region can see how their outcomes in performance, funding, and return on investment (ROI) stack up to those of nearby places, of demographically similar communities, or of the state as a whole.
3 RAISING QUALITY PROMOTING EQUITY An analysis of location, performance, and investment in Illinois public schools
4 ACKNOWLEDGMENTS IFF PROJECT STAFF R. Jovita Baber, Ph.D. Vice President of Research and Evaluation Nicholas V. DiRago Research Associate Megan McGowan Data Analyst Jesse Bakker GIS Analyst Katie Coleman Corporate Communications Manager IFF ADVISORY TEAM Joe Neri President and Chief Executive Officer Matt Roth Chief Operating Officer Jose Cerda III Vice President of Corporate Communications and Public Affairs Susana Vasquez Vice President of Strategic Partnerships Andrew Alt Director of School s Jenny Boyts School s Manager Kiae Considine Director of Resource Development Dennis Marino Senior Project Manager Andrea Poole Director of Lending, School s ADVISORY COMMITTEE Daniel Anello Chief Executive Officer New Schools for Chicago Derek Cantù Policy Analyst Office of the Lieutenant Governor of Illinois Tim Farquer Superintendent and Curriculum Director Williamsfield Community Unit School District 210 Jason Helfer, Ph.D. Deputy Superintendent for Teaching and Learning Illinois State Board of Education Thomas McGrath Associate Superintendent and Chief Operating Officer Archdiocese of Chicago Office of Catholic Schools Ginger Ostro Executive Director Advance Illinois Beth Purvis, Ed.D. Secretary of Education Office of the Governor of Illinois Mimi Rodman Executive Director Stand for Children Illinois Evelyn Sanguinetti Lieutenant Governor of Illinois Sara R. Shaw Managing Director and Advisor of Education Policy Office of the Governor of Illinois Creg E. Williams, Ed.D. Superintendent Thornton Fractional High School District 215 Pamela Witmer Senior Manager of Policy Illinois Network of Charter Schools
5 PEER REVIEWERS Heather Y. Anichini President and Chief Executive Officer The Chicago Public Education Fund Jeff Broom Director of School Quality Measurement Chicago Public Schools Juan Jose Gonzalez Director of Youth and Education Policy City of Chicago Christopher Merrett, Ph.D. Director and Professor Western Illinois University Institute for Rural Affairs Kevin O Mara Executive Director High School District Organization of Illinois Diane Rutledge Executive Director Large Unit District Association Robin M. Steans Trustee Steans Family Foundation Sara Ray Stoelinga, Ph.D. Sara Liston Spurlark Director University of Chicago Urban Education Institute Norman Walzer, Ph.D. Senior Research Scholar Northern Illinois University Center for Governmental Studies
6 TABLE OF CONTENTS EXECUTIVE SUMMARY... 1 DATA AND METHODS... 5 REFERENCE MAPS AND FIGURES... 9 PART I: NEEDS ASSESSMENT: SCHOOL PERFORMANCE PART II: DISTRICT FUNDING PART III: RETURN ON INVESTMENT RECOMMENDATIONS DISTRICT PROFILES: BRIGHT SPOTS FOR FUTURE INVESTMENT IN DEPTH: CHICAGO APPENDIX A: SUPPLY AND DEMAND BY GRADE LEVEL AND STUDY AREA APPENDIX B: SCHOOL DISTRICT EXPENDITURE CATEGORIZATION SCHEME MAPS Map 1: Density of School-Aged Children Map 2: Children in Poverty Map 3: Level Map 4: Map 5: Funding Adequacy Map 6: Return on Investment (ROI), Study Areas Map 7: Level, City of Chicago Map 8:, City of Chicago CHARTS Chart 1: Enrolled Students by School Performance Chart 2: Level in Study Areas Chart 3: Poverty and Proficiency in Illinois Public School Districts Chart 4: School Performance by Income Level Chart 5: Supplemental Funds Needed Per Dollar Chart 6: Cost Weighting Example Chart 7: Enrolled Students by Funding Level Chart 8: Funding Adequacy by Income Level Chart 9: Weighted Revenue Per Pupil by District Income Level Chart 10: Funding Adequacy by Geography Chart 11: Revenue Sources for K-12 Public Education Chart 12: Income, Wealth, and Revenue for K-12 Education... 42
7 Chart 13: Instructional Spending and Proficiency Chart 14: Wealth, Spending, and Performance Chart 15: Income, Performance, and Return on Investment (ROI) Chart 16: Return on Investment (ROI) by Funding Adequacy Chart 17: Overhead Spending by Return on Investment (ROI) Chart 18: Enrolled Students by School Performance in Elgin-Area School District U-46 vs. Illinois Chart 19: Student Demographics in Elgin-Area School District U Chart 20: Funding and Wealth in Elgin-Area School District U Chart 21: Student Demographics in Vienna School District Chart 22: Funding and Wealth in Vienna School District Chart 23: Enrolled Students by School Performance in Collinsville School District Chart 24: Student Demographics in Collinsville School District Chart 25: Funding and Wealth in Collinsville School District Chart 26: Enrolled Students by School Performance in Chicago Public Schools Chart 27: Poverty and Performance in Chicago Public Schools Chart 28: Student Demographics in Chicago Public Schools Chart 29: Funding and Wealth in Chicago Public Schools TABLES Table 1: IFF Performance Rating for Illinois Public Schools, Table 2: Statewide Enrollment Breakdown, Table 3: Supply and Demand by Grade Division, Statewide Table 4: Supply and Demand by Grade Division, High-Need Areas Table 5: Supply and Demand by Study Area, Ranked, High-Need Areas Table 6: Supply and Demand by Grade Division, Chicago Table 7: Supply and Demand by Grade Division, Chicago, High-Need Areas... 67
8 EXECUTIVE SUMMARY OVERVIEW Seizing the Moment. As the educational landscape evolves in the Prairie State, exciting opportunities are emerging to raise quality and promote equity in Illinois public schools. Over the past several years, standardized assessments have increased in rigor; momentum for school funding reform has picked up; and the state is gaining considerable autonomy over its public schools as the Every Student Succeeds Act takes effect. Illinois s success in transforming these and other opportunities into progress hinges on stakeholders capacity to coalesce around a comprehensive school improvement agenda. Raising Quality, Promoting Equity is designed to facilitate this collaborative process of agenda-setting. At its core, the study is a supply-and-demand needs assessment. In line with statewide goals to promote ninety percent of students to grade level in math and reading by 2032, the analysis identifies the places in Illinois in which the most children cannot access a public school in which all or nearly all students succeed in core subjects. Embedded in this research question is the assumption that every child can learn. Zip code, race, ethnicity, family wealth, first language, or learning style should not diminish access to quality education. To safeguard opportunity for children across Illinois, the public education system must guarantee that all families have a high-quality K-12 school close to home. Boosting Performance to Raise Quality. A high level of academic performance is a necessary, but not sufficient, component of a high-quality school. High-quality schools challenge and support children to realize their potential. They not only transmit basic skills but foster critical thinking, self-understanding, social and emotional learning, cultural competency, citizenship, and wellness. Standardized tests do not measure these vital components of high-quality schools; by the same token, high-quality schools accomplish more than state assessments can capture. As such, high-quality schools do not teach to the test. They teach to the whole child, which allows them to achieve high levels of performance in subjects that standardized tests assess. Yet even in the context of holistic, whole-child education, solid training in reading and math is a foundational function of K-12 schooling. Students, families, and taxpayers depend on this training to build a skilled workforce that can participate in the economy and attract investment. If many children cannot access schools that will prepare them to achieve in reading and math, increasing the availability of grade-level preparation in these subjects should be a top priority for the K-12 system. To evaluate Illinois s progress towards guaranteeing basic academic preparation for all children, Raising Quality, Promoting Equity determines the proportion of students that can access a K-12 public school with high levels of reading and math performance in each of 234 geographies across the state. It then identifies the areas with the widest gaps between enrolled students and seats in highperforming schools. The analysis also examines the relationship between poverty and academic performance. The supply-and-demand focus of the needs assessment shifts emphasis from the performance of individual students and schools to the quality and geographic distribution of the services that the K-12 public school system provides statewide. In this way, the methodology gauges whether the system is meeting students needs and delivering a quality service to taxpayers. Funding and ROI: Two Sides of the Same Coin. After analyzing patterns in school performance and identifying 1
9 the areas in which there is the most need for highperforming schools, Raising Quality, Promoting Equity examines district funding and return on investment (ROI). Fiscal decisions at federal, state, and local levels fundamentally shape educational opportunities. For this reason, an assessment of the K-12 landscape in Illinois is incomplete without insight into the effectiveness of resource allocation across and within districts. Analyses of resource allocation in this report stem from two principles about revenues and expenditures in public schools. At the most basic level, state and local leaders should guarantee that schools and districts have enough resources to meet their students academic needs. In turn, school districts should use public funds wisely to maximize the quality of the services that they provide. In evaluating the school funding system in the state, the study uses the benchmarks of adequacy and equity: do districts have enough funding to meet students needs, and does the system guarantee that enough resources flow into low-income communities to compensate for inequalities in local resources? The study then turns to ROI, which gauges the impact of districts day-to-day spending on outcomes in critical academic subjects. Together, the analysis of district funding and ROI helps stakeholders understand at state, regional, and district-by-district levels whether educators have enough resources to guarantee high levels of academic achievement and whether local decisionmakers are utilizing those resources in impactful ways. A Tool for Action. Ultimately, Raising Quality, Promoting Equity and the accompanying online tool are designed to support the work of stakeholders in K-12 education in Illinois. Beginning from a shared vision of a public education system in which high-quality schools are abundant and evenly distributed across the Prairie State, the study presents data and analysis that can help decisionmakers develop differentiated strategies to raise quality and promote equity in schools across our state. KEY FINDINGS The K-12 public education system in Illinois does not provide a substantial majority of families the option to send their children to high-performing schools. Twelve percent of students in the state have access to a public school that has achieved the goal of preparing all or nearly all of its students to read, write, and do math at grade level. The lack of performing options in Illinois is a statewide issue that cuts across geographies upstate and downstate, in cities, suburbs, towns, and rural areas. Only a small handful of affluent suburban municipalities has enough seats in high-performing public schools for every child from kindergarten through high school. Public education in Illinois is inequitable. The public school system does not equalize opportunity for Illinois residents; it reinforces inequalities among them. Because the state relied heavily on property taxes to fund public education, school districts serving low-income communities were far more likely to be underfunded than those in more affluent parts of the state. Municipalities with lower property wealth were therefore forced to tax at high rates to maintain public schools. Yet even despite this heavy financial burden on residents, Illinois s poorest students had almost no access to high-performing schools. Across the state, standardized test scores gauged family wealth about as well as they assess math and reading ability. Fairer school funding, however, seems likely to help close the achievement gap. Nearly three out of five students in the state were enrolled in districts with precarious funding levels in the absence of funding reform. The state s funding system thereby compromised most children s access to performing 2
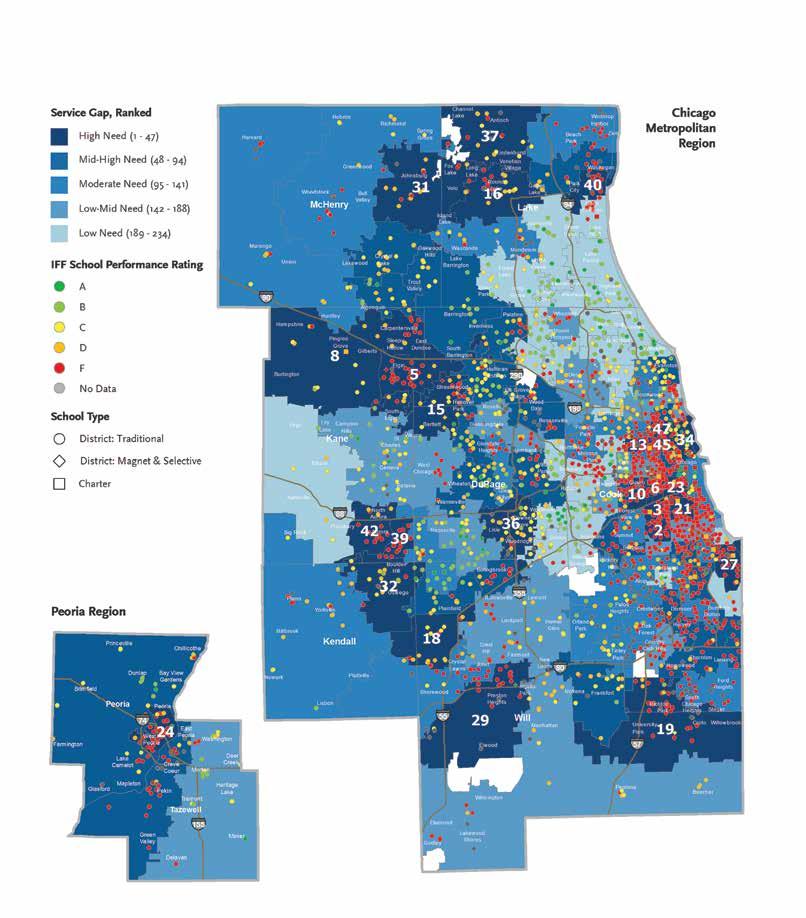
10 schools. Funding inadequacy is a statewide issue, but lowincome and downstate communities were more likely to face underfunding than wealthier and upstate peers. Many underperforming and underfunded school districts are making good use of the financial resources at their disposal. From the standpoint of contributing to core academic achievement, many of the most impactful dollars in the state s public education system are being spent in districts that are approaching, but have not yet reached, high levels of reading and math performance. Moreover, return on investment (ROI) is twenty percent higher in underfunded school districts than in adequately funded school districts. For these reasons, some underfunded and underperforming school districts appear to be among the best candidates for future investment and even potential sources of best practices. RECOMMENDATIONS FRAMEWORK late of recommendations, see page #. Academic accountability, adequate and equitable resources, and financial stewardship should represent a unified statewide effort to improve K-12 public schools. Performance, funding, and return on investment must be addressed jointly and holistically to raise quality and promote equity in public education in Illinois. The broad scope and deep reach of this collaborative agenda means that community, school, district, municipal, regional, and state leaders have interdependent roles to play, in conjunction with support from the nonprofit and philanthropic sectors. Raising Quality, Promoting Equity presents a framework through which all stakeholders can approach school improvement, allowing for differentiated responsibility without losing sight of common goals. STRATEGICALLY DETERMINE WHERE Calibrate efforts to supply AND demand... Use the geographical distribution of supply (seats in high-performing schools) and demand (children enrolled in K-12 public schools) across the state to identify areas in which to target school improvement efforts. Pay special attention to the high-need areas that this study identifies....using the service level... The service level is the proportion of students in a study area who have access to a highperforming school. Communities with the lowest levels of service, or with no service at all, have the highest levels of need per school-age resident....and the service gap. The service gap is the number of students in a study area who lack access to a high-performing school. Communities with the widest service gaps have the greatest numbers of students in need. The wider the service gap, the more students in need can be reached by successful school improvement efforts. For a full list of recommendations, go to page 53. 3
11 RAISING QUALITY, PROMOTING EQUITY A UNIFIED FRAMEWORK FOR SCHOOL IMPROVEMENT IN ILLINOIS HOLISTICALLY DETERMINE HOW ADEQUATE AND EQUITABLE RESOURCES Invest in underfunded schools and districts. Guarantee adequate and equitable funding for every school in Illinois: ensure that all schools are equipped to meet students needs and that the state funding system compensates for disparities in local wealth. FINANCIAL STEWARDSHIP Empower local and regional stakeholders to identify best practices for resource allocation and to align their spending to maximize impact on school performance. Structure investments in districts and schools based on need and the impact of current spending on performance outcomes. ACADEMIC ACCOUNTABILITY Set high standards for academic performance, and hold schools to them through a clear accountability system. Implement rigorous summative ratings that meaningfully capture progress towards promoting all or nearly all students to grade level, and tailor supports to each school s rating. 4
12 DATA AND METHODS DATA Data Year. The findings contained in Raising Quality, Promoting Equity are based on data from academic year For elementary and middle schools, the standardized examination in Illinois in was the Illinois Standards Achievement Test (ISAT); for high schools, it was the Prairie State Achievement Exam (PSAE). Beginning in , the state transitioned to the Partnership for Assessment of Readiness for College and Careers (PARCC) examinations. There were two main reasons for the decision to use data from in this study despite the state s transition to a new testing regime. First, the federal K-12 district finance data on which the latter portions of the study are based were only available through It was necessary to use directory, enrollment, and performance data from the same year in order to make meaningful comparisons among performance, funding, and return on investment. Second, the state restricted the use of scores from the administration of PARCC in accountability systems. Although the performance metric in this study is not constitutive of an accountability system, IFF aligned with state policy to avoid confusion and did not utilize PARCC scores in generating performance ratings for schools and districts. And because the data for the study were processed before PARCC scores were made public, the administration of standardized tests was the best available option for analysis. Also due to the transition in standardized tests, rolling averages or other multi-year data, which would have required the use of outcomes from prior to , were not used in generating performance ratings or other measures. While multi-year or rolling data have advantages, they were outweighed by the concern that the findings would have been insufficiently current if scores from academic years prior to were incorporated. Data Sources. Bush School of Government & Public, Texas A&M University Comparable Wage Index Updates Chicago Public Schools Attendance Boundaries ISAT Performance Levels PSAE Performance Levels Twentieth Day Membership Reports City of Chicago Community Area Boundaries Esri Single-Year Age Data Illinois Network of Charter Schools Charter School Directory and Enrollment Illinois State Board of Education Directory of Educational Entities Fall Enrollment Counts Illinois Report Card Original EAV and Tax Rates Reports School District Financial Profiles National Center for Education Statistics Common Core of Data Local Education Agency Finance Survey Public School Directory Public School Membership US Census Bureau American Community Survey 5-Year Estimates, 2014 School District Boundaries 5

13 Table 1: IFF Performance Rating for Illinois Public Schools, Base Grouping (Reading & Math Composite Score) 90% proficient or above A % proficient B % proficient C % proficient D % proficient F Extra Credit Elementary & Middle Schools High Schools Exceptional levels of student growth Exceptional rates of graduation and college enrollment Penalty High rates of non-participation in assessments METHODOLOGY Needs Assessment. The core of Raising Quality, Promoting Equity is a supply-and-demand needs assessment. It answers a basic question: where in Illinois do the most children lack access to a public school in which all or nearly all students succeed in core subjects? To answer this question, the analysis divides the state of Illinois into 234 study areas, which are the base geographical unit of the needs assessments. Ninety study areas correspond to counties. In the higher-density metropolitan areas of Chicago, Rockford, Peoria, and East St. Louis, counties are subdivided into clusters of zip codes. Within each study area, supply is the number of seats available in high-performing K-12 public (district and charter) schools. Demand is the number of children enrolled in all K-12 public schools. The difference between supply (performing seats) and demand (students) is the service gap, the number of additional seats in highperforming schools that need to be made available in a study area in order to reach all students in the system. The service level is the quotient of supply over demand, the proportion of students who currently have access to a high-performing public school within a study area. The service level and service gap are calculated within each study area for three grade divisions (grades K-5, 6-8, and 9-12). The service gaps within the three divisions are summed to arrive at K-12 totals. Each study area is then ranked by its service gap within the grade divisions. Finally, with adjustments for population density, a composite K-12 ranking is created from the study area s rankings within each grade group. The highest-ranked fifth of the study areas are designated as high-need areas. Unlike many states, Illinois did not publicize a summative evaluation of school performance in With input from the advisory committee for Raising Quality, Promoting Equity, IFF consulted best practices from other Midwestern states to create an accessible and actionoriented categorization of schools. In determining which schools contributed to supply within a study area, Raising Quality, Promoting Equity places schools and districts into one of five groups on an A F scale. A school or district was considered performing if it had a rating of A or B. Schools and districts first entered a base grouping determined by their composite proficiency rate in reading and math. 1 The state will likely begin assigning schools to one of four performance tiers beginning in The proposed system, however, was not yet public at the time that this study began. 6
14 Elementary and middle school scores advanced one group (e.g., from a C to a B) if the school or district was exceeding standards for student growth in math and reading (i.e., if the average of a school s reading and math growth levels on the Value Table Growth Model was at least 115). High school scores advanced one group if the school s or district s graduation rates across all students and among low-income students and sixteen-month postsecondary enrollment rates were both in the top quartile statewide. All scores receded one group (e.g., from a B to a C) if less than ninety-five percent of students or of lowincome students were tested in reading and math. These performance ratings do not and are not designed to capture all of the meaningful aspects of quality public education. Their advantage is that they contribute to the key research question elaborated above by assessing the proportion of students that is prepared to achieve in core academic subjects reading and math. District Funding. Illinois is an economically and demographically diverse state. The costs associated with running a school district vary widely across its urban, suburban, town, and rural regions. Moreover, the state s children enter the public school system with a wide array of academic needs. The prices of providing services that can meet these needs vary with the composition of the student body and the size of the school district. This diversity has consequences for a central goal of Raising Quality, Promoting Equity: analyzing equity and adequacy in Illinois s school funding system. Drawing from best practices in school finance research, most financial figures in Raising Quality, Promoting Equity are weighted to standardize expenditures and revenues across geographically and demographically dissimilar districts. The study adjusts revenue and expenditure figures in two basic ways. It first applies a cost of living adjustment using the Comparable Wage Index, a widely used set of multipliers for individual school districts based on the cost pressures of the labor market in which they are located. The index adjusts figures upward in school districts in which the cost of living is below the national norm and downward in school districts in which the cost of living is above the national norm. Then, a set of weights 2 is applied based on the district s size and its populations of three student groups that need additional educational resources in order to thrive: low-income students, English language learners, and children with disabilities. The function of these weights is to normalize the reach of revenues and expenditures as if all enrolled children were general education students with no need for specialized or intensive supports. The number of students within each of the three subgroups is multiplied by the corresponding weight to arrive at an adjusted enrollment total that measures the number of general education students that the district would be able to accommodate with a given revenue or expenditure. To arrive at weighted per-pupil figures, disctrict-wide totals are divided by the adjusted enrollment. The cost adjustments utilized in this analysis allow districts to be compared as if they were educating the same students in the same place. The principle behind the weights is 2 After a review of the literature on school district finance, IFF chose to adopt weights that Augenblick, Palaich and Associates (APA) developed for an analysis of district funding in Montana. APA are national leaders in school finance research and in the past have been commissioned by the State of Illinois to 7 analyze the state s K-12 funding formula. A principal advantage of these weights is that they differentiate costs based on district size. Recognizing the relative differences in cost burden based on size is helpful in the context of Illinois, where some districts enroll only a few dozen students and others enroll tens of thousands.
15 A step-by-step demonstration of the process of cost weighting can be found on pages simple: each dollar spent in public schools goes further to meet student need in places where the cost of living is lower and children need fewer intensive or specialized educational services. The weighted figures can therefore be considered measures of how much need a school district is positioned to meet with a given amount of revenue or expenditure. A school district with higher weighted revenue can access more goods and services and therefore is able to meet more need from a financial perspective. Finally, based on weighted per-pupil revenue, Raising Quality, Promoting Equity makes a determination about the adequacy of funding levels in all school districts in Illinois for which full financial data were available. This determination is based on the Foundation Level (FL) that the Illinois Education Funding Advisory Board (EFAB) released every other year, with adjustments for inflation. The FL was a statewide standard for the amount of combined local and state funding necessary to educate a general education student in Illinois; in , it was $8,672 per pupil. The study compares a district s weighted revenue to the FL to gauge funding adequacy. Each district s level of revenue is assigned a category: and math achievement per dollar spent on a district s K-12 operations, after the weights described above have been applied. It is derived by dividing a district s composite proficiency rate in reading and math by its weighted operational expenditure per pupil. Operational expenditures comprise instruction, staff and pupil support, food, transportation, and overhead. Included in overhead spending are administration, central office and business services, and maintenance. Debt service, long-term capital expenditures, and other costs that can reasonably vary from year to year are not included in operational expenditures. A detailed breakdown of the school district expenditure categorization scheme utilized in this report can be found in Appendix B. For the purposes of this study, return does not connote overall district quality. Rather, ROI is strategically based more narrowly on the academic foundation that drives Raising Quality, Promoting Equity: proficiency in reading and math. For each school district, ROI answers a basic question: given the amount of need that a district s funding allows it to meet, how well are students performing in core academic subjects? Districts ROI are assigned to one of three groups: Funding Adequacy Adequate Borderline Underfunded Revenue vs. Foundation Level (FL) 3.5% or more above FL Within 3.5% of FL 3.5% or more below FL Return on Investment High ROI Medium ROI Low ROI Rank Highest third of ROI Middle third of ROI Bottom third of ROI Return on Investment. In Raising Quality, Promoting Equity, return on investment (ROI) measures reading 8
16 REFERENCE MAPS AND FIGURES Table 2: Statewide Enrollment Breakdown, Number Enrollment Percent of Schools Grades K-5 Grades 6-8 Grades 9-12 Total of Total DISTRICT SCHOOLS DISTRICT 4, , , ,627 1,987,748 87% TRADITIONAL TRADITIONAL DISTRICT 3, , , ,082 1,860,171 82% General Education 3, , , ,082 1,860,171 82% MAGNET/SELECTIVE ,877 16,027 40,106 90,163 4% General Education ,877 16,027 40,106 90,163 4% SPECIAL SPECIAL PROGRAM PROGRAM 410 2,845 2,453 12,439 37,414 2% Special Education 151 2,265 1,671 4,824 10,530 0% Alternative/ Vocational ,974 8,549 0% Early Childhood ,806 1% Correctional Institution % CHARTER SCHOOLS CHARTER ,112 11,878 26,523 63,462 3% DISTRICT-AUTHORIZED ,257 11,625 26,054 61,874 3% General Education ,257 11,625 21,409 57,225 3% Alternative/Vocational 24 4,645 4,649 0% STATE-AUTHORIZED ,588 0% General Education ,588 0% PRIVATE SCHOOLS PRIVATE 1,541 88,373 39,674 47, ,966 10% General Education 1,154 84,092 38,744 45, ,051 9% Special Education ,818 4,702 0% Alternative/Vocational ,622 0% Early Childhood 243 3,074 15,591 1% Total 5, , , ,774 2,281, % ENROLLMENT BREAKDOWN In , approximately 2.28 million students in Illinois enrolled in over 4,200 district schools, 148 charter schools, and more than 1,500 private schools. For every ten students, nine attended a public school and one attended a private school. 3 Ninety-seven percent of public school students attended district schools, and three percent attended charter schools. IFF included in the supply-and-demand analysis all public (district and charter) schools that offered general education programming and administered the Illinois Standards Achievement Test (ISAT) and/or Prairie State Achievement Examination (PSAE) in academic year Types of schools that the analysis does not include are written in light gray in the table above. 3 Enrollment data for many private schools in academic year was incomplete or missing. It is likely that private school enrollment was slightly higher than indicated in the table above. The quality of available data makes a fully accurate count impossible. 9
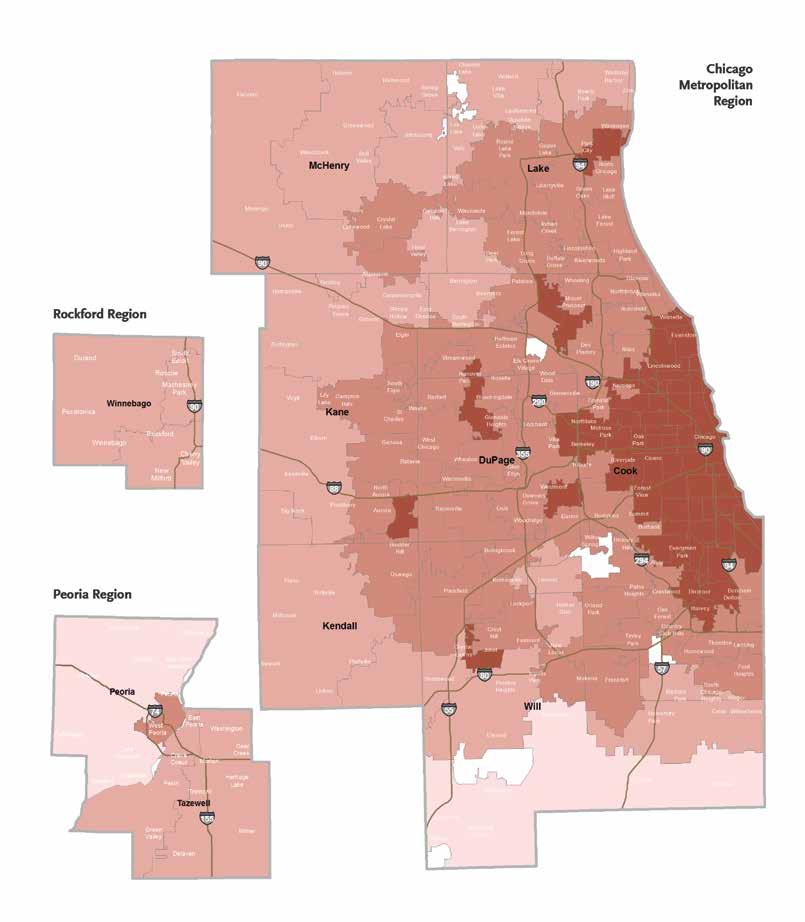
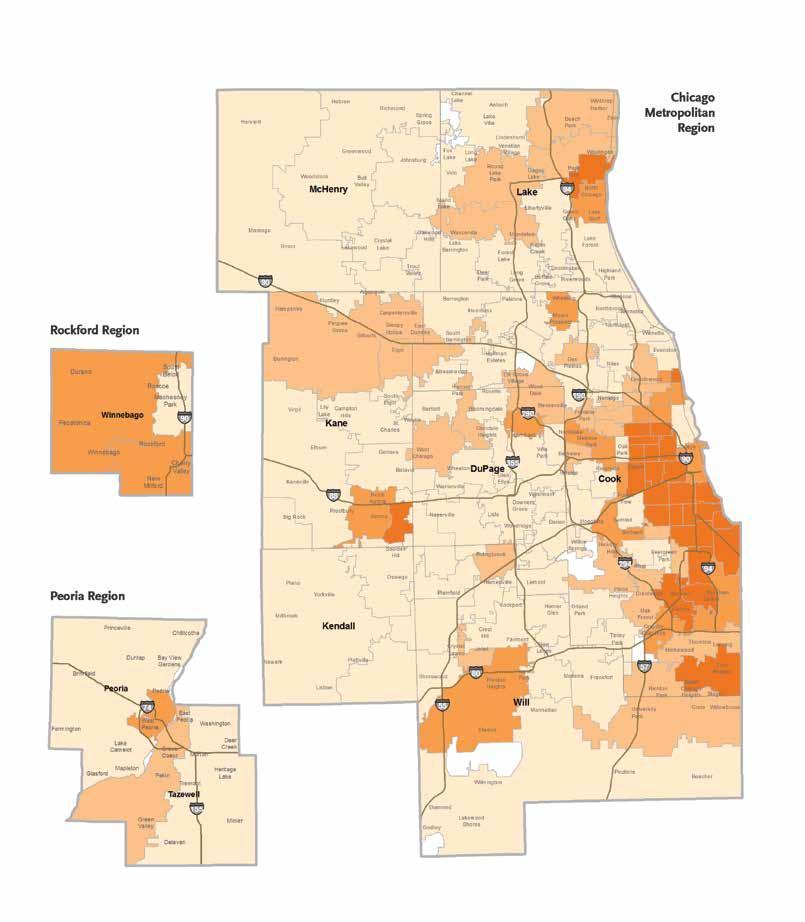
17 DEMOGRAPHIC REFERENCE MAPS Raising Quality, Promoting Equity contains several sets of maps that explore the distribution of performance, funding, and return on investment across the state. It can be useful to compare these outcomes to the population of school-age children and the proportion of children from low-income households in individual places. IFF invites readers to reference the maps in this section when analyzing the others that are distributed throughout the report. In this way, stakeholders can visualize the relationships among population, poverty, and the outcomes that this study presents in the places that are of interest to them. Demographic shifts in Illinois over time should be taken into account, especially with regard to the population of low-income students in the state. The public school student body has grown substantially poorer over the last decade. Between 2005 and 2015, the proportion of school districts in which over half of students lived in low-income households more than tripled from thirteen to forty-three percent. 4 In urban centers and outside of the major metropolitan areas in the state, low-income student populations have increasingly become the norm in K-12 public schools. Higher-income school districts, on the other hand, are concentrated in and around the state s major metropolitan areas. SECTION CONTINUED ON NEXT PAGE 4 Advance Illinois, Every Student Counts: The State We re in : A Report on Public Education in Illinois, November

18 Map 1: Density of School-Aged Children 11
19 12

20 Map 2: Children in Poverty 13
21 14
22
23 PART I NEEDS ASSESSMENT: SCHOOL PERFORMANCE INTRODUCTION: KEEPING PROMISES Article X of the Constitution of the State of Illinois binds the state to guaranteeing the educational development of all persons to the limits of their capacities through a system of free high-quality public educational institutions and services. 5 Access to basic academic skills is fundamental to fulfilling this promise as is safeguarding access equitably to students of all socioeconomic backgrounds. Every public school must therefore be equipped to prepare all or nearly all pupils to achieve at grade level as the foundation, not to the exclusion, of the many other dimensions of a high-quality school. Failure to prevent a large number of students from falling behind grade level shortchanges taxpayers who contribute to the system with the expectation of a quality public good in exchange. It also compromises our state s long-term economic competitiveness. More fundamentally, however, an underperforming K-12 school system fails to meet the state s explicit constitutional responsibilities to children. The needs assessment at the core of this study finds that, in most public schools, a substantial share of the student body finishes the year behind grade level in core subjects. Statewide, twelve percent of K-12 public school students had access to an A- or B-rated school in based on the metrics developed for this study. And while the need for performing schools was spread across the state upstate and downstate, in cities, suburbs, towns, and rural areas low-income communities had disproportionate need for high-performing K-12 schools. In many places in which IFF has conducted K-12 education needs assessments, the need for performing public school seats has been concentrated more heavily in a handful of high-need areas. For this reason, IFF often recommended that stakeholders focus attention in the highest-need areas in order to have the greatest impact on the service gap. In Illinois, however, the K-12 landscape was practically the reverse of other states situations in Rather than identifying concentrated pockets of low performance, across Illinois IFF found only concentrated pockets of high performance. The need for performing schools is a system-wide challenge. It will require a comprehensive solution with collaboration among local, regional, and state stakeholders to increase the service level and close the service gap. The data presented in this chapter illuminate the level of need across the state and allow for local and regional comparisons within it. In this way, education stakeholders can better understand the landscape and collaborate across sectors and levels of government to keep Illinois s promises to the children of our state. SECTION CONTINUED ON NEXT PAGE 5 Constitution of the State of Illinois, art. X, 1. 16
24 A SYSTEM-LEVEL ASSESSMENT Fifty-eight percent of K-12 public school pupils in Illinois were proficient in reading and math in Relative to other states, a 2014 comparative analysis of school performance called Illinois s academic outcomes middling. 7 These data reveal substantial room for improvement but do not suggest chronic underperformance. To be sure, student-level metrics such as the percentage of children on grade level communicate important information about school quality. This study, however, evaluates public education in Illinois at the system level. Rather than asking how many individual students are managing to succeed within the public school system, Raising Quality, Promoting Equity assesses the extent to which schools fulfill a basic promise of public education: to guarantee access to basic skill-building to all children and to create environments of rigor and high achievement. To understand academic outcomes at the system level, this study analyzes access to quality in the aggregate. The objective is less to rate individual schools than to understand the landscape of K-12 options in counties and neighborhoods. Viewed from this angle, the situation of public education in the Prairie State is more severe than the proportion of students on grade level suggests. STATEWIDE UNDERPERFORMANCE The Illinois State Board of Education (ISBE), in consultation with stakeholders throughout the state s education community, have established a goal for ninety percent of students to be proficient in reading and math by When standards that align with this goal are applied across Illinois, severe underperformance comes into view. In , the K-12 system in Illinois did not provide a substantial majority of families the option to send their children to schools in which all or nearly all students finished the year on grade level in core subjects. Statewide, twelve percent of students had access to a school in which all or nearly all students finished the academic year on grade level in reading and math. Based on the metrics developed for this study, schools with ratings of C, D, or F predominated K-12 education in Illinois. Over half of students attended F-rated schools. The state needed over 1.6 million additional seats in A- or B-rated schools for every child enrolled in the K-12 system to have access to a high-performing public school. Based on the metrics developed for this study, within and across grade levels, roughly eight out of nine students lacked access to an A- or B-rated public school in No particular grade division was in appreciably higher need than any other. Each grade division s level of need was in line with its share of the Illinois student body. Statewide, about a third of demand was in high schools, about a quarter in middle schools, and just under half in elementary schools; the service gap was distributed across the state with nearly identical proportions. 6 Data from academic years and , when Illinois transitioned to the nationally normed Partnership for Assessment of Readiness for College and Careers (PARCC) examinations, returned lower results. In both years, about a third of Illinois public school students were on grade level in math and reading. Relative to children in other states, then, an even greater proportion of K-12 public school students in Illinois were behind grade level in and than the data utilized in this study suggest. 7 U.S. Chamber of Commerce Foundation and American Enterprise Institute for Public Policy Research, Leaders & Laggards: A State-by-State Report Card on K-12 Educational Effectiveness, The comparison in this study is based on the results of the National Assessment of Educational Progress. 8 Illinois State Board of Education, State Template for the Consolidated State Plan Under the Every Student Succeeds Act, April 2017, pp
25 Grade Division Table 3: Supply and Demand by Grade Division, Statewide Performing Schools Demand Supply Level Percent of K , , ,060 13% 43% ,165 47, ,637 11% 24% ,857 59, ,003 10% 33% K * 1,848, ,182 1,634,670 12% 100% *Because some schools overlap grade divisions, the number of performing schools may not sum. Chart 1: Enrolled Students by School Performance A B 3% 8% C 15% 55% F 19% D SERVICE LEVEL AND SERVICE GAP The service gap and the service level are complementary ways of assessing need for quality K-12 public school seats. These two components of the analysis can be utilized hand-in-hand for the purposes of prioritizing and tailoring components of a comprehensive school improvement agenda. For example, in both Massac and Ogle Counties, the K-12 service level is just under eight percent, meaning that about eight percent of students had access to an A- or B-rated public school. Massac County, however, needs to create about 2,300 seats to close the service gap, while Ogle County needs to create about 7,500. Ogle County has a wider service gap and is ranked number thirty-five out of the 234 study areas, making it a high-need area at the K-12 level. Massac County s service gap, on the other hand, is ranked 139. Reforms designed to reach the greatest number of students might focus on Ogle County, whereas interventions designed to increase quality in places with low access to performing schools could reasonably focus on either. 18
26 Chart 2: Level in Study Areas 78% 0-10% served % served 51-75% served 11% 6% 11-25% served 26-50% served As the final section of this chapter demonstrates, insufficient access to high-performing K-12 public schools in Illinois was more pervasive in low-income communities than in wealthier parts of the state in Without diminishing the depth of need for better access to A- and B-rated schools in economically marginalized neighborhoods, however, it is crucial to underscore that the lack of performing options in Illinois was a statewide issue that cut across geographies and socioeconomic groups. Based on the performance metrics applied in this study, an A- or B-rated public school was the exception in almost every part of the Prairie State in In ninety-five percent of the 234 study areas into which Raising Quality, Promoting Equity divides Illinois in cities, suburbs, towns, and rural areas alike, across demographic and socioeconomic spectra most students did not have access to an A- or B-rated public school in : In seventy-eight percent of the study areas, less than one in ten K-12 students had access to an A- or B-rated K-12 public school. More than half of K-12 students had access to an A- or B-rated K-12 public school in only twelve of the 234 study areas. In almost half of the study areas, there was effectively no access at all to A- or B-rated K-12 public schools. 19
27 Moreover, even the few study areas in which access to A- and B-rated schools was more than marginal were clustered in a small handful of areas of the state: All of the study areas in which more than ten percent of K-12 students had access to a high-performing school were in the Chicago, Peoria, and Bloomington- Normal metropolitan areas. Only two study areas covering the affluent North Shore Chicago suburbs of Glencoe, Winnetka, and Wilmette had enough performing seats for every child enrolled in the system in grades K-12. SECTION CONTINUED ON NEXT PAGE 20
28 Map 3: Level ONLINE TOOL: Evaluate outcomes in places of interest to you using the online tool. See the results of the needs assessment across the state, along with key performance indicators for every public school. 21
29 22
30 Grade Division Table 4: Supply and Demand by Grade Division, High-Need Areas Performing Schools Demand Supply Level Percent of K ,694 17, ,184 6% 18% ,187 5, ,483 4% 9% ,389 5, ,810 3% 12% K-12 48* 672,270 28, ,477 4% 39% *Because some schools overlap grade divisions, the number of performing schools may not sum. HIGH-NEED AREAS In , just under two fifths of the need for seats in high-performing K-12 public schools in Illinois was located in the forty-seven high-need areas that this study identifies. With adjustments for population density, these geographies are the fifth of the study areas in which the largest numbers of children did not have access to a school with a rating of A or B based on the metrics that IFF applied in this study to gauge progress towards the statewide goal of achieving ninety percent proficiency in reading and math. Across the high-need areas, only one out of twenty-five children enrolled in the K-12 public school system in had access to a school that provided grade-level reading and math preparation to all or nearly all of its students. This service level is lower than in Illinois as a whole, in which approximately one out of eight children had access to a school that had reached or approached statewide goals for reading and math proficiency. The ranking of study areas by need for performing seats can facilitate stakeholders efforts to strategically target local and regional interventions: Local officials may want to understand how the need for higher-performing public schools in their communities compares to that of peers in order to advocate for greater resources. Nonprofit, philanthropic, and private sector entities who want to maximize the impact of their investments could choose to focus on the high-need areas, where the largest number of seats needs to be created and economies of scale are more advantageous. The high-need areas can also guide regional and state-level stakeholders who want to compare outcomes across the state. Bearing in mind the statewide context that eight out of nine students lacked access to an A- or B-rated school across Illinois in the high-need areas are an actionable guide to prioritizing areas in which to improve school quality. 23
31 Table 5: Supply and Demand by Study Area, Ranked, High-Need Areas Rank Study Area Demand Supply Level 1 Sangamon County 28, ,036 3% 2 Chicago: Chicago Lawn, West Lawn 23, ,416 4% 3 Chicago: Archer Heights, Brighton Park 21, ,752 4% 4 Champaign County 21, ,309 1% 5 Elgin 19, ,000 5% 6 Chicago: Lawndale 19, ,891 4% 7 McLean County 22,403 3,974 18,429 18% 8 Burlington, Pingree Grove, Carpentersville 17, ,228 4% 9 Rock Island County 17, ,787 0% 10 Cicero 17, ,121 0% 11 Rockford, Cherry Valley 17, ,411 4% 12 Kankakee County 16, ,644 0% 13 Chicago: Belmont Cragin, Hermosa 16, ,837 4% 14 LaSalle County 16, ,154 1% 15 South Elgin, Bartlett, Streamwood 16, ,777 5% 16 Round Lake Beach, Volo 16, ,750 2% 17 Macon County 14, ,686 0% 18 Crystal Lawns 16, ,216 6% 19 Richton Park, University Park, Crete, Willowbrook 13, ,383 4% 20 DeKalb County 14, ,205 0% 21 Chicago: New City, Fuller Park 13, ,295 4% 22 Vermilion County 12, ,236 0% 23 Chicago: Lower West Side 13, ,872 5% 24 Peoria 13, ,743 7% 25 Boone County 9, ,864 0% 26 Cahokia, Millstadt, East Carondelet 12, ,736 0% 27 Chicago: South Chicago, Calumet Heights, East Side 13, ,669 4% 28 Williamson County 9, ,602 0% 29 Rockdale, Elwood, Ingalls Park 12, ,414 1% 30 Adams County 8, ,429 0% 31 Lakemoor, Johnsburg, Holiday Hills 12, ,247 2% 32 Oswego, Boulder Hill 15,157 2,989 12,168 20% 33 Grundy County 8, ,032 2% 34 Chicago: Lincoln Park, Lakeview 15,042 3,070 11,972 20% 35 Ogle County 8, ,543 8% 36 Woodridge, Lisle, Downers Grove 14,430 2,550 11,880 18% 37 Lake Villa, Fox Lake Hills, Channel Lake 11, ,795 0% 38 Knox County 7, ,231 0% 39 Aurora (Central) 12, ,764 3% 40 Waukegan 11, ,680 1% 41 Henry County 7, ,904 6% 42 North Aurora 11, ,515 0% 43 Whiteside County 6, ,534 0% 44 Granite City, Hartford, Wood River 11, ,467 0% 45 Chicago: Logan Square 11, ,443 4% 46 Stephenson County 6, ,250 0% 47 Chicago: Avondale, North Center, Irving Park 13,097 1,938 11,159 15% 24
32 Map 4: ONLINE TOOL: Evaluate outcomes in places of interest to you using the online tool. See the results of the needs assessment across the state, along with key performance indicators for each public (district and charter) school. 25
33 26
34 Chart 3: Poverty and Proficiency in Illinois Public School Districts 100% 80% 60% 40% 20% 20% 40% 60% 80% 100% Students Eligible for Free or Reduced-Price Meals POVERTY AND PERFORMANCE The persistence of achievement gaps in Illinois is wellknown. Past research has identified the disparities in academic opportunity between students from the richest and poorest parts of the Prairie State as among the widest in the country. 9 Of course, underperforming schools are not exclusive to poor communities. At the system level, however, children from lower-income households are in greater need of A- and B-rated public schools than their higher-income peers. The inequalities between the services provided to rich and poor Illinoisans are stark. In the highest-income school districts in the state, a school that fails to reach roughly forty percent or more of its students is a rare exception; in the most economically disadvantaged communities in Illinois, it is the norm. Even in the context of a state with deep and diffuse need for higher K-12 educational quality, the public education system has most dramatically failed to guarantee educational opportunity to children from households on the economic margins. Rather than serving as an instrument of equalization, public education in Illinois reproduces socioeconomic inequalities among residents. Across Illinois, household income and school performance were tightly linked in Standardized test scores in public schools gauged family wealth almost as well as they assessed math and reading ability. Indeed, one of the strongest correlations in the data that IFF analyzed for Raising Quality, Promoting Equity was the inverse relationship between student achievement and household income. As the proportion of a school district s population that was below the poverty line increased, proficiency in math and reading decreased. 10 The poorer a neighborhood, 9 Advance Illinois, Every Student Counts: The State We re in : A Report on Public Education in Illinois, November r(846) = -.819, p <
35 1,500 Chart 4: School Performance by Income Level A B 1,000 C D 500 F Low Low-Mid Mid-High District Income Level High the higher the proportion of students that the public education system in Illinois did not reach with grade-level preparation in reading and math. Moreover, based on the performance metrics that IFF applied in this study, even Illinois s short supply of A- and B-rated public schools was concentrated in the highest-income communities in the state: Three out of four high-performing schools in the state were located in the highest-income school districts. Only the most economically prosperous communities had access to a significant number of schools that had achieved the goal of promoting all or nearly all students to grade level in math and reading. Six percent of schools in high-income districts had a rating of F, while over thirty percent nearly three hundred schools were rated A or B. On the other hand, in all other districts combined, seventy-one percent of schools had a rating of F, and less than three percent only eighty-one in all were rated A or B. In low-income school districts, eighty-three percent of schools were F-rated over fourteen times the proportion in high-income communities. In Illinois, there are major barriers to high-performing schools across the state, in almost every city and town. The impact of these barriers on low-income communities, however, is disparate. Stakeholders cannot raise quality in Illinois public schools without first promoting equity. 28
36
37 PART II: DISTRICT FUNDING INTRODUCTION Analyzing school performance in isolation from factors that are crucial to shaping it yields an incomplete picture of public education in the state. Funding patterns in particular illuminate reasons that some districts fall short of the levels of reading and math preparation that public education should guarantee to every child. Schools cannot meet rigorous academic standards in the absence of adequate funding, including additional resources for student groups that need specialized educational services in order to thrive. For these reasons, education leaders and policymakers across the United States have long grappled with the role of local resources in funding public education. Many states have reformed systems that rely heavily on property taxes and other municipal funding sources on the grounds that they disadvantage lower-wealth communities. 11 Yet despite consensus on the need to correct Illinois s locallydriven school funding model as one journalist put it, Everyone agrees the state s funding formula needs to be updated and nearly everyone agrees [it] penalizes students in poorer districts 12 the state s regressive formula remained stable for decades. In recent years, initiatives to make school funding fairer in states throughout the country have often been grounded by an adequacy target designed to ensure that all children have access to public schools that can perform at a certain baseline. 13 The bipartisan Illinois School Funding Reform Commission recommended such an approach for the Prairie State in early As of the publication of this report, such reforms had not been passed into law. And although the state budget for fiscal year 2018 increased Illinois s contribution to its public schools by over three hundred million dollars, 15 the new appropriation fell short of the three to six billion dollars that the Funding Reform Commission estimated would be necessary to stabilize revenues for public education moving forward. 16 At the state level, K-12 public schools in Illinois spent approximately the national average per pupil in That Illinois kept pace with national norms overall, however, does not answer two crucial questions about school funding within the state. These two questions have to do with adequacy and equity. The question of resource adequacy is straightforward: do districts have enough money to provide the services that their student bodies need? Adequacy, then, is inextricably linked to equity. The Center for Public Education usefully frames the question of funding equity as, Do funds flow to schools according to need? 18 In the absence of additional revenue streams from state and federal sources, lower-wealth school districts are unlikely to keep pace with the amount of funds that wealthier districts can raise from property taxes and other local reservoirs. If the state funding formula does not compensate for inequalities in municipal property wealth, resource disparities surface between poorer and more affluent communities. All else held equal, these disparities give an edge to wealthier school districts, which have more dollars to support the education of each child. 11 See John Youngman, School Finance and Property Taxes, Land Lines, Winter 2016, pp ; Matthew M. Chingos and Kristin Blagg, Do Poor Kids Get Their Fair Share of School Funding?, The Urban Institute, May Ashley Lisenby, School funding overhaul again faces long odds in Springfield, Chicago Sun-Times, February 8, See John Youngman, School Finance and Property Taxes, Land Lines, Winter 2016, pp See Illinois School Funding Reform Commission, Report to the General Assembly and Governor, February See Illinois State Budget, Fiscal Year 2018, pp Illinois School Funding Reform Commission, Report to the General Assembly and Governor, February 2017, p National Education Association, Rankings & Estimates: Rankings of the States 2015 and Estimates of School Statistics 2016, May Center for Public Education, Educational Equity: What Does It Mean? How Do We Know When We Reach It?, January
38 An equitable public school funding system appropriates additional revenue to communities with limited financial resources so that they can offer the same level of highquality educational services as wealthier peers. And, crucially, the condition of equity cannot be achieved through disproportionate tax burdens on lower-income communities. A state-commissioned analysis suggested that, as of 2012, the Illinois school finance system was failing to meet these fundamental conditions of equity in K-12 funding. 19 Raising Quality, Promoting Equity builds on these findings using data from academic year IN DEPTH: COST WEIGHTING Illinois is an economically and demographically diverse state. The costs associated with running a school district vary widely across its urban, suburban, town, and rural regions. Moreover, the state s children enter the public school system with a wide array of academic needs. The price of providing services that can meet these needs varies with the composition of the student body and the size of the school district. This diversity has consequences for a central goal of Raising Quality, Promoting Equity: analyzing the equitability and adequacy of school funding in Illinois. In this study, district funding analysis is comparative. Evaluations of equity compare resource levels across socioeconomic groups, while evaluations of adequacy compare school district revenues to the stateestablished minimum for per-pupil funding. Yet in terms of the amount of need it can meet, a dollar in one district is not necessarily equivalent to a dollar in another. Without adjustments based on factors that add costs for school districts, meaningful comparisons in the area of district finance are difficult to make. Drawing from best practices in school finance research, most financial figures in Raising Quality, Promoting Equity are weighted to standardize expenditures and revenues across geographically and demographically dissimilar districts. The principle behind the weights is simple: each dollar spent in public schools goes further to meet student need in places where the cost of living is lower and children need fewer intensive or 19 Augenblick, Palaich and Associates, Overview of the Structure of the Illinois School Finance System, September
39 Chart 5: Supplemental Funds Needed Per Dollar $1.48 $1.33 $1.22 $0.76 $0.39 $0.37 $0.50 $0.60 $0.50 Small District Medium District Low-Income Students Large District Small District Medium District Large District English Language Learners Small District Medium District Large District Children with Disabilities specialized educational services. The cost weights utilized in this analysis allow districts to be compared as if they were educating the same students in the same place. The weighted figures can therefore be considered measures of how much need a school district is positioned to meet. A school district with higher weighted revenue can access more goods and services and therefore can meet more need from a financial perspective. Raising Quality, Promoting Equity uses two kinds of cost weights. The study first applies a cost of living adjustment using the Comparable Wage Index (CWI), a widely used set of multipliers for individual school districts based on the cost pressures of the labor market in which they are located. Then, a set of weights 20 is applied based on the district s population of low-income students, English language learners, and children with disabilities. These weights deflate revenue and expenditure totals to normalize how much need each district s resources could meet per pupil if every student required the same types of educational services (i.e., if they were enrolled in general education programming), based on the levels of additional funding needed per pupil outlined in Chart 5. Consider the following example of the combined effects of the cost of living adjustment and the need-based weights. In , Joppa-Maple Grove UD 38 a small school district near the Illinois-Kentucky border with 280 enrolled students spent $11,504 per pupil on K-12 operations. Wauconda CUSD 118, a larger district in Lake County that educated over four thousand students in the same year, had operational expenditures of $11,510 per pupil. At first glance, it might appear that funding levels were essentially equal between the two districts. 20 After a review of the literature on school district finance, IFF chose to adopt weights that Augenblick, Palaich and Associates (APA) developed for an analysis of district funding in Montana. APA are national leaders in school finance research and in the past have been contracted by the State of Illinois to analyze the state s K-12 funding formula. A principal advantage of the weights that APA developed for its study in Montana is that it differentiates costs based on district size. Recognizing the relative differences in cost burden based on size is helpful in the context of Illinois, where some districts enroll only a few dozen students and others enroll tens or hundreds of thousands. 32
40 Due to differences in educator salaries and other regional cost factors, however, a dollar goes substantially further to fund schools in Joppa-Maple Grove that it does in Wauconda. Joppa-Maple Grove is situated in one of the least expensive labor markets in the state, while Wauconda is in one of the costliest. Based on the Comparable Wage Index (CWI), each dollar can pay for roughly one quarter more educational goods and services in Joppa- Maple Grove than it can in Wauconda. Applying that index to account for cost of living, Joppa-Maple Grove s CWI-adjusted per-pupil funding is $14,183, while that of Wauconda is $10,760. After standardizing spending levels based on differences in the labor market, then, a twentyseven percent gulf in funding levels emerges that was not discernible from raw per-pupil spending. Yet in order to make accurate comparisons amongst diverse districts, it is important to ask not only how much a district s budget allows it to purchase but for whom it needs to make those purchases. This question has to do with the educational needs of the district s student body. Relative to a general education student, districts need supplementary funds to provide a quality education to vulnerable or marginalized student groups. Adding the need-based cost weights to the CWI-adjusted spending figures adjusts both districts spending totals by approximately the same proportion but for distinct reasons. Just under two thirds of the student body in Joppa-Maple Grove lived in low-income households in , compared to only about a quarter of students in Wauconda. In Joppa-Maple Grove, there were no English language learners, and ten percent of students had a disability; in Wauconda, one in ten students was learning English, and fourteen percent had a disability. After applying the weights above in combination with the CWI-adjusted figures, Joppa-Maple Grove s spending is weighted downward by thirty-eight percent to $10,307, and that of Wauconda is weighted downward by thirty-five percent to $7,968. These weights are roughly equivalent. In Joppa-Maple Grove, however, it is the population of lowincome students that drives the adjustment, whereas in Wauconda more of the change is due to the proportions of English language learners and students with disabilities. Although the raw per-pupil spending figures suggest that the two school districts were spending about the same amount on K-12 operations, adjustments for cost of living and student need reveal that, in financial terms, Joppa- Maple Grove UD 38 was able to meet twenty-six percent more academic need than Wauconda CUSD 118 in Without making adjustments to revenue and expenditure figures based on geography and demographics, these disparities would be hidden in the data. Raising Quality, Promoting Equity puts all districts on an even playing field by applying best practices in K-12 funding research to normalize funding and spending levels across Illinois s diverse educational landscape. 33
41 Chart 6: Cost Weighting Example $14,183 $11,504 $11,510 $10,760 $10,307 $7,968 Joppa-Maple Grove UD 38 Funding Per Pupil Wauconda CUSD 118 Joppa-Maple Grove UD 38 Wauconda CUSD 118 Funding Per Pupil, Adjusted for Cost of Living Joppa-Maple Grove UD 38 Wauconda CUSD 118 Funding Per Pupil, Adjusted for Cost of Living and Weighted for Student Needs To gauge funding adequacy, this report utilizes a state standard for the minimum amount of combined state and local funds necessary to run a high-performing school: the Foundation Level (FL) 21 published biennially by the Education Funding Advisory Board (EFAB). In , the EFAB FL was $8,672 per pupil for a general education student. 22 Because the cost-weighting methodology employed in this study normalizes revenues to a general education population with a consistent statewide cost adjustment, weighted figures can be compared directly to the FL to evaluate funding adequacy. Based on each district s weighted funding level, this report designates Joppa-Maple Grove UD 38 as adequately funded and Wauconda CUSD 118 as underfunded. 21 The foundation level (FL) should be distinguished from the statutory level (SL), which was the amount of funding that the state legislature agrees to guarantee school districts in a given year. At $6,119 per pupil, the SL in was about seventy percent of the amount that EFAB determined each district needs. 22 Based on numerous additional cost pressures, including the services required to meet the needs of vulnerable or marginalized students, supplemental grants and revenue supports beyond the FL are recommended on a district-by-district basis. See Illinois Education Funding Advisory Board, Illinois Education Funding Recommendations: A Report Submitted to the Illinois General Assembly, January 2015; Augenblick, Palaich and Associates, Overview of the Structure of the Illinois School Finance System, September
42 FUNDING ADEQUACY Statewide Underfunding. Schools cannot create environments of rigor, support, and achievement if they do not have enough funds to meet their students academic needs. The Illinois Education Funding Advisory Board s (EFAB s) Foundation Level (FL), a statewide standard for the amount of money needed provide quality education to a general education student, was $8,672 per pupil in Comparing districts weighted state and local revenue in that year to the FL reveals how their funding levels stacked up to the amount of resources that districts needed to guarantee access to core academic training. Using the FL as a benchmark, fifty-seven percent of public school students in Illinois over 1.1 million children were enrolled in a school district that was underfunded or borderline underfunded in These gaps in funding forced districts to work with fewer dollars than the state s recommendation, creating obstacles to vital educational resources. By placing nearly three out of five public school students in fiscally precarious educational settings, the state s education funding formula compromised the majority of children s opportunity to access a performing school. Location, Poverty, and Funding Adequacy. Data surrounding poverty and location are vital to a comprehensive education improvement agenda in a demographically and geographically diverse state such as Illinois. The preceding chapter of Raising Quality, Promoting Equity highlighted ties between income and school performance. And while the need for higherperforming schools was relatively well-spread throughout the state, the communities in which a substantial number of students had access to an A- or B-rated school were Chart 7: Enrolled Students by Funding Level Adequately Funded 43% 13% Borderline 44% Underfunded concentrated in the state s higher-income suburbs. Particularly given the salience of income and geography for understanding school performance, the relationships among poverty, location, and district funding merit exploration. Mirroring patterns in school underperformance, statistically significant associations emerged between funding adequacy and income level in the Prairie State. 23 In , underfunding disproportionately affected Illinois s lowest-income school districts. The poorest districts were approximately five times more likely than their high-income peers to have insufficient revenue based on state standards. Whereas an underfunded or borderline underfunded school district was an exception in higher-income areas of the state, it was the norm in Illinois s low-income communities. 23 χ 2 (6, N = 855) = 146.7, p <
43 Chart 8: Funding Adequacy by Income Level Chart 9: Weighted Revenue Per Pupil by District Income Level Revenue Source Federal State Low Income Low-Mid Income Mid-High Income High Income Local Underfunded Borderline Adequately Funded In weighted dollars, which equalize the amount of need that a school district is positioned to meet based on its financial resources, average revenue per pupil in highincome districts ($12,704) was one third higher than in low-income districts ($9,549) in Higher-income school districts had, on average, over three thousand additional dollars with which to educate each student when location and student need are taken into account. These patterns in school district funding translate into disparities in the quality of educational services that could be provided to students. Increased revenue opens up possibilities for districts to fund any number of educational programs that might boost student outcomes in math and reading and beyond: smaller class sizes, staffing improvements, specialized instruction, tutoring programs, better textbooks and equipment, facilities upgrades, etc. The funding system in Illinois public Low Income Low- Mid Income Mid- High Income High Income schools structurally guarantees that students whose guardians have higher incomes have access to more opportunities in the public education system than students from poorer households. Alongside income-based disparities, statistically significant associations emerged in the adequacy of funding available to school districts by geography in A greater proportion of students in urban areas were enrolled in underfunded school districts than students who resided in rural, town, or suburban areas. 24 χ 2 (6, N = 855) = 40.6, p <
44 Districts located in towns on the fringes of metropolitan areas were underfunded at higher rates than districts in urban, suburban, or rural areas. The funding formula in Illinois was more likely to underfund a district in a town than a district in an urban center even though a lower proportion of students in towns attended underfunded districts than students in cities. Chart 10: Funding Adequacy by Geography Furthermore, when district funding levels were aggregated to the 234 study areas into which Raising Quality, Promoting Equity divides Illinois, regional gulfs in funding adequacy emerged. Underfunded school districts were dispersed throughout the state in Overall, however, educational resources tended to be less adequate downstate than upstate. In the northern half of Illinois, only a handful of locations Chicago, some of its suburbs, and Kankakee County were underfunded at the study area level. In southern Illinois, by contrast, most districts were underfunded or on the borderline. Rural Underfunded Town Borderline Suburban Urban Adequately Funded 37
45 SECTION CONTINUED ON NEXT PAGE 38

46 Map 5: Funding Adequacy ONLINE TOOL: Evaluate and compare district funding outcomes using the online tool, which allows users to zoom in and see individual districts funding levels, along with a set of key financial and performance indicators. 39
47 40
48 Chart 11: Revenue Sources for K-12 Public Education Federal 7% for a smaller percentage of overall revenue for public education. Based on estimates from the National Education Association, Illinois relied about sixty percent more on locally sourced revenue and fifty percent less on state-distributed revenue to fund public schools than the average state. 25 State 34% 59% Local For 2014, Illinois received a funding distribution rating of F from the Education Law Center, which evaluates funding relative to student poverty. 26 The Education Trust found Illinois s resource gap between high- and low-income school districts to be by far the largest in the United States. 27 FUNDING EQUITY Combined, the 855 school districts analyzed in this study received over thirty billion dollars in revenue in academic year Fifty-nine cents of each dollar came from local sources primarily from property taxes. The state of Illinois provided just over a third of education funding. This model of school funding made Illinois exceptional for the extent of its reliance on municipalities to fund K-12 education, for the slim portion of education funding that the state directed, for the failure of its funding formula to shore up resources in low-income districts, and for the lack of progress in making funding more equitable over time. Local resources accounted for a larger proportion of K-12 school funding in Illinois than in any state in the country, and nowhere did state funding account The Urban Institute found Illinois s state education spending to be the most regressive in the country in And whereas some states reduced or eliminated regressivity in their funding formulas over the past two decades, Illinois s school funding was slightly more regressive in 2014 than in One clear way that residents of lower-income neighborhoods attempted to correct for this imbalance in funding levels is by paying more in school taxes. To compensate for the gap in funding that state resources did not fill, taxpayers in low-income school districts were taxed at twenty-five percent higher rates than taxpayers in high-income school districts in In this way, the state s reliance on local sources to fund schools placed a disproportionate financial burden on poor communities. The funding structure in Illinois effectively required residents with the least disposable income to contribute even more of it to schools and they still recouped less adequate resources in return. 25 National Education Association, Rankings & Estimates: Rankings of the States 2015 and Estimates of School Statistics 2016, May Bruce Baker, Danielle Farrie, Monete Johnson, Theresa Luhm and David G. Sciarra, Is School Funding Fair? A National Report Card, sixth edition, Education Law Center, January Natasha Ushomirsky and Davis Williams, Funding s 2015: Too Many States Still Spend Less on Educating Students Who Need the Most, The Education Trust, March Matthew M. Chingos and Kristin Blagg, Do Poor Kids Get Their Fair Share of School Funding?, The Urban Institute, May 2017.
49 Chart 12: Income, Wealth, and Revenue for K-12 Education Revenue Source Federal State Local Low Income Low- Mid Income Mid- High Income High Income Given this landscape, disparities in funding adequacy are unsurprising. The funding structure in the Prairie State, by channeling a relatively small proportion of education funding through state channels, compromised the state s leverage over school district funding. As a result, Illinois had less ability to compensate for inequalities arising from disparities in municipal property wealth than states that control a greater share of K-12 resources. These imbalances left low-income school districts, which are dependent on state aid to raise an adequate amount of funding for students, with little recourse. SECTION CONTINUED ON NEXT PAGE 42
50 Chart 13: Instructional Spending and Proficiency 100% 80% 60% 40% 20% $0 $5,000 $10,000 $15,000 $20,000 Instructional Expenditure Per Pupil (Weighted) SPENDING AND PERFORMANCE Does increased education spending boost academic achievement in public schools? In Illinois, spending appears to tell only part of the story; there are important factors other than money that impact school performance. Yet clearing a foundational bar for financial resources is usually necessary, if not always sufficient, to clear a foundational bar for academic performance in turn. Consistent with the consensus of school finance research, Raising Quality, Promoting Equity finds that additional dollars in districts and classrooms alone are not necessarily associated with stronger core performance outcomes. Across Illinois, there was a weak, but statistically significant, relationship between weighted overall 29 and instructional 30 spending and student achievement in math and reading in Once poverty levels were accounted for, weighted instructional 31 or operational 32 spending on their own i.e., in the absence of other data on district spending patterns could not explain differentiation in performance outcomes at the system level. Variance in spending levels among districts with comparable performance outcomes illustrates the murky relationship between spending and performance in Illinois. For example, among districts that were achieving eighty percent proficiency in reading and math in the basic floor for a rating of A or B in this study some districts spent around $5,000 per pupil in weighted dollars on instruction, while others spent upwards of $10,000. Indeed, across the state, many districts that spent $10,000 or more on instruction had lower performance outcomes than districts spending around $5,000. Greater expenditures were not uniformly tied to better academic performance in Illinois in , even when levels of student need and cost of living were taken into account. Overall, however, adequately funded districts outperformed underfunded counterparts. Similarly, in weighted dollars, school districts with ratings of A or B averaged thousands more in spending per pupil than districts with ratings of C, D, or F. And at the district level, high levels of academic performance were exceedingly rare in the absence of adequate funding r(846) =.254, p < r(846) =.408, p < When districts' composite proficiency rates in reading and math were regressed on low-income population and weighted instructional spending per pupil, the effect of weighted instructional spending per pupil was statistically insignificant at the.05 level (p =.126). 32 When districts' composite proficiency rates in reading and math were regressed on low-income population and weighted operational spending per pupil, the effect of weighted operational spending per pupil was statistically insignificant at the.05 level (p =.851).
51 Chart 14: Wealth, Spending, and Performance $15,698 $12,206 $9,674 $9,210 $8,814 A B C D F Proficiency rates in adequately funded districts were nine points higher in math 33 and ten points higher in reading 34 than in underfunded districts. Four out of five performing schools in the state were in districts that were adequately funded. Of the 326 school districts that were underfunded or borderline underfunded, 316 were rated C, D, or F. Performing districts drew local revenue from a larger base of property wealth and could tax it at lower rates. These findings add nuance to the adage that you can t throw money at the problem. Additional revenue for school districts on its own does not seem likely to boost performance in all places. Disparities in funding adequacy, however, impact the ability of many districts to provide their students with core academic training. Increasing funding, especially to low-income and underfunded school districts, will not comprehensively address Illinois s scarcity of high-performing K-12 public schools in the absence of other changes to policy and practice. Data on the uses and effectiveness of spending, such as return on investment, are crucial context for funding and performance data. Yet ensuring adequate and equitable funding is a crucial piece of the school improvement puzzle in the state. Statewide performance outcomes are not likely to improve without doing so. 33 The difference was statistically significant. Adequately funded districts had higher proficiency rates in math (M = 61.7, SD = 15.0) than underfunded districts (M = 52.5, SD = 13.4), t(742) = -7.82, p < The difference was statistically significant. Adequately funded districts had higher proficiency rates in reading (M = 62.0, SD = 13.1) than underfunded districts (M = 52.3, SD = 11.7), t(742) = -9.38, p <
52 45
53 PART III: RETURN ON INVESTMENT INTRODUCTION Recent research in school finance suggests that substantial, long-term strategic investments in underperforming schools can improve outcomes in academic achievement, graduation, and other basic indicators of K-12 school quality especially for students from economically disadvantaged backgrounds. 35 And, as preceding sections of this analysis have demonstrated, many districts in Illinois particularly in poorer communities lack enough funding to provide the resources that students need. Enhancing revenue streams for many districts in the state is an important component of raising school quality and promoting equity across districts. Yet some questions remain unanswered from performance and funding data. In which districts can additional revenue alone be expected to make substantial impact on performance outcomes? In what places does funding appear necessary but not sufficient? Are there districts in which any amount of funding seems unlikely to make a dent without structural changes to policy and practice? In order to strategically target statewide reform efforts, data that measure the effectiveness of educational expenditures are crucial. Raising Quality, Promoting Equity analyzes return on investment (ROI) in Illinois public school districts to connect and supplement the data on performance and funding with information on the impact of school spending. In this report, ROI is an indicator of academic achievement per dollar spent. It measures the effectiveness of day-to-day spending for achieving proficiency in reading and math. After adjusting operational expenditures based on cost of living and the needs of the student body in a school district, ROI is calculated by dividing a district s composite proficiency rate by the amount of money spent per pupil on K-12 operations. Medium or high ROI suggests that districts are making good to excellent use of the resources at their disposal for the purposes of achieving proficiency in math and reading relative to other school districts in the state. Low ROI suggests that districts spending has limited impact on this core academic indicator. IFF s measure of ROI has a targeted purpose. It is not intended to be a comprehensive evaluation of district quality. Instead, it is designed to evaluate the effectiveness of district resource allocation and to guide strategic investment in school districts across Illinois based on districts current success in promoting high levels of academic performance in core subjects. ROI gauges whether funds are being used effectively to bring about proficiency in reading and math and, based on past performance, whether additional funds can be expected to have a significant impact on basic student outcomes. SECTION CONTINUED ON NEXT PAGE 35 Julien LaFortune, Jesse Rothstein, and Diane Whitmore Schanzenbach, School Finance Reform and the Distribution of Student Achievement, National Bureau of Economic Research Working Paper 22011, February 2016; C. Kirabo Jackson, Rucker C. Johnson, and Claudia Persico, The Effects of School Spending on Education and Economic Outcomes: Evidence from School Finance Reforms, The Quarterly Journal of Economics 131(1), February 2016, pp
54 Chart 15: Income, Performance, and Return on Investment (ROI) Low ROI Medium ROI High ROI Low Mid- High High Low Low- Mid Mid- High High Low Low- Mid Income Income Income Low- Mid Mid- High High C D F POVERTY, PERFORMANCE, AND RETURN ON INVESTMENT This section focuses specifically on school districts that had not attained a rating of A or B in , as lowerperforming schools and districts will tend to be the center of statewide efforts to increase the impact of spending. In districts with high return on investment (ROI), expenditures were going the furthest in bringing about student achievement in math and reading in As the chart above demonstrates, most underperforming districts with high ROI were rated C or D: they were near or approaching, but had not yet reached, high levels of academic achievement in core subjects. Spending had a more positive impact on performance, and future revenue could be more effective in improving academic outcomes, in districts with high ROI. That districts can simultaneously be underperforming yet appear to be investment-ready is significant: it reinforces that, while money cannot solve all problems in K-12 schools, not every district that has yet to reach high levels of academic achievement in reading and math is making poor use of the resources at its disposal. Indeed, a considerable number of F-rated districts had high ROI in At the same time, however, many districts with a rating of F, as well as a substantial number of C- and D-rated districts, had low ROI in Based on past patterns in funding and performance, additional dollars alone seem less likely to contribute to performance in math and reading in these places at a high rate. 47
55 Of course, many of these F-rated school districts were underfunded or borderline underfunded. That a district s ROI is low or middling does not mean that it should not be eligible for additional funding especially if its funding levels are inadequate. Very few districts, even with the most careful financial practices, will be able to bring a high number of students up to grade level when resources are insufficient for the task at hand. Low or medium ROI does suggest, however, that an underfunded district would benefit from concerted fiscal or programmatic support in conjunction with additional revenue in order to bring about better student outcomes in core academic subjects. If the district is underfunded, new revenue streams could be tied hand-inhand with supports and incentives that encourage more effective resource allocation and the adoption of best practices from districts with higher performance and ROI. ROI, EQUITY, AND ADEQUACY Trends in K-12 educational ROI also underscore the inequities that are embedded in the structure of K-12 public education in Illinois. It is true that many lowincome and low-performing districts in Illinois had medium to high return on the resources that they had to invest. Even if these school districts were underfunded and/or underperforming, their spending was having a medium to high impact on improving reading and math outcomes for students. For example, sixteen percent of F-rated school districts had high ROI; about two thirds of these were located in low- or low-mid income communities. In many low-income school districts, then, spending was impactful even where funding was insufficient. As demonstrated by the concentration of low-income schools on the left side of the graph above, however, most districts that served large proportions of low-income students in Illinois in had low ROI outcomes. In these districts, operational spending had low impact on reading and math proficiency relative to the rest of the state. Particularly given that low-income communities paid substantially higher tax rates to support their K-12 public schools, it is noteworthy that spending in lowincome districts had less impact in terms of preparing them to succeed in reading and math. The prevalence of low-income districts with low ROI suggests that the education community should focus a significant share of comprehensive and targeted services on these districts in order to improve outcomes. At the same time, however, it should be noted that in districts that are severely underfunded as were the districts that most low-income students attended in it is possible that the amount of resources that districts are able to provide to students does not allow for high ROI even with the most efficient and careful financial and programmatic practices. That the return on inadequate investments would in many cases be low is unsurprising. SECTION CONTINUED ON NEXT PAGE 48
56 Chart 16: Return on Investment (ROI) by Funding Adequacy Threshold for High ROI Threshold for Medium ROI Underfunded Borderline Adequately Funded Indeed, to conclude that lower-income districts are poor candidates for investment would be premature. Across the state, ROI was better in underfunded and borderline underfunded districts than in adequately funded districts in On average, ROI was twenty percent higher in underfunded school districts and fifteen percent higher in borderline funded school districts than in adequately funded school districts. 36 The typical underfunded district had high ROI, while adequately funded districts tended to just clear the bar for medium ROI. Underfunded school districts, which were disproportionately attended by students from lowincome households, tended to have more impactful spending in than adequately funded districts. In many cases, then, shoring up the revenue streams of districts with inadequate funding levels can be expected to have a higher impact on core reading and math performance than investing financially in districts that have cleared a foundational level of funding. As the data presented in this section illustrate, the relationships among poverty, funding, performance, and return on investment are multifaceted. To address the gap between Illinois's goals for school performance and current outcomes in classrooms across the state, a broad view of statewide trends must be fused with a careful district-by-district analysis of academic outcomes, funding levels, and the effectiveness of spending. By understanding interplay among these indicators at the macro and micro levels and using data to shape school improvement, stakeholders in K-12 education can maximize the impact of their work and streamline progress towards a system that reaches every child. 36 A Kruskal-Wallis test revealed statistically significant differences in return on investment (ROI) by funding level, χ 2 (2 = 82.4, p <.001). A Dunn-Bonferroni post-hoc analysis revealed statistically significant differences in ROI between adequately funded and borderline underfunded districts. It also revealed 49 statistically significant differences in ROI between adequately funded districts and underfunded districts. It did not reveal statistically significant differences in ROI between underfunded and borderline underfunded districts.
57 Chart 17: Overhead Spending by Return on Investment (ROI) $0.42 $2,973 $2,167 $1,879 $0.37 $0.37 Low ROI Medium ROI High ROI Overhead Spending Per Dollar Spent on Instruction Low ROI Medium ROI High ROI Overhead Spending Per Pupil, Weighted ROI, SPENDING, AND PERFORMANCE Levels of return on investment (ROI) illuminate differentiation in overhead spending across the state. On the whole, districts with high ROI dedicated more of their money to instruction and instruction-adjacent activities and less to overhead and administrative functions than districts with lower ROI in For the purposes of this study, overhead costs include central office services, general administration, school administration, and maintenance. Districts with high ROI spent less on overhead than districts with low ROI in two key ways: Districts with high ROI spent less overall on overhead per pupil. Districts with high or medium ROI spent less on overhead relative to their expenditures on instruction. Compared to overhead expenses, instructional spending represented a greater share of the budget in districts with high and medium ROI than in districts with low ROI. SECTION CONTINUED ON NEXT PAGE 50
58 Map 6: Return on Investment, Study Areas ONLINE TOOL: Evaluate and compare district Return on Investment (ROI) using the online tool, which allows used to zoom in and see individual districts ROI, along with a set of key financial and performance indicators. 51
59 52


60 RECOMMENDATIONS Academic accountability, adequate and equitable resources, and financial stewardship should represent a unified statewide effort to improve school quality. Implement rigorous summative ratings that, among other criteria, meaningfully capture progress towards the absolute benchmark of promoting all or nearly all students to grade level, not merely performance outcomes relative to other schools in the state. Tailor supports to each school s rating. Reserve a designation of high-performing only for schools that have, among other achievements and benchmarks, successfully met the goal of promoting ninety percent of students to grade level in reading and math. Strategically target this three-part process based on the distribution of supply and demand across the state, using the service level and service gap together to identify where to direct resources and attention. Then, use performance, funding levels, and return on investment (ROI) as guideposts for how to improve school quality in a particular place. ACADEMIC ACCOUNTABILITY Set high standards for academic performance, and hold schools to them through a clear accountability system. In order to reach our state s goal of ninety percent proficiency in math and reading statewide by 2032, all schools and districts will need to do their part by equipping the vast majority of their students with foundational academic skills. A school should only be considered performing if it is meeting this benchmark. Reserve a designation of near-performing only for schools that, among other achievements and benchmarks, have proficiency levels that can feasibly be raised to the target of ninety percent in the near future without major investment or intervention. Provide a grace period by which these schools must reach the target of ninety percent before an improvement plan is required. Reserve a designation of underperforming for schools that, among other indicators, are not nearing the target of ninety percent proficiency but do not have chronically low levels of underperformance. Require an improvement plan and provide a grace period for progress before comprehensive supports are required. Reserve a designation of chronically underperforming for any school in which the majority of students do not finish the academic year on grade level. Provide comprehensive supports to these schools. The value of summative scores for school performance is their potential to be supportive, not punitive. As the 53
61 Illinois State Board of Education s (ISBE s) plan for implementing the Every Student Succeeds Act (ESSA) states, all schools have something to learn from and share with their colleagues in a supportive community of practice. [A] summative determination should assist in creating a connection between schools and districts throughout the state. 37 Summative scores can be a pillar of a system-wide network of support, innovation, and mutual improvement but only if they accurately capture gradations in school performance relative to state goals. ADEQUATE AND EQUITABLE RESOURCES Guarantee adequate and equitable funding for every school in Illinois. Invest in underfunded schools and districts. First, establish an adequacy target for per-pupil funding for each school based on local and regional cost pressures, district size, and the educational needs of the student body. Then, guarantee that each school reaches its adequacy target in every academic year. Secure revenue streams by which the State of Illinois can fully compensate for disparities in local wealth and guarantee that all schools and districts reach their adequacy target each year. Publicize the ratio between the individualized adequacy target and actual per-pupil funding at the district level beginning immediately, and at the school level once school-level spending figures are available in compliance with ESSA. FINANCIAL STEWARDSHIP Empower local and regional stakeholders to allocate resources within school districts in ways that will maximize impact on school performance and climate. Provide data that allow stakeholders to understand district spending patterns in a broader context and diffuse best practices across the state. For example, include the following in the state s data dashboards: Data that allow stakeholders to compare spending decisions and funding levels with those of nearby or similar school and/or districts. A measure of how effectively schools and/or districts are using the funds at their disposal, such as return on investment. Incentivize districts to maximize spending on instruction and minimize spending on overhead. When districts identify cost savings, especially after eliminating overspending on overhead, or recoup new revenue, encourage them to funnel the dollars into the classroom. Revise the Limitation of Administrative Costs section of the School Code to limit overhead costs relative to instructional or operational spending rather than merely limiting year-to-year growth. Structure investments in districts and schools based on the effectiveness of current spending in increasing performance outcomes. Investment in districts with lower return on investment (ROI) should be accompanied by programmatic supports to increase the impact of spending. 37 Illinois State Board of Education, State Template for the Consolidated State Plan Under the Every Student Succeeds Act, April 2017, p
62

63 DISTRICT PROFILES: BRIGHT SPOTS FOR FUTURE INVESTMENT ONLINE TOOL The data visualization suite that accompanies this report allows users to compare schools, districts, and study areas of their choosing with the state and with customizable sets of peers from a variety of perspectives. Users interested in their school, district, or region can see how their outcomes in performance, funding, and return on investment (ROI) stack up to those of nearby places, of demographically similar communities, or of the state as a whole. In academic year , over a third of school districts in Illinois were underfunded or borderline underfunded. With adjustments for student need and cost of living, about one quarter of districts had at least three hundred dollars less than the minimum amount of revenue that the Illinois Education Funding Advisory Board (EFAB) recommended to guarantee high performance in an efficiently administered school district. An additional twelve percent of districts were within three hundred dollars of the EFAB minimum. Overall, nearly three out of five students in Illinois were enrolled in these underfunded or borderline underfunded school districts in Unsurprisingly, very few of the school districts that had inadequate or borderline funding were performing. Of the 326 school districts that were underfunded or borderline underfunded in , 316 were rated C, D, or F. Return on investment, however, reveals that there were noteworthy positive outcomes in these districts even if they had not yet reached statewide goals to reach all or nearly all students with grade-level preparation in core subjects. Within underfunded and underperforming districts, about half (147) had high ROI in Overall, they were achieving reasonable academic results given the funding at their disposal. This section profiles three of these 147 bright spots for future investment. Two thirds of these districts were in communities with below-average property wealth, and just under half had above-average populations of lowincome students. Approximately half were suburban, often on the outer ring of their metropolitan area. There was also a disproportionate concentration of these districts in downstate Illinois. By providing a small crosssection of the diversity that these districts encompass, Raising Quality, Promoting Equity sketches the types of information that stakeholders can marshal in designing their school improvement efforts. 56
64 59.5% Chart 19: Student Demographics in Elgin-Area School District U % 14.3% 43.5% 12.3% 4.0% Elgin-Area SD U-46 State Average Elgin-Area SD U-46 State Average Elgin-Area SD U-46 Low-Income English Language Learners With Disabilities State Average Chart 18: Enrolled Students by School Performance in Elgin-Area School District U-46 vs. Illinois 1% 3% 13% 8% A 15% 29% B 19% C D 57% 55% F SD U-46 Elgin-Area School District U-46 enrolled over forty thousand students from eleven northwest suburbs of Chicago in Cook, DuPage, and Kane Counties. One of the municipalities that SD U-46 serves is Elgin, which is the sixth highest-need area that this study identifies. Overall, SD U-46 was keeping pace with state academic averages despite insufficient funding for its large populations of low-income students, English language learners, and children with disabilities. The district had low levels of overhead spending and high return on investment. Elgin-Area School District U-46 Statewide Access to A- and B-rated schools was lower in SD U-46 than at the state level in Ninety-nine percent of students in SD U-46 attended a C-, D-, or F-rated school, as compared to eighty-nine percent statewide. There was one performing school in the district, Prairieview 57
65 Chart 20: Funding and Wealth in Elgin-Area School District U % $8,672 $211,868 $7, % $100,809 Elgin-Area SD U-46 State Recommendation Elgin-Area SD U-46 State Average Elgin-Area SD U-46 State Average State & Local Funding School Tax Rate Property Wealth Per Pupil Elementary School in Bartlett. Overall, however, SD U-46 was roughly on par with the state in terms of the proportion of students on grade level: fifty-five percent of SD U-46 students were proficient in reading in math, as opposed to fifty-nine percent in the average district. These performance outcomes become more noteworthy when the needs of SD U-46 student body are compared to state averages. In , SD U-46 had thirty-seven percent more low-income students, over six times as many English language learners, and only slightly fewer students with disabilities than the average district. When funding levels are normalized to reflect the high cost of living in the Chicago metropolitan area and the additional costs necessary to provide a quality education to the subgroups listed above, SD U-46 received eightyfive percent of recommended funding levels. Despite the high tax rate in the district only twenty-two of the 858 districts analyzed in this report had higher rates than SD U-46 the district s low property wealth and the lack of sufficient revenue from the state limited funding. SD U-46, which was nearly keeping pace with the state academically despite a funding gap and a high-need student body, had high return on investment. It also had one of the lowest ratios between overhead and instructional spending in the state: for every dollar spent in the classroom, SD U-46 spent only thirty-one cents on overhead. Overall, K-12 operational expenditure in this high-poverty, lowwealth school district had a high impact on reading and math outcomes. It seems likely to put additional funds to good use, but the district appeared to be tapping out its local resources in and would need additional state support in order to provide students, teachers, and school leaders with more resources. 58
66 64.1% Chart 21: Student Demographics in Vienna School District % 14.3% 4.0% 43.5% 1.6% Vienna SD 55 State Average Vienna SD 55 State Average Vienna SD 55 Low-Income English Language Learners With Disabilities State Average VIENNA SD 55 In , Vienna SD 55 enrolled over four hundred students in a single elementary school, Vienna Grade School, near the southern tip of Illinois in Johnson County. Overall, Vienna was exceeding state academic averages despite insufficient funding for its large populations of low-income students, English language learners, and children with disabilities. The district had low levels of overhead spending and high return on investment. Vienna Grade School is a D-rated school based on the metrics developed in this study. Sixty-four percent of students in Vienna SD 55 were on grade level in reading in math, clearing the statewide level by a full six points. Moreover, Vienna SD 55 was successfully preparing a relatively high-need student body to achieve above the state average. More than three out of five students in the district came from low-income households, nearly fifty percent higher than the state average. The district had few English language learners and a near-average population of children with disabilities. When funding levels are normalized to reflect cost of living and the additional costs necessary to provide a quality education to the subgroups listed above, Vienna SD 55 received only seventy-eight percent of recommended funding levels. The district s school tax rate was relatively low, suggesting that some additional revenue could potentially be raised locally, but the area s low property wealth just over a third of the state average limited the amount of funding that could generated from local resources. 59
67 $8,672 Chart 22: Funding and Wealth in Vienna School District % $211,868 $6, % $71,041 Vienna SD 55 State Recommendation Vienna SD 55 State Average Vienna SD 55 State Average State & Local Funding School Tax Rate Property Wealth Per Pupil Vienna SD-55, which was ahead of the state academically despite a funding gap and a relatively high-need student body, had high return on investment. It also had one of the lowest ratios between overhead and instructional spending in the state: for every dollar spent in the classroom, Vienna SD-55 spent only twenty-two cents on overhead. Overall, K-12 operational expenditures in this high-poverty, low-wealth school district had a high impact on reading and math outcomes. The district seems likely to put additional funds to good use. Some may be able to be sourced locally, but it appears likely to need additional state support in order to provide students, teachers, and school leaders with more resources. SECTION CONTINUED ON NEXT PAGE 60
68 Chart 24: Student Demographics in Collinsville School District % 6.5% 15.0% 14.3% 43.5% 4.0% Collinsville SD 10 State Average Collinsville SD 10 State Average Collinsville SD 10 Low-Income English Language Learners With Disabilities State Average Chart 23: Enrolled Students by School Performance in Collinsville School District 10 3% A B 26% 8% 15% 19% COLLINSVILLE CUSD 10 In , Collinsville Community Unit School District 10 enrolled over six thousand students across four suburbs of St. Louis. The district had eight elementary schools, two middle schools, and a high school. C D F 74% Collinsville SD 10 55% Statewide All students in CUSD 10 attended a school with a rating below B, compared to eighty-nine percent of students statewide. Overall, however, CUSD 10 was nearly on par with the state in terms of the proportion of students who were on grade level: fifty-three percent of CUSD 10 s students were proficient in reading in math, as opposed to fifty-nine percent in the average school district. These performance outcomes become more noteworthy when the needs of the CUSD 10 student body are 61
69 Chart 25: Funding and Wealth in Collinsville School District 10 $8, % 4.3% $211,868 $6,272 $106,555 Collinsville SD 10 State Recommendation Collinsville SD 10 State Average Collinsville SD 10 State Average State & Local Funding School Tax Rate Property Wealth Per Pupil compared to state averages. CUSD 10 had over a third more low-income students, fifty percent more English language learners, and five percent more students with disabilities than the average district. When figures are normalized to reflect cost of living and the additional resources necessary to provide a quality education to the subgroups listed above, CUSD 10 received seventy-two percent of recommended funding levels. Despite the above-average school tax rate in the district, low property wealth and a lack of sufficient revenue from the state limited available funding. K-12 operational expenditures in this high-poverty, lowwealth school district had a high impact on reading and math outcomes. It seems likely to put additional funds to good use, but the district appears to be tapping out its local resources and will need additional state support in order to provide students, teachers, and school leaders with more resources. CUSD 10, which was nearly keeping pace with the state academically despite a funding gap and a high-need student body, had high return on investment. Overall, 62

70 IN DEPTH: CHICAGO City of Chicago School District 299 commonly known as Chicago Public Schools 38 is the country s thirdlargest school district and enrolls nearly twenty percent of public school students in Illinois. With an annual budget in excess of five billion dollars, CPS is at the center of statewide discussions about education and fiscal policy. The district is also a frequent topic of conversation and analysis in the school reform community across the country. A comprehensive reform agenda in Illinois must address, but not overemphasize, public education in Chicago. Needs Assessment: School Performance. Consistent with statewide trends, students in Chicago faced a shortage of K-12 public school options that were meeting the statewide goal of preparing all or nearly all students to achieve at grade level in Six percent of CPS students had access to a school that was rated A or B in based on the scale developed for this study, lower than the statewide service level of twelve percent. None of the three grade spans emerges as significantly more in need of quality seats than any other within Chicago. Each grade span s level of need was in line with its share of the CPS student body. Citywide, about half of demand was in elementary schools, just under a quarter in middle schools, and just over a quarter in high schools; the service gap was distributed across the city with nearly identical proportions. Largely because of Chicago s network of high-performing magnet secondary schools, the service level in the city was marginally higher in grades 9-12 than in grades K-5 or grades 6-8. Across the city, however, nearly nineteen out of twenty students lacked access to an A- or B-rated K-12 option. In eighty-four percent of the study areas in Chicago, less than one in ten K-12 students had access to an A- or B-rated public school. Unlike at the state level, however, none of the study areas in Chicago completely lacked access to high-performing schools, owing to population density and the availability of schools that accepted students from across the city. Citywide, however, over ninety percent of students were not able to access an A- or B-rated school. In only one Grade Division Table 6: Supply and Demand by Grade Division, Chicago Performing Schools Demand Supply Level Percent of District K ,006 8, ,370 5% 50% ,788 4,621 79,167 6% 23% ,133 10,138 89,998 10% 27% K-12 32* 360,927 28, ,532 6% 100% *Because some schools overlap grade divisions,the number of performing schools may not sum. 38 Two state-commissioned public charter schools located in Chicago in served the city s students but were not authorized by City of Chicago School District 299. For the purposes of this report, Chicago Public Schools refers to all public schools serving residents of Chicago, including the two statecommissioned charter schools; City of Chicago School District 299 refers specifically to the district. 63
71 Map 7: Level, City of Chicago 64
72 Chart 26: Enrolled Students by School Performance in Chicago Public Schools 4% 3% 3% 6% 8% A 12% 15% B C D F 76% Chicago Public Schools 19% 55% Statewide study area, covering the Mount Greenwood neighborhood, did more than a quarter of students have access to an A- or B-rated K-12 public school. In a handful of other study areas in Chicago north and east of Interstate 90, between ten and twenty-five percent of students could access an A- or B-rated school. Yet from a citywide perspective, a highperforming K-12 public school option was unavailable to most students in Poverty, Performance, and Progress in Chicago. The challenges for school improvement in the largest city in the state are considerable. A comprehensive agenda must improve a system in which nearly all schools have not reached statewide goals of delivering grade-level preparation in core subjects to a substantial proportion of roughly 400,000 enrolled students. The relative severity of the lack of access to performing schools between the city of Chicago and the state of Illinois, however, should not be overstated particularly given the level of need that public schools in Chicago must meet. CPS is constitutive of the broader public education system in Illinois. Within this system, there is a strong inverse relationship between the percent of a district s students that live in low-income households and academic achievement in math and reading. This wider context shapes outcomes in Chicago in two ways. First, CPS internally mirrors the relationship between poverty and performance that emerges at the state level. Higher-income students in Chicago had better-performing public school options than lower-income students in As the proportion of a district s population that was below the poverty line increased, proficiency in math and reading decreased. 39 Moreover, over half of A- and B-rated schools were magnet schools whose student bodies tend to under-represent children from low-income households and students of color. 40 Overall, the relationship between poverty and performance was slightly less regressive within Chicago than at the state level, but poor students had disproportionately lower-performing K-12 options than more affluent peers. In this way, Chicago s schools are, at least to an extent, products of the statewide context in which they are embedded. Second, CPS represents one pole of Illinois s highly unequal educational system. In , CPS educated over 345,000 low-income students, 68,000 English language learners, and 55,000 individuals with disabilities. In other words, CPS s student body had twice the proportion of low-income students, over four times the proportion of English language learners, and about the same proportion of students with 39 r(549) = -.722, p < A 2016 analysis found that selective enrollment and magnet schools in CPS enrolled children of color and low-income students at lower rates than other public schools around the city. See Kimberly Quick, Chicago Public Schools: Ensuring Diversity in Selective Enrollment and Magnet Schools, The Century Foundation, October
73 Chart 27: Poverty and Performance in Chicago Public Schools 100% 80% 60% 40% 20% 20% 40% 60% 80% 100% Students Eligible for Free or Reduced-Price Meals Chart 28: Student Demographics in Chicago Public Schools 85.7% 17.0% 13.8% 14.3% 43.5% 4.0% CPS State Average CPS State Average Low-Income English Language Learners With Disabilities CPS State Average 66
74 Table 7: Supply and Demand by Grade Division, Chicago, High-Need Areas Grade Division Performing Schools Demand Supply Level Percent of District K , ,218 1% 14% , ,834 3% 6% ,008 2,406 25,606 9% 8% K ,347 3,689 93,658 4% 28% disabilities as the average school district in Illinois. Of the 858 public school districts analyzed in this study, only twenty-six had student bodies with higher per-pupil need for specialized educational programming than CPS, and no district was obligated to provide this programming at such scale. Illinois as a whole, of course, struggles to provide high-performing public school options for lowincome communities. That access to high-performing schools would be diminished in Chicago is unsurprising in the context of an inequitable statewide landscape. And yet, despite the structural inequities with which Chicago Public Schools must contend and the lack of high-performing K-12 options from which parents have to choose, there are meaningful signs of progress in Chicago s public schools with regard to academic performance. For example, based on the results of the National Assessment of Educational Progress (NAEP), steep and continuing growth in Chicago across and within student subgroups over the last fifteen years has buoyed otherwise stagnant or declining academic performance elsewhere in Illinois. 41 Moreover, graduation rates across the city increased by over twenty percentage points between 1998 and 2014, and students showed higher levels of academic achievement even amidst increases in the rigor of coursework. 42 So while there remains substantial work to do to increase access to performing schools for Chicago students, there are important gains even in the face of major systemic obstacles. High-Need Areas. Just over a quarter of the need for quality K-12 public school seats in Chicago was concentrated in the seven high-need areas that this study identifies. These study areas are the sections of the city in which the largest numbers of children did not have access to a school with a rating of A or B in The following twenty community areas are partially or fully contained within the high-need areas: Belmont Cragin Chicago Lawn Hermosa North Lawndale West Elsdon Bridgeport East Side Lower West Side South Chicago West Lawn Archer Heights Brighton Park Fuller Park McKinley Park South Deering Avalon Park Calumet Heights Gage Park New City South Lawndale Geographically, almost all of the territory of the high-need areas is southwest of Interstate 90. Five of these seven study areas are located in a cluster roughly bound by the Interstate 290 to the north, Central Park Avenue to the west, 75th Street to the south, and Interstate to the East. 41 Paul Zavitkovsky and Steven Tozer, Upstate/Downstate: Changing Patterns of Achievement, Demographics and School Effectiveness in Illinois Public Schools, University of Illinois at Chicago Center for Urban Education Leadership, Spring 2017, Elaine M. Allensworth, Kaleen Healey, Julia A. Gwynne, and René Crespin, High School Graduation Rates through Two Decades of District Change: The Influence of Policies, Data Records, and Demographic Shifts, University of Chicago Consotrium on School Research, June 2016.

75 Map 8:, City of Chicago 68
76 There were no A- or B-rated schools located within the boundaries of Chicago s high-need areas in An estimated 3,689 seats were available to students residing in these communities from A- or B-rated options in other community areas, such as magnet schools that accepted students from across the city. As the previous section shows, however, there was substantial need for high-performing public schools in every community area in Chicago. Addressing the highneed areas will have a disproportionate impact on the service gap in Chicago s public schools, but it will not address the majority of the need in the city. Funding and Return on Investment in Chicago Public Schools. The level of need of the student body in Chicago is crucial to understanding performance, funding, and return on investment trends in CPS. Low-income students, English language learners, and individuals with disabilities need educational resources that are tailored to their learning styles. Chicago has some of the highest proportions of students with intensive educational needs in Illinois and is located in the most costly labor market in the state. For these reasons, CPS requires more perpupil funding than almost any district in Illinois to meet a baseline of academic achievement. CPS was underfunded in When funding levels are normalized to reflect the high cost of living in the Chicago metropolitan area and the additional costs necessary to provide a quality education to the subgroups listed above, the district received seventy-one percent of the Foundation Level (FL) that the Education Funding Advisory Board (EFAB) recommended for Yet despite this budgetary shortfall, CPS had medium return on investment (ROI). Relative to its peers, CPS s day-today spending had decent impact on the ability of students to read, write, and do math at grade level. Furthermore, CPS spent a quarter on overhead for every dollar it spent in classrooms in Fewer than three dozen of the 855 districts analyzed for this study had a better overhead-to-instruction ratio. These spending levels are largely the result of the district s efforts to cut over seven hundred million dollars in spending, mostly but not entirely on administration and other noninstructional goods and services. 43 The district has made major progress in creating administrative efficiencies in order to widen the portion of the budget that can reach students and teachers more directly. All in all, however, local resources and budgetary streamlining alone appear insufficient to allow CPS to address funding inadequacy and increase spending on activities that will prepare more students to achieve on grade level in reading and math. Property tax increases in the city are capped based on the rate of inflation.43 And, while property in Chicago is more valuable than in most high-poverty districts in Illinois, property wealth is still a quarter lower than the state average. Any additional revenue that can be raised locally for public schools in Chicago will probably not close the bulk of the district s funding gap. In the absence of sufficient compensatory income from higher levels of government, it will be difficult for CPS to shore up its revenue streams. Alongside targeted and comprehensive efforts to increase the effectiveness of instructional programming, CPS should be considered a candidate for additional financial resources. More state funding alone for CPS will not solve the district s financial problems, but the situation seems unlikely to improve without it. 43 Josh McGee, Chicago Crowd-Out: How Rising Pension Costs Harm Current Teachers and Students, Manhattan Institute Issue Brief, May
77 $8,672 Chart 29: Funding and Wealth in Chicago Public Schools 4.3% $211,868 $6, % $161,232 CPS State Recommendation CPS State Average State & Local Funding School Tax Rate Property Wealth Per Pupil CPS State Average 70
78 APPENDIX A: SUPPLY AND DEMAND BY GRADE LEVEL AND STUDY AREA Grades K-12 (Overall) Grades K-5 Rank Study Area Demand Supply Level Demand Supply High-Need Areas 1 Sangamon County 28, ,036 3% 13, ,695 2 Chicago: Chicago Lawn, West Lawn 23, ,416 4% 11, ,326 3 Chicago: Archer Heights, Brighton Park 21, ,752 4% 9, ,347 4 Champaign County 21, ,309 1% 9, ,202 5 Elgin 19, ,000 5% 9, ,737 6 Chicago: Lawndale 19, ,891 4% 9, ,777 7 McLean County 22,403 3,974 18,429 18% 10,112 3,395 6,717 8 Burlington, Pingree Grove, Carpentersville 17, ,228 4% 8, ,303 9 Rock Island County 17, ,787 0% 7, , Cicero 17, ,121 0% 8, , Rockford, Cherry Valley 17, ,411 4% 8, , Kankakee County 16, ,644 0% 7, , Chicago: Belmont Cragin, Hermosa 16, ,837 4% 8, , LaSalle County 16, ,154 1% 6, , South Elgin, Bartlett, Streamwood 16, ,777 5% 7, , Round Lake Beach, Volo 16, ,750 2% 6, , Macon County 14, ,686 0% 6, , Crystal Lawns 16, ,216 6% 6, , Richton Park, University Park, Crete, Willowbrook 13, ,383 4% 5, , DeKalb County 14, ,205 0% 6, , Chicago: New City, Fuller Park 13, ,295 4% 7, , Vermilion County 12, ,236 0% 5, , Chicago: Lower West Side 13, ,872 5% 5, , Peoria 13, ,743 7% 6, , Boone County 9, ,864 0% 4, , Cahokia, Millstadt, East Carondelet 12, ,736 0% 4, , Chicago: South Chicago, Calumet Heights, East Side 13, ,669 4% 6, , Williamson County 9, ,602 0% 4, , Rockdale, Elwood, Ingalls Park 12, ,414 1% 5, , Adams County 8, ,429 0% 3, , Lakemoor, Johnsburg, Holiday Hills 12, ,247 2% 5, ,894 71
79 . Grades 6-8 Grades 9-12 Level Percent of K-12 Demand Supply Level Percent of K-12 Demand Supply Level 3% 45% 6, ,538 5% 23% 8, ,803 0% 31% 1% 51% 5, ,238 3% 23% 6, ,852 9% 26% 1% 45% 4, ,522 3% 22% 7, ,882 7% 33% 1% 43% 5, ,333 1% 25% 6, ,774 0% 32% 7% 46% 4, ,313 5% 23% 6, ,950 1% 31% 1% 52% 4, ,619 3% 24% 4, ,495 10% 24% 34% 36% 5, ,363 5% 29% 6, ,350 5% 34% 4% 48% 4, ,782 9% 22% 5, ,144 0% 30% 0% 40% 4, ,331 0% 24% 6, ,386 0% 36% 0% 50% 4, ,240 0% 25% 4, ,364 0% 25% 4% 47% 4, ,766 8% 23% 4, ,899 0% 30% 0% 43% 4, ,228 0% 25% 5, ,231 0% 31% 2% 52% 3, ,456 3% 22% 4, ,090 11% 26% 1% 43% 3, ,951 1% 24% 5, ,313 0% 33% 6% 45% 3, ,610 7% 23% 5, ,100 0% 32% 2% 43% 3, ,362 3% 21% 5, ,611 0% 36% 0% 46% 3, ,655 0% 25% 4, ,297 0% 29% 7% 41% 4, ,692 11% 24% 5, ,327 0% 35% 10% 35% 3, ,261 0% 24% 5, ,425 0% 41% 0% 44% 3, ,525 0% 25% 4, ,501 0% 32% 1% 54% 3, ,306 3% 25% 3, ,821 12% 21% 0% 46% 2, ,968 0% 24% 3, ,598 0% 29% 4% 45% 2, ,915 3% 23% 4, ,195 8% 33% 5% 50% 3, ,822 10% 22% 3, ,493 7% 27% 0% 43% 2, ,441 0% 25% 3, ,193 0% 32% 0% 39% 3, ,254 0% 26% 4, ,546 0% 36% 1% 51% 3, ,209 3% 25% 3, ,951 12% 23% 0% 45% 2, ,304 0% 24% 2, ,952 0% 31% 3% 46% 2, ,839 0% 23% 3, ,843 0% 31% 0% 44% 2, ,030 0% 24% 2, ,679 0% 32% 5% 40% 3, ,091 0% 25% 4, ,262 0% 35% Percent of K-12 72
80 Grades K-12 (Overall) Grades K-5 Rank Study Area Demand Supply Level Demand Supply High-Need Areas Mid-High-Need Areas 32 Oswego, Boulder Hill 15,157 2,989 12,168 20% 7,242 2,981 4, Grundy County 8, ,032 2% 3, , Chicago: Lincoln Park, Lakeview 15,042 3,070 11,972 20% 7,056 1,908 5, Ogle County 8, ,543 8% 3, , Woodridge, Lisle, Downers Grove 14,430 2,550 11,880 18% 5,578 1,319 4, Lake Villa, Fox Lake Hills, Channel Lake 11, ,795 0% 4, , Knox County 7, ,231 0% 3, , Aurora (Central) 12, ,764 3% 6, , Waukegan 11, ,680 1% 5, , Henry County 7, ,904 6% 3, , North Aurora 11, ,515 0% 5, , Whiteside County 6, ,534 0% 2, , Granite City, Hartford, Wood River 11, ,467 0% 4, , Chicago: Logan Square 11, ,443 4% 6, , Stephenson County 6, ,250 0% 2, , Chicago: Avondale, North Center, Irving Park 13,097 1,938 11,159 15% 6,777 1,148 5, Macoupin County 6, ,130 0% 2, , Homewood, Glenwood, Lansing 11, ,074 0% 3, , Highland, Collinsville, Alhambra, Maryville 11, ,966 1% 4, , Woodford County 6, ,037 4% 2, , Hanover Park, Carol Stream 12,893 2,020 10,873 16% 5,620 1,628 3, Barrington, Lake Barrington 14,865 4,064 10,801 27% 5,882 2,920 2, Jackson County 5, ,916 0% 2, , Roscoe, Machesney Park, Loves Park 11, ,778 5% 4, , Marion County 5, ,865 0% 2, , Summit, Burbank, Bridgeview 10, ,639 2% 5, , Hoffman Estates 16,003 5,374 10,630 34% 7,362 2,789 4, Jefferson County 5, ,607 0% 2, , Lombard, Villa Park 12,088 1,573 10,516 13% 5,120 1,031 4, Franklin County 5, ,397 0% 2, , Dixmoor, Harvey, Blue Island 10, ,416 0% 5, , Palatine 13,232 2,908 10,324 22% 5,725 1,073 4,652 73
81 . Grades 6-8 Grades 9-12 Level Percent of K-12 Demand Supply Level Percent of K-12 Demand 41% 35% 3, ,646 0% 30% 4, ,261 0% 35% 3% 41% 2, ,963 3% 24% 2, ,763 0% 34% 27% 43% 2, ,895 31% 16% 5, ,928 6% 41% 19% 37% 2, ,007 0% 27% 2, ,765 0% 37% 24% 36% 3, ,954 14% 25% 5, ,667 14% 39% 0% 38% 3, ,521 0% 30% 3, ,812 0% 32% 0% 45% 1, ,692 0% 23% 2, ,280 0% 32% 3% 51% 2, ,590 7% 22% 3, ,200 0% 27% 1% 46% 2, ,508 1% 21% 3, ,791 1% 32% 13% 42% 1, ,641 0% 24% 2, ,371 0% 34% 0% 46% 2, ,751 0% 24% 3, ,500 0% 30% 1% 33% 1, ,723 0% 26% 2, ,672 0% 41% 0% 43% 2, ,854 0% 25% 3, ,644 0% 32% 2% 52% 2, ,814 3% 25% 2, ,675 10% 23% 0% 43% 1, ,456 0% 23% 2, ,124 0% 34% 17% 50% 2, ,500 16% 22% 3, ,030 10% 27% 0% 39% 1, ,620 0% 26% 2, ,147 0% 35% 0% 36% 2, ,702 0% 24% 4, ,427 0% 40% 1% 41% 2, ,640 1% 24% 3, ,784 0% 35% 9% 40% 1, ,577 0% 26% 2, ,067 0% 34% 29% 37% 2, ,614 10% 24% 4, ,268 3% 39% 50% 27% 3,744 1,060 2,684 28% 25% 5, ,155 2% 48% 0% 42% 1, ,416 0% 24% 1, ,986 0% 34% 11% 37% 3, ,915 4% 27% 3, ,848 0% 36% 0% 43% 1, ,390 0% 24% 1, ,937 0% 33% 3% 46% 2, ,440 0% 23% 3, ,276 0% 31% 38% 43% 3,618 1,465 2,153 40% 20% 5,024 1,119 3,904 22% 37% 0% 47% 1, ,294 0% 23% 1, ,702 0% 30% 20% 39% 2, ,336 13% 22% 4, ,091 4% 39% 0% 42% 1, ,312 0% 24% 1, ,842 0% 34% 0% 48% 2, ,483 0% 24% 2, ,900 0% 28% 19% 45% 2, ,196 27% 21% 4,511 1,035 3,476 23% 34% Supply Level Percent of K-12 74
82 Grades K-12 (Overall) Grades K-5 Rank Study Area Demand Supply Level Demand Supply Mid-High-Need Areas 64 Livingston County 5, ,174 1% 2, , Durand, Pecatonica, Winnebago 10, ,299 5% 4, , Gurnee 10, ,137 1% 3, , Fulton County 5, ,118 0% 2, , Bolingbrook 10, ,071 4% 4, , Bureau County 4, ,718 0% 1, , Lebanon, Mascoutah, Freeburg, New Athens 10, ,979 0% 4, , Wheaton, Warrenville 12,913 3,003 9,909 23% 5,572 2,704 2, Effingham County 4, ,409 0% 1, , Frankfort Square, Frankfort 10, ,847 8% 3, , Christian County 4, ,323 0% 1, , Chicago: Lincoln Square, Albany Park 10, ,826 4% 5, , Berwyn, Stickney 9, ,819 0% 5, , Monroe County 4, ,247 0% 1, , Chicago: West Town, Near West Side 10, ,794 4% 5, , Chillicothe, Princeville, Dunlap, Bartonville 13,041 3,293 9,748 25% 6,187 1,333 4, Morgan County 4, ,204 0% 1, , Chicago: Roseland, Pullman, Riverdale 10, ,694 5% 4, , Lee County 4, ,192 0% 1, , Algonquin 10, ,637 8% 4, , Plainfield 11,185 1,613 9,573 14% 5,011 1,036 3, Montgomery County 4, ,014 0% 1, , Chicago: Auburn Gresham 9, ,338 5% 4, , Iroquois County 4, ,976 3% 1, , Evanston 9, ,122 8% 5, , Wood Dale, Bensenville 10,452 1,442 9,010 14% 4, , Clinton County 4, ,934 9% 2, , Crystal Lake, Lakewood 10,479 1,473 9,006 14% 4,232 1,464 2, East Peoria, Pekin 9, ,002 2% 3, , Randolph County 3, ,923 0% 1, , South Holland, Calumet City 8, ,975 0% 3, ,622 75
83 . Grades 6-8 Grades 9-12 Level Percent of K-12 Demand Supply Level Percent of K-12 Demand 3% 41% 1, ,279 0% 25% 1, ,782 0% 34% 5% 41% 2, ,973 13% 19% 4, ,133 0% 40% 1% 39% 2, ,469 1% 24% 3, ,745 0% 37% 0% 45% 1, ,218 0% 24% 1, ,576 0% 31% 3% 46% 2, ,389 5% 24% 3, ,099 6% 31% 0% 41% 1, ,258 0% 27% 1, ,540 0% 33% 1% 44% 2, ,338 0% 23% 3, ,280 0% 33% 49% 29% 3, ,774 8% 28% 4, ,268 1% 43% 0% 39% 1, ,055 0% 24% 1, ,651 0% 37% 21% 30% 2, ,679 0% 27% 4, ,224 0% 43% 0% 36% 1, ,166 0% 27% 1, ,612 0% 37% 2% 51% 2, ,175 3% 22% 2, ,625 9% 27% 0% 51% 2, ,387 0% 24% 2, ,430 0% 25% 0% 35% 1, ,172 0% 28% 1, ,589 0% 37% 2% 51% 2, ,341 3% 24% 2, ,506 10% 26% 22% 50% 2, ,046 29% 21% 3,975 1,127 2,848 28% 29% 0% 46% 1, ,023 0% 24% 1, ,250 0% 30% 2% 48% 2, ,357 3% 24% 3, ,656 12% 27% 0% 40% 1, ,068 0% 25% 1, ,454 0% 35% 11% 38% 2, ,260 14% 23% 3, ,691 0% 38% 21% 42% 2, ,523 12% 26% 3, ,075 7% 32% 0% 43% % 24% 1, ,320 0% 33% 2% 50% 2, ,426 3% 26% 2, ,276 13% 24% 7% 37% 1, ,065 0% 27% 1, ,434 0% 36% 16% 47% 2, ,101 0% 23% 2, ,759 0% 30% 18% 38% 2, ,098 10% 23% 3, ,451 12% 38% 14% 44% 1, % 23% 1, ,322 0% 34% 35% 31% 1, ,875 0% 21% 4, ,364 0% 48% 3% 39% 2, ,238 0% 25% 3, ,250 2% 36% 0% 44% % 23% 1, ,297 0% 33% 0% 40% 2, ,244 0% 25% 3, ,109 0% 35% Supply Level Percent of K-12 76
84 Grades K-12 (Overall) Grades K-5 Rank Study Area Demand Supply Level Demand Supply Moderate-Need Areas 95 Coles County 3, ,899 0% 1, , Woodstock, Hebron, Richmond, Spring, Grove 8, ,931 1% 3, , Evergreen Park, Oak Lawn 8, ,854 0% 3, , Saline County 3, ,477 0% 1, , Aurora/Naperville 21,991 13,218 8,772 60% 9,399 6,354 3, McDonough County 3, ,354 0% 1, , Chicago: Dunning 9, ,738 5% 4, , Chicago: Humboldt Park 9, ,645 5% 4, , Logan County 3, ,084 1% 1, , Chicago: Loop, Near Southside, Armour Square 9,613 1,016 8,597 11% 5, , North Lake, Melrose Park 8, ,583 2% 4, , Shelby County 2, ,907 0% 1, , Joliet 8, ,553 2% 4, , Fayette County 2, ,902 0% 1, , Yorkville, Plano, Millbrook, Newark 8, ,550 2% 3, , Shorewood 8, ,476 1% 3, , Jersey County 2, ,857 0% 1, , Fairview heights, O'Fallon 8, ,363 4% 3, , Jo Daviess County 2, ,711 7% 1, , Chicago: Portage Park 8, ,312 5% 4, , Lincolnwood 8, ,301 7% 3, , Perry County 2, ,662 0% 1, , Alsip, Crestwood, Oak Forest 8, ,271 5% 3, , Glendale Heights 10,380 2,112 8,268 20% 4, , Wayne County 2, ,546 0% 1, , Hickory Hills, Palos Park, Palos Heights 9,911 1,676 8,234 17% 4,355 1,074 3, Union County 2, ,427 0% 1, , Chicago: Garfield Ridge, Clearing 8, ,167 4% 3, , Old Mill Creek, Zion, Winthrop Harbor 8, ,136 0% 3, , Mercer County 2, ,383 0% 1, , Ford Heights, Chicago Heights 8, ,127 0% 3, ,394 77
85 . Grades 6-8 Grades 9-12 Level Percent of K-12 Demand Supply Level Percent of K-12 Demand 0% 31% % 19% 1, ,949 0% 50% 1% 41% 2, ,237 0% 25% 3, ,044 0% 34% 0% 42% 1, ,712 0% 19% 3, ,450 0% 39% 0% 40% % 26% 1, ,185 0% 34% 68% 35% 5,501 2,378 3,123 43% 36% 7,091 4,487 2,604 63% 30% 0% 46% % 24% % 29% 2% 53% 2, ,200 3% 25% 2, ,886 13% 22% 2% 56% 2, ,282 3% 26% 1, ,507 16% 17% 3% 41% % 22% 1, ,149 0% 37% 14% 55% 2, ,997 2% 23% 2, ,896 10% 22% 0% 50% 2, ,034 0% 24% 2, ,220 9% 26% 0% 41% % 24% % 34% 4% 52% 1, ,921 2% 22% 2, ,190 0% 26% 0% 41% % 25% % 33% 4% 44% 2, ,101 2% 25% 2, ,692 0% 31% 2% 42% 2, ,196 2% 26% 2, ,725 0% 32% 0% 36% % 24% 1, ,129 0% 40% 8% 41% 1, ,950 0% 23% 2, ,995 0% 36% 0% 47% % 25% % 28% 2% 52% 1, ,894 3% 23% 2, ,078 12% 25% 14% 33% 2, ,905 10% 23% 3, ,673 0% 44% 0% 45% % 23% % 31% 14% 34% 1, ,926 0% 23% 3, ,542 0% 43% 16% 47% 2,426 1,396 1,030 58% 12% 3, ,373 0% 41% 0% 48% % 23% % 30% 25% 40% 2, ,750 25% 21% 3, ,202 0% 39% 0% 43% % 27% % 30% 1% 47% 2, ,962 3% 24% 2, ,359 8% 29% 0% 39% 1, ,903 0% 23% 3, ,041 0% 37% 0% 45% % 25% % 31% 0% 42% 1, ,883 0% 23% 2, ,850 0% 35% Supply Level Percent of K-12 78
86 Grades K-12 (Overall) Grades K-5 Rank Study Area Demand Supply Level Demand Supply Low-Mid-Need Areas Moderate-Need Areas 126 Hancock County 2, ,364 0% 1, , Tinley Park 8, ,982 0% 2, , Waucanda, Mundelein, Island Lake 8, ,752 7% 3, , Bond County 2, ,348 0% 1, , Orland Park 8, ,631 7% 2, , Chicago: Kenwood, Grand Boulevard, Hyde Park 7, ,587 4% 3, , Douglas County 2, ,337 0% 1, , Dolton, Riverdale 7, ,425 1% 3, , Crawford County 2, ,300 0% Harvard, Marengo, Huntley 8, ,339 10% 3, , Franklin Park 7, ,289 0% 3, , Warren County 2, ,297 0% Chicago: Chatham, Greater Grand Crossing 7, ,280 5% 3, , Massac County 2, ,259 8% 1, , East St. Louis, Brooklyn, Fairmont City 7, ,125 0% 3, , Chicago: Beverly, Morgan Park, Washington Heights 7, ,039 5% 3, , Cass County 2, ,235 0% 1, , Chicago: Edgewater, Uptown 7, ,979 4% 3, , Crest Hill, Fairmont 6, ,869 0% 3, , Richland County 2, ,225 0% 1, , Chicago: Forest Glen, North Park 8,650 1,816 6,833 21% 4,085 1,060 3, Edgar County 2, ,202 0% Chicago: West Englewood 7, ,828 5% 3, , Romeoville 6, ,786 2% 3, , De Witt County 2, ,126 0% Chicago: Woodlawn, Washington Park 7, ,784 4% 3, , Clark County 2, ,089 0% Morton, Washington, Hopedale, Heritage Lake 9,895 3,168 6,727 32% 4,616 2,070 2, Chicago: Jefferson Park 6, ,624 5% 3, , Mason County 2, ,083 0% Chicago: Garfield Park 6, ,553 5% 3, ,449 79
87 . Grades 6-8 Grades 9-12 Level Percent of K-12 Demand Supply Level Percent of K-12 Demand 0% 45% % 22% % 33% 1% 35% 1, ,838 0% 23% 3, ,376 0% 42% 10% 38% 2, ,190 0% 28% 2, ,580 8% 33% 0% 47% % 22% % 31% 18% 29% 2, ,970 3% 26% 3, ,465 0% 45% 2% 44% 1, ,563 4% 21% 2, ,718 8% 36% 0% 44% % 22% % 34% 0% 44% 1, ,896 1% 26% 2, ,264 2% 30% 0% 36% % 26% % 38% 13% 36% 2, ,765 19% 24% 2, ,910 0% 40% 0% 43% 1, ,588 0% 22% 2, ,587 0% 35% 0% 38% % 25% % 37% 2% 51% 1, ,832 3% 25% 2, ,738 13% 24% 14% 46% % 24% % 31% 0% 46% 1, ,712 0% 24% 2, ,117 0% 30% 2% 46% 1, ,745 3% 25% 2, ,065 10% 29% 0% 46% % 24% % 30% 2% 53% 1, ,671 3% 24% 1, ,583 11% 23% 0% 44% 1, ,668 1% 24% 2, ,152 0% 31% 0% 45% % 23% % 32% 26% 44% 2, ,606 24% 23% 2, ,203 11% 32% 0% 32% % 29% % 38% 2% 49% 1, ,650 3% 24% 2, ,820 11% 27% 2% 44% 1, ,602 4% 24% 2, ,188 0% 32% 1% 37% % 29% % 34% 2% 48% 1, ,567 3% 23% 2, ,931 10% 28% 0% 37% % 28% % 36% 45% 38% 2, ,095 8% 31% 3, ,087 30% 31% 2% 49% 1, ,563 4% 24% 2, ,809 10% 27% 0% 43% % 23% % 34% 1% 53% 1, ,666 3% 25% 1, ,438 13% 22% Supply Level Percent of K-12 80
88 Grades K-12 (Overall) Grades K-5 Rank Study Area Demand Supply Level Demand Supply Low-Mid-Need Areas 157 Des Plaines 6, ,499 3% 3, , Lawrence County 2, ,078 0% Lyons, Riverside, Brookfield 7, ,496 11% 3, , Piatt County 2, ,066 0% Beecher, Peotone, Manhattan, Lakewood Shores 6, ,356 0% 2, , Chicago: Englewood 6, ,351 4% 3, , Pike County 2, ,011 0% Glen Carbon, Edwardsville, Holiday Shores 6, ,321 0% 1, , Clay County 2, ,002 0% Oak Park 8,266 1,952 6,313 24% 3,867 1,951 1, Chicago: Austin 6, ,264 5% 3, , Ford County 1, ,974 0% Geneva, Batavia 10,615 4,402 6,214 41% 4,045 1,215 2, Lemont, Homer Glen 7,438 1,298 6,139 17% 2, , Carroll County 2, ,903 5% Mokena, New Lenox 6, ,132 1% 2, , Greene County 1, ,867 0% Rosemont, Park Ridge, O'Hare 6, ,093 1% 1, , Addison 6, ,046 1% 2, , White County 1, ,815 0% Wheeling 7,401 1,387 6,014 19% 3, , Johnson County 1, ,672 0% West Chicago 6,971 1,063 5,908 15% 3, , Chicago: Ashburn 6, ,904 5% 3, , Moultrie County 1, ,625 0% Naperville 22,004 16,214 5,791 74% 9,208 6,021 3, St. Charles, Campton Hills 10,296 4,543 5,753 44% 3,820 2,627 1, Marshall County 1, ,584 0% Markham, Hazel Crest, Country Club Hills 5, ,581 0% 2, , Cumberland County 1, ,504 0% Bloomingdale 5, ,553 6% 2, , Chicago: West Ridge 5, ,539 5% 2, ,774 81
89 . Grades 6-8 Grades 9-12 Level Percent of K-12 Demand Supply Level Percent of K-12 Demand 1% 46% 1, ,456 0% 22% 2, ,062 6% 32% 0% 47% % 23% % 29% 21% 41% 1, ,649 7% 25% 2, ,191 1% 34% 0% 37% % 26% % 36% 0% 37% 1, ,695 0% 27% 2, ,329 0% 37% 1% 52% 1, ,642 3% 26% 1, ,388 12% 22% 0% 40% % 28% % 32% 0% 30% 1, ,862 0% 29% 2, ,582 0% 41% 0% 48% % 23% % 29% 50% 30% 1, ,839 0% 29% 2, ,558 0% 41% 2% 55% 1, ,593 3% 25% 1, ,212 16% 19% 0% 37% % 28% % 35% 30% 46% 2,784 1,328 1,456 48% 23% 3,787 1,859 1,928 49% 31% 0% 45% 1, ,889 0% 31% 2,773 1,298 1,474 47% 24% 12% 40% % 25% % 35% 2% 39% 1, ,587 0% 26% 2, ,155 0% 35% 0% 45% % 22% % 33% 0% 30% % 16% 3, ,259 2% 53% 1% 45% 1, ,389 1% 23% 1, ,954 0% 32% 0% 42% % 25% % 33% 16% 47% 1, ,646 0% 27% 2, ,516 36% 25% 0% 46% % 23% % 31% 18% 48% 1, ,249 23% 21% 1, ,820 4% 31% 2% 51% 1, ,641 3% 28% 1, ,263 14% 21% 0% 56% % 12% % 32% 65% 55% 5,302 3,561 1,741 67% 30% 7,495 6, % 15% 69% 21% 2,654 1, % 13% 3, ,820 0% 66% 0% 47% % 24% % 29% 0% 45% % 16% 2, ,189 0% 39% 0% 50% % 12% % 38% 12% 32% 1, ,342 5% 24% 2, ,446 2% 44% 2% 50% 1, ,313 4% 24% 1, ,452 12% 26% Supply Level Percent of K-12 82
90 Grades K-12 (Overall) Grades K-5 Rank Study Area Demand Supply Level Demand Supply Low-Need Areas 189 Washington County 1, ,486 0% Elmwood Park, River Grove 5, ,509 2% 2, , Menard County 1, ,442 0% Godfrey, Alton 5, ,272 0% 1, , Mount Prospect 7,612 2,355 5,257 31% 3,117 1,368 1, Wabash County 1, ,346 0% Chicago: South Shore 5, ,242 5% 2, , Niles 5, ,200 9% 2, , Hamilton County 1, ,312 0% Rolling Meadows 8,069 3,105 4,964 38% 3,788 1,460 2, Jasper County 1, ,136 0% Chicago: Norwood Park, Edison Park 6,040 1,168 4,872 19% 3, , Prestbury, Kaneville, Elburn, Virgil 5, ,647 11% 2, , Henderson County 1, ,011 0% Forest Park, Maywood, River Forest 6,167 1,550 4,617 25% 2, , Edwards County % Hodgkins, La Grange, Western Springs 8,213 4,041 4,172 49% 3,435 2, Forest Lake, Kideer, Hawthorn Woods 8,031 3,865 4,166 48% 3,085 1,704 1, Alexander County % Hillside 4, ,047 5% 2, , Burr Ridge, Willowbrook, Darien 6,835 2,862 3,973 42% 2,435 1,079 1, Schuyler County % Chicago: Rogers Park 4, ,874 6% 2, , Pulaski County % Elmhurst 7,834 4,218 3,615 54% 3,406 2, Westmont 8,377 5,052 3,325 60% 3,192 2, Scott County % Arlington Heights 7,554 4,235 3,319 56% 3,208 2, Gallatin County % Westchester 4, ,293 20% 1, , North Chicago, Lake Bluff 4,923 1,659 3,264 34% 2, , Brown County %
91 . Grades 6-8 Grades 9-12 Level Percent of K-12 Demand Supply Level Percent of K-12 Demand 0% 37% % 18% % 44% 1% 44% 1, ,276 1% 23% 1, ,831 4% 33% 0% 36% % 27% % 38% 0% 36% 1, ,375 0% 26% 1, ,995 0% 38% 44% 33% 1, ,814 3% 35% 2, ,694 36% 32% 0% 32% % 28% % 40% 2% 46% 1, ,141 3% 22% 1, ,684 9% 32% 14% 38% 1, ,099 15% 21% 2, ,129 0% 41% 0% 46% % 25% % 29% 39% 47% 1, ,029 44% 21% 2, ,607 34% 32% 0% 47% % 11% % 42% 21% 49% 1, % 20% 1, ,499 11% 31% 10% 46% 1, ,032 19% 22% 1, ,478 6% 32% 0% 41% % 23% % 35% 31% 42% 1, % 21% 1, ,701 12% 37% 0% 47% % 24% % 29% 76% 20% 1,925 1, % 12% 2, ,845 0% 68% 55% 33% 1, ,208 39% 29% 2,971 1,393 1,577 47% 38% 0% 57% % 15% % 28% 0% 50% 1, ,027 0% 25% 1, % 24% 44% 34% 1, ,100 35% 28% 2,698 1,182 1,517 44% 38% 0% 35% % 28% % 37% 2% 56% % 23% % 22% 0% 49% % 23% % 28% 86% 13% 1,863 1, % 16% 2, ,563 0% 71% 72% 27% 2,128 1, % 24% 3,057 1,427 1,630 47% 49% 0% 45% % 23% % 32% 69% 30% 1,735 1, % 19% 2, ,705 35% 51% 0% 51% % 22% % 27% 23% 40% 1, % 25% 1, ,126 10% 34% 28% 54% 1, % 22% 1, % 23% 0% 48% % 22% % 31% Supply Level Percent of K-12 84
92 Grades K-12 (Overall) Grades K-5 Rank Study Area Demand Supply Level Demand Supply Low-Need Areas 221 Libertyville 11,791 9,254 2,537 78% 4,700 3,540 1, Chicago: Mount Greenwood 3,427 1,028 2,399 30% 1, Calhoun County % Chicago: Hegewisch, South Deering 2, ,164 3% Putnam County % Lake Forest, Highland Park 9,130 7,130 2,000 78% 3,384 2,204 1, Glenview 7,498 5,699 1,799 76% 2,448 2, Hardin County % Buffalo Grove, Riverwoods 10,815 9,394 1,421 87% 4,525 3, Stark County % Northbrook 6,255 5, % 2,445 1, Wilmette 5,600 5, % 2,612 2, Pope County % Glencoe, Winnetka 4,984 5, % 2,083 2,
93 . Grades 6-8 Grades 9-12 Level Percent of K-12 Demand Supply Level Percent of K-12 Demand 75% 46% 2,967 1,820 1,147 61% 45% 4,124 3, % 9% 39% 41% % 20% 1, % 38% 0% 41% % 20% % 39% 1% 44% % 23% % 33% 0% 31% % 33% % 36% 65% 59% 2,344 1, % 43% 3,402 3, % N/A 83% 23% 2,181 1,020 1,162 47% 65% 2,868 2, % 12% 0% 47% % 24% % 29% 84% 51% 2,628 2, % 31% 3,663 3, % 18% 0% 9% % 34% % 57% 79% 60% 1,578 1, % 33% 2,232 2, % 8% 103% N/A 1,482 1, % 100% 1,507 1, % N/A 0% 45% % 25% % 30% 101% N/A 1,404 1, % N/A 1,496 1, % N/A Supply Level Percent of K-12 86

94 APPENDIX B: SCHOOL DISTRICT EXPENDITURE CATEGORIZATION SCHEME 87
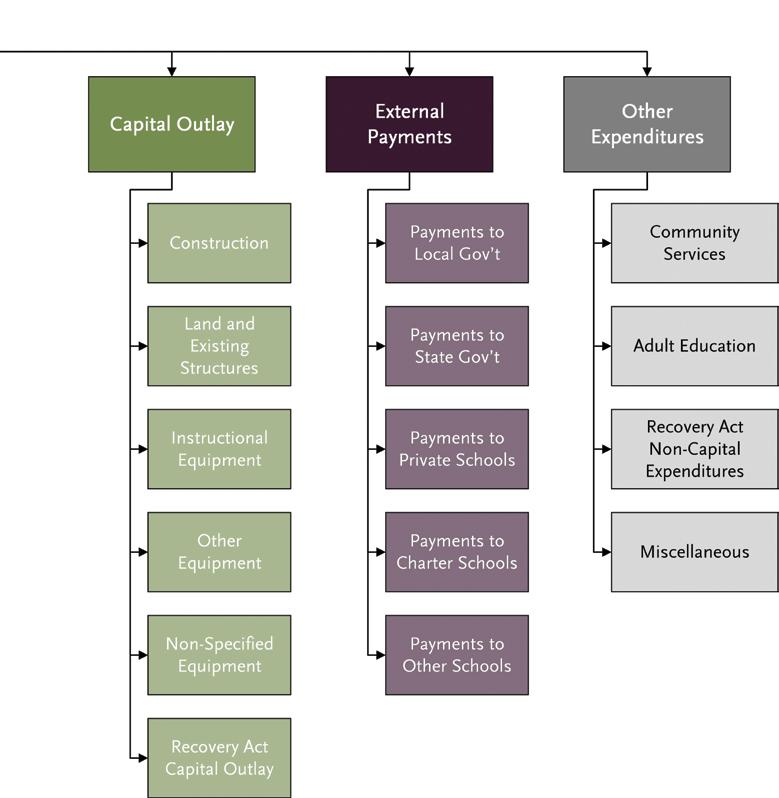
95 88
Price Sensitivity Analysis
 Executive Summary The present study set out to determine whether relationships existed between the change in tuition rates, tuition and fees rates, and tuition, fees, and room and board rates at Illinois
Financing Education In Minnesota
 Financing Education In Minnesota 2016-2017 Created with Tagul.com A Publication of the Minnesota House of Representatives Fiscal Analysis Department August 2016 Financing Education in Minnesota 2016-17
Higher Education. Pennsylvania State System of Higher Education. November 3, 2017
 November 3, 2017 Higher Education Pennsylvania s diverse higher education sector - consisting of many different kinds of public and private colleges and universities - helps students gain the knowledge
Governors and State Legislatures Plan to Reauthorize the Elementary and Secondary Education Act
 Governors and State Legislatures Plan to Reauthorize the Elementary and Secondary Education Act Summary In today s competitive global economy, our education system must prepare every student to be successful
CHAPTER 4: REIMBURSEMENT STRATEGIES 24
 CHAPTER 4: REIMBURSEMENT STRATEGIES 24 INTRODUCTION Once state level policymakers have decided to implement and pay for CSR, one issue they face is simply how to calculate the reimbursements to districts
Rural Education in Oregon
 Rural Education in Oregon Overcoming the Challenges of Income and Distance ECONorthwest )'3231-'7 *-2%2') 40%22-2+ Cover photos courtesy of users Lars Plougmann, San José Library, Jared and Corin, U.S.Department
ILLINOIS DISTRICT REPORT CARD
 -6-525-2- HAZEL CREST SD 52-5 HAZEL CREST SD 52-5 HAZEL CREST, ILLINOIS and federal laws require public school districts to release report cards to the public each year. 2 7 ILLINOIS DISTRICT REPORT CARD
ILLINOIS DISTRICT REPORT CARD
 -6-525-2- Hazel Crest SD 52-5 Hazel Crest SD 52-5 Hazel Crest, ILLINOIS 2 8 ILLINOIS DISTRICT REPORT CARD and federal laws require public school districts to release report cards to the public each year.
Trends in Tuition at Idaho s Public Colleges and Universities: Critical Context for the State s Education Goals
 1 Trends in Tuition at Idaho s Public Colleges and Universities: Critical Context for the State s Education Goals June 2017 Idahoans have long valued public higher education, recognizing its importance
Like much of the country, Detroit suffered significant job losses during the Great Recession.
 36 37 POPULATION TRENDS Economy ECONOMY Like much of the country, suffered significant job losses during the Great Recession. Since bottoming out in the first quarter of 2010, however, the city has seen
Trends & Issues Report
 Trends & Issues Report prepared by David Piercy & Marilyn Clotz Key Enrollment & Demographic Trends Options Identified by the Eight Focus Groups General Themes 4J Eugene School District 4J Eugene, Oregon
The Oregon Literacy Framework of September 2009 as it Applies to grades K-3
 The Oregon Literacy Framework of September 2009 as it Applies to grades K-3 The State Board adopted the Oregon K-12 Literacy Framework (December 2009) as guidance for the State, districts, and schools
STATE CAPITAL SPENDING ON PK 12 SCHOOL FACILITIES NORTH CAROLINA
 STATE CAPITAL SPENDING ON PK 12 SCHOOL FACILITIES NORTH CAROLINA NOVEMBER 2010 Authors Mary Filardo Stephanie Cheng Marni Allen Michelle Bar Jessie Ulsoy 21st Century School Fund (21CSF) Founded in 1994,
ADDENDUM 2016 Template - Turnaround Option Plan (TOP) - Phases 1 and 2 St. Lucie Public Schools
 - Phases 1 and 2 St. Lucie Public Schools") ADDENDUM 2016 Template - Turnaround Option Plan (TOP) - Phases 1 and 2 St. Lucie Public Schools The district requests an additional year to implement the previously approved turnaround option. Evidence
ADDENDUM 2016 Template - Turnaround Option Plan (TOP) - Phases 1 and 2 St. Lucie Public Schools The district requests an additional year to implement the previously approved turnaround option. Evidence
1.0 INTRODUCTION. The purpose of the Florida school district performance review is to identify ways that a designated school district can:
 1.0 INTRODUCTION 1.1 Overview Section 11.515, Florida Statutes, was created by the 1996 Florida Legislature for the purpose of conducting performance reviews of school districts in Florida. The statute
Moving the Needle: Creating Better Career Opportunities and Workforce Readiness. Austin ISD Progress Report
 Moving the Needle: Creating Better Career Opportunities and Workforce Readiness Austin ISD Progress Report 2013 A Letter to the Community Central Texas Job Openings More than 150 people move to the Austin
Common Core Path to Achievement. A Three Year Blueprint to Success
 Common Core Path to Achievement A Three Year Blueprint to Success The Winds of Change Continue to Blow!!! By the beginning of the 2014-2015 School Year, there will be a new accountability system in place
The number of involuntary part-time workers,
 University of New Hampshire Carsey School of Public Policy CARSEY RESEARCH National Issue Brief #116 Spring 2017 Involuntary Part-Time Employment A Slow and Uneven Economic Recovery Rebecca Glauber The
STANDARDS AND RUBRICS FOR SCHOOL IMPROVEMENT 2005 REVISED EDITION
 Arizona Department of Education Tom Horne, Superintendent of Public Instruction STANDARDS AND RUBRICS FOR SCHOOL IMPROVEMENT 5 REVISED EDITION Arizona Department of Education School Effectiveness Division
Executive Summary. Laurel County School District. Dr. Doug Bennett, Superintendent 718 N Main St London, KY
 Dr. Doug Bennett, Superintendent 718 N Main St London, KY 40741-1222 Document Generated On January 13, 2014 TABLE OF CONTENTS Introduction 1 Description of the School System 2 System's Purpose 4 Notable
Trends in College Pricing
 Trends in College Pricing 2009 T R E N D S I N H I G H E R E D U C A T I O N S E R I E S T R E N D S I N H I G H E R E D U C A T I O N S E R I E S Highlights Published Tuition and Fee and Room and Board
Executive Summary. Walker County Board of Education. Dr. Jason Adkins, Superintendent 1710 Alabama Avenue Jasper, AL 35501
 Dr. Jason Adkins, Superintendent 1710 Alabama Avenue Jasper, AL 35501 Document Generated On November 3, 2016 TABLE OF CONTENTS Introduction 1 Description of the School System 2 System's Purpose 4 Notable
Testimony to the U.S. Senate Committee on Health, Education, Labor and Pensions. John White, Louisiana State Superintendent of Education
 Testimony to the U.S. Senate Committee on Health, Education, Labor and Pensions John White, Louisiana State Superintendent of Education October 3, 2017 Chairman Alexander, Senator Murray, members of the
Delaware Performance Appraisal System Building greater skills and knowledge for educators
 Delaware Performance Appraisal System Building greater skills and knowledge for educators DPAS-II Guide for Administrators (Assistant Principals) Guide for Evaluating Assistant Principals Revised August
Cooper Upper Elementary School
 LIVONIA PUBLIC SCHOOLS http://cooper.livoniapublicschools.org 215-216 Annual Education Report BOARD OF EDUCATION 215-16 Colleen Burton, President Dianne Laura, Vice President Tammy Bonifield, Secretary
UPPER ARLINGTON SCHOOLS
 UPPER ARLINGTON SCHOOLS SERVE LEAD SUCCEED CHALLENGE AND SUPPORT EVERY STUDENT, EVERY STEP OF THE WAY. 2014-2015 www.uaschools.org 1950 North Mallway Drive Upper Arlington, Ohio 43221 (614) 487-5000 Introduction
University-Based Induction in Low-Performing Schools: Outcomes for North Carolina New Teacher Support Program Participants in
 University-Based Induction in Low-Performing Schools: Outcomes for North Carolina New Teacher Support Program Participants in 2014-15 In this policy brief we assess levels of program participation and
Public School Choice DRAFT
 Public School Choice DRAFT Why Public School Choice? The educational ecosystem continues to see different types of schools and instructional choices being offered by private schools, charter organizations,
CONNECTICUT GUIDELINES FOR EDUCATOR EVALUATION. Connecticut State Department of Education
 CONNECTICUT GUIDELINES FOR EDUCATOR EVALUATION Connecticut State Department of Education October 2017 Preface Connecticut s educators are committed to ensuring that students develop the skills and acquire
Transportation Equity Analysis
 2015-16 Transportation Equity Analysis Each year the Seattle Public Schools updates the Transportation Service Standards and bus walk zone boundaries for use in the upcoming school year. For the 2014-15
The Condition of College & Career Readiness 2016
 The Condition of College and Career Readiness This report looks at the progress of the 16 ACT -tested graduating class relative to college and career readiness. This year s report shows that 64% of students
Michigan and Ohio K-12 Educational Financing Systems: Equality and Efficiency. Michael Conlin Michigan State University
 Michigan and Ohio K-12 Educational Financing Systems: Equality and Efficiency Michael Conlin Michigan State University Paul Thompson Michigan State University October 2013 Abstract This paper considers
TRENDS IN. College Pricing
 2008 TRENDS IN College Pricing T R E N D S I N H I G H E R E D U C A T I O N S E R I E S T R E N D S I N H I G H E R E D U C A T I O N S E R I E S Highlights 2 Published Tuition and Fee and Room and Board
UK Institutional Research Brief: Results of the 2012 National Survey of Student Engagement: A Comparison with Carnegie Peer Institutions
 UK Institutional Research Brief: Results of the 2012 National Survey of Student Engagement: A Comparison with Carnegie Peer Institutions November 2012 The National Survey of Student Engagement (NSSE) has
FORT HAYS STATE UNIVERSITY AT DODGE CITY
 FORT HAYS STATE UNIVERSITY AT DODGE CITY INTRODUCTION Economic prosperity for individuals and the state relies on an educated workforce. For Kansans to succeed in the workforce, they must have an education
U VA THE CHANGING FACE OF UVA STUDENTS: SSESSMENT. About The Study
 About The Study U VA SSESSMENT In 6, the University of Virginia Office of Institutional Assessment and Studies undertook a study to describe how first-year students have changed over the past four decades.
Charter School Performance Accountability
 sept 2009 Charter School Performance Accountability The National Association of Charter School Authorizers (NACSA) is the trusted resource and innovative leader working with educators and public officials
November 6, Re: Higher Education Provisions in H.R. 1, the Tax Cuts and Jobs Act. Dear Chairman Brady and Ranking Member Neal:
 The Honorable Kevin Brady The Honorable Richard Neal Chairman Ranking Member Ways and Means Committee Ways and Means Committee United States House of Representatives United States House of Representatives
Peer Influence on Academic Achievement: Mean, Variance, and Network Effects under School Choice
 Megan Andrew Cheng Wang Peer Influence on Academic Achievement: Mean, Variance, and Network Effects under School Choice Background Many states and municipalities now allow parents to choose their children
Practices Worthy of Attention Step Up to High School Chicago Public Schools Chicago, Illinois
 Step Up to High School Chicago Public Schools Chicago, Illinois Summary of the Practice. Step Up to High School is a four-week transitional summer program for incoming ninth-graders in Chicago Public Schools.
Value of Athletics in Higher Education March Prepared by Edward J. Ray, President Oregon State University
 Materials linked from the 5/12/09 OSU Faculty Senate agenda 1. Who Participates Value of Athletics in Higher Education March 2009 Prepared by Edward J. Ray, President Oregon State University Today, more
REQUEST FOR PROPOSALS SUPERINTENDENT SEARCH CONSULTANT
 REQUEST FOR PROPOSALS SUPERINTENDENT SEARCH CONSULTANT Saint Paul Public Schools Independent School District # 625 360 Colborne Street Saint Paul MN 55102-3299 RFP Superintendent Search Consultant, St.
Social Emotional Learning in High School: How Three Urban High Schools Engage, Educate, and Empower Youth
 SCOPE ~ Executive Summary Social Emotional Learning in High School: How Three Urban High Schools Engage, Educate, and Empower Youth By MarYam G. Hamedani and Linda Darling-Hammond About This Series Findings
The University of North Carolina Strategic Plan Online Survey and Public Forums Executive Summary
 The University of North Carolina Strategic Plan Online Survey and Public Forums Executive Summary The University of North Carolina General Administration January 5, 2017 Introduction The University of
Research Update. Educational Migration and Non-return in Northern Ireland May 2008
 Research Update Educational Migration and Non-return in Northern Ireland May 2008 The Equality Commission for Northern Ireland (hereafter the Commission ) in 2007 contracted the Employment Research Institute
Estimating the Cost of Meeting Student Performance Standards in the St. Louis Public Schools
 Estimating the Cost of Meeting Student Performance Standards in the St. Louis Public Schools Prepared by: William Duncombe Professor of Public Administration Education Finance and Accountability Program
EDUCATIONAL ATTAINMENT
 EDUCATIONAL ATTAINMENT By 2030, at least 60 percent of Texans ages 25 to 34 will have a postsecondary credential or degree. Target: Increase the percent of Texans ages 25 to 34 with a postsecondary credential.
Principal vacancies and appointments
 Principal vacancies and appointments 2009 10 Sally Robertson New Zealand Council for Educational Research NEW ZEALAND COUNCIL FOR EDUCATIONAL RESEARCH TE RŪNANGA O AOTEAROA MŌ TE RANGAHAU I TE MĀTAURANGA
Denver Public Schools
 2017 Candidate Surveys Denver Public Schools Denver School Board District 4: Northeast DPS District 4 - Introduction School board elections offer community members the opportunity to reflect on the state
Minnesota s Consolidated State Plan Under the Every Student Succeeds Act (ESSA)
") Minnesota s Consolidated State Plan Under the Every Student Succeeds Act (ESSA) To be submitted to the U.S. Department of Education in September 2017 IMPORTANT NOTE: This is an early draft prepared for
Minnesota s Consolidated State Plan Under the Every Student Succeeds Act (ESSA) To be submitted to the U.S. Department of Education in September 2017 IMPORTANT NOTE: This is an early draft prepared for
THE ECONOMIC IMPACT OF THE UNIVERSITY OF EXETER
 THE ECONOMIC IMPACT OF THE UNIVERSITY OF EXETER Report prepared by Viewforth Consulting Ltd www.viewforthconsulting.co.uk Table of Contents Executive Summary... 2 Background to the Study... 6 Data Sources
Suggested Citation: Institute for Research on Higher Education. (2016). College Affordability Diagnosis: Maine. Philadelphia, PA: Institute for
. College Affordability Diagnosis: Maine. Philadelphia, PA: Institute for") MAINE Suggested Citation: Institute for Research on Higher Education. (2016). College Affordability Diagnosis: Maine. Philadelphia, PA: Institute for Research on Higher Education, Graduate School of Education,
MAINE Suggested Citation: Institute for Research on Higher Education. (2016). College Affordability Diagnosis: Maine. Philadelphia, PA: Institute for Research on Higher Education, Graduate School of Education,
Iowa School District Profiles. Le Mars
 Iowa School District Profiles Overview This profile describes enrollment trends, student performance, income levels, population, and other characteristics of the public school district. The report utilizes
State Budget Update February 2016
 State Budget Update February 2016 2016-17 BUDGET TRAILER BILL SUMMARY The Budget Trailer Bill Language is the implementing statute needed to effectuate the proposals in the annual Budget Bill. The Governor
EXECUTIVE SUMMARY. Online courses for credit recovery in high schools: Effectiveness and promising practices. April 2017
 EXECUTIVE SUMMARY Online courses for credit recovery in high schools: Effectiveness and promising practices April 2017 Prepared for the Nellie Mae Education Foundation by the UMass Donahue Institute 1
For Your Future. For Our Future. ULS Strategic Framework
 For Your Future. For Our Future. ULS Strategic Framework Contents Mission Vision Development Introduction Framework For Your Future. For Our Future. Academic Success, Student Success & Educational Attainment
TACOMA HOUSING AUTHORITY
 TACOMA HOUSING AUTHORITY CHILDREN s SAVINGS ACCOUNT for the CHILDREN of NEW SALISHAN, Tacoma, WA last revised July 10, 2014 1. SUMMARY The Tacoma Housing Authority (THA) plans to offer individual development
Understanding University Funding
 Understanding University Funding Jamie Graham Registrar and AVP, Institutional Planning Brad MacIsaac AVP Planning & Analysis, and Registrar Where does Funding Come From Total Revenue Ontario $13.1B Other
Rethinking the Federal Role in Elementary and Secondary Education
 Rethinking the Federal Role in Elementary and Secondary Education By Paul T. Hill 1Are the values or principles embodied in the Elementary and Secondary Education Act of 1965 the same values or principles
In 2010, the Teach Plus-Indianapolis Teaching Policy Fellows, a cohort of early career educators teaching
 Introduction Dollars and Sense: Elevating the teaching profession by leveraging talent In 2010, the Teach Plus-Indianapolis Teaching Policy Fellows, a cohort of early career educators teaching in low-income
Description of Program Report Codes Used in Expenditure of State Funds
 Program Report Codes (PRC) A program report code (PRC) is an accounting term and is used for the allocation and accounting of funds. The PRCs (allocations) may change from year to year depending on the
State Parental Involvement Plan
 A Toolkit for Title I Parental Involvement Section 3 Tools Page 41 Tool 3.1: State Parental Involvement Plan Description This tool serves as an example of one SEA s plan for supporting LEAs and schools
Innovating Toward a Vibrant Learning Ecosystem:
 KnowledgeWorks Forecast 3.0 Innovating Toward a Vibrant Learning Ecosystem: Ten Pathways for Transforming Learning Katherine Prince Senior Director, Strategic Foresight, KnowledgeWorks KnowledgeWorks Forecast
Systemic Improvement in the State Education Agency
 Systemic Improvement in the State Education Agency A Rubric-Based Tool to Develop Implement the State Systemic Improvement Plan (SSIP) Achieve an Integrated Approach to Serving All Students Continuously
About the College Board. College Board Advocacy & Policy Center
 15% 10 +5 0 5 Tuition and Fees 10 Appropriations per FTE ( Excluding Federal Stimulus Funds) 15% 1980-81 1981-82 1982-83 1983-84 1984-85 1985-86 1986-87 1987-88 1988-89 1989-90 1990-91 1991-92 1992-93
Equitable Access Support Network. Connecting the Dots A Toolkit for Designing and Leading Equity Labs
 Equitable Access Support Network Connecting the Dots A Toolkit for Designing and Leading Equity Labs JUNE 2017 The (EASN) would like to acknowledge the following organizations that have supported States
EARNING. THE ACCT 2016 INVITATIONAL SYMPOSIUM: GETTING IN THE FAST LANE Ensuring Economic Security and Meeting the Workforce Needs of the Nation
 THE ACCT 2016 INVITATIONAL SYMPOSIUM: GETTING IN THE FAST LANE Ensuring Economic Security and Meeting the Workforce Needs of the Nation Discussion Papers 2016 Invitational Symposium LEARNING WHILE EARNING
RAISING ACHIEVEMENT BY RAISING STANDARDS. Presenter: Erin Jones Assistant Superintendent for Student Achievement, OSPI
 RAISING ACHIEVEMENT BY RAISING STANDARDS Presenter: Erin Jones Assistant Superintendent for Student Achievement, OSPI Agenda Introductions Definitions History of the work Strategies Next steps Debrief
Master of Science (MS) in Education with a specialization in. Leadership in Educational Administration
 in Education with a specialization in. Leadership in Educational Administration") Master of Science (MS) in Education with a specialization in Leadership in Educational Administration Effective October 9, 2017 Master of Science (MS) in Education with a specialization in Leadership in
Master of Science (MS) in Education with a specialization in Leadership in Educational Administration Effective October 9, 2017 Master of Science (MS) in Education with a specialization in Leadership in
Proficiency Illusion
 KINGSBURY RESEARCH CENTER Proficiency Illusion Deborah Adkins, MS 1 Partnering to Help All Kids Learn NWEA.org 503.624.1951 121 NW Everett St., Portland, OR 97209 Executive Summary At the heart of the
Teach For America alumni 37,000+ Alumni working full-time in education or with low-income communities 86%
 About Teach For America Teach For America recruits, trains, and supports top college graduates and professionals who make an initial commitment to teach for two years in urban and rural public schools
Availability of Grants Largely Offset Tuition Increases for Low-Income Students, U.S. Report Says
 Wednesday, October 2, 2002 http://chronicle.com/daily/2002/10/2002100206n.htm Availability of Grants Largely Offset Tuition Increases for Low-Income Students, U.S. Report Says As the average price of attending
Teacher Supply and Demand in the State of Wyoming
 Teacher Supply and Demand in the State of Wyoming Supply Demand Prepared by Robert Reichardt 2002 McREL To order copies of Teacher Supply and Demand in the State of Wyoming, contact McREL: Mid-continent
BENCHMARK TREND COMPARISON REPORT:
 National Survey of Student Engagement (NSSE) BENCHMARK TREND COMPARISON REPORT: CARNEGIE PEER INSTITUTIONS, 2003-2011 PREPARED BY: ANGEL A. SANCHEZ, DIRECTOR KELLI PAYNE, ADMINISTRATIVE ANALYST/ SPECIALIST
Invest in CUNY Community Colleges
 Invest in Opportunity Invest in CUNY Community Colleges Pat Arnow Professional Staff Congress Invest in Opportunity Household Income of CUNY Community College Students
Title Columbus State Community College's Master Planning Project (Phases III and IV) Status COMPLETED
 Status COMPLETED") The Higher Learning Commission Action Project Directory Columbus State Community College Project Details Title Columbus State Community College's Master Planning Project (Phases III and IV) Status COMPLETED
The Higher Learning Commission Action Project Directory Columbus State Community College Project Details Title Columbus State Community College's Master Planning Project (Phases III and IV) Status COMPLETED
THE ECONOMIC AND SOCIAL IMPACT OF APPRENTICESHIP PROGRAMS
 THE ECONOMIC AND SOCIAL IMPACT OF APPRENTICESHIP PROGRAMS March 14, 2017 Presentation by: Frank Manzo IV, MPP Illinois Economic Policy Institute fmanzo@illinoisepi.org www.illinoisepi.org The Big Takeaways
Position Statements. Index of Association Position Statements
 ts Association position statements address key issues for Pre-K-12 education and describe the shared beliefs that direct united action by boards of education/conseil scolaire fransaskois and their Association.
 UB Graduates in Political Science Students in UB s Political Science Graduate Programs come from a wide variety of undergraduate majors and from all regions of the country and around the world. Contact
California Professional Standards for Education Leaders (CPSELs)
") Standard 1 STANDARD 1: DEVELOPMENT AND IMPLEMENTATION OF A SHARED VISION Education leaders facilitate the development and implementation of a shared vision of learning and growth of all students. Element
Standard 1 STANDARD 1: DEVELOPMENT AND IMPLEMENTATION OF A SHARED VISION Education leaders facilitate the development and implementation of a shared vision of learning and growth of all students. Element
Historical Overview of Georgia s Standards. Dr. John Barge, State School Superintendent
 Historical Overview of Georgia s Standards Dr. John Barge, State School Superintendent Georgia s Comprehensive Plan for Education Improvement College and Career Georgia Performance Standards (CCGPS) ELA
Indiana Collaborative for Project Based Learning. PBL Certification Process
 Indiana Collaborative for Project Based Learning ICPBL Certification mission is to PBL Certification Process ICPBL Processing Center c/o CELL 1400 East Hanna Avenue Indianapolis, IN 46227 (317) 791-5702
The Effect of Income on Educational Attainment: Evidence from State Earned Income Tax Credit Expansions
 The Effect of Income on Educational Attainment: Evidence from State Earned Income Tax Credit Expansions Katherine Michelmore Policy Analysis and Management Cornell University km459@cornell.edu September
1GOOD LEADERSHIP IS IMPORTANT. Principal Effectiveness and Leadership in an Era of Accountability: What Research Says
 B R I E F 8 APRIL 2010 Principal Effectiveness and Leadership in an Era of Accountability: What Research Says J e n n i f e r K i n g R i c e For decades, principals have been recognized as important contributors
Hokulani Elementary School
 Hokulani Elementary Code: 109 Status and Improvement Report Year -11 Contents Focus On Standards Grades K-5 This Status and Improvement Report has been prepared as part of the Department's education accountability
Longitudinal Analysis of the Effectiveness of DCPS Teachers
 F I N A L R E P O R T Longitudinal Analysis of the Effectiveness of DCPS Teachers July 8, 2014 Elias Walsh Dallas Dotter Submitted to: DC Education Consortium for Research and Evaluation School of Education
Orleans Central Supervisory Union
 Orleans Central Supervisory Union Vermont Superintendent: Ron Paquette Primary contact: Ron Paquette* 1,142 students, prek-12, rural District Description Orleans Central Supervisory Union (OCSU) is the
For the Ohio Board of Regents Second Report on the Condition of Higher Education in Ohio
 Facilities and Technology Infrastructure Report For the Ohio Board of Regents Second Report on the Condition of Higher Education in Ohio Introduction. As Ohio s national research university, Ohio State
Unequal Opportunity in Environmental Education: Environmental Education Programs and Funding at Contra Costa Secondary Schools.
 Unequal Opportunity in Environmental Education: Environmental Education Programs and Funding at Contra Costa Secondary Schools Angela Freitas Abstract Unequal opportunity in education threatens to deprive
2013 TRIAL URBAN DISTRICT ASSESSMENT (TUDA) RESULTS
 RESULTS") 3 TRIAL URBAN DISTRICT ASSESSMENT (TUDA) RESULTS Achievement and Accountability Office December 3 NAEP: The Gold Standard The National Assessment of Educational Progress (NAEP) is administered in reading
3 TRIAL URBAN DISTRICT ASSESSMENT (TUDA) RESULTS Achievement and Accountability Office December 3 NAEP: The Gold Standard The National Assessment of Educational Progress (NAEP) is administered in reading
Cooper Upper Elementary School
 LIVONIA PUBLIC SCHOOLS www.livoniapublicschools.org/cooper 213-214 BOARD OF EDUCATION 213-14 Mark Johnson, President Colleen Burton, Vice President Dianne Laura, Secretary Tammy Bonifield, Trustee Dan
Intervention in Struggling Schools Through Receivership New York State. May 2015
 Intervention in Struggling Schools Through Receivership New York State May 2015 The Law - Education Law Section 211-f and Receivership In April 2015, Subpart E of Part EE of Chapter 56 of the Laws of 2015
Effective Recruitment and Retention Strategies for Underrepresented Minority Students: Perspectives from Dental Students
 Critical Issues in Dental Education Effective Recruitment and Retention Strategies for Underrepresented Minority Students: Perspectives from Dental Students Naty Lopez, Ph.D.; Rose Wadenya, D.M.D., M.S.;
Massachusetts Department of Elementary and Secondary Education. Title I Comparability
 Massachusetts Department of Elementary and Secondary Education Title I Comparability 2009-2010 Title I provides federal financial assistance to school districts to provide supplemental educational services
Expanded Learning Time Expectations for Implementation
 I. ELT Design is Driven by Focused School-wide Priorities The school s ELT design (schedule, staff, instructional approaches, assessment systems, budget) is driven by no more than three school-wide priorities,
ASCD Recommendations for the Reauthorization of No Child Left Behind
 ASCD Recommendations for the Reauthorization of No Child Left Behind The Association for Supervision and Curriculum Development (ASCD) represents 178,000 educators. Our membership is composed of teachers,
PROPOSED MERGER - RESPONSE TO PUBLIC CONSULTATION
 PROPOSED MERGER - RESPONSE TO PUBLIC CONSULTATION Paston Sixth Form College and City College Norwich Vision for the future of outstanding Post-16 Education in North East Norfolk Date of Issue: 22 September
STRATEGIC GROWTH FROM THE BASE OF THE PYRAMID
 Executive Education STRATEGIC GROWTH FROM THE BASE OF THE PYRAMID This innovative, new five-day program shares key strategies, frameworks and processes that helps companies build sustainable, scalable businesses
Educational Attainment
 A Demographic and Socio-Economic Profile of Allen County, Indiana based on the 2010 Census and the American Community Survey Educational Attainment A Review of Census Data Related to the Educational Attainment
TALKING POINTS ALABAMA COLLEGE AND CAREER READY STANDARDS/COMMON CORE
 TALKING POINTS ALABAMA COLLEGE AND CAREER READY STANDARDS/COMMON CORE The Alabama State Department of Education and the Alabama State School Board have a plan to meet that goal beginning with the implementation