Guide to Maths for Psychologists
|
|
|
- Anissa Daniels
- 5 years ago
- Views:
Transcription
 in Psychology")
1 Guide to Maths for Psychologists GCSE (9-1) Psychology Pearson Edexcel Level 1/Level 2 GCSE (9-1) in Psychology (1PS0)
2 Contents Introduction 3 1. Statistical graphs, charts and tables Data Bar charts Frequency tables Frequency diagrams Comparative bar charts Histograms The shape of a distribution in a histogram 8 2. Graphs including relationships and correlations Scatter diagrams Interpreting scatter diagrams Fractions, percentages and ratios Fractions Percentages Converting between fractions, decimals and percentages Ratios Estimation Significant figures and decimal places Standard form Averages: mean, median and mode Averages Range 29
3 Introduction This Guide to Maths for Psychologists outlines the content that students will have covered in their maths lessons throughout Key Stage 3 and Key Stage 4. You can use this guide to help you understand how different areas are approached in maths, and therefore to support your teaching of mathematical content in psychology lessons. The content is split into distinct mathematical concepts. Each chapter takes you through the terminology used in that area, as well as examples taken from Pearson maths textbooks to show you the methods students should be familiar with when solving mathematical problems. Pearson Education Ltd
4 1. Statistical graphs, charts and tables 1.1 Data Requirement All students learn the difference between discrete and continuous data in KS3. They also come across categorical data. Terminology Data is either qualitative (descriptive) or quantitative (numerical). Data can also be discrete or continuous: discrete data can only take certain values, e.g. whole numbers or shoe sizes; continuous data is measured, e.g. mass, length or time, and can take any value. 1.2 Bar charts Requirement All students learn to draw and interpret bar charts for discrete and continuous data in KS3. Approach Both axes should be labelled appropriately, and there should be a title. The frequency of a variable should be shown on the vertical axis. Bars should be of equal width. There must be gaps between the bars. The vertical axis should begin at 0. The vertical axis should go to the maximum possible for the variable given in the question, where the values are provided for candidates. Questions could ask candidates to construct or interpret a bar chart. Bar chart example 4 Pearson Education Ltd 2017
5 1.3 Frequency tables Requirement All students learn to draw and interpret frequency tables for discrete and continuous data in KS3. Approach Frequency tables contain data that shows the number of items, or frequency of each data value or each data group. Data can also be grouped. For discrete data, use groups such as 0 5, 6 10, etc. For continuous data, use groups such as 0 t < 10, 10 t < 20. The groups must not overlap. In maths, students learn that it is best to group numerical data into a maximum of 6 groups. Questions could ask candidates to construct or interpret a frequency table. Frequency table example with ungrouped discrete data Age Frequency Frequency table example with grouped discrete data Psychology mark Frequency Frequency table with grouped continuous data. Distance (d metres) Frequency 10 d < d < d < d < d < 60 4 Pearson Education Ltd


6 1.4 Frequency diagrams Requirement All students learn to draw and interpret frequency diagrams for discrete and continuous data in KS3. Inconsistency: Frequency diagram is another name for a bar chart where the vertical axis is labelled Frequency. In KS3 maths, the name Frequency diagram is not used. Approach Can be used to show discrete or continuous data. Questions could ask candidates to construct or interpret a frequency diagram. The following bar chart and histogram could also be called frequency diagrams: 6 Pearson Education Ltd 2017

7 1.5 Comparative bar charts Requirement All students learn to draw and interpret comparative bar charts in KS3. Approach Compares two or more sets of data. Uses different coloured bars for each set of data. Needs a key to show what each colour bar represents. Questions could ask candidates to construct or interpret a comparative bar chart. 1.6 Histograms Requirement In maths, students do not meet histograms until KS4, although the bar charts they draw in KS3 for grouped continuous data could also be called histograms. Histograms with unequal width bars/groups, where frequency density is plotted on the vertical axis, are covered only in Higher GCSE Maths, not Foundation. These will not be assessed at GCSE for Psychology. Approach Can be drawn for grouped continuous data where groups/bars are of equal width. No gaps between the bars. Questions could ask candidates to construct or interpret a histogram. Pearson Education Ltd


8 Histogram example with equal width bars/groups 1.7 The shape of a distribution in a histogram Terminology The shape formed by the bars in a histogram is known as the distribution of the data. A histogram shows how the data are distributed across the intervals. A distribution can be symmetrical ( normal distribution ), or have a positive or negative skew. This distribution shown above is symmetrical this is commonly known as normal distribution. It is also sometimes called a bell-shaped frequency curve. This distribution has a positive skew. More scores are distributed to the left (or lower end) than to the right (or upper end). The mean and median would be less than the mode. 8 Pearson Education Ltd 2017
 than to the left (or lower end).")
9 This distribution has a negative skew. More scores are distributed to the right (or upper end) than to the left (or lower end). The mean and median would be greater than the mode. Pearson Education Ltd
10 2. Graphs including relationships and correlations 2.1 Scatter diagrams Approach Can be drawn for two sets of data on the same graph to see if there is a relationship or correlation between them. Points on a scatter diagram are usually plotted with crosses. Questions could ask candidates to construct or interpret a scatter diagram. Scatter diagrams can show a positive or negative correlation, or no correlation. A correlation is when two sets of data are linked. For example, when one value increases as the other increases, or when one value decreases as the other increases. A correlation does not imply causation. Sometimes there may be another factor that affects both variables, or there may be no connection between them at all. Inconsistency: In maths these are usually called scatter graphs, not scatter diagrams. Examples of scatter diagrams In the above, there is a negative correlation between the number of pirates and mean global temperature, but it is unlikely that one causes the other. 10 Pearson Education Ltd 2017
11 In the above, there is positive correlation between the number of ice-creams sold and death by drowning, but it is unlikely that one causes the other. A more likely explanation is a third factor temperature. On hot days more people buy ice creams and more people swim, leading to increased numbers of drownings. 2.2 Interpreting scatter diagrams Requirement All students should learn to interpret scatter diagrams in KS3. They will have learned about correlation and causation in KS3 maths. Common error: Students often find interpreting scatter diagrams difficult as they do not know how to put into words what the diagram shows, so it is good to give them examples of this, or at least sentences to copy and complete, such as: The the age, the the cognitive ability. Answer: The higher the age, the lower the cognitive ability. You can also use statements such as: As the increases, the increases. Answer: As the temperature increases, the aggression increases. Pearson Education Ltd


12 3. Fractions, percentages and ratios 3.1 Fractions Requirement All students learn how to add, subtract, multiply and divide decimals and find a fraction of a quantity in KS3. They also learn how to convert fractions to decimals and vice versa, and use and interpret recurring decimal notation. Approach Convert a fraction to a decimal Divide the top number by the bottom number. For example = 0.375, = 0.24 Convert a decimal to a fraction Calculate a fraction of a quantity Terminology Try to write fractions on two lines, i.e. not 1/1000. In a fraction, the horizontal line means divided by. So means 3 5. Understanding this helps students remember how to convert fractions to decimals. 12 Pearson Education Ltd 2017


13 3.2 Percentages Requirement All students at KS3 will learn how to define percentage as number of parts per hundred, interpret percentages and percentage change as a fraction or decimal, interpret percentages multiplicatively, express one quantity as a percentage of another, compare two quantities using percentages, and work with percentages greater than 100%. All students at KS3 will solve problems involving percentage change, including percentage increase and decrease, original value problems, and simple interest in financial mathematics. Percentage change Foundation level students learn this in unit 14 of the GCSE, i.e. Autumn term of year 11. Terminology Percent means out of 100. A percentage is a fraction with denominator 100. You can calculate percentages of amounts, e.g. 20% of 500 g. You can write one number as a percentage of another, e.g. write as a percentage. Approach Converting a percentage to a fraction Converting a percentage to a decimal Pearson Education Ltd
14 Converting a fraction to a percentage Convert the fraction to a decimal, then convert the decimal to a percentage. For example: = = 42.5% Students can input as a fraction into a scientific calculator and press = (or the S-D button on some calculators) to get the equivalent decimal. Writing one number as a percentage of another Write as a fraction, then convert to a percentage. For example, in a class of 28 students, 13 are boys. What percentage are boys? = = 46.4% (1 d.p.) Without a calculator GCSE Psychology students would not be required to complete calculations without a calculator: Percentage of words recalled with rehearsal = 100 Calculating a percentage of an amount 50% is the same as so to find 50% divide by 2. 10% is the same as so to find 10% divide by 10. To calculate 30% mentally, you can find 10% and multiply by 3. To calculate 5% mentally, find 10% and halve. Calculating percentages using a calculator Input the percentage as a fraction For example, to calculate 30% of 20, input 20 and press = to get 6. Input the percentage using a decimal multiplier 65% = 0.65 So to calculate 65% of 80, input and press = to get 52. Percentage increase/decrease Work out the percentage increase and add it on/subtract it Examples To increase 45 g by 20%: 20% of 45 g = 9 g = 54 g To decrease 220 ml by 5%: 5% of 220 ml = 11 ml = 209 ml 14 Pearson Education Ltd 2017
15 Using multiplication Examples To increase 45 g by 20% After the increase you will have 100% + 20% = 120% = = 54 g To decrease 220 ml by 5% After the decrease you will have 100% 5% = 95% = 209 ml Finding original amount Using arrow diagrams: Percentage change percentage change = 100 Example In 2010 a box of tissues cost 80p. In 2014 a similar box cost The actual increase in price is = 40p. The fractional increase is = as a decimal is 0.5 Percentage increase is = 50% 3.3 Converting between fractions, decimals and percentages Requirement All students will learn how to convert between fractions, decimals and percentages in KS3. Approach Percentage to fraction to decimal 40% = = 0.4 Decimal to percentage Multiply by 100: 0.3 = 30% 0.02 = 2% Pearson Education Ltd
16 Percentage to decimal Divide by 100: 62% = % = Simple fractions to percentages Multiply or divide both numbers by the amount needed to get a fraction with denominator 100: Converting a fraction to a percentage Convert the fraction to a decimal, then convert the decimal to a percentage. For example: = = 42.5% Students can input as a fraction into a scientific calculator and press = (or the S-D button on some calculators) to get the equivalent decimal. Terminology When converting decimals to percentages or vice versa, do not say move the decimal point two places. Instead, say multiply by 100 or divide by 100 as appropriate = 52% 3% = Ratios Requirement Students learn to simplify ratios, and write them in the form 1 : n or n : 1 in KS3. Students learn to relate ratios to fractions in KS3, but many continue to make errors with this type of calculation. Approach Simplifying ratios A ratio in its simplest form only contains whole number values. 16 Pearson Education Ltd 2017
17 Divide all the numbers in the ratio by the highest common factor: 2 : : 3 6 : : 5 The following ratio is not in its simplest form, because the two numbers both still have a common factor, 2: 8 : : 10 Writing in the form 1 : n (sometimes called a unit ratio) Divide both numbers by the first number in the ratio: 5 : : 1.4 Writing in the form n : 1 Divide both numbers by the second number in the ratio: 20 : : 1 Comparing ratios Write both ratios in the form 1 : n or n : 1. Example Ben makes a drink with 20 ml squash to 120 ml water. Fiona makes a drink with 15 ml squash to 85 ml water. Whose squash is stronger? Ben Fiona 20 : : : 6 1 : 5.7 Fiona s drink has less water for 1 ml squash, so is stronger. Ratio and proportion Pearson Education Ltd
18 A mixture is made from two liquids A and B in the ratio 2 : 3. What fraction of the mixture is a) liquid A? b) liquid B? is A and is B Terminology To simplify a ratio, divide all the numbers in the ratio by their highest common factor. To compare ratios, write them in the form 1 : n, or n : 1. This is sometimes called a unit ratio. A ratio compares two quantities, and translates into a statement such as for every 3 black there are 2 red. Common error: Students look at 2 : 3 and think the fraction is. 18 Pearson Education Ltd 2017
19 4. Estimation Requirement All KS3 students learn to estimate answers to calculations. Approach Estimate the answer to 591 Rounding each of the numbers to 1 significant figure gives 600 So a good estimate would be 200. Terminology Avoid any suggestion that an estimate involves guessing. The calculation is not rough it is accurate, but the numbers you use or the assumptions you make are estimates or approximations. To estimate the result of a calculation in maths, we round all values to 1 significant figure. In calculations involving division or square roots, you can round one or more values to give a nice division or root. e.g. to estimate, rounding the values on the top to 1 s.f. gives 4 8 = 32. So approximating 4.4 to 4 gives the calculation 32 4 = 8. Use the symbol to show the estimated answer to a calculation. Pearson Education Ltd
20 5. Significant figures and decimal places Requirement All students will have learned to round to the nearest whole number and 1, 2 or 3 d.p. by the end of KS3. They should be able to cope with rounding to more d.p. as an extension of rounding to 3 d.p. Approach Look at the digit after the last one you want to keep. Round up if this digit is 5 or more, round down if it is 4 or less. Rounding to 1 d.p less than 5 so round down 5 or more so round up 5 or more so round up 5.4 (1 d.p.) 5.3 (1 d.p.) 5.4 (1 d.p.) On a number line, round to the nearest value with 1 decimal place: or more so round up (2 d.p.) (2 d.p.) less than 5 so round down Rounding to 3 d.p less than 5 so round down 5 or more so round up (3 d.p.) (3 d.p.) 20 Pearson Education Ltd 2017
21 Rounding to significant figures Small numbers 1st significant figure = 4 ten thousandths Large numbers 1st significant figure = 5 billion Rounding to 2 significant figures (2 s.f.) less than 5 round down 5 or more round up Add zeroes so the 5 is still in the billions position Terminology The number of decimal places is the number of digits after the decimal point. So, has 4 decimal places, and 10 has no decimal places. In any number, the first significant figure is the one with the highest place value. It is the first non-zero digit counting from the left. Inconsistency: Zero is counted as a significant figure if it is between two other non-zero significant figures. Other zeros are place holders if you took them out the place value of the other digits would change. place holders st 2nd 3rd 4th significant figures place holders st 2nd 3rd 4th 5th 6th significant figures To round a number to a given number of significant figures or decimal places, look at the digit after the last one you need. Round up if the digit is 5 or more, and round down if the digit is 4 or less rounded to 1 decimal place is 9.0. You must write the.0 to show the value in the decimal place. Pearson Education Ltd
22 6. Standard form Requirement All students learn to write numbers in index form and use the index laws for multiplication and division in KS3. All students learn the positive and negative powers of 10 in Unit 1 of GCSE Maths. Foundation students often find the negative and zero powers difficult to understand/ remember, as they are the only negative and zero powers they use. Higher students use negative and zero indices with a range of numbers so are likely to have a better understanding. All students learn to read and write very small and very large numbers in standard form in GCSE. Approach Calculating powers of 10 Follow a pattern: For positive powers, the power shows the number of times that 10 is multiplied by itself: 10 1 = = 10 x 10 = = 10 x 10 x 10 = = 10 x 10 x 10 x 10 = Note that the number of zeroes is the same as the number of the power. Based on this, what is the value of 10 7? Answer: 10 7 = 10 x 10 x 10 x 10 x 10 x 10 x 10 = For negative powers, the power shows the number of times that 1 is divided by 10: 10-1 = 1 10 = = 1 (10 x 10) = = 1 (10 x 10 x 10) = = 1 (10 x 10 x 10 x 10) = Lastly, remember that any number to the power of 0 is 1, so: 10 0 = 1 Students may like to see this idea on a number line: Pearson Education Ltd 2017


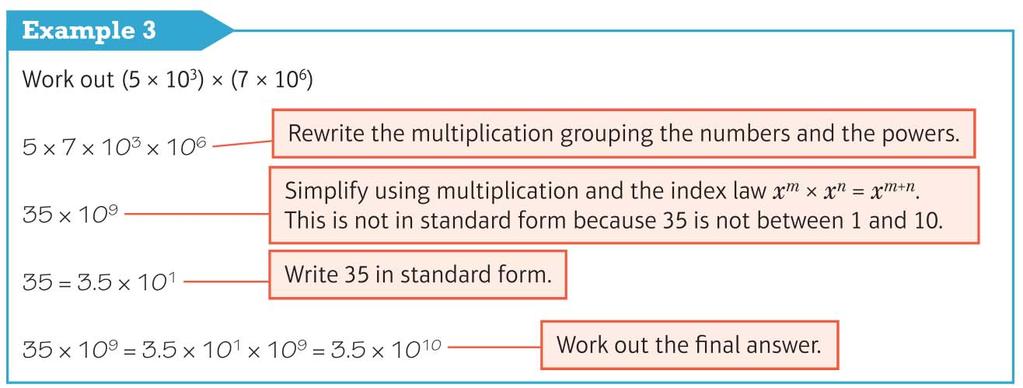
23 Writing large numbers in standard form Writing small numbers in standard form Calculating with numbers in standard form Multiplication and division Pearson Education Ltd
24 Work out Rewrite to separate numbers and powers: = Use the index law x m x n = x m n to divide 10 5 by = 10 3 = = Addition and subtraction Write numbers in decimal form before adding and subtracting. Write the answer in standard form. Work out x 10-2 = 3.6 x x 0.01 = = = x 100 = Work out Terminology Any number can be raised to a power or index. The power or index tells you how many times the number is multiplied by itself. 3 4 = We read 3 4 as 3 to the power 4. Some calculators have a power or index key. In maths, students are not told which key presses to use, as calculators vary. Instead we would say Make sure you know how to input numbers raised to a power on your calculator. Any number raised to the power zero = 1. The index laws: To multiply powers of the same number, add the indices. To divide powers of the same number, subtract the indices. Some of the powers of 10 are as follows: or or 0.01 or 0.1 or Standard form is a way of writing very large or very small numbers as a number between 1 and 10 multiplied by a power of 10; for example, A 10 n, where A is between 1 and 10 and n is the power of Pearson Education Ltd 2017
25 When writing numbers in standard form, do not talk about moving the decimal point ; the position of the decimal point remains fixed. Multiplying by a power of 10 moves digits places to the left and dividing by a power of 10 moves digits places to the right. On some calculators you can enter numbers in standard form, or answers may be given in standard form. In maths, students are not told which key presses to use, as calculators vary. Instead students would be told to Make sure you know how to enter and read numbers in standard form on your calculator. Pearson Education Ltd
26 7. Averages: mean, median and mode 7.1 Averages Requirement Normal distribution is not covered in Maths GCSE. Terminology Mean, median and mode are all averages. In everyday life when someone says average they are usually talking about the mean. Mean = The mode is the most common value. In a frequency table, this is the value with the highest frequency. The mode is one of the data values. A set of data can have more than one mode. For grouped data, the modal class is the class interval with the highest frequency. The median is the middle value when the data is written in order. It may not be one of the data values (e.g. it could be halfway between two values). For an ordered set of data with an even number of values, the median is the mean of the two middle values (which is the same as the value midway between them). For a set of n items of data, the median is the th data item. When n is very large, you can use the th data item. For a set of ordered data, the median is the value halfway through the data. Finding the mode Mode = most common value From a data set For the data set 2, 2, 5, 7, 2, 4, 6, 9, the mode is 2. For the data set 1, 1, 3, 4, 2, 5, 3, 3, 2, 2, 1 the modes are 1 and 3. From a frequency table For this data, the mode is 2 eggs. Number of eggs Frequency Common error: Students may give 15 as the mode (the highest frequency), rather than 2, which is the number of eggs with the greatest frequency. 26 Pearson Education Ltd 2017
27 From a grouped frequency table For the below data, the modal age is 10 a < 20 Finding the median Median = middle value First write the data in order The median is the middle value Common error: Students may not order the data before finding the median. From a frequency table Number of eggs Frequency Total 20 There are 20 pieces of data in the table. The median is the = 10.5th data item (i.e. between the 10th and 11th items). The +1 is added here as there are an even number of values (20). Number of eggs Frequency = Add up the frequencies to find the 10th and 11th data items. 4 2 Total 20 The 10th and 11th items are both 2 eggs, so the median is 2 eggs. Calculating the quartiles from a frequency table The lower quartile is the = 5.25th data item (i.e. between the 5th and 6th items). Pearson Education Ltd


28 The upper quartile is the 16th items). = 15.75th data item (i.e. between the 15th and Number of eggs Frequency = = 18 Add up the frequencies to find the 5th and 6th data items and the 15th and 16th data items. 4 2 Total 20 The 5th and 6th items are both 2 eggs, so the lower quartile is 2 eggs. The 15th and 16th items are both 3 eggs, so the upper quartile is 3 eggs. Finding the interval containing the median from a grouped frequency table = 27 Total frequency = 40 Add up the frequencies to find the 20th and 21st data items. Median = = 20.5th data item. The 20th and 21st data items are in the interval 10 a < 20. Calculating the mean of a small data set Mean (arithmetic mean) = sum of the values divided by the number of values Common error: When using a calculator to calculate a mean, students may add the numbers and not press = before dividing, which will give an incorrect value. 28 Pearson Education Ltd 2017

29 Calculating the mean from a frequency table The below is from Pearson KS3 Maths: Calculating means and medians from bar charts and histograms Make a frequency table from the bar chart or histogram, and use the appropriate method shown above. 7.2 Range Terminology The range is a measure of spread of the data. It is calculated as the largest value minus the smallest value. Note the range is a single number (not 3 12 as two numbers separated with a hyphen, but 9). In a maths question, students would be told to 'Work out' the range they would need to do a calculation to find it. A larger range means the data is less consistent. A smaller range means the data is more consistent. You can estimate the range from a grouped frequency table, as largest possible value minus smallest possible value. Approach Calculating the range From a small data set Range = largest value minus smallest value For example, for this data: 2, 2, 5, 7, 2, 4, 6, 9 the range is 9 2 = 7 Pearson Education Ltd
30 From a frequency table Range = largest value minus smallest value Number of eggs Frequency Range = 3 1 = 2 NB: It is the range of the data values, not of the frequencies. From a grouped frequency table An estimate of the range is: largest possible value minus smallest possible value 30 Pearson Education Ltd 2017

31
Pre-Algebra A. Syllabus. Course Overview. Course Goals. General Skills. Credit Value
 Syllabus Pre-Algebra A Course Overview Pre-Algebra is a course designed to prepare you for future work in algebra. In Pre-Algebra, you will strengthen your knowledge of numbers as you look to transition
Grade 6: Correlated to AGS Basic Math Skills
 Grade 6: Correlated to AGS Basic Math Skills Grade 6: Standard 1 Number Sense Students compare and order positive and negative integers, decimals, fractions, and mixed numbers. They find multiples and
Edexcel GCSE. Statistics 1389 Paper 1H. June Mark Scheme. Statistics Edexcel GCSE
 Edexcel GCSE Statistics 1389 Paper 1H June 2007 Mark Scheme Edexcel GCSE Statistics 1389 NOTES ON MARKING PRINCIPLES 1 Types of mark M marks: method marks A marks: accuracy marks B marks: unconditional
AGS THE GREAT REVIEW GAME FOR PRE-ALGEBRA (CD) CORRELATED TO CALIFORNIA CONTENT STANDARDS
 CORRELATED TO CALIFORNIA CONTENT STANDARDS") AGS THE GREAT REVIEW GAME FOR PRE-ALGEBRA (CD) CORRELATED TO CALIFORNIA CONTENT STANDARDS 1 CALIFORNIA CONTENT STANDARDS: Chapter 1 ALGEBRA AND WHOLE NUMBERS Algebra and Functions 1.4 Students use algebraic
AGS THE GREAT REVIEW GAME FOR PRE-ALGEBRA (CD) CORRELATED TO CALIFORNIA CONTENT STANDARDS 1 CALIFORNIA CONTENT STANDARDS: Chapter 1 ALGEBRA AND WHOLE NUMBERS Algebra and Functions 1.4 Students use algebraic
Extending Place Value with Whole Numbers to 1,000,000
 Grade 4 Mathematics, Quarter 1, Unit 1.1 Extending Place Value with Whole Numbers to 1,000,000 Overview Number of Instructional Days: 10 (1 day = 45 minutes) Content to Be Learned Recognize that a digit
Numeracy Medium term plan: Summer Term Level 2C/2B Year 2 Level 2A/3C
 Numeracy Medium term plan: Summer Term Level 2C/2B Year 2 Level 2A/3C Using and applying mathematics objectives (Problem solving, Communicating and Reasoning) Select the maths to use in some classroom
Algebra 1, Quarter 3, Unit 3.1. Line of Best Fit. Overview
 Algebra 1, Quarter 3, Unit 3.1 Line of Best Fit Overview Number of instructional days 6 (1 day assessment) (1 day = 45 minutes) Content to be learned Analyze scatter plots and construct the line of best
Probability and Statistics Curriculum Pacing Guide
 Unit 1 Terms PS.SPMJ.3 PS.SPMJ.5 Plan and conduct a survey to answer a statistical question. Recognize how the plan addresses sampling technique, randomization, measurement of experimental error and methods
Functional Skills Mathematics Level 2 assessment
 Functional Skills Mathematics Level 2 assessment www.cityandguilds.com September 2015 Version 1.0 Marking scheme ONLINE V2 Level 2 Sample Paper 4 Mark Represent Analyse Interpret Open Fixed S1Q1 3 3 0
Multiplication of 2 and 3 digit numbers Multiply and SHOW WORK. EXAMPLE. Now try these on your own! Remember to show all work neatly!
 Multiplication of 2 and digit numbers Multiply and SHOW WORK. EXAMPLE 205 12 10 2050 2,60 Now try these on your own! Remember to show all work neatly! 1. 6 2 2. 28 8. 95 7. 82 26 5. 905 15 6. 260 59 7.
Math-U-See Correlation with the Common Core State Standards for Mathematical Content for Third Grade
 Math-U-See Correlation with the Common Core State Standards for Mathematical Content for Third Grade The third grade standards primarily address multiplication and division, which are covered in Math-U-See
Page 1 of 11. Curriculum Map: Grade 4 Math Course: Math 4 Sub-topic: General. Grade(s): None specified
: None specified") Curriculum Map: Grade 4 Math Course: Math 4 Sub-topic: General Grade(s): None specified Unit: Creating a Community of Mathematical Thinkers Timeline: Week 1 The purpose of the Establishing a Community
Curriculum Map: Grade 4 Math Course: Math 4 Sub-topic: General Grade(s): None specified Unit: Creating a Community of Mathematical Thinkers Timeline: Week 1 The purpose of the Establishing a Community
GCSE Mathematics B (Linear) Mark Scheme for November Component J567/04: Mathematics Paper 4 (Higher) General Certificate of Secondary Education
 Mark Scheme for November Component J567/04: Mathematics Paper 4 (Higher) General Certificate of Secondary Education") GCSE Mathematics B (Linear) Component J567/04: Mathematics Paper 4 (Higher) General Certificate of Secondary Education Mark Scheme for November 2014 Oxford Cambridge and RSA Examinations OCR (Oxford Cambridge
GCSE Mathematics B (Linear) Component J567/04: Mathematics Paper 4 (Higher) General Certificate of Secondary Education Mark Scheme for November 2014 Oxford Cambridge and RSA Examinations OCR (Oxford Cambridge
Mathematics process categories
 Mathematics process categories All of the UK curricula define multiple categories of mathematical proficiency that require students to be able to use and apply mathematics, beyond simple recall of facts
What the National Curriculum requires in reading at Y5 and Y6
 What the National Curriculum requires in reading at Y5 and Y6 Word reading apply their growing knowledge of root words, prefixes and suffixes (morphology and etymology), as listed in Appendix 1 of the
Mathematics subject curriculum
 Mathematics subject curriculum Dette er ei omsetjing av den fastsette læreplanteksten. Læreplanen er fastsett på Nynorsk Established as a Regulation by the Ministry of Education and Research on 24 June
Montana Content Standards for Mathematics Grade 3. Montana Content Standards for Mathematical Practices and Mathematics Content Adopted November 2011
 Montana Content Standards for Mathematics Grade 3 Montana Content Standards for Mathematical Practices and Mathematics Content Adopted November 2011 Contents Standards for Mathematical Practice: Grade
Dublin City Schools Mathematics Graded Course of Study GRADE 4
 I. Content Standard: Number, Number Sense and Operations Standard Students demonstrate number sense, including an understanding of number systems and reasonable estimates using paper and pencil, technology-supported
May To print or download your own copies of this document visit Name Date Eurovision Numeracy Assignment
 1. An estimated one hundred and twenty five million people across the world watch the Eurovision Song Contest every year. Write this number in figures. 2. Complete the table below. 2004 2005 2006 2007
Paper Reference. Edexcel GCSE Mathematics (Linear) 1380 Paper 1 (Non-Calculator) Foundation Tier. Monday 6 June 2011 Afternoon Time: 1 hour 30 minutes
 1380 Paper 1 (Non-Calculator) Foundation Tier. Monday 6 June 2011 Afternoon Time: 1 hour 30 minutes") Centre No. Candidate No. Paper Reference 1 3 8 0 1 F Paper Reference(s) 1380/1F Edexcel GCSE Mathematics (Linear) 1380 Paper 1 (Non-Calculator) Foundation Tier Monday 6 June 2011 Afternoon Time: 1 hour
Centre No. Candidate No. Paper Reference 1 3 8 0 1 F Paper Reference(s) 1380/1F Edexcel GCSE Mathematics (Linear) 1380 Paper 1 (Non-Calculator) Foundation Tier Monday 6 June 2011 Afternoon Time: 1 hour
Math 121 Fundamentals of Mathematics I
 I. Course Description: Math 121 Fundamentals of Mathematics I Math 121 is a general course in the fundamentals of mathematics. It includes a study of concepts of numbers and fundamental operations with
TOPICS LEARNING OUTCOMES ACTIVITES ASSESSMENT Numbers and the number system
 Curriculum Overview Mathematics 1 st term 5º grade - 2010 TOPICS LEARNING OUTCOMES ACTIVITES ASSESSMENT Numbers and the number system Multiplies and divides decimals by 10 or 100. Multiplies and divide
(I couldn t find a Smartie Book) NEW Grade 5/6 Mathematics: (Number, Statistics and Probability) Title Smartie Mathematics
 NEW Grade 5/6 Mathematics: (Number, Statistics and Probability) Title Smartie Mathematics") (I couldn t find a Smartie Book) NEW Grade 5/6 Mathematics: (Number, Statistics and Probability) Title Smartie Mathematics Lesson/ Unit Description Questions: How many Smarties are in a box? Is it the
(I couldn t find a Smartie Book) NEW Grade 5/6 Mathematics: (Number, Statistics and Probability) Title Smartie Mathematics Lesson/ Unit Description Questions: How many Smarties are in a box? Is it the
This scope and sequence assumes 160 days for instruction, divided among 15 units.
 In previous grades, students learned strategies for multiplication and division, developed understanding of structure of the place value system, and applied understanding of fractions to addition and subtraction
AP Statistics Summer Assignment 17-18
 AP Statistics Summer Assignment 17-18 Welcome to AP Statistics. This course will be unlike any other math class you have ever taken before! Before taking this course you will need to be competent in basic
Unit 3: Lesson 1 Decimals as Equal Divisions
 Unit 3: Lesson 1 Strategy Problem: Each photograph in a series has different dimensions that follow a pattern. The 1 st photo has a length that is half its width and an area of 8 in². The 2 nd is a square
Using Proportions to Solve Percentage Problems I
 RP7-1 Using Proportions to Solve Percentage Problems I Pages 46 48 Standards: 7.RP.A. Goals: Students will write equivalent statements for proportions by keeping track of the part and the whole, and by
Functional Maths Skills Check E3/L x
 Functional Maths Skills Check E3/L1 Name: Date started: The Four Rules of Number + - x May 2017. Kindly contributed by Nicola Smith, Gloucestershire College. Search for Nicola on skillsworkshop.org Page
MODULE FRAMEWORK AND ASSESSMENT SHEET
 MODULE FRAMEWORK AND ASSESSMENT SHEET LEARNING OUTCOMES (LOS) ASSESSMENT STANDARDS (ASS) FORMATIVE ASSESSMENT ASs Pages and (mark out of ) LOs (ave. out of ) SUMMATIVE ASSESSMENT Tasks or tests Ave for
South Carolina College- and Career-Ready Standards for Mathematics. Standards Unpacking Documents Grade 5
 South Carolina College- and Career-Ready Standards for Mathematics Standards Unpacking Documents Grade 5 South Carolina College- and Career-Ready Standards for Mathematics Standards Unpacking Documents
Introduction to the Practice of Statistics
 Chapter 1: Looking at Data Distributions Introduction to the Practice of Statistics Sixth Edition David S. Moore George P. McCabe Bruce A. Craig Statistics is the science of collecting, organizing and
BENCHMARK MA.8.A.6.1. Reporting Category
 Grade MA..A.. Reporting Category BENCHMARK MA..A.. Number and Operations Standard Supporting Idea Number and Operations Benchmark MA..A.. Use exponents and scientific notation to write large and small
Paper 2. Mathematics test. Calculator allowed. First name. Last name. School KEY STAGE TIER
 259574_P2 5-7_KS3_Ma.qxd 1/4/04 4:14 PM Page 1 Ma KEY STAGE 3 TIER 5 7 2004 Mathematics test Paper 2 Calculator allowed Please read this page, but do not open your booklet until your teacher tells you
Math Grade 3 Assessment Anchors and Eligible Content
 Math Grade 3 Assessment Anchors and Eligible Content www.pde.state.pa.us 2007 M3.A Numbers and Operations M3.A.1 Demonstrate an understanding of numbers, ways of representing numbers, relationships among
PRIMARY ASSESSMENT GRIDS FOR STAFFORDSHIRE MATHEMATICS GRIDS. Inspiring Futures
 PRIMARY ASSESSMENT GRIDS FOR STAFFORDSHIRE MATHEMATICS GRIDS Inspiring Futures ASSESSMENT WITHOUT LEVELS The Entrust Mathematics Assessment Without Levels documentation has been developed by a group of
Math 96: Intermediate Algebra in Context
 : Intermediate Algebra in Context Syllabus Spring Quarter 2016 Daily, 9:20 10:30am Instructor: Lauri Lindberg Office Hours@ tutoring: Tutoring Center (CAS-504) 8 9am & 1 2pm daily STEM (Math) Center (RAI-338)
Student s Edition. Grade 6 Unit 6. Statistics. Eureka Math. Eureka Math
 Student s Edition Grade 6 Unit 6 Statistics Eureka Math Eureka Math Lesson 1 Lesson 1: Posing Statistical Questions Statistics is about using data to answer questions. In this module, the following four
Primary National Curriculum Alignment for Wales
 Mathletics and the Welsh Curriculum This alignment document lists all Mathletics curriculum activities associated with each Wales course, and demonstrates how these fit within the National Curriculum Programme
EDEXCEL FUNCTIONAL SKILLS PILOT TEACHER S NOTES. Maths Level 2. Chapter 4. Working with measures
 EDEXCEL FUNCTIONAL SKILLS PILOT TEACHER S NOTES Maths Level 2 Chapter 4 Working with measures SECTION G 1 Time 2 Temperature 3 Length 4 Weight 5 Capacity 6 Conversion between metric units 7 Conversion
Fourth Grade. Reporting Student Progress. Libertyville School District 70. Fourth Grade
 Fourth Grade Libertyville School District 70 Reporting Student Progress Fourth Grade A Message to Parents/Guardians: Libertyville Elementary District 70 teachers of students in kindergarten-5 utilize a
CONSTRUCTION OF AN ACHIEVEMENT TEST Introduction One of the important duties of a teacher is to observe the student in the classroom, laboratory and
 CONSTRUCTION OF AN ACHIEVEMENT TEST Introduction One of the important duties of a teacher is to observe the student in the classroom, laboratory and in other settings. He may also make use of tests in
Algebra 1 Summer Packet
 Algebra 1 Summer Packet Name: Solve each problem and place the answer on the line to the left of the problem. Adding Integers A. Steps if both numbers are positive. Example: 3 + 4 Step 1: Add the two numbers.
Are You Ready? Simplify Fractions
 SKILL 10 Simplify Fractions Teaching Skill 10 Objective Write a fraction in simplest form. Review the definition of simplest form with students. Ask: Is 3 written in simplest form? Why 7 or why not? (Yes,
UNIT ONE Tools of Algebra
 UNIT ONE Tools of Algebra Subject: Algebra 1 Grade: 9 th 10 th Standards and Benchmarks: 1 a, b,e; 3 a, b; 4 a, b; Overview My Lessons are following the first unit from Prentice Hall Algebra 1 1. Students
Mathematics Success Level E
 T403 [OBJECTIVE] The student will generate two patterns given two rules and identify the relationship between corresponding terms, generate ordered pairs, and graph the ordered pairs on a coordinate plane.
Statewide Framework Document for:
 Statewide Framework Document for: 270301 Standards may be added to this document prior to submission, but may not be removed from the framework to meet state credit equivalency requirements. Performance
Alignment of Australian Curriculum Year Levels to the Scope and Sequence of Math-U-See Program
 Alignment of s to the Scope and Sequence of Math-U-See Program This table provides guidance to educators when aligning levels/resources to the Australian Curriculum (AC). The Math-U-See levels do not address
MULTIPLE CHOICE. Choose the one alternative that best completes the statement or answers the question.
 Ch 2 Test Remediation Work Name MULTIPLE CHOICE. Choose the one alternative that best completes the statement or answers the question. Provide an appropriate response. 1) High temperatures in a certain
Functional Skills Mathematics Subject Specifications and Tutor/Assessor Guide SUBJECT SPECIFICATIONS. September 2017 Version 1.7
 Functional Skills Mathematics Subject Specifications and Tutor/Assessor Guide SUBJECT SPECIFICATIONS September 2017 Version 1.7 Qualification at a glance Subject area Functional Skills qualifications in
Measures of the Location of the Data
 OpenStax-CNX module m46930 1 Measures of the Location of the Data OpenStax College This work is produced by OpenStax-CNX and licensed under the Creative Commons Attribution License 3.0 The common measures
FractionWorks Correlation to Georgia Performance Standards
 Cheryl Keck Educational Sales Consultant Phone: 800-445-5985 ext. 3231 ckeck@etacuisenaire.com www.etacuisenaire.com FractionWorks Correlation to Georgia Performance s Correlated to Georgia Performance
The New York City Department of Education. Grade 5 Mathematics Benchmark Assessment. Teacher Guide Spring 2013
 The New York City Department of Education Grade 5 Mathematics Benchmark Assessment Teacher Guide Spring 2013 February 11 March 19, 2013 2704324 Table of Contents Test Design and Instructional Purpose...
The Indices Investigations Teacher s Notes
 The Indices Investigations Teacher s Notes These activities are for students to use independently of the teacher to practise and develop number and algebra properties.. Number Framework domain and stage:
Ohio s Learning Standards-Clear Learning Targets
 Ohio s Learning Standards-Clear Learning Targets Math Grade 1 Use addition and subtraction within 20 to solve word problems involving situations of 1.OA.1 adding to, taking from, putting together, taking
Shockwheat. Statistics 1, Activity 1
 Statistics 1, Activity 1 Shockwheat Students require real experiences with situations involving data and with situations involving chance. They will best learn about these concepts on an intuitive or informal
Characteristics of Functions
 Characteristics of Functions Unit: 01 Lesson: 01 Suggested Duration: 10 days Lesson Synopsis Students will collect and organize data using various representations. They will identify the characteristics
Introducing the New Iowa Assessments Mathematics Levels 12 14
 Introducing the New Iowa Assessments Mathematics Levels 12 14 ITP Assessment Tools Math Interim Assessments: Grades 3 8 Administered online Constructed Response Supplements Reading, Language Arts, Mathematics
STT 231 Test 1. Fill in the Letter of Your Choice to Each Question in the Scantron. Each question is worth 2 point.
 STT 231 Test 1 Fill in the Letter of Your Choice to Each Question in the Scantron. Each question is worth 2 point. 1. A professor has kept records on grades that students have earned in his class. If he
Grade 5 + DIGITAL. EL Strategies. DOK 1-4 RTI Tiers 1-3. Flexible Supplemental K-8 ELA & Math Online & Print
 Standards PLUS Flexible Supplemental K-8 ELA & Math Online & Print Grade 5 SAMPLER Mathematics EL Strategies DOK 1-4 RTI Tiers 1-3 15-20 Minute Lessons Assessments Consistent with CA Testing Technology
GCE. Mathematics (MEI) Mark Scheme for June Advanced Subsidiary GCE Unit 4766: Statistics 1. Oxford Cambridge and RSA Examinations
 Mark Scheme for June Advanced Subsidiary GCE Unit 4766: Statistics 1. Oxford Cambridge and RSA Examinations") GCE Mathematics (MEI) Advanced Subsidiary GCE Unit 4766: Statistics 1 Mark Scheme for June 2013 Oxford Cambridge and RSA Examinations OCR (Oxford Cambridge and RSA) is a leading UK awarding body, providing
GCE Mathematics (MEI) Advanced Subsidiary GCE Unit 4766: Statistics 1 Mark Scheme for June 2013 Oxford Cambridge and RSA Examinations OCR (Oxford Cambridge and RSA) is a leading UK awarding body, providing
STA 225: Introductory Statistics (CT)
") Marshall University College of Science Mathematics Department STA 225: Introductory Statistics (CT) Course catalog description A critical thinking course in applied statistical reasoning covering basic
Marshall University College of Science Mathematics Department STA 225: Introductory Statistics (CT) Course catalog description A critical thinking course in applied statistical reasoning covering basic
Arizona s College and Career Ready Standards Mathematics
 Arizona s College and Career Ready Mathematics Mathematical Practices Explanations and Examples First Grade ARIZONA DEPARTMENT OF EDUCATION HIGH ACADEMIC STANDARDS FOR STUDENTS State Board Approved June
Sample Problems for MATH 5001, University of Georgia
 Sample Problems for MATH 5001, University of Georgia 1 Give three different decimals that the bundled toothpicks in Figure 1 could represent In each case, explain why the bundled toothpicks can represent
Broward County Public Schools G rade 6 FSA Warm-Ups
 Day 1 1. A florist has 40 tulips, 32 roses, 60 daises, and 50 petunias. Draw a line from each comparison to match it to the correct ratio. A. tulips to roses B. daises to petunias C. roses to tulips D.
EDEXCEL FUNCTIONAL SKILLS PILOT
 EDEXCEL FUNCTIONAL SKILLS PILOT Maths Level 1 Chapter 6 Working with data and averages SECTION I Working with data 1 Collecting, recording and representing information 95 2 Interpreting data from tables
Answers: Year 4 Textbook 3 Pages 4 10
 Answers: Year 4 Textbook Pages 4 Page 4 1. 729 2. 8947. 6502 4. 2067 5. 480 6. 7521 > 860 7. 85 > 699 8. 9442< 9852 9. 4725 > 4572. 8244 < 9241 11. 026 < 211 12. A number between 20 and 4800 1. A number
Let s think about how to multiply and divide fractions by fractions!
 Let s think about how to multiply and divide fractions by fractions! June 25, 2007 (Monday) Takehaya Attached Elementary School, Tokyo Gakugei University Grade 6, Class # 1 (21 boys, 20 girls) Instructor:
Lesson M4. page 1 of 2
 Lesson M4 page 1 of 2 Miniature Gulf Coast Project Math TEKS Objectives 111.22 6b.1 (A) apply mathematics to problems arising in everyday life, society, and the workplace; 6b.1 (C) select tools, including
Written by Wendy Osterman
 Pre-Algebra Written by Wendy Osterman Editor: Alaska Hults Illustrator: Corbin Hillam Designer/Production: Moonhee Pak/Cari Helstrom Cover Designer: Barbara Peterson Art Director: Tom Cochrane Project
Standard 1: Number and Computation
 Standard 1: Number and Computation Standard 1: Number and Computation The student uses numerical and computational concepts and procedures in a variety of situations. Benchmark 1: Number Sense The student
Research Design & Analysis Made Easy! Brainstorming Worksheet
 Brainstorming Worksheet 1) Choose a Topic a) What are you passionate about? b) What are your library s strengths? c) What are your library s weaknesses? d) What is a hot topic in the field right now that
OCR for Arabic using SIFT Descriptors With Online Failure Prediction
 OCR for Arabic using SIFT Descriptors With Online Failure Prediction Andrey Stolyarenko, Nachum Dershowitz The Blavatnik School of Computer Science Tel Aviv University Tel Aviv, Israel Email: stloyare@tau.ac.il,
Mathematics Scoring Guide for Sample Test 2005
 Mathematics Scoring Guide for Sample Test 2005 Grade 4 Contents Strand and Performance Indicator Map with Answer Key...................... 2 Holistic Rubrics.......................................................
GCSE. Mathematics A. Mark Scheme for January General Certificate of Secondary Education Unit A503/01: Mathematics C (Foundation Tier)
") GCSE Mathematics A General Certificate of Secondary Education Unit A503/0: Mathematics C (Foundation Tier) Mark Scheme for January 203 Oxford Cambridge and RSA Examinations OCR (Oxford Cambridge and RSA)
GCSE Mathematics A General Certificate of Secondary Education Unit A503/0: Mathematics C (Foundation Tier) Mark Scheme for January 203 Oxford Cambridge and RSA Examinations OCR (Oxford Cambridge and RSA)
The following shows how place value and money are related. ones tenths hundredths thousandths
 2-1 The following shows how place value and money are related. ones tenths hundredths thousandths (dollars) (dimes) (pennies) (tenths of a penny) Write each fraction as a decimal and then say it. 1. 349
Visit us at:
 White Paper Integrating Six Sigma and Software Testing Process for Removal of Wastage & Optimizing Resource Utilization 24 October 2013 With resources working for extended hours and in a pressurized environment,
Name: Class: Date: ID: A
 Name: Class: _ Date: _ Test Review Multiple Choice Identify the choice that best completes the statement or answers the question. 1. Members of a high school club sold hamburgers at a baseball game to
The Editor s Corner. The. Articles. Workshops. Editor. Associate Editors. Also In This Issue
 The S tatistics T eacher N etwork www.amstat.org/education/stn Number 73 ASA/NCTM Joint Committee on the Curriculum in Statistics and Probability Fall 2008 The Editor s Corner We hope you enjoy Issue 73
Conversions among Fractions, Decimals, and Percents
 Conversions among Fractions, Decimals, and Percents Objectives To reinforce the use of a data table; and to reinforce renaming fractions as percents using a calculator and renaming decimals as percents.
Objective: Add decimals using place value strategies, and relate those strategies to a written method.
 NYS COMMON CORE MATHEMATICS CURRICULUM Lesson 9 5 1 Lesson 9 Objective: Add decimals using place value strategies, and relate those strategies to a written method. Suggested Lesson Structure Fluency Practice
Answer Key For The California Mathematics Standards Grade 1
 Introduction: Summary of Goals GRADE ONE By the end of grade one, students learn to understand and use the concept of ones and tens in the place value number system. Students add and subtract small numbers
MINUTE TO WIN IT: NAMING THE PRESIDENTS OF THE UNITED STATES
 MINUTE TO WIN IT: NAMING THE PRESIDENTS OF THE UNITED STATES THE PRESIDENTS OF THE UNITED STATES Project: Focus on the Presidents of the United States Objective: See how many Presidents of the United States
LLD MATH. Student Eligibility: Grades 6-8. Credit Value: Date Approved: 8/24/15
 PUBLIC SCHOOLS OF EDISON TOWNSHIP DIVISION OF CURRICULUM AND INSTRUCTION LLD MATH Length of Course: Elective/Required: School: Full Year Required Middle Schools Student Eligibility: Grades 6-8 Credit Value:
Spinners at the School Carnival (Unequal Sections)
") Spinners at the School Carnival (Unequal Sections) Maryann E. Huey Drake University maryann.huey@drake.edu Published: February 2012 Overview of the Lesson Students are asked to predict the outcomes of
Spinners at the School Carnival (Unequal Sections) Maryann E. Huey Drake University maryann.huey@drake.edu Published: February 2012 Overview of the Lesson Students are asked to predict the outcomes of
Algebra 2- Semester 2 Review
 Name Block Date Algebra 2- Semester 2 Review Non-Calculator 5.4 1. Consider the function f x 1 x 2. a) Describe the transformation of the graph of y 1 x. b) Identify the asymptotes. c) What is the domain
Mathematics Success Grade 7
 T894 Mathematics Success Grade 7 [OBJECTIVE] The student will find probabilities of compound events using organized lists, tables, tree diagrams, and simulations. [PREREQUISITE SKILLS] Simple probability,
TABE 9&10. Revised 8/2013- with reference to College and Career Readiness Standards
 TABE 9&10 Revised 8/2013- with reference to College and Career Readiness Standards LEVEL E Test 1: Reading Name Class E01- INTERPRET GRAPHIC INFORMATION Signs Maps Graphs Consumer Materials Forms Dictionary
Missouri Mathematics Grade-Level Expectations
 A Correlation of to the Grades K - 6 G/M-223 Introduction This document demonstrates the high degree of success students will achieve when using Scott Foresman Addison Wesley Mathematics in meeting the
Build on students informal understanding of sharing and proportionality to develop initial fraction concepts.
 Recommendation 1 Build on students informal understanding of sharing and proportionality to develop initial fraction concepts. Students come to kindergarten with a rudimentary understanding of basic fraction
FOR TEACHERS ONLY. The University of the State of New York REGENTS HIGH SCHOOL EXAMINATION PHYSICAL SETTING/PHYSICS
 PS P FOR TEACHERS ONLY The University of the State of New York REGENTS HIGH SCHOOL EXAMINATION PHYSICAL SETTING/PHYSICS Thursday, June 21, 2007 9:15 a.m. to 12:15 p.m., only SCORING KEY AND RATING GUIDE
2 nd Grade Math Curriculum Map
 .A.,.M.6,.M.8,.N.5,.N.7 Organizing Data in a Table Working with multiples of 5, 0, and 5 Using Patterns in data tables to make predictions and solve problems. Solving problems involving money. Using a
Grade 2: Using a Number Line to Order and Compare Numbers Place Value Horizontal Content Strand
 Grade 2: Using a Number Line to Order and Compare Numbers Place Value Horizontal Content Strand Texas Essential Knowledge and Skills (TEKS): (2.1) Number, operation, and quantitative reasoning. The student
APES Summer Work PURPOSE: THE ASSIGNMENT: DUE DATE: TEST:
 APES Summer Work PURPOSE: Like most science courses, APES involves math, data analysis, and graphing. Simple math concepts, like dealing with scientific notation, unit conversions, and percent increases,
Rendezvous with Comet Halley Next Generation of Science Standards
 Next Generation of Science Standards 5th Grade 6 th Grade 7 th Grade 8 th Grade 5-PS1-3 Make observations and measurements to identify materials based on their properties. MS-PS1-4 Develop a model that
Cal s Dinner Card Deals
 Cal s Dinner Card Deals Overview: In this lesson students compare three linear functions in the context of Dinner Card Deals. Students are required to interpret a graph for each Dinner Card Deal to help
Chapter 4 - Fractions
 . Fractions Chapter - Fractions 0 Michelle Manes, University of Hawaii Department of Mathematics These materials are intended for use with the University of Hawaii Department of Mathematics Math course
Guide to the Uniform mark scale (UMS) Uniform marks in A-level and GCSE exams
 Uniform marks in A-level and GCSE exams") Guide to the Uniform mark scale (UMS) Uniform marks in A-level and GCSE exams This booklet explains why the Uniform mark scale (UMS) is necessary and how it works. It is intended for exams officers and
Guide to the Uniform mark scale (UMS) Uniform marks in A-level and GCSE exams This booklet explains why the Uniform mark scale (UMS) is necessary and how it works. It is intended for exams officers and
Measurement. Time. Teaching for mastery in primary maths
 Measurement Time Teaching for mastery in primary maths Contents Introduction 3 01. Introduction to time 3 02. Telling the time 4 03. Analogue and digital time 4 04. Converting between units of time 5 05.
Bittinger, M. L., Ellenbogen, D. J., & Johnson, B. L. (2012). Prealgebra (6th ed.). Boston, MA: Addison-Wesley.
. Prealgebra (6th ed.). Boston, MA: Addison-Wesley.") Course Syllabus Course Description Explores the basic fundamentals of college-level mathematics. (Note: This course is for institutional credit only and will not be used in meeting degree requirements.
Course Syllabus Course Description Explores the basic fundamentals of college-level mathematics. (Note: This course is for institutional credit only and will not be used in meeting degree requirements.