Peggy C. Kirby, Ph.D. ed-cet, inc. September Part I. Louisiana TAP Schools, Teachers, and Students
|
|
|
- Ethan Bruce
- 5 years ago
- Views:
Transcription
1 THE TAP SYSTEM IN LOUISIANA SCHOOLS Peggy C. Kirby, Ph.D. ed-cet, inc. September 2009 Part I. Louisiana TAP Schools, Teachers, and Students The TAP System is designed to attract, develop, motivate, and retain high-quality teachers. Often misconstrued as merely a pay-for-performance or merit pay program, TAP actually is a comprehensive program of professional development, with performance pay just one of four key components. Equally important are multiple career paths; ongoing, applied professional development; and instructionally focused accountability. TAP was first introduced into Louisiana schools during the academic year. Beginning with just five schools in three parishes, the program expanded to 28 schools in ten parishes during the school year. It continues to grow, with a total of 41 schools for the school year. This is about 3% of Louisiana schools. Also, in the upcoming school year, another 26 schools are participating in the Louisiana Pre-TAP initiative in which they will learn about the TAP process. It is anticipated that many of the Pre-TAP schools will become TAP schools in the school year, bringing to almost 5% the proportion of Louisiana schools served by TAP. A complete list of active TAP and Pre-TAP schools is included in Appendix A. Chart 1 shows the growth in Louisiana TAP over the past seven school years. The only academic year in which the number of TAP schools decreased was A new superintendent in one large district decided to eliminate TAP in his district. He cited cost concerns. The district, however, did retain many professional development components from TAP, including master teachers who provide job-embedded professional development to new classroom teachers. The black line in Chart 1 indicates the linear growth trend based on past and predicted numbers of schools. Based on projected commitment of Pre-TAP schools and other identified interest, it is anticipated that TAP will exceed growth expectations by , in spite of the loss of schools in


2 Chart 2 shows the percentage of TAP schools in Louisiana by grade configuration for the school year. 2
 by the 2010-2011 school year.")
3 In , the 28 TAP schools provided ongoing professional development to 1,051 faculty who taught 13,613 students. The number of students in TAP schools is expected to increase to more than 30,000 (about 4.3% of Louisiana students) by the school year. Chart 3 below shows the growth in number of students in TAP schools since The trend line shows that the growth is likely to accelerate over the next two years. Note that no numbers are given for due to the daily enrollment fluctuations immediately after Hurricane Katrina (August 29, 2005). TAP schools tend to serve greater proportions of minority students and those eligible to receive free or reduced-price lunch based on family income than Louisiana public schools in general. In , TAP school students in Louisiana were approximately 87% non-white, and approximately 87% were eligible to receive free or reduced-price lunch. By contrast, there were 51.2% non-white students in all Louisiana public schools and 64.5% were eligible for free or reduced-price lunch (October 2008 Multiple Stats Report, retrieved August 1, 2009 from: 3

4 Over the past six years, TAP has served more and more students of low-income and minority families (see Chart 4). Part II. Student Achievement in Louisiana TAP Schools State Superintendent of Education Paul Pastorek set 18 Objectives for the school year. The TAP program addresses Objective 1 that concerns school performance and Objectives 6 and 7 that deal with school improvement processes. Superintendent Pastorek set a goal of increasing baseline school performance scores (SPS) by 2.34 points by spring Although at the time of this report, SPSs are not available for the school year, the LEAP and ileap scores suggest that the state has improved the percent of students scoring Basic and Above in all areas, except 4 th grade Math. As demonstrated in the next section, TAP schools contributed to these gains. TAP Student Performance on LEAP and ileap Table 1 includes the percent change in LEAP and ileap scores by grade level from to Only those TAP schools that included the respective grade levels in both and are included. The total number of students in these schools scoring Basic or Above on their grade-level tests was divided by the total number of students who took the test in each grade. Thus, the scores are weighted for school size. As with the state scores, the 4 th grade Math scores did decline slightly, roughly by 2 percent. All other Math and all ELA scores increased from to Of particular note are the 6 th grade ELA and Math, and the 9 th and 10 th grade Math scores which all improved by more than 10 percentage points. 4
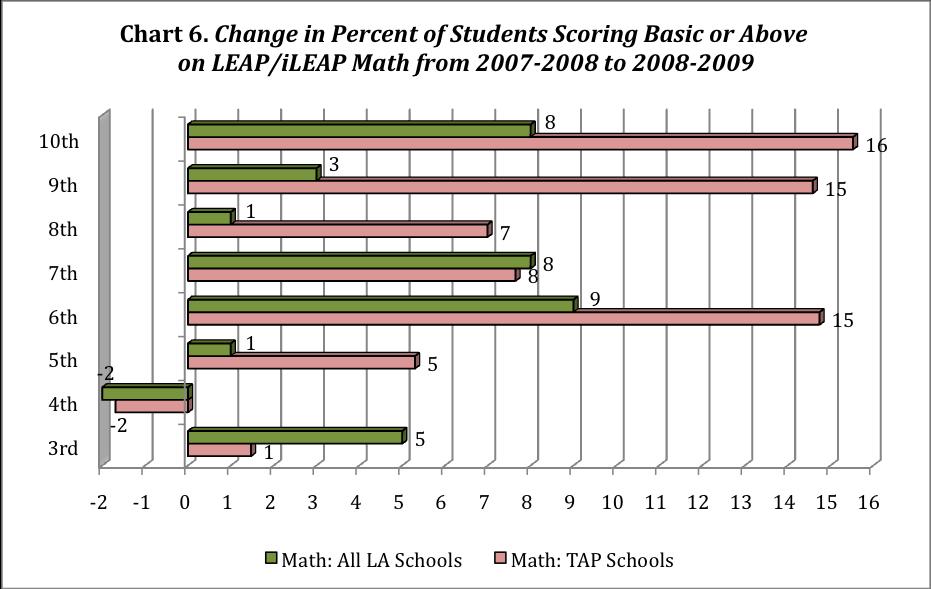
5 Table 1 Change in Percent of TAP Students Scoring Basic or Above on LEAP/iLEAP from to Grade # of schools Test ELA Math 3 18 ileap LEAP ileap ileap ileap LEAP ileap GEE TAP Student Performance in Comparison to Statewide Student Performance Not surprisingly, Louisiana TAP schools, most with more students at risk (as determined by percent free/reduced lunch) and more minority students, do not perform as well as Louisiana schools on average (see Table 2). However, the gains from to indicate that they are on a possible trajectory to close the achievement gap. Table 2. TAP School Performance as Compared to All Louisiana School Performance, Percent of Students Scoring Basic or Above Grade TAP ELA Louisiana ELA TAP Math Louisiana Math Note. Table includes all 28 TAP schools in school year Charts 5 (ELA) and 6 (Math) compare the growth in TAP schools to that of all Louisiana schools. TAP schools at least doubled the state gains in 4 th, 5 th, 9 th, and 10 th grade ELA, and in 5 th, 8 th, 9 th, and 10 th Math. Only in 3 rd grade did TAP schools perform lower than Louisiana schools in general. 5

6 6
7 Individual TAP School Performance The sections above address achievement of students in all TAP schools. This section concerns individual TAP school performance. Are the results discussed thus far reflective of each TAP school or are they skewed by a few high performing schools? Each school gave tests in grades 3 through 10 if they served those grade levels. Schools served anywhere from 1 tested grade in ELA and Math (e.g., high schools) to six tested grades in some K-8 schools. Table 3 below shows the total number of tested grades in for each school and the number of grades showing improvement, no change, or decline from to In ELA, 70 of 109 (64.2%) grades improved in the 27 schools. In math, there was improvement in 74 (67.9%) of 109 tested grades. Table 3 Number of Tested Grades Showing Improvement in ELA and Math in TAP Schools School Number ELA MATH of Tested Grades Number Improved No Change Number Declined Number Improved No Change Number Declined All Note: One of the twenty-eight TAP schools is not included because it opened in , thus having no comparison scores. 7

8 Another way to consider how much improvement there was at the school level is by the percent of schools with gains from to for specific grade levels. Chart 7 shows the percent of schools, for a specific grade, with student achievement gains from to in ELA and Math. For example, in the fourteen TAP schools with eighth graders, approximately 80% of those schools showed improvement in math and over 60% showed improvement in ELA. The majority of schools showed improvement at all grade levels in ELA and Math, except for in 3 rd and 7 th grade ELA and 4 th grade Math. Note: n represents the number of TAP schools with that particular grade level. Part III. Value Added Performance TAP schools receive a school-wide value added score based on longitudinal student performance. Unlike many measures of academic achievement that compare a student cohort in a particular grade level one year to a different cohort in that grade the following year, TAP value-added scores track individual student growth over time. Each teacher who teaches a tested grade level also receives an individual value added score based on the growth of his or her students. For the TAP schools in , value added scores covered the entire 5-point range. (Note: value-added scores are pending at the time of this report.) A score of five, the highest score possible, signifies far above average results and indicates progress of two standard errors above an expected full year s growth. A value-added student achievement score of four signifies above average results (one standard error above an expected full year s growth). A value-added score of three signifies a solid year s growth. 8
.")
9 Of the 35 schools that received value added scores for the school year, 16 received the top value added score (5), one received a 4, seven received 3s, eight received 2s and three received the lowest score of 1 (see Chart 8). Performance incentives are calculated on the basis of 1) the overall school value added score, 2) the teacher value added score if the teacher teaches a tested subject, and 3) multiple teacher observations by multiple observers. Teachers in the TAP schools discussed above earned performance incentives ranging from $0 to $7,125. The average teacher award was $1,647 and the average school-wide value added score was 3.5. The average teacher value added for those teachers who taught tested subjects was 3.1. Part IV. Teacher Attitudes Regarding TAP Each year the National Institute for Excellence in Teaching (NIET) administers the TAP Teacher Attitude Survey to determine teachers level of agreement and satisfaction (5- point scale with 1 indicating lowest level and 5 highest) with TAP components. The survey measures teachers perceptions of: 1. Multiple Career Paths - differentiated leadership and career advancement opportunities, 2. Ongoing Applied Professional Development - quality, benefit, and relevance of professional development under TAP, 3. Instructionally Focused Accountability understanding, trust, and benefits of the TAP evaluation system, 4. Performance-based Compensation differential compensation under TAP and financial impact, and 5. Collegiality colleagues, leadership, and school climate. 9
10 The results of the 2008 survey show that Louisiana teachers in general are more satisfied with all TAP components than teachers across the United States. U.S. and Louisiana average responses are compared in Chart 9. The majority of teachers supported (Strongly agreed or Agreed) instructionally focused accountability and ongoing professional development, with nearly 10% more Louisiana teachers Agreeing or Strongly agreeing that these elements are useful and important. About 70% of teachers in Louisiana and nationally Agreed or Strongly agreed that they were satisfied with the climate and collegiality of their schools under TAP. Fewer teachers agreed that they were involved in school-wide decision making or had opportunities to take on leadership roles. Although all TAP schools have three teacher paths career, mentor, and master only about 41% of Louisiana teachers found the concept of Multiple Career Paths directly relevant to them. If only the roughly 15 to 25 percent of teachers classified as Master or Mentor had supported the items in the Career Path sub-scale, the proportion Strongly Agreeing or Agreeing would be far less than 41%. Thus, this finding is actually positive in that a large proportion of career teachers are finding that they do have career growth opportunities. In fact, another 42% of teachers were neutral in their responses. Only 27% of teachers expressed more negative feelings about Multiple Career Paths. The Performance-based Compensation sub-scale received the lowest level of support from teachers (32% in Louisiana versus 27% nationally Strongly Agreeing or Agreeing). Items in this sub-scale ask whether teachers believe that their performance can be fairly and accurately evaluated by their principal, master teachers, and mentor teachers; whether they believe that teachers are the most important school factor in student achievement; and whether the impact of teachers on student achievement can be measured. As with the Multiple Career Paths sub-scale, the majority of teachers were neutral (38.8%) or positive (32.9%). Only 28% Disagreed or Strongly Disagreed with items in the Performance Compensation sub-scale. Because performance pay is the most controversial aspect of TAP, we decided to look at the scores of schools that had been in TAP longest. Average teacher attitude scores for the five schools that began TAP in 2004 and 2005 and remained through 2008 were compared to average attitude scores for all Louisiana TAP schools. This analysis confirms that, at least for Louisiana schools, those in TAP longest had teachers with more positive attitudes about all TAP components, including performance pay and career paths. These comparisons are shown in Chart

11 Percent of Teachers Strongly Agreeing or Agreeing with Items in Scale 11
12 Conclusions While many questions remain about the effectiveness of the TAP process in Louisiana schools, the following are promising indicators supported by the extant data: 1. The number of TAP schools in Louisiana is 8 times greater in than in , an indicator of its popularity among school administrators and teachers. 2. TAP schools tend to serve greater proportions of minority students and those eligible to receive free or reduced-price lunch based on family income than Louisiana public schools in general. 3. The TAP process is not an elementary school program as many had feared; about one-third of the TAP schools were middle or high schools and many more served students in grades K through Interest in TAP is evidenced by the 15 new TAP schools in and the 28 schools studying the process as pre-tap schools. 5. TAP schools at least doubled the state 2008 to 2009 gains in 4 th, 5 th, 9 th, and 10 th grade ELA, and in 5 th, 8 th, 9 th, and 10 th grade Math. 6. Teachers appear to be very positive about levels of collegiality, opportunities for professional development, and accountability with TAP. 7. Louisiana teachers whose schools have been in TAP longest have more positive attitudes toward multiple career paths and performance-based compensation than teachers in schools newer to TAP. 12
13 APPENDIX A LOUISIANA TAP AND PRE-TAP SCHOOLS & TAP SCHOOLS BY DISTRICT/SYSTEM ASCENSION PARISH Donaldsonville High School Lowery Intermediate School CADDO PARISH Cherokee Park Elementary DESOTO PARISH Mansfield High North Desoto Middle EAST BATON ROUGE PARISH Cedarcrest-Southmoor Elementary Crestworth Middle (discontinued TAP after school year) JEFFERSON PARISH William Hart Elementary Hazel Park/Hilda Knoff Elementary ORLEANS PARISH Alice Harte Elementary (Algiers Charter School Association) Edna Karr Secondary (Algiers Charter School Association) NATCHITOCHES PARISH George Parks Elementary/Junior High RAPIDES PARISH Forest Hill Elementary RECOVERY SCHOOL DISTRICT Algiers Technology Academy (Algiers Charter School Association) Martin Behrman Elementary (Algiers Charter School Association) Joseph Craig Elementary (Recovery School District N.O.) John Dibert Elementary (Recovery School District N.O.) Dwight D. Eisenhower Elementary (Algiers Charter School Assoc.) Laurel Elementary (Recovery School District N.O.) 13
14 William Fischer Elementary (Algiers Charter School Association) McDonogh 32 Elementary (Algiers Charter School Association) Sarah Reed Elementary (Recovery School District N.O.) Schaumberg Elementary (Recovery School District N.O.) Harriet Tubman Elementary (Algiers Charter School Association) O.P. Walker High School (Algiers Charter School Association) Fannie C. Williams Elementary (Recovery School District N.O.) ST. BERNARD PARISH St. Bernard Middle Trist Elementary NEW TAP SCHOOLS BY DISTRICT/SYSTEM IN DELHI CHARTER SCHOOL K-12 Delhi Elementary DESOTO PARISH Logansport Elementary Logansport High North Desoto High EAST BATON ROUGE PARISH Claiborne Elementary IBERIA PARISH Jeanerette Elementary Johnston Street Elementary RAPIDES PARISH Carter C. Raymond Elementary RECOVERY SCHOOL DISTRICT Habans Elementary (Recovery School District N.O.) James Johnson Elementary (Recovery School District N.O.) Live Oak Elementary (Recovery School District N.O.) Mary Coghill Elementary (Recovery School District N.O.) ST. BERNARD PARISH W. Smith Elementary ST. TAMMANY PARISH Alton Elementary 14
15 PRE-TAP SCHOOLS BY PARISH IN DESOTO PARISH Mansfield Middle 6-8 Mansfield Elementary 3-5 North Desoto Elementary PK-2 Pelican All-States High Stanley High EVANGELINE PARISH Basile High 5-12 Bayou Chicot Elementary PK-8 Mamou Elementary PK-4 W.W. Steward Elementary PK-4 JEFFERSON PARISH Woodland West Elementary ORLEANS PARISH Warren Easton High Benjamin Franklin Elementary Math-Science Magnet Mary Bethune Elementary Edward Hynes Charter McDonogh 35 Senior High McMain Secondary RECOVERY SCHOOL DISTRICT - LOUISIANA Dalton Elementary (Advance Baton Rouge) Glen Oaks Middle (Advance Baton Rouge) Lanier Elementary (Advance Baton Rouge) Prescott Middle (Advance Baton Rouge) Pointe Coupee Central High (Advance Baton Rouge) RED RIVER PARISH Red River Elementary ST. MARY PARISH Morgan City Junior High Wyandotte Elementary ST. TAMMANY PARISH Abney Elementary Bayou Lacombe Middle 15
Transportation Equity Analysis
 2015-16 Transportation Equity Analysis Each year the Seattle Public Schools updates the Transportation Service Standards and bus walk zone boundaries for use in the upcoming school year. For the 2014-15
Peer Influence on Academic Achievement: Mean, Variance, and Network Effects under School Choice
 Megan Andrew Cheng Wang Peer Influence on Academic Achievement: Mean, Variance, and Network Effects under School Choice Background Many states and municipalities now allow parents to choose their children
Testimony to the U.S. Senate Committee on Health, Education, Labor and Pensions. John White, Louisiana State Superintendent of Education
 Testimony to the U.S. Senate Committee on Health, Education, Labor and Pensions John White, Louisiana State Superintendent of Education October 3, 2017 Chairman Alexander, Senator Murray, members of the
For Your Future. For Our Future. ULS Strategic Framework
 For Your Future. For Our Future. ULS Strategic Framework Contents Mission Vision Development Introduction Framework For Your Future. For Our Future. Academic Success, Student Success & Educational Attainment
EXECUTIVE SUMMARY. Online courses for credit recovery in high schools: Effectiveness and promising practices. April 2017
 EXECUTIVE SUMMARY Online courses for credit recovery in high schools: Effectiveness and promising practices April 2017 Prepared for the Nellie Mae Education Foundation by the UMass Donahue Institute 1
Longitudinal Analysis of the Effectiveness of DCPS Teachers
 F I N A L R E P O R T Longitudinal Analysis of the Effectiveness of DCPS Teachers July 8, 2014 Elias Walsh Dallas Dotter Submitted to: DC Education Consortium for Research and Evaluation School of Education
Graduate Division Annual Report Key Findings
 Graduate Division 2010 2011 Annual Report Key Findings Trends in Admissions and Enrollment 1 Size, selectivity, yield UCLA s graduate programs are increasingly attractive and selective. Between Fall 2001
Miami-Dade County Public Schools
 ENGLISH LANGUAGE LEARNERS AND THEIR ACADEMIC PROGRESS: 2010-2011 Author: Aleksandr Shneyderman, Ed.D. January 2012 Research Services Office of Assessment, Research, and Data Analysis 1450 NE Second Avenue,
Undergraduates Views of K-12 Teaching as a Career Choice
 Undergraduates Views of K-12 Teaching as a Career Choice A Report Prepared for The Professional Educator Standards Board Prepared by: Ana M. Elfers Margaret L. Plecki Elise St. John Rebecca Wedel University
OFFICE OF ENROLLMENT MANAGEMENT. Annual Report
 2014-2015 OFFICE OF ENROLLMENT MANAGEMENT Annual Report Table of Contents 2014 2015 MESSAGE FROM THE VICE PROVOST A YEAR OF RECORDS 3 Undergraduate Enrollment 6 First-Year Students MOVING FORWARD THROUGH
African American Male Achievement Update
 Report from the Department of Research, Evaluation, and Assessment Number 8 January 16, 2009 African American Male Achievement Update AUTHOR: Hope E. White, Ph.D., Program Evaluation Specialist Department
NCEO Technical Report 27
 Home About Publications Special Topics Presentations State Policies Accommodations Bibliography Teleconferences Tools Related Sites Interpreting Trends in the Performance of Special Education Students
Wisconsin 4 th Grade Reading Results on the 2015 National Assessment of Educational Progress (NAEP)
") Wisconsin 4 th Grade Reading Results on the 2015 National Assessment of Educational Progress (NAEP) Main takeaways from the 2015 NAEP 4 th grade reading exam: Wisconsin scores have been statistically flat
Wisconsin 4 th Grade Reading Results on the 2015 National Assessment of Educational Progress (NAEP) Main takeaways from the 2015 NAEP 4 th grade reading exam: Wisconsin scores have been statistically flat
Charter School Performance Comparable to Other Public Schools; Stronger Accountability Needed
 April 2005 Report No. 05-21 Charter School Performance Comparable to Other Public Schools; Stronger Accountability Needed at a glance On average, charter school students are academically behind when they
Teacher Supply and Demand in the State of Wyoming
 Teacher Supply and Demand in the State of Wyoming Supply Demand Prepared by Robert Reichardt 2002 McREL To order copies of Teacher Supply and Demand in the State of Wyoming, contact McREL: Mid-continent
1.0 INTRODUCTION. The purpose of the Florida school district performance review is to identify ways that a designated school district can:
 1.0 INTRODUCTION 1.1 Overview Section 11.515, Florida Statutes, was created by the 1996 Florida Legislature for the purpose of conducting performance reviews of school districts in Florida. The statute
Financing Education In Minnesota
 Financing Education In Minnesota 2016-2017 Created with Tagul.com A Publication of the Minnesota House of Representatives Fiscal Analysis Department August 2016 Financing Education in Minnesota 2016-17
2015 High School Results: Summary Data (Part I)
") 1 2015 High School Results: Summary Data (Part I) October 27, 2015 Dr. Gregory E. Thornton CEO, Baltimore City Public Schools Theresa D. Jones Chief Achievement and Accountability Officer HS Data Summary
1 2015 High School Results: Summary Data (Part I) October 27, 2015 Dr. Gregory E. Thornton CEO, Baltimore City Public Schools Theresa D. Jones Chief Achievement and Accountability Officer HS Data Summary
Moving the Needle: Creating Better Career Opportunities and Workforce Readiness. Austin ISD Progress Report
 Moving the Needle: Creating Better Career Opportunities and Workforce Readiness Austin ISD Progress Report 2013 A Letter to the Community Central Texas Job Openings More than 150 people move to the Austin
The Impact of Honors Programs on Undergraduate Academic Performance, Retention, and Graduation
 University of Nebraska - Lincoln DigitalCommons@University of Nebraska - Lincoln Journal of the National Collegiate Honors Council - -Online Archive National Collegiate Honors Council Fall 2004 The Impact
learning collegiate assessment]
![learning collegiate assessment]](/thumbs/71/66063392.jpg "learning collegiate assessment]") [ collegiate learning assessment] INSTITUTIONAL REPORT 2005 2006 Kalamazoo College council for aid to education 215 lexington avenue floor 21 new york new york 10016-6023 p 212.217.0700 f 212.661.9766
[ collegiate learning assessment] INSTITUTIONAL REPORT 2005 2006 Kalamazoo College council for aid to education 215 lexington avenue floor 21 new york new york 10016-6023 p 212.217.0700 f 212.661.9766
Educational Attainment
 A Demographic and Socio-Economic Profile of Allen County, Indiana based on the 2010 Census and the American Community Survey Educational Attainment A Review of Census Data Related to the Educational Attainment
University-Based Induction in Low-Performing Schools: Outcomes for North Carolina New Teacher Support Program Participants in
 University-Based Induction in Low-Performing Schools: Outcomes for North Carolina New Teacher Support Program Participants in 2014-15 In this policy brief we assess levels of program participation and
Teach For America alumni 37,000+ Alumni working full-time in education or with low-income communities 86%
 About Teach For America Teach For America recruits, trains, and supports top college graduates and professionals who make an initial commitment to teach for two years in urban and rural public schools
Karla Brooks Baehr, Ed.D. Senior Advisor and Consultant The District Management Council
 Karla Brooks Baehr, Ed.D. Senior Advisor and Consultant The District Management Council This paper aims to inform the debate about how best to incorporate student learning into teacher evaluation systems
ILLINOIS DISTRICT REPORT CARD
 -6-525-2- HAZEL CREST SD 52-5 HAZEL CREST SD 52-5 HAZEL CREST, ILLINOIS and federal laws require public school districts to release report cards to the public each year. 2 7 ILLINOIS DISTRICT REPORT CARD
U VA THE CHANGING FACE OF UVA STUDENTS: SSESSMENT. About The Study
 About The Study U VA SSESSMENT In 6, the University of Virginia Office of Institutional Assessment and Studies undertook a study to describe how first-year students have changed over the past four decades.
Race, Class, and the Selective College Experience
 Race, Class, and the Selective College Experience Thomas J. Espenshade Alexandria Walton Radford Chang Young Chung Office of Population Research Princeton University December 15, 2009 1 Overview of NSCE
ILLINOIS DISTRICT REPORT CARD
 -6-525-2- Hazel Crest SD 52-5 Hazel Crest SD 52-5 Hazel Crest, ILLINOIS 2 8 ILLINOIS DISTRICT REPORT CARD and federal laws require public school districts to release report cards to the public each year.
In 2010, the Teach Plus-Indianapolis Teaching Policy Fellows, a cohort of early career educators teaching
 Introduction Dollars and Sense: Elevating the teaching profession by leveraging talent In 2010, the Teach Plus-Indianapolis Teaching Policy Fellows, a cohort of early career educators teaching in low-income
Delaware Performance Appraisal System Building greater skills and knowledge for educators
 Delaware Performance Appraisal System Building greater skills and knowledge for educators DPAS-II Guide for Administrators (Assistant Principals) Guide for Evaluating Assistant Principals Revised August
Shelters Elementary School
 Shelters Elementary School August 2, 24 Dear Parents and Community Members: We are pleased to present you with the (AER) which provides key information on the 23-24 educational progress for the Shelters
BENCHMARK TREND COMPARISON REPORT:
 National Survey of Student Engagement (NSSE) BENCHMARK TREND COMPARISON REPORT: CARNEGIE PEER INSTITUTIONS, 2003-2011 PREPARED BY: ANGEL A. SANCHEZ, DIRECTOR KELLI PAYNE, ADMINISTRATIVE ANALYST/ SPECIALIST
Implementing an Early Warning Intervention and Monitoring System to Keep Students On Track in the Middle Grades and High School
 Implementing an Early Warning Intervention and Monitoring System to Keep Students On Track in the Middle Grades and High School National High School Center Facilitator: Joseph Harris, Ph.D. Presenters:
ADDENDUM 2016 Template - Turnaround Option Plan (TOP) - Phases 1 and 2 St. Lucie Public Schools
 - Phases 1 and 2 St. Lucie Public Schools") ADDENDUM 2016 Template - Turnaround Option Plan (TOP) - Phases 1 and 2 St. Lucie Public Schools The district requests an additional year to implement the previously approved turnaround option. Evidence
ADDENDUM 2016 Template - Turnaround Option Plan (TOP) - Phases 1 and 2 St. Lucie Public Schools The district requests an additional year to implement the previously approved turnaround option. Evidence
Practices Worthy of Attention Step Up to High School Chicago Public Schools Chicago, Illinois
 Step Up to High School Chicago Public Schools Chicago, Illinois Summary of the Practice. Step Up to High School is a four-week transitional summer program for incoming ninth-graders in Chicago Public Schools.
Review of Student Assessment Data
 Reading First in Massachusetts Review of Student Assessment Data Presented Online April 13, 2009 Jennifer R. Gordon, M.P.P. Research Manager Questions Addressed Today Have student assessment results in
Cooper Upper Elementary School
 LIVONIA PUBLIC SCHOOLS www.livoniapublicschools.org/cooper 213-214 BOARD OF EDUCATION 213-14 Mark Johnson, President Colleen Burton, Vice President Dianne Laura, Secretary Tammy Bonifield, Trustee Dan
The Effects of Statewide Private School Choice on College Enrollment and Graduation
 E D U C A T I O N P O L I C Y P R O G R A M R E S E A RCH REPORT The Effects of Statewide Private School Choice on College Enrollment and Graduation Evidence from the Florida Tax Credit Scholarship Program
READY OR NOT? CALIFORNIA'S EARLY ASSESSMENT PROGRAM AND THE TRANSITION TO COLLEGE
 READY OR NOT? CALIFORNIA'S EARLY ASSESSMENT PROGRAM AND THE TRANSITION TO COLLEGE Michal Kurlaender University of California, Davis Policy Analysis for California Education March 16, 2012 This research
Enrollment Trends. Past, Present, and. Future. Presentation Topics. NCCC enrollment down from peak levels
 Presentation Topics 1. Enrollment Trends 2. Attainment Trends Past, Present, and Future Challenges & Opportunities for NC Community Colleges August 17, 217 Rebecca Tippett Director, Carolina Demography
An Empirical Analysis of the Effects of Mexican American Studies Participation on Student Achievement within Tucson Unified School District
 An Empirical Analysis of the Effects of Mexican American Studies Participation on Student Achievement within Tucson Unified School District Report Submitted June 20, 2012, to Willis D. Hawley, Ph.D., Special
Delaware Performance Appraisal System Building greater skills and knowledge for educators
 Delaware Performance Appraisal System Building greater skills and knowledge for educators DPAS-II Guide (Revised) for Teachers Updated August 2017 Table of Contents I. Introduction to DPAS II Purpose of
Effective Pre-school and Primary Education 3-11 Project (EPPE 3-11)
") Effective Pre-school and Primary Education 3-11 Project (EPPE 3-11) A longitudinal study funded by the DfES (2003 2008) Exploring pupils views of primary school in Year 5 Address for correspondence: EPPSE
Effective Pre-school and Primary Education 3-11 Project (EPPE 3-11) A longitudinal study funded by the DfES (2003 2008) Exploring pupils views of primary school in Year 5 Address for correspondence: EPPSE
NORTH CAROLINA VIRTUAL PUBLIC SCHOOL IN WCPSS UPDATE FOR FALL 2007, SPRING 2008, AND SUMMER 2008
 E&R Report No. 08.29 February 2009 NORTH CAROLINA VIRTUAL PUBLIC SCHOOL IN WCPSS UPDATE FOR FALL 2007, SPRING 2008, AND SUMMER 2008 Authors: Dina Bulgakov-Cooke, Ph.D., and Nancy Baenen ABSTRACT North
Learn & Grow. Lead & Show
 Learn & Grow Lead & Show LAKE WINDWARD ELEMENTARY STRATEGIC PLAN SY 2015/16 SY 2017/18 APPROVED AUGUST 2015 SECTION I. Strategic Planning Background and Approach In May 2012, the Georgia Board of Education
Ending Social Promotion:
 ENDING SOCIAL PROMOTION 1 Ending Social Promotion: Results from the First Two Years D E C E M B E R 1 9 9 9 M E L I S S A R O D E R I C K A N T H O N Y S. B R Y K B R I A N A. J A C O B J O H N Q. E A
Emerald Coast Career Institute N
 Okaloosa County School District Emerald Coast Career Institute N 2017-18 School Improvement Plan Okaloosa - 0791 - - 2017-18 SIP 500 ALABAMA ST, Crestview, FL 32536 [ no web address on file ] School Demographics
SASKATCHEWAN MINISTRY OF ADVANCED EDUCATION
 SASKATCHEWAN MINISTRY OF ADVANCED EDUCATION Report March 2017 Report compiled by Insightrix Research Inc. 1 3223 Millar Ave. Saskatoon, Saskatchewan T: 1-866-888-5640 F: 1-306-384-5655 Table of Contents
National Survey of Student Engagement (NSSE) Temple University 2016 Results
 Temple University 2016 Results") Introduction The National Survey of Student Engagement (NSSE) is administered by hundreds of colleges and universities every year (560 in 2016), and is designed to measure the amount of time and effort
Introduction The National Survey of Student Engagement (NSSE) is administered by hundreds of colleges and universities every year (560 in 2016), and is designed to measure the amount of time and effort
University of Toronto
 University of Toronto OFFICE OF THE VICE PRESIDENT AND PROVOST 1. Introduction A Framework for Graduate Expansion 2004-05 to 2009-10 In May, 2000, Governing Council Approved a document entitled Framework
The Talent Development High School Model Context, Components, and Initial Impacts on Ninth-Grade Students Engagement and Performance
 The Talent Development High School Model Context, Components, and Initial Impacts on Ninth-Grade Students Engagement and Performance James J. Kemple, Corinne M. Herlihy Executive Summary June 2004 In many
Omak School District WAVA K-5 Learning Improvement Plan
 Omak School District WAVA K-5 Learning Improvement Plan 2015-2016 Vision Omak School District is committed to success for all students and provides a wide range of high quality instructional programs and
JOB OUTLOOK 2018 NOVEMBER 2017 FREE TO NACE MEMBERS $52.00 NONMEMBER PRICE NATIONAL ASSOCIATION OF COLLEGES AND EMPLOYERS
 NOVEMBER 2017 FREE TO NACE MEMBERS $52.00 NONMEMBER PRICE JOB OUTLOOK 2018 NATIONAL ASSOCIATION OF COLLEGES AND EMPLOYERS 62 Highland Avenue, Bethlehem, PA 18017 www.naceweb.org 610,868.1421 TABLE OF CONTENTS
Two-thirds of APS Schools Increase on State CCRPI Scores
 Contact: Latisha Gray Office: 404-802-2816 Cell: 414-688-1478 Latisha.Gray@atlanta.k12.ga.us FOR IMMEDIATE RELEASE November 2, 2017 Two-thirds of APS s Increase on State CCRPI Scores 56 schools improve
4 Subgroup scores. 1 Index scores and Trend SPS indictors
 1.COMPREHENSIVE NEEDS ASSESSMENT (Look at page 44 of the Data Analysis Template for 1a and 1b) STRENGTHS 1a. Results of Comprehensive Needs Assessment 1a. Measures used to Determine School Needs: STRENGTHS
Executive Summary. Laurel County School District. Dr. Doug Bennett, Superintendent 718 N Main St London, KY
 Dr. Doug Bennett, Superintendent 718 N Main St London, KY 40741-1222 Document Generated On January 13, 2014 TABLE OF CONTENTS Introduction 1 Description of the School System 2 System's Purpose 4 Notable
SSTATE SYSIP STEMIC IMPROVEMENT PL A N APRIL 2016
 SSIP S TATE S Y S TEM I C I M P R O V EM EN T PL A N APRIL 2016 CONTENTS Acronym List... 2 Executive Summary... 3 Infrastructure Development... 5 1(a) Specify improvements that will be made to the State
Higher Education Six-Year Plans
 Higher Education Six-Year Plans 2018-2024 House Appropriations Committee Retreat November 15, 2017 Tony Maggio, Staff Background The Higher Education Opportunity Act of 2011 included the requirement for
College and Career Ready Performance Index, High School, Grades 9-12
 Dr. John D. Barge, State School Superintendent Making Education Work for All of Georgia s Students College and Career Ready Performance Index, High School, Grades 9-12 CONTENT MASTERY (END of COURSE TESTS
Iowa School District Profiles. Le Mars
 Iowa School District Profiles Overview This profile describes enrollment trends, student performance, income levels, population, and other characteristics of the public school district. The report utilizes
Cuero Independent School District
 Cuero Independent School District Texas Superintendent: Henry Lind Primary contact: Debra Baros, assistant superintendent* 1,985 students, prek-12, rural District Description Cuero Independent School District
PROFESSIONAL TREATMENT OF TEACHERS AND STUDENT ACADEMIC ACHIEVEMENT. James B. Chapman. Dissertation submitted to the Faculty of the Virginia
 PROFESSIONAL TREATMENT OF TEACHERS AND STUDENT ACADEMIC ACHIEVEMENT by James B. Chapman Dissertation submitted to the Faculty of the Virginia Polytechnic Institute and State University in partial fulfillment
A Pilot Study on Pearson s Interactive Science 2011 Program
 Final Report A Pilot Study on Pearson s Interactive Science 2011 Program Prepared by: Danielle DuBose, Research Associate Miriam Resendez, Senior Researcher Dr. Mariam Azin, President Submitted on August
The number of involuntary part-time workers,
 University of New Hampshire Carsey School of Public Policy CARSEY RESEARCH National Issue Brief #116 Spring 2017 Involuntary Part-Time Employment A Slow and Uneven Economic Recovery Rebecca Glauber The
Summary results (year 1-3)
") Summary results (year 1-3) Evaluation and accountability are key issues in ensuring quality provision for all (Eurydice, 2004). In Europe, the dominant arrangement for educational accountability is school
Summary results (year 1-3) Evaluation and accountability are key issues in ensuring quality provision for all (Eurydice, 2004). In Europe, the dominant arrangement for educational accountability is school
An Introduction to School Finance in Texas
 An Introduction to School Finance in Texas May 12, 2010 Sheryl Pace TTARA Research Foundation space@ttara.org (512) 472-8838 Texas Public Education System 1,300 school districts (#1 in the nation) 1,025
Collegiate Academies Response to Livingston School Facility RFA Submitted January 23, 2015
 Collegiate Academies Response to Livingston School Facility RFA Submitted January 23, 2015! I. APPLICANT INFORMATION Please provide the information below. Name of charter operator Application contact name
Is Open Access Community College a Bad Idea?
 Is Open Access Community College a Bad Idea? The authors of the book Community Colleges and the Access Effect argue that low expectations and outside pressure to produce more graduates could doom community
Governors and State Legislatures Plan to Reauthorize the Elementary and Secondary Education Act
 Governors and State Legislatures Plan to Reauthorize the Elementary and Secondary Education Act Summary In today s competitive global economy, our education system must prepare every student to be successful
FTE General Instructions
 Florida Department of Education Bureau of PK-20 Education Data Warehouse and Office of Funding and Financial Reporting FTE General Instructions 2017-18 Questions and comments regarding this publication
Improving recruitment, hiring, and retention practices for VA psychologists: An analysis of the benefits of Title 38
 Improving recruitment, hiring, and retention practices for VA psychologists: An analysis of the benefits of Title 38 Introduction / Summary Recent attention to Veterans mental health services has again
AMERICA READS*COUNTS PROGRAM EVALUATION. School Year
 AMERICA READS*COUNTS PROGRAM EVALUATION School Year 2014-15 October 2015 ABOUT THE LEDUC CENTER FOR CIVIC ENGAGEMENT The University of Massachusetts Dartmouth seeks to prepare students for life as active
A Guide to Adequate Yearly Progress Analyses in Nevada 2007 Nevada Department of Education
 A Guide to Adequate Yearly Progress Analyses in Nevada 2007 Nevada Department of Education Note: Additional information regarding AYP Results from 2003 through 2007 including a listing of each individual
Segmentation Study of Tulsa Area Higher Education Needs Ages 36+ March Prepared for: Conducted by:
 Segmentation Study of Tulsa Area Higher Education Needs Ages 36+ March 2004 * * * Prepared for: Tulsa Community College Tulsa, OK * * * Conducted by: Render, vanderslice & Associates Tulsa, Oklahoma Project
Evaluation of Hybrid Online Instruction in Sport Management
 Evaluation of Hybrid Online Instruction in Sport Management Frank Butts University of West Georgia fbutts@westga.edu Abstract The movement toward hybrid, online courses continues to grow in higher education
SANTIAGO CANYON COLLEGE STUDENT PLACEMENTOFFICE PROGRAM REVIEW SPRING SEMESTER, 2010
 SANTIAGO CANYON COLLEGE STUDENT PLACEMENTOFFICE PROGRAM REVIEW SPRING SEMESTER, 2010 Section I. Signature Page Signature of Program Leader Syed Rizvi Date: Printed Name/Title Signature of Vice President,
TULSA COMMUNITY COLLEGE
 TULSA COMMUNITY COLLEGE ANNUAL STUDENT ASSESSMENT REPORT 2001 2002 SUBMITTED TO THE OKLAHOMA STATE REGENTS FOR HIGHER EDUCATION NOVEMBER 2002 TCC Contact: Dr. John Kontogianes Executive Vice President
Improving Conceptual Understanding of Physics with Technology
 INTRODUCTION Improving Conceptual Understanding of Physics with Technology Heidi Jackman Research Experience for Undergraduates, 1999 Michigan State University Advisors: Edwin Kashy and Michael Thoennessen
Statistical Peers for Benchmarking 2010 Supplement Grade 11 Including Charter Schools NMSBA Performance 2010
 Statistical Peers for Benchmarking 2010 Supplement Grade 11 Including Charter Schools NMSBA Performance 2010 September 2010 River Dunavin 1 ALBUQUERQUE PUBLIC SCHOOLS BOARD OF EDUCATION PAULA MAES Vice
Running head: DELAY AND PROSPECTIVE MEMORY 1
 Running head: DELAY AND PROSPECTIVE MEMORY 1 In Press at Memory & Cognition Effects of Delay of Prospective Memory Cues in an Ongoing Task on Prospective Memory Task Performance Dawn M. McBride, Jaclyn
Suggested Citation: Institute for Research on Higher Education. (2016). College Affordability Diagnosis: Maine. Philadelphia, PA: Institute for
. College Affordability Diagnosis: Maine. Philadelphia, PA: Institute for") MAINE Suggested Citation: Institute for Research on Higher Education. (2016). College Affordability Diagnosis: Maine. Philadelphia, PA: Institute for Research on Higher Education, Graduate School of Education,
MAINE Suggested Citation: Institute for Research on Higher Education. (2016). College Affordability Diagnosis: Maine. Philadelphia, PA: Institute for Research on Higher Education, Graduate School of Education,
Trends & Issues Report
 Trends & Issues Report prepared by David Piercy & Marilyn Clotz Key Enrollment & Demographic Trends Options Identified by the Eight Focus Groups General Themes 4J Eugene School District 4J Eugene, Oregon
Principal vacancies and appointments
 Principal vacancies and appointments 2009 10 Sally Robertson New Zealand Council for Educational Research NEW ZEALAND COUNCIL FOR EDUCATIONAL RESEARCH TE RŪNANGA O AOTEAROA MŌ TE RANGAHAU I TE MĀTAURANGA
SELF-STUDY QUESTIONNAIRE FOR REVIEW of the COMPUTER SCIENCE PROGRAM
 Disclaimer: This Self Study was developed to meet the goals of the CAC Session at the 2006 Summit. It should not be considered as a model or a template. ABET Computing Accreditation Commission SELF-STUDY
Cooper Upper Elementary School
 LIVONIA PUBLIC SCHOOLS http://cooper.livoniapublicschools.org 215-216 Annual Education Report BOARD OF EDUCATION 215-16 Colleen Burton, President Dianne Laura, Vice President Tammy Bonifield, Secretary
Like much of the country, Detroit suffered significant job losses during the Great Recession.
 36 37 POPULATION TRENDS Economy ECONOMY Like much of the country, suffered significant job losses during the Great Recession. Since bottoming out in the first quarter of 2010, however, the city has seen
EDUCATIONAL ATTAINMENT
 EDUCATIONAL ATTAINMENT By 2030, at least 60 percent of Texans ages 25 to 34 will have a postsecondary credential or degree. Target: Increase the percent of Texans ages 25 to 34 with a postsecondary credential.
AB104 Adult Education Block Grant. Performance Year:
 AB104 Adult Education Block Grant Performance Year: 2015-2016 Funding source: AB104, Section 39, Article 9 Version 1 Release: October 9, 2015 Reporting & Submission Process Required Funding Recipient Content
K-12 Academic Intervention Plan. Academic Intervention Services (AIS) & Response to Intervention (RtI)
 & Response to Intervention (RtI)") K-12 Academic Intervention Plan Academic Intervention Services (AIS) & Response to Intervention (RtI) September 2016 June 2018 2016 2018 K 12 Academic Intervention Plan Table of Contents AIS Overview...Page
K-12 Academic Intervention Plan Academic Intervention Services (AIS) & Response to Intervention (RtI) September 2016 June 2018 2016 2018 K 12 Academic Intervention Plan Table of Contents AIS Overview...Page
Coming in. Coming in. Coming in
 212-213 Report Card for Glenville High School SCHOOL DISTRICT District results under review by the Ohio Department of Education based upon 211 findings by the Auditor of State. Achievement This grade combines
Arkansas Private Option Medicaid expansion is putting state taxpayers on the hook for millions in cost overruns
 Arkansas Private Option Medicaid expansion is putting state taxpayers on the hook for millions in cost overruns ObamaCare advocates repeatedly promise that Medicaid expansion is fully funded by the federal
School Competition and Efficiency with Publicly Funded Catholic Schools David Card, Martin D. Dooley, and A. Abigail Payne
 School Competition and Efficiency with Publicly Funded Catholic Schools David Card, Martin D. Dooley, and A. Abigail Payne Web Appendix See paper for references to Appendix Appendix 1: Multiple Schools
Price Sensitivity Analysis
 Executive Summary The present study set out to determine whether relationships existed between the change in tuition rates, tuition and fees rates, and tuition, fees, and room and board rates at Illinois
The Oregon Literacy Framework of September 2009 as it Applies to grades K-3
 The Oregon Literacy Framework of September 2009 as it Applies to grades K-3 The State Board adopted the Oregon K-12 Literacy Framework (December 2009) as guidance for the State, districts, and schools
Assessment Report Univ. North Carolina Asheville SA - Dean of Students
 Assessment Report Univ. North Carolina Asheville SA - Dean of Students Mission: The Dean of Students works with Housing and Student Life Operations, Residential Education, Citizenship Education (as well
Biological Sciences, BS and BA
 Student Learning Outcomes Assessment Summary Biological Sciences, BS and BA College of Natural Science and Mathematics AY 2012/2013 and 2013/2014 1. Assessment information collected Submitted by: Diane
Kansas Adequate Yearly Progress (AYP) Revised Guidance
 Revised Guidance") Kansas State Department of Education Kansas Adequate Yearly Progress (AYP) Revised Guidance Based on Elementary & Secondary Education Act, No Child Left Behind (P.L. 107-110) Revised May 2010 Revised May
Kansas State Department of Education Kansas Adequate Yearly Progress (AYP) Revised Guidance Based on Elementary & Secondary Education Act, No Child Left Behind (P.L. 107-110) Revised May 2010 Revised May
4.0 CAPACITY AND UTILIZATION
 4.0 CAPACITY AND UTILIZATION The capacity of a school building is driven by four main factors: (1) the physical size of the instructional spaces, (2) the class size limits, (3) the schedule of uses, and
Undergraduate Degree Requirements Regulations
 Undergraduate Degree Requirements Regulations LSU has the responsibility to protect its educational mission and the health and safety of its community and of the property therein, through regulating the