Maths KS3-4 Statistics
|
|
|
- William Washington
- 5 years ago
- Views:
Transcription
1 Maths KS3-4 Statistics 1
2 KS3-4 National Curriculum KS3 Statutory requirements: Pupils should be taught to: Statistics describe, interpret and compare observed distributions of a single variable through: appropriate graphical representation involving discrete, continuous and grouped data; and appropriate measures of central tendency (mean, mode, median) and spread (range, consideration of outliers) construct and interpret appropriate tables, charts, and diagrams, including frequency tables, bar charts, pie charts, and pictograms for categorical data, and vertical line (or bar) charts for ungrouped and grouped numerical data describe simple mathematical relationships between two variables (bivariate data) in observational and experimental contexts and illustrate using scatter graphs. draw and interpret box plots regarding quartiles and IQR create cumulative frequency diagrams and interpret them using measures of average and spread KS4 Statutory requirements: In addition to consolidating subject content from key stage 3, pupils should be taught to: infer properties of populations or distributions from a sample, whilst knowing the limitations of sampling interpret and construct tables and line graphs for time series data {construct and interpret diagrams for grouped discrete data and continuous data, i.e. histograms with equal and unequal class intervals and cumulative frequency graphs, and know their appropriate use interpret, analyse and compare the distributions of data sets from univariate empirical distributions through: appropriate graphical representation involving discrete, continuous and grouped data, {including box plots}; appropriate measures of central tendency (including modal class) and spread {including quartiles and inter-quartile range} apply statistics to describe a population use and interpret scatter graphs of bivariate data; recognise correlation and know that it does not indicate causation; draw estimated lines of best fit; make predictions; interpolate and extrapolate apparent trends whilst knowing the dangers of so doing 2
3 Introductory Week The weights (kg) of 15 children: 37, 42, 31, 35, 48, 29, 50, 36, 44, 28, 63, 35, 41, 52, 43 Lightest child: 28 kg Heaviest child: 63 kg Median: 41 kg Lower quartile: ¼ (n+1) th piece of (ordered) data* 15 items of data means n = = 16 ¼ (16) = 4 th item. 28, 29, 31, 35, 35, 36, 37, 41, 42, 43, 44, 48, 50, 52, is the 4 th item. *can also use ¼(n) and round up. Upper quartile: ¾ (n+1) th piece of (ordered) data* 15 items of data means n = = 16 ¾ (16) = 12 th item. 28, 29, 31, 35, 35, 36, 37, 41, 42, 43, 44, 48, 50, 52, is the 12 th item. *can also use ¾(n) and round up. Sometimes questions use Q0, Q1 etc: Q0 = minimum, Q1 = lower quartile, Q2 = median, Q3 = upper quartile, Q4 = maximum Interquartile range, IQR = Q3 - Q = 13 = IQR 3
4 Outliers: Items of data in the set smaller than Q1 (1.5 x IQR) or larger than Q 2 + (1.5 x IQR) are outliers. Task 1: a) What is the median number of petals? b) What is the interquartile range? c) What percentage of the daisies in the sample has fewer than 30 petals? Task 2: Work out the median and upper & lower quartiles for these data sets. Then draw box plots for all of them. a) Percentage achieved in a Statistics test: b) Minutes per day spent playing computer games: c) Time taken (in minutes) to solve a crossword puzzle: d) Weight in kg of year 10 boys: e) Height in cm of a group of year 10 girls:
5 Box Plots Terms & Comparisons 5
6 Task 1: 23 boys and 11 girls were given a maths test. Their scores are listed below: Boys: 7, 13, 15, 19, 35, 35, 37, 43, 44, 44, 45, 46, 47, 47, 49, 51, 52, 55, 55, 56, 78, 82, 91 Girls: 7, 18, 23, 47, 58, 63, 68, 72, 72, 75, 87 Use box plots to compare the differences between the boys and girls scores and comment on the differences. Comment on skew and distribution. Task 2: The data below shows the IQ of 11 Maths and 11 Geography university graduates. MATHS: 98, 103, 105, 99, 110, 94, 98, 100, 120, 117, 113 GEOGRAPHY: 93, 99, 110, 111, 95, 97, 90, 99, 92, 102, 103 a) Calculate the quartiles, median and interquartile range for each subject b) Use your data to draw box plots for each subject c) Comment on at least two aspects of your box plots to compare the IQs of the graduates. Task 3: The data below shows the price of petrol (to the nearest pence) at different locations for Shell and BP. SHELL: 130, 129, 132, 133, 136, 130, 129, 130, 130, 131, 133, 134, 140 BP: 131, 133, 133, 133, 132, 134, 138, 130, 133, 134, 135, 136, 137, 132, 135 a) Calculate the quartiles, median and interquartile range for each company b) Use your data to draw box plots for each company c) Comment on at least two aspects of your box plots to compare the price of petrol in each company. 6
7 Analysing frequency data & Cumulative Frequency Finding the mean from a frequency table: Number of goals scored by a team over 10 games. Number of goals (x) Frequency (f) fx x 2 = x 2 = x 5 = x 1 = 3 Total: Total number of goals = 15. Total number of games = = 1.5 = mean number of goals scored per game. Finding mean, mode and median in a grouped frequency table: The table below shows the number of minutes late some trains left a train station. Number of minutes late (m) Frequency (f) 0 < m < m < m < m < m 20 4 Modal number of minutes late is 4 < m 8 because that happened 13 times. Median number of minutes late: add up f, ( ) = 44. Median = the (n + 1)/2 value. 45/2 = Find the 22.5 th value. Add up the frequencies till the 22.5 th value is found: Number of minutes late (m) Cumulative frequency 0 < m < m = th train is in 4 < m 8 so median train was late by that much. Estimate mean number of minutes by which a train was late: Can t do f(x) on grouped classes. Have to find a single figure for f. Find midpoints. Midpoint of 0 < m 4 = 2. Midpoint of 4 < m 8 = 6, etc. Number of minutes late (m) Frequency (f) Midpoint (x) Total minutes late (fx) 0 < m x 2 = 22 4 < m x 6 = 78 8 < m x 10 = < m x 14 = < m x 18 = 72 Sum of f = 44. Sum of fx = 368. Estimate of mean = = 8.36 (2 d.p.) 7
8 Frequency diagrams from grouped data are called frequency polygons and they re plotted at the midpoints of the groups: Frequency Minutes late Unlike frequency polygons, cumulative frequency diagrams are plotted against the upper bounds of the groups. This table shows the lengths of 40 babies at birth: Length Frequency Cumulative frequency 30 < l < l < l < l < l Upper class boundaries are 35, 40, 45, 50, and 55. Cumulative frequency diagrams can be used to read off the quartiles and the median. Here, Q1 is the 10 th value, the median is the 20 th value, and Q3 is the 30 th value. 8
9 Task 1: Find the midpoint of each of these groups. a) b) c) Task 2: This table shows information about the ages of 60 people. a) Draw a frequency polygon and a cumulative frequency diagram from the data. b) Find the modal class and median value and estimate the mean. c) Use the cumulative frequency diagram to estimate the quartiles and IQR. d) Use your answers to c) to draw a box plot for this data. 9
10 Task 3: a) Draw a frequency polygon and a cumulative frequency diagram from the data. b) Find the modal class and median value and estimate the mean. c) Use the cumulative frequency diagram to estimate the quartiles and IQR. d) Use your answers to c) to draw a box plot for this data. Task 4: 30 students ran a cross-country race. Each student s time was recorded. The table shows information about these times. Time (t minutes) Frequency 10 t < t < t < t < t < 30 3 a) Draw a frequency polygon and a cumulative frequency diagram from the data. b) Find the modal class and median value and estimate the mean. c) Use the cumulative frequency diagram to estimate the quartiles and IQR. d) Use your answers to c) to draw a box plot for this data. 10

11 Time Series and Moving Averages This table shows the number of visitors to a seaside town: Quarter Year Visitors (1000s) If this information is plotted on a graph, it looks like this: This shows that there is a wide variation in the number of visitors depending on the season. There are far less in the autumn and winter than spring and summer. If we want to see a trend in the number of visitors, we calculate a 4-point moving average. Find the average number of visitors in the four quarters of 2005: ( ) 4 = Find the average number of visitors in the last three quarters of 2005 and first quarter of 2006: ( ) 4 = Find the average in the last two quarters of 2005 and the first two quarters of 2006: ( ) 4 = 12.75, etc. The last average we can find is for the last two quarters of 2006 and the first two quarters of We plot the moving averages on a graph, making sure that each average is plotted at the centre of the four quarters it covers: Slight downward trend in visitors. 11
12 1. Time always goes along the x-axis. 2. If the times are given as a period (e.g. 3 months) plot the point in the middle. 3. Points should be joined in order using a ruler. Task 1: This table shows the number of computer games sold in a supermarket each month from January to June Jan Feb Mar Apr May Jun a) Work out the three month moving averages for this information. b) Plot the data on a time series. Task 2: A shop sells DVD players. The table shows the number of DVD players sold in every three-month period from January 2003 to June Year Months Number of DVD players sold 2003 Jan Mar 58 Apr Jun 64 Jul Sep 86 Oct Dec Jan Mar 65 Apr Jun 70 a) Calculate the four point moving averages for this data. b) Plot it on a time series. c) Comment on the trend you observe in the moving averages. 12
13 Task 3: This table records how many detentions are given out per day by a teacher. Draw a time series graph for this data with a line for the moving average. Comment on the trend you observe. Week 1 Week 2 Week 3 Day Mon Tue Wed Thu Fri Mon Tue Wed Thu Fri Mon Tue Wed Thu Fri Deten tions Task 4: The data below gives information about the average number of children born per woman. a) Plot the data on a time-series graph with moving averages. b) Write down three conclusions about the information shown on your graph China Ireland UK Task 5: The Second World War was between 1939 and The table below shows information about the life expectancy in Germany, UK and USA between 1935 and Germany UK USA a) Plot the data on a time-series graph with moving averages. b) Write down three conclusions about the information shown on your graph. 13

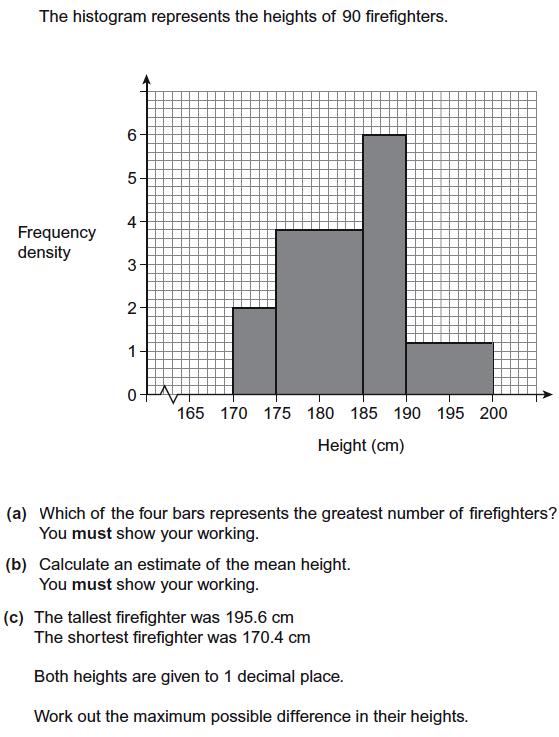
14 Histograms This table shows the ages of 25 children on a school bus: Age Frequency > 17 0 To draw a histogram you need the class boundaries. They are 5, 11, 16, and 18. The class widths are therefore 11 5 = 6, = 5, and = 2. The area of a histogram represents the frequency. So the area of the bars has to be 16, 5 and 4. Since it s the area and not the height that represents the frequency, instead of frequency on the y-axis, it has to say frequency density. Area = frequency = frequency density x class width. So frequency density = frequency class width. Task 1: 14
15 Task 1 continued: a) Finish the frequency table using the data. b) Plot a histogram using the table. Task 2: Task 3: Draw a histogram from this data. Height (x cm) Frequency 100 < x < x < x < x < x


16 Task 4: Draw a table with hours watched, frequency, and frequency density by reading this histogram. Task 5: Draw a table with height, frequency, and frequency density from this. Height (h) in cm 16
17 Types of Sampling Random sampling means every member of a population has an equal chance of being selected. You can do this using a table of random numbers or random number generators after somehow ordering the population. Example: Of 1000 pupils in a school, 50 are to be questioned about their favourite pop group. How should the pupils be chosen? Solution: The pupils should be numbered 000, 001, 002, You can use a calculator to generate random numbers. Three-digit random numbers can then be used to choose 50 pupils. Stratified sampling is made up of fractions of the population. The sample size for the fraction is proportional to the size of the fraction in the population. Example: Go back to the survey in which 50 pupils in a school of a 1000 pupils were asked what music they liked. To make sure the survey is accurate you will need a range of pupils across the year groups - different fractions. Pupils in year 7 may like different music to those in year 11. Solution: To work out the sample size for year 7: There are 180 students in year 7 - this is the size of the fraction. There are 1000 pupils in the school - this is the size of the whole population. You want answers from 50 people in total - this is the size of the whole sample. So we want 50/1000 of the population, so for year 7 we want 50/1000 of 180. (50/1000) x 180 = 9. Year Number of pupils Number of pupils in sample (50/1000) x 180 = (50/1000) x 200 = (50/1000) x 240 = (50/1000) x 220 = (50/1000) x 160 = 8 Systematic sampling: A regular pattern is used to choose the sample. Every item in the population is listed, a starting point is randomly chosen and then every nth item is selected. For example, a mixed (male and female) class could be listed in alphabetical order and every sixth student selected, starting with the 3rd student. This is a simpler and quicker method to select a (random) sample, but may be unrepresentative if a pattern exists in the list. For example, every sixth student in the above sample may be a girl. 17
18 Task 1: The table below shows the number of pupils in years Year Number of Pupils How many pupils from each year should be selected to give a stratified sample of 10%? Task 2: Juliet lives on a housing estate. The table below gives the number of people in each age group who live on her estate. Age in years No. of people For her Geography project she chooses a stratified sample of 10% which reflects these age groups. Calculate the number of people she should include from each group. Give each of your answers to the nearest whole number. Task 3: There are 180 pupils on the register at a particular primary school. The table below shows the number of pupils in each year. Year Number How many students need to be selected from each year to give a stratified sample of 36 pupils? Task 4: Twelve boxes of books are delivered to a school. Altogether there are 300 books delivered. From these books, 192 books are paper-back, whilst the remaining are hard-back. How many books would I need to select from each category for a 5% stratified sample? Task 5: The table below shows the number of drink cartons that are filled in one hour by a factory: Flavour Apple Orange Pineapple Tropical Strawberry No. of Cartons How many cartons need to be selected from each flavour to give: a) A 10% stratified sample? b) A stratified sample of 150 cartons? 18
19 Questionnaires Questionnaires can include: yes/no answers tick boxes numbered responses word responses questions which require a sentence to be written Whichever style of questions you use, it is important that they: Are easy to understand Cover every possible answer Are unbiased (they do not lead respondents to give a particular answer) Are unambiguous (they have a clear meaning). Example: Problems: 1. No units are given for distance 0 to 2 miles? Kilometres? 2. Boxes overlap. Exactly 2 could go in 0 to 2 and 2 to All possible answers are not covered there is no box for more than 6. 19
20 Task 1: Look at these questionnaire questions. Explain what is wrong with each of them and rewrite them. a) How old are you (in years)? 20 or younger 20 to to to or older b) How much do you usually spend on biscuits each week? a lot a little nothing don't know c) How old are you? less than 18 years old more than 18 years old d) How much money do you spend on magazines? e) Do you agree that pizza is better than pasta? Yes/No f) What do you think of the changes in the canteen? Excellent Very good Good 20
 A group of people go sailing in the ratio - number of adults : number of children = 1 : 2 What fraction of the group are adults? (c) On Sunday all the children do the activity they choose.")
21 Exam Questions 1. (a) 3 adults can help with walking on Saturday. Is this enough? Show your working. (b) A group of people go sailing in the ratio - number of adults : number of children = 1 : 2 What fraction of the group are adults? (c) On Sunday all the children do the activity they choose. The ratios for each activity are shown in the table. Activity Adult : children ratio Archery 1 : 3 Walking 1 : 5 Sailing 1 : 2 Work out the total number of adults needed for Sunday. 21

22 Complete the pie chart. 22
 Pick the correct descriptions of the correlation of the 3 scatter graphs. i. Strong positive correlation ii. Weak positive correlation iii. Little or no correlation iv.")
23 5. (a) One of the eggs has a length of 52 mm. What is its width? (b) All the points except one show strong correlation. Which point doesn t? (c) Pick the correct descriptions of the correlation of the 3 scatter graphs. i. Strong positive correlation ii. Weak positive correlation iii. Little or no correlation iv. Weak negative correlation v. Strong negative correlation 23
24 6. a) Can you use this table to calculate the exact median? Yes/No b) Can you use this table to work out the weight of the heaviest rabbit? Yes/No c) Calculate an estimate of the mean weight of the 200 rabbits. d) Here are the weights in grams of 10 more rabbits: 76.2, 89.4, 93.1, 99.7, 86.8, 79.2, 82.6, 91.9, 88.0, 95.4 Complete this table with tallies for those 10 rabbits and frequencies for all 210 rabbits. e) Which two of these four diagrams would be best to represent this data? i. stem-and-leaf ii. frequency polygon iii. scatter graph iv. histogram 24
25 7. (a) (b) Two of the sacks are chosen. The first sack has 17 more potatoes than the second sack. What is the greatest possible number of potatoes in the first sack? 8. 25
 Who was faster on average, men or women?")
26 9. 80 men were also timed solving the puzzle. Median Interquartile range 16 minutes 17 minutes a) Who was faster on average, men or women? b) Who was more consistent, men or women? 26
 Use your line to predict the fuel used to travel 110km. 27")
27 a) Plot the scatter graph. b) Draw a line of best fit. c) Use your line to predict the fuel used to travel 110km. 27
28 12. 30,000 magazines were sold in wales. How many were sold in total? 13. Amina asks 50 people, What is your favourite pet? Choose from cat, dog, rabbit or other. a) Which two words from those below describe the type of data she collects from each person? qualitative, continuous, primary, secondary b) Which two diagrams from those below could she use to represent the data? scatter graph, pie chart, bar chart, stem-and-leaf 14. In a survey people chose A, B, C, or D. 150 people chose B. Work out how many chose A. 28
29 15. The top 10% of the students are awarded a distinction. Estimate the mark needed for a distinction. 29
30 16. 30
31 17. 31
32 18. How much did the 800 tickets cost altogether? 32
33 19. 33

34
Probability and Statistics Curriculum Pacing Guide
 Unit 1 Terms PS.SPMJ.3 PS.SPMJ.5 Plan and conduct a survey to answer a statistical question. Recognize how the plan addresses sampling technique, randomization, measurement of experimental error and methods
Edexcel GCSE. Statistics 1389 Paper 1H. June Mark Scheme. Statistics Edexcel GCSE
 Edexcel GCSE Statistics 1389 Paper 1H June 2007 Mark Scheme Edexcel GCSE Statistics 1389 NOTES ON MARKING PRINCIPLES 1 Types of mark M marks: method marks A marks: accuracy marks B marks: unconditional
Measures of the Location of the Data
 OpenStax-CNX module m46930 1 Measures of the Location of the Data OpenStax College This work is produced by OpenStax-CNX and licensed under the Creative Commons Attribution License 3.0 The common measures
Lesson M4. page 1 of 2
 Lesson M4 page 1 of 2 Miniature Gulf Coast Project Math TEKS Objectives 111.22 6b.1 (A) apply mathematics to problems arising in everyday life, society, and the workplace; 6b.1 (C) select tools, including
Shockwheat. Statistics 1, Activity 1
 Statistics 1, Activity 1 Shockwheat Students require real experiences with situations involving data and with situations involving chance. They will best learn about these concepts on an intuitive or informal
Student s Edition. Grade 6 Unit 6. Statistics. Eureka Math. Eureka Math
 Student s Edition Grade 6 Unit 6 Statistics Eureka Math Eureka Math Lesson 1 Lesson 1: Posing Statistical Questions Statistics is about using data to answer questions. In this module, the following four
STT 231 Test 1. Fill in the Letter of Your Choice to Each Question in the Scantron. Each question is worth 2 point.
 STT 231 Test 1 Fill in the Letter of Your Choice to Each Question in the Scantron. Each question is worth 2 point. 1. A professor has kept records on grades that students have earned in his class. If he
Numeracy Medium term plan: Summer Term Level 2C/2B Year 2 Level 2A/3C
 Numeracy Medium term plan: Summer Term Level 2C/2B Year 2 Level 2A/3C Using and applying mathematics objectives (Problem solving, Communicating and Reasoning) Select the maths to use in some classroom
Functional Skills Mathematics Level 2 sample assessment
 Functional Skills Mathematics Level 2 sample assessment Sample paper 3 Candidate Name (First, Middle, Last) www.cityandguilds.com May 2015 Version 1-3 Total marks Task Mark Candidate enrolment number DOB
Introduction to the Practice of Statistics
 Chapter 1: Looking at Data Distributions Introduction to the Practice of Statistics Sixth Edition David S. Moore George P. McCabe Bruce A. Craig Statistics is the science of collecting, organizing and
Functional Skills Mathematics Level 2 assessment
 Functional Skills Mathematics Level 2 assessment www.cityandguilds.com September 2015 Version 1.0 Marking scheme ONLINE V2 Level 2 Sample Paper 4 Mark Represent Analyse Interpret Open Fixed S1Q1 3 3 0
Algebra 1, Quarter 3, Unit 3.1. Line of Best Fit. Overview
 Algebra 1, Quarter 3, Unit 3.1 Line of Best Fit Overview Number of instructional days 6 (1 day assessment) (1 day = 45 minutes) Content to be learned Analyze scatter plots and construct the line of best
Broward County Public Schools G rade 6 FSA Warm-Ups
 Day 1 1. A florist has 40 tulips, 32 roses, 60 daises, and 50 petunias. Draw a line from each comparison to match it to the correct ratio. A. tulips to roses B. daises to petunias C. roses to tulips D.
EDEXCEL FUNCTIONAL SKILLS PILOT
 EDEXCEL FUNCTIONAL SKILLS PILOT Maths Level 1 Chapter 6 Working with data and averages SECTION I Working with data 1 Collecting, recording and representing information 95 2 Interpreting data from tables
MINUTE TO WIN IT: NAMING THE PRESIDENTS OF THE UNITED STATES
 MINUTE TO WIN IT: NAMING THE PRESIDENTS OF THE UNITED STATES THE PRESIDENTS OF THE UNITED STATES Project: Focus on the Presidents of the United States Objective: See how many Presidents of the United States
STA 225: Introductory Statistics (CT)
") Marshall University College of Science Mathematics Department STA 225: Introductory Statistics (CT) Course catalog description A critical thinking course in applied statistical reasoning covering basic
Marshall University College of Science Mathematics Department STA 225: Introductory Statistics (CT) Course catalog description A critical thinking course in applied statistical reasoning covering basic
AP Statistics Summer Assignment 17-18
 AP Statistics Summer Assignment 17-18 Welcome to AP Statistics. This course will be unlike any other math class you have ever taken before! Before taking this course you will need to be competent in basic
Using Proportions to Solve Percentage Problems I
 RP7-1 Using Proportions to Solve Percentage Problems I Pages 46 48 Standards: 7.RP.A. Goals: Students will write equivalent statements for proportions by keeping track of the part and the whole, and by
Grade 6: Correlated to AGS Basic Math Skills
 Grade 6: Correlated to AGS Basic Math Skills Grade 6: Standard 1 Number Sense Students compare and order positive and negative integers, decimals, fractions, and mixed numbers. They find multiples and
May To print or download your own copies of this document visit Name Date Eurovision Numeracy Assignment
 1. An estimated one hundred and twenty five million people across the world watch the Eurovision Song Contest every year. Write this number in figures. 2. Complete the table below. 2004 2005 2006 2007
Chapters 1-5 Cumulative Assessment AP Statistics November 2008 Gillespie, Block 4
 Chapters 1-5 Cumulative Assessment AP Statistics Name: November 2008 Gillespie, Block 4 Part I: Multiple Choice This portion of the test will determine 60% of your overall test grade. Each question is
Paper 2. Mathematics test. Calculator allowed. First name. Last name. School KEY STAGE TIER
 259574_P2 5-7_KS3_Ma.qxd 1/4/04 4:14 PM Page 1 Ma KEY STAGE 3 TIER 5 7 2004 Mathematics test Paper 2 Calculator allowed Please read this page, but do not open your booklet until your teacher tells you
GCSE Mathematics B (Linear) Mark Scheme for November Component J567/04: Mathematics Paper 4 (Higher) General Certificate of Secondary Education
 Mark Scheme for November Component J567/04: Mathematics Paper 4 (Higher) General Certificate of Secondary Education") GCSE Mathematics B (Linear) Component J567/04: Mathematics Paper 4 (Higher) General Certificate of Secondary Education Mark Scheme for November 2014 Oxford Cambridge and RSA Examinations OCR (Oxford Cambridge
GCSE Mathematics B (Linear) Component J567/04: Mathematics Paper 4 (Higher) General Certificate of Secondary Education Mark Scheme for November 2014 Oxford Cambridge and RSA Examinations OCR (Oxford Cambridge
Association Between Categorical Variables
 Student Outcomes Students use row relative frequencies or column relative frequencies to informally determine whether there is an association between two categorical variables. Lesson Notes In this lesson,
Level 1 Mathematics and Statistics, 2015
 91037 910370 1SUPERVISOR S Level 1 Mathematics and Statistics, 2015 91037 Demonstrate understanding of chance and data 9.30 a.m. Monday 9 November 2015 Credits: Four Achievement Achievement with Merit
Algebra 2- Semester 2 Review
 Name Block Date Algebra 2- Semester 2 Review Non-Calculator 5.4 1. Consider the function f x 1 x 2. a) Describe the transformation of the graph of y 1 x. b) Identify the asymptotes. c) What is the domain
Research Design & Analysis Made Easy! Brainstorming Worksheet
 Brainstorming Worksheet 1) Choose a Topic a) What are you passionate about? b) What are your library s strengths? c) What are your library s weaknesses? d) What is a hot topic in the field right now that
MULTIPLE CHOICE. Choose the one alternative that best completes the statement or answers the question.
 Ch 2 Test Remediation Work Name MULTIPLE CHOICE. Choose the one alternative that best completes the statement or answers the question. Provide an appropriate response. 1) High temperatures in a certain
The Editor s Corner. The. Articles. Workshops. Editor. Associate Editors. Also In This Issue
 The S tatistics T eacher N etwork www.amstat.org/education/stn Number 73 ASA/NCTM Joint Committee on the Curriculum in Statistics and Probability Fall 2008 The Editor s Corner We hope you enjoy Issue 73
Mathacle PSet Stats, Concepts in Statistics and Probability Level Number Name: Date:
 1 st Quarterly Exam ~ Sampling, Designs, Exploring Data and Regression Part 1 Review I. SAMPLING MC I-1.) [APSTATSMC2014-6M] Approximately 52 percent of all recent births were boys. In a simple random
Mathematics process categories
 Mathematics process categories All of the UK curricula define multiple categories of mathematical proficiency that require students to be able to use and apply mathematics, beyond simple recall of facts
Paper Reference. Edexcel GCSE Mathematics (Linear) 1380 Paper 1 (Non-Calculator) Foundation Tier. Monday 6 June 2011 Afternoon Time: 1 hour 30 minutes
 1380 Paper 1 (Non-Calculator) Foundation Tier. Monday 6 June 2011 Afternoon Time: 1 hour 30 minutes") Centre No. Candidate No. Paper Reference 1 3 8 0 1 F Paper Reference(s) 1380/1F Edexcel GCSE Mathematics (Linear) 1380 Paper 1 (Non-Calculator) Foundation Tier Monday 6 June 2011 Afternoon Time: 1 hour
Centre No. Candidate No. Paper Reference 1 3 8 0 1 F Paper Reference(s) 1380/1F Edexcel GCSE Mathematics (Linear) 1380 Paper 1 (Non-Calculator) Foundation Tier Monday 6 June 2011 Afternoon Time: 1 hour
Lesson 12. Lesson 12. Suggested Lesson Structure. Round to Different Place Values (6 minutes) Fluency Practice (12 minutes)
 Fluency Practice (12 minutes)") Objective: Solve multi-step word problems using the standard addition reasonableness of answers using rounding. Suggested Lesson Structure Fluency Practice Application Problems Concept Development Student
Objective: Solve multi-step word problems using the standard addition reasonableness of answers using rounding. Suggested Lesson Structure Fluency Practice Application Problems Concept Development Student
Name: Class: Date: ID: A
 Name: Class: _ Date: _ Test Review Multiple Choice Identify the choice that best completes the statement or answers the question. 1. Members of a high school club sold hamburgers at a baseball game to
Math-U-See Correlation with the Common Core State Standards for Mathematical Content for Third Grade
 Math-U-See Correlation with the Common Core State Standards for Mathematical Content for Third Grade The third grade standards primarily address multiplication and division, which are covered in Math-U-See
AGS THE GREAT REVIEW GAME FOR PRE-ALGEBRA (CD) CORRELATED TO CALIFORNIA CONTENT STANDARDS
 CORRELATED TO CALIFORNIA CONTENT STANDARDS") AGS THE GREAT REVIEW GAME FOR PRE-ALGEBRA (CD) CORRELATED TO CALIFORNIA CONTENT STANDARDS 1 CALIFORNIA CONTENT STANDARDS: Chapter 1 ALGEBRA AND WHOLE NUMBERS Algebra and Functions 1.4 Students use algebraic
AGS THE GREAT REVIEW GAME FOR PRE-ALGEBRA (CD) CORRELATED TO CALIFORNIA CONTENT STANDARDS 1 CALIFORNIA CONTENT STANDARDS: Chapter 1 ALGEBRA AND WHOLE NUMBERS Algebra and Functions 1.4 Students use algebraic
Functional Maths Skills Check E3/L x
 Functional Maths Skills Check E3/L1 Name: Date started: The Four Rules of Number + - x May 2017. Kindly contributed by Nicola Smith, Gloucestershire College. Search for Nicola on skillsworkshop.org Page
EDEXCEL FUNCTIONAL SKILLS PILOT. Maths Level 2. Chapter 7. Working with probability
 Working with probability 7 EDEXCEL FUNCTIONAL SKILLS PILOT Maths Level 2 Chapter 7 Working with probability SECTION K 1 Measuring probability 109 2 Experimental probability 111 3 Using tables to find the
The lab is designed to remind you how to work with scientific data (including dealing with uncertainty) and to review experimental design.
 and to review experimental design.") Name: Partner(s): Lab #1 The Scientific Method Due 6/25 Objective The lab is designed to remind you how to work with scientific data (including dealing with uncertainty) and to review experimental design.
Name: Partner(s): Lab #1 The Scientific Method Due 6/25 Objective The lab is designed to remind you how to work with scientific data (including dealing with uncertainty) and to review experimental design.
Characteristics of Functions
 Characteristics of Functions Unit: 01 Lesson: 01 Suggested Duration: 10 days Lesson Synopsis Students will collect and organize data using various representations. They will identify the characteristics
MODULE FRAMEWORK AND ASSESSMENT SHEET
 MODULE FRAMEWORK AND ASSESSMENT SHEET LEARNING OUTCOMES (LOS) ASSESSMENT STANDARDS (ASS) FORMATIVE ASSESSMENT ASs Pages and (mark out of ) LOs (ave. out of ) SUMMATIVE ASSESSMENT Tasks or tests Ave for
CONSTRUCTION OF AN ACHIEVEMENT TEST Introduction One of the important duties of a teacher is to observe the student in the classroom, laboratory and
 CONSTRUCTION OF AN ACHIEVEMENT TEST Introduction One of the important duties of a teacher is to observe the student in the classroom, laboratory and in other settings. He may also make use of tests in
Science Fair Project Handbook
 Science Fair Project Handbook IDENTIFY THE TESTABLE QUESTION OR PROBLEM: a) Begin by observing your surroundings, making inferences and asking testable questions. b) Look for problems in your life or surroundings
Statistics and Probability Standards in the CCSS- M Grades 6- HS
 Statistics and Probability Standards in the CCSS- M Grades 6- HS Grade 6 Develop understanding of statistical variability. -6.SP.A.1 Recognize a statistical question as one that anticipates variability
The following shows how place value and money are related. ones tenths hundredths thousandths
 2-1 The following shows how place value and money are related. ones tenths hundredths thousandths (dollars) (dimes) (pennies) (tenths of a penny) Write each fraction as a decimal and then say it. 1. 349
Montana Content Standards for Mathematics Grade 3. Montana Content Standards for Mathematical Practices and Mathematics Content Adopted November 2011
 Montana Content Standards for Mathematics Grade 3 Montana Content Standards for Mathematical Practices and Mathematics Content Adopted November 2011 Contents Standards for Mathematical Practice: Grade
Simple Random Sample (SRS) & Voluntary Response Sample: Examples: A Voluntary Response Sample: Examples: Systematic Sample Best Used When
 & Voluntary Response Sample: Examples: A Voluntary Response Sample: Examples: Systematic Sample Best Used When") Simple Random Sample (SRS) & Voluntary Response Sample: In statistics, a simple random sample is a group of people who have been chosen at random from the general population. A simple random sample is
Simple Random Sample (SRS) & Voluntary Response Sample: In statistics, a simple random sample is a group of people who have been chosen at random from the general population. A simple random sample is
Primary National Curriculum Alignment for Wales
 Mathletics and the Welsh Curriculum This alignment document lists all Mathletics curriculum activities associated with each Wales course, and demonstrates how these fit within the National Curriculum Programme
Enhancing Students Understanding Statistics with TinkerPlots: Problem-Based Learning Approach
 Enhancing Students Understanding Statistics with TinkerPlots: Problem-Based Learning Approach Krongthong Khairiree drkrongthong@gmail.com International College, Suan Sunandha Rajabhat University, Bangkok,
Statistical Studies: Analyzing Data III.B Student Activity Sheet 7: Using Technology
 Suppose data were collected on 25 bags of Spud Potato Chips. The weight (to the nearest gram) of the chips in each bag is listed below. 25 28 23 26 23 25 25 24 24 27 23 24 28 27 24 26 24 25 27 26 25 26
Sample Problems for MATH 5001, University of Georgia
 Sample Problems for MATH 5001, University of Georgia 1 Give three different decimals that the bundled toothpicks in Figure 1 could represent In each case, explain why the bundled toothpicks can represent
Visit us at:
 White Paper Integrating Six Sigma and Software Testing Process for Removal of Wastage & Optimizing Resource Utilization 24 October 2013 With resources working for extended hours and in a pressurized environment,
Mathematics subject curriculum
 Mathematics subject curriculum Dette er ei omsetjing av den fastsette læreplanteksten. Læreplanen er fastsett på Nynorsk Established as a Regulation by the Ministry of Education and Research on 24 June
Informal Comparative Inference: What is it? Hand Dominance and Throwing Accuracy
 Informal Comparative Inference: What is it? Hand Dominance and Throwing Accuracy Logistics: This activity addresses mathematics content standards for seventh-grade, but can be adapted for use in sixth-grade
Math Grade 3 Assessment Anchors and Eligible Content
 Math Grade 3 Assessment Anchors and Eligible Content www.pde.state.pa.us 2007 M3.A Numbers and Operations M3.A.1 Demonstrate an understanding of numbers, ways of representing numbers, relationships among
Centre for Evaluation & Monitoring SOSCA. Feedback Information
 Centre for Evaluation & Monitoring SOSCA Feedback Information Contents Contents About SOSCA... 3 SOSCA Feedback... 3 1. Assessment Feedback... 4 2. Predictions and Chances Graph Software... 7 3. Value
GCE. Mathematics (MEI) Mark Scheme for June Advanced Subsidiary GCE Unit 4766: Statistics 1. Oxford Cambridge and RSA Examinations
 Mark Scheme for June Advanced Subsidiary GCE Unit 4766: Statistics 1. Oxford Cambridge and RSA Examinations") GCE Mathematics (MEI) Advanced Subsidiary GCE Unit 4766: Statistics 1 Mark Scheme for June 2013 Oxford Cambridge and RSA Examinations OCR (Oxford Cambridge and RSA) is a leading UK awarding body, providing
GCE Mathematics (MEI) Advanced Subsidiary GCE Unit 4766: Statistics 1 Mark Scheme for June 2013 Oxford Cambridge and RSA Examinations OCR (Oxford Cambridge and RSA) is a leading UK awarding body, providing
Answer Key For The California Mathematics Standards Grade 1
 Introduction: Summary of Goals GRADE ONE By the end of grade one, students learn to understand and use the concept of ones and tens in the place value number system. Students add and subtract small numbers
Coimisiún na Scrúduithe Stáit State Examinations Commission LEAVING CERTIFICATE 2008 MARKING SCHEME GEOGRAPHY HIGHER LEVEL
 Coimisiún na Scrúduithe Stáit State Examinations Commission LEAVING CERTIFICATE 2008 MARKING SCHEME GEOGRAPHY HIGHER LEVEL LEAVING CERTIFICATE 2008 MARKING SCHEME GEOGRAPHY HIGHER LEVEL PART ONE: SHORT-ANSWER
(I couldn t find a Smartie Book) NEW Grade 5/6 Mathematics: (Number, Statistics and Probability) Title Smartie Mathematics
 NEW Grade 5/6 Mathematics: (Number, Statistics and Probability) Title Smartie Mathematics") (I couldn t find a Smartie Book) NEW Grade 5/6 Mathematics: (Number, Statistics and Probability) Title Smartie Mathematics Lesson/ Unit Description Questions: How many Smarties are in a box? Is it the
(I couldn t find a Smartie Book) NEW Grade 5/6 Mathematics: (Number, Statistics and Probability) Title Smartie Mathematics Lesson/ Unit Description Questions: How many Smarties are in a box? Is it the
Objective: Add decimals using place value strategies, and relate those strategies to a written method.
 NYS COMMON CORE MATHEMATICS CURRICULUM Lesson 9 5 1 Lesson 9 Objective: Add decimals using place value strategies, and relate those strategies to a written method. Suggested Lesson Structure Fluency Practice
Diagnostic Test. Middle School Mathematics
 Diagnostic Test Middle School Mathematics Copyright 2010 XAMonline, Inc. All rights reserved. No part of the material protected by this copyright notice may be reproduced or utilized in any form or by
Alignment of Australian Curriculum Year Levels to the Scope and Sequence of Math-U-See Program
 Alignment of s to the Scope and Sequence of Math-U-See Program This table provides guidance to educators when aligning levels/resources to the Australian Curriculum (AC). The Math-U-See levels do not address
Extending Place Value with Whole Numbers to 1,000,000
 Grade 4 Mathematics, Quarter 1, Unit 1.1 Extending Place Value with Whole Numbers to 1,000,000 Overview Number of Instructional Days: 10 (1 day = 45 minutes) Content to Be Learned Recognize that a digit
Year 3 Term 1 Homework
 Yimin Math Centre Year Term Homework Student Name: Grade: Date: Table of contents Year Term Week Homework. Topic Roman Numerals................................. Change the Roman numerals into our numerals:...................
UNIT ONE Tools of Algebra
 UNIT ONE Tools of Algebra Subject: Algebra 1 Grade: 9 th 10 th Standards and Benchmarks: 1 a, b,e; 3 a, b; 4 a, b; Overview My Lessons are following the first unit from Prentice Hall Algebra 1 1. Students
LESSON PLANS: AUSTRALIA Year 6: Patterns and Algebra Patterns 50 MINS 10 MINS. Introduction to Lesson. powered by
 Year 6: Patterns and Algebra Patterns 50 MINS Strand: Number and Algebra Substrand: Patterns and Algebra Outcome: Continue and create sequences involving whole numbers, fractions and decimals. Describe
Case study Norway case 1
 Case study Norway case 1 School : B (primary school) Theme: Science microorganisms Dates of lessons: March 26-27 th 2015 Age of students: 10-11 (grade 5) Data sources: Pre- and post-interview with 1 teacher
Individual Component Checklist L I S T E N I N G. for use with ONE task ENGLISH VERSION
 L I S T E N I N G Individual Component Checklist for use with ONE task ENGLISH VERSION INTRODUCTION This checklist has been designed for use as a practical tool for describing ONE TASK in a test of listening.
Statewide Framework Document for:
 Statewide Framework Document for: 270301 Standards may be added to this document prior to submission, but may not be removed from the framework to meet state credit equivalency requirements. Performance
2 nd Grade Math Curriculum Map
 .A.,.M.6,.M.8,.N.5,.N.7 Organizing Data in a Table Working with multiples of 5, 0, and 5 Using Patterns in data tables to make predictions and solve problems. Solving problems involving money. Using a
Build on students informal understanding of sharing and proportionality to develop initial fraction concepts.
 Recommendation 1 Build on students informal understanding of sharing and proportionality to develop initial fraction concepts. Students come to kindergarten with a rudimentary understanding of basic fraction
GCSE English Language 2012 An investigation into the outcomes for candidates in Wales
 GCSE English Language 2012 An investigation into the outcomes for candidates in Wales Qualifications and Learning Division 10 September 2012 GCSE English Language 2012 An investigation into the outcomes
Unit 3: Lesson 1 Decimals as Equal Divisions
 Unit 3: Lesson 1 Strategy Problem: Each photograph in a series has different dimensions that follow a pattern. The 1 st photo has a length that is half its width and an area of 8 in². The 2 nd is a square
Engineers and Engineering Brand Monitor 2015
 Engineers and Engineering Brand Monitor 2015 Key Findings Prepared for Engineering UK By IFF Research 7 September 2015 We gratefully acknowledge the support of Pearson in delivering this study Contact
Sociology 521: Social Statistics and Quantitative Methods I Spring Wed. 2 5, Kap 305 Computer Lab. Course Website
 Sociology 521: Social Statistics and Quantitative Methods I Spring 2012 Wed. 2 5, Kap 305 Computer Lab Instructor: Tim Biblarz Office hours (Kap 352): W, 5 6pm, F, 10 11, and by appointment (213) 740 3547;
After your registration is complete and your proctor has been approved, you may take the Credit by Examination for MATH 6A.
 MATH 6A Mathematics, Grade 6, First Semester #03 (v.3.0) To the Student: After your registration is complete and your proctor has been approved, you may take the Credit by Examination for MATH 6A. WHAT
School Size and the Quality of Teaching and Learning
 School Size and the Quality of Teaching and Learning An Analysis of Relationships between School Size and Assessments of Factors Related to the Quality of Teaching and Learning in Primary Schools Undertaken
This document has been produced by:
 year 6 This document has been produced by: The All Wales ESDGC Officer Group to support schools introducing the National Literacy and Numeracy Framework through ESDGC activities. With support from: Developing
Written by Wendy Osterman
 Pre-Algebra Written by Wendy Osterman Editor: Alaska Hults Illustrator: Corbin Hillam Designer/Production: Moonhee Pak/Cari Helstrom Cover Designer: Barbara Peterson Art Director: Tom Cochrane Project
Arizona s College and Career Ready Standards Mathematics
 Arizona s College and Career Ready Mathematics Mathematical Practices Explanations and Examples First Grade ARIZONA DEPARTMENT OF EDUCATION HIGH ACADEMIC STANDARDS FOR STUDENTS State Board Approved June
Office Hours: Mon & Fri 10:00-12:00. Course Description
 1 State University of New York at Buffalo INTRODUCTION TO STATISTICS PSC 408 4 credits (3 credits lecture, 1 credit lab) Fall 2016 M/W/F 1:00-1:50 O Brian 112 Lecture Dr. Michelle Benson mbenson2@buffalo.edu
THE PENNSYLVANIA STATE UNIVERSITY SCHREYER HONORS COLLEGE DEPARTMENT OF MATHEMATICS ASSESSING THE EFFECTIVENESS OF MULTIPLE CHOICE MATH TESTS
 THE PENNSYLVANIA STATE UNIVERSITY SCHREYER HONORS COLLEGE DEPARTMENT OF MATHEMATICS ASSESSING THE EFFECTIVENESS OF MULTIPLE CHOICE MATH TESTS ELIZABETH ANNE SOMERS Spring 2011 A thesis submitted in partial
OVERVIEW OF CURRICULUM-BASED MEASUREMENT AS A GENERAL OUTCOME MEASURE
 OVERVIEW OF CURRICULUM-BASED MEASUREMENT AS A GENERAL OUTCOME MEASURE Mark R. Shinn, Ph.D. Michelle M. Shinn, Ph.D. Formative Evaluation to Inform Teaching Summative Assessment: Culmination measure. Mastery
EDEXCEL FUNCTIONAL SKILLS PILOT TEACHER S NOTES. Maths Level 2. Chapter 4. Working with measures
 EDEXCEL FUNCTIONAL SKILLS PILOT TEACHER S NOTES Maths Level 2 Chapter 4 Working with measures SECTION G 1 Time 2 Temperature 3 Length 4 Weight 5 Capacity 6 Conversion between metric units 7 Conversion
Math 96: Intermediate Algebra in Context
 : Intermediate Algebra in Context Syllabus Spring Quarter 2016 Daily, 9:20 10:30am Instructor: Lauri Lindberg Office Hours@ tutoring: Tutoring Center (CAS-504) 8 9am & 1 2pm daily STEM (Math) Center (RAI-338)
Ohio s Learning Standards-Clear Learning Targets
 Ohio s Learning Standards-Clear Learning Targets Math Grade 1 Use addition and subtraction within 20 to solve word problems involving situations of 1.OA.1 adding to, taking from, putting together, taking
P a g e 1. Grade 5. Grant funded by:
 P a g e 1 Grade 5 Grant funded by: P a g e 2 Focus Standard: 5.NF.1, 5.NF.2 Lesson 6: Adding and Subtracting Unlike Fractions Standards for Mathematical Practice: SMP.1, SMP.2, SMP.6, SMP.7, SMP.8 Estimated
Measuring physical factors in the environment
 B2 3.1a Student practical sheet Measuring physical factors in the environment Do environmental conditions affect the distriution of plants? Aim To find out whether environmental conditions affect the distriution
Julia Smith. Effective Classroom Approaches to.
 Julia Smith @tessmaths Effective Classroom Approaches to GCSE Maths resits julia.smith@writtle.ac.uk Agenda The context of GCSE resit in a post-16 setting An overview of the new GCSE Key features of a
Math 121 Fundamentals of Mathematics I
 I. Course Description: Math 121 Fundamentals of Mathematics I Math 121 is a general course in the fundamentals of mathematics. It includes a study of concepts of numbers and fundamental operations with
S T A T 251 C o u r s e S y l l a b u s I n t r o d u c t i o n t o p r o b a b i l i t y
 Department of Mathematics, Statistics and Science College of Arts and Sciences Qatar University S T A T 251 C o u r s e S y l l a b u s I n t r o d u c t i o n t o p r o b a b i l i t y A m e e n A l a
Reflective Teaching KATE WRIGHT ASSOCIATE PROFESSOR, SCHOOL OF LIFE SCIENCES, COLLEGE OF SCIENCE
 Reflective Teaching KATE WRIGHT ASSOCIATE PROFESSOR, SCHOOL OF LIFE SCIENCES, COLLEGE OF SCIENCE Reflective teaching means looking at what you do in the classroom, thinking about why you do it, and thinking
Dates and Prices 2016
 Dates and Prices 2016 ICE French Language Courses www.ihnice.com 27, Rue Rossini - 06000 Nice - France Phone: +33(0)4 93 62 60 62 / Fax: +33(0)4 93 80 53 09 E-mail: info@ihnice.com 1 FRENCH COURSES - 2016
Introducing the New Iowa Assessments Mathematics Levels 12 14
 Introducing the New Iowa Assessments Mathematics Levels 12 14 ITP Assessment Tools Math Interim Assessments: Grades 3 8 Administered online Constructed Response Supplements Reading, Language Arts, Mathematics
TOPICS LEARNING OUTCOMES ACTIVITES ASSESSMENT Numbers and the number system
 Curriculum Overview Mathematics 1 st term 5º grade - 2010 TOPICS LEARNING OUTCOMES ACTIVITES ASSESSMENT Numbers and the number system Multiplies and divides decimals by 10 or 100. Multiplies and divide
READY TO WORK PROGRAM INSTRUCTOR GUIDE PART I
 READY TO WORK PROGRAM INSTRUCTOR GUIDE PART I LESSON TITLE: Problem Solving Tools Method: Informal Lecture, Guided Discussion EDUCATIONAL OBJECTIVE: Comprehend the many different uses of quality/problem
PIRLS. International Achievement in the Processes of Reading Comprehension Results from PIRLS 2001 in 35 Countries
 Ina V.S. Mullis Michael O. Martin Eugenio J. Gonzalez PIRLS International Achievement in the Processes of Reading Comprehension Results from PIRLS 2001 in 35 Countries International Study Center International
Principal vacancies and appointments
 Principal vacancies and appointments 2009 10 Sally Robertson New Zealand Council for Educational Research NEW ZEALAND COUNCIL FOR EDUCATIONAL RESEARCH TE RŪNANGA O AOTEAROA MŌ TE RANGAHAU I TE MĀTAURANGA
State of New Jersey
 OVERVIEW 1213 GRADE SPAN KG6 116946 GALLOWAY, NEW JERSEY 85 This school's academic performance is about average when compared to schools across the state. Additionally, its academic performance is very