THE AP PIPELINE. Improving Access to Rigorous High School Coursework. SDP Convening April 24, 2014
|
|
|
- Mervyn Preston
- 6 years ago
- Views:
Transcription
1 THE AP PIPELINE Improving Access to Rigorous High School Coursework SDP Convening April 24, 2014
2 PANELISTS Maureen Reyes Senior Director, AP Program Management, College Board Mary Batiwalla Policy Analyst, Tennessee Department of Education Chris Avery Roy E. Larsen Professor of Public Policy & Management, Harvard Kennedy School SDP Faculty Advisor Darryl Hill Director, Data & Accountability, Wake County (NC) Public Schools SDP Data Fellow (Cohort 3) 2


3 April 24, 2014 Using Data to Increase AP Participation Maureen Reyes 2014 Strategic Data Project - Beyond the Numbers
4 The College Board s Mission The College Board s mission is to connect students to college success and opportunity. We are a not-forprofit membership organization committed to excellence and equity in education. 4
5 Goals for Today Share information about the College Board s AP Potential Tool Provide examples of how the College Board uses data to increase AP participation Highlight current campaigns 5
6 The AP Program In ,000,000 students 19,000 high schools around the world 4,000,000 exams 4,000 colleges and universities 6


7 Unfulfilled potential In the class of 2013, hundreds of thousands of students identified as having a high likelihood of success in AP did not take any recommended AP Exam. Significant inequities in AP participation are seen along racial and ethnic lines 7
8 What are we doing to identify students that are ready for AP and encourage them to enroll?
9 AP Potential AP Potential is a free, Web-based tool that helps you increase access to AP by using PSAT/NMSQT score data to identify students with the potential to succeed in AP.. Research shows that PSAT/NMSQT scores predict performance on specific AP Exams often with more accuracy than other traditionally used methods. appotential.collegeboard.org 9

10 Report to School and District Users 10

11 AP Potential feedback added to PSAT/NMSQT score reports New! Starting this year, AP feedback was featured on the Score Report Plus Feedback is based on PSAT/NMSQT section scores Level of potential for each subject can be viewed in My College QuickStart 11

12 My College Quickstart & AP Potential The shading of the steps icons illustrates your potential Choosing a major puts a checkmark in the Matches Major column next to appropriate courses This column tells you if this course is likely offered at your school Look for courses where you have potential, it matches your major, and it s offered at your school 12

13 Student s 13

14 14 Identifying and closing the equity gap


15 Support for schools Partnerships to expand AP opportunities for students Google provided funding to start 530 new AP math and science courses in fall 2013 for schools with 10+ underrepresented minority and female students with AP Potential Dell is providing funding to start 150 new AP courses in fall 2014 for low-income schools with 10+ students with AP Potential 15
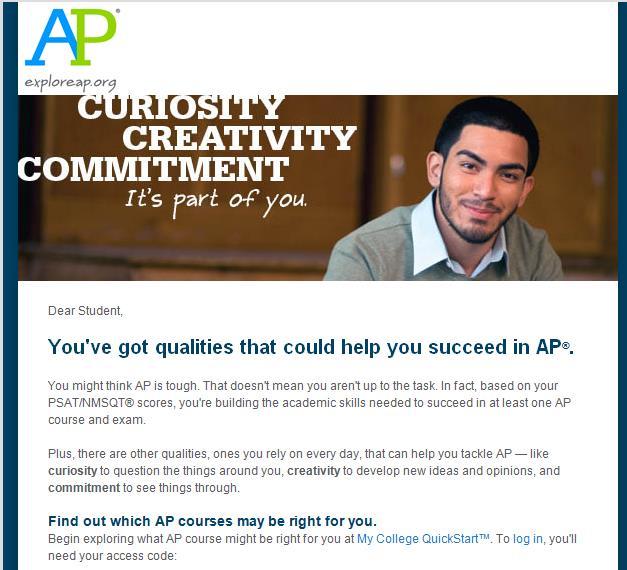
16 All In A multi-year, multi-faceted, coordinated campaign to change public understanding, institutional practices, student behaviors, and public policy so that more students with AP Potential are taking advantage of the opportunities they ve earned. 16
17 All In outreach to date Snail Mail Campaign Sent 30,000 letters and received almost 1000 responses from parents interested in enrolling their children and expanding opportunities for other African American, Latino, and Native American students Campaign Mobilized star power (Richard Sherman and Shonda Rhimes) ed over 20,000 students with AP Potential ed over 40,000 education professionals including teachers, principals, superintendents, AP coordinators, and counselors Social Media Campaign 7,000 new visits to the AP Student site Almost 1000 new followers of the AP for Students Twitter handle 17
18 AP Potential Success Stories Providence, RI AP participation has increased in Providence, RI, high schools after the district began using AP Potential data more systematically. The number of AP Exam takers in Providence increased more than 400%, from 200 in to 937 in Hillsborough, FL Hillsborough began providing the PSAT to all 9 th, 10 th, and 11 th graders for free and using AP Potential to identify and recruit students for AP. Hillsborough achieved a 60% increase in the total number of students taking AP Exams and a 54% increase in the number of students scoring a 3 or higher. 18
19 Thank You! Contact Information Maureen Reyes Senior Director, AP Program Management 19
20 Advanced Placement Strategy A Framework for Identifying School-level Barriers to AP Success Tennessee Department of Education Office of Research and Policy
21 Percent of Seniors The percentage of Tennessee students taking and passing AP exams has increased, but continues to lag behind the national average 35% 30% 25% 20% 15% 10% 5% 10% Gap in Pass Rate 14.2% Gap in Test Taking TN Testing TN Passing National Testing National Passing 0% Note: Graph shows the percentage of seniors in recent graduating cohorts taking and passing at least one AP exam throughout their high school career 21
22 Percent of Seniors Within Tennessee, we see large disparities between economically disadvantaged students and other students, with the gap again increasing over time 30% 25% 20% 15% 10% 5% 0% 16.6% Gap in Participation Economically Disadvantaged (ED) Testing Non-Economically Disadvantaged (Non-ED) Testing Economically Disadvantaged (ED) Passing Non-Economically Disadvantaged (Non-ED) Passing Note: Graph shows the percentage of seniors in recent graduating cohorts taking and passing at least one AP exam throughout their high school career 22
23 Our Approach Identify AP-ready students based on 8 th grade test scores Chart AP pipeline at the school level to diagnose problem areas Identify school-specific interventions based on pipeline data 23
24 To raise AP success, we need to more successfully steer students along the AP pipeline Preparation Enrollment Testing Passing College 24
25 At the state level, we see drop-offs at every point in the AP pipeline and large gaps between ED and non-ed students ED Non ED 82.4% pass rate 70.1% pass rate AP-ready Ready students Students Access At to least at least one one AP Enroll in Enroll at least one Take Take at least exam one Pass at Pass least AP course AP course AP exam one AP exam 25
26 But the state-level picture hides a host of school-specific issues that require different intervention strategies Among 347 high schools, 180 schools include at least 9 AP-ready students We classify these 180 high schools into the following types: Low access: AP-ready students have little to no access to AP classes Low Enrollment: AP-ready students do not enroll in AP classes Differential enrollment: AP-ready enrollment rates differ by ED status Low test-taking: AP-ready students take classes but not AP tests Differential test-taking: AP-ready test-taking rates differ by ED status Not every school needs to fall into one of these categories, and some high schools can fall into multiple categories 26
27 AP Pipeline Graphs Each of the following graphs shows the AP pipeline for an actual Tennessee high school The graphs were selected to provide examples of five major pipeline issues that can be found in schools across the state 27
28 Low Access Little to no opportunities for students to enroll in AP coursework This school does not offer any AP courses even though it has students who are considered AP-ready. There are 46 schools with AP-ready students that offer no or few AP classes. AP Ready Students At least one AP Enroll Take exam Pass Preparation Enrollment Testing Passing Success 28
29 Low Enrollment AP-ready students enroll in AP courses at low rates Less than 40% of APready students at this school enroll in an AP course. There are 66 schools in TN with low enrollment. AP Ready Students At least one AP Enroll Take exam Pass Preparation Enrollment Testing Passing Success 29
30 Differential Enrollment AP-ready students enroll in AP courses at different rates, depending on ED status ED Non ED Less than 30% of AP-ready ED students at this school enroll in AP courses. There are 66 schools in TN with a similar issue. AP Ready Students At least one AP Enroll Take exam Pass Preparation Enrollment Testing Passing Success 30
31 Low Test-Taking AP-ready students enroll in AP courses but do not take exams At this school, close to 80% of AP-ready students enrolled in a course, but only 40% took the exam. There are 55 schools in TN with a similar issue AP Ready Students At least one AP Enroll Take exam Pass Preparation Enrollment Testing Passing Success 31
32 Differential Test-Taking AP-ready ED and non-ed students test at different rates ED Non ED Of the AP-ready students at this school, about 30% of ED students took the AP exam, while over 60% of their non-ed peers tested. There are 30 schools in TN with a similar issue. AP Ready Students At least one AP Enroll Take exam Pass Preparation Enrollment Testing Passing Success 32
33 This research informed two AP pilots AP Exam Fee Pilot Legislation passed in 2013 establishing a two-year pilot program to pay for AP exam fees in an effort to increase the number of students in AP courses who participate in the AP exam. Analysis was used to determine the criteria for site selection Advanced Placement Rural Expansion Pilot Analysis lead to the development of this pilot, which will provide rural schools assistance in starting AP programs Using data from this research, we identified rural schools that have AP-ready students but do not currently offer AP courses. 33
34 Observations from New York & Future Research Directions Chris Avery Roy E. Larsen Professor of Public Policy & Management, Harvard Kennedy School SDP Faculty Advisor 34
35 Updating Algebra for All?: Evidence of a middle-grades math acceleration policy Darryl Hill Coauthors: Shaun Dougherty Joshua Goodman Erica Litke Lindsay Page
36 Motivation Observational data suggest connection between taking algebra and taking more math, and positive college outcomes. (Gamoran & Hannigan, 2000; Adelman, 2006) Black & Latino students are underrepresented in advanced courses, particularly algebra. (Moses & Cobb, 2001) Algebra-for-all has been tried in Charlotte, Chicago and California; may harm misplaced students. (Loveless, 2008; Nomi, 2012) Evidence is mixed. (Allenswoth et al, 2009; Burris et al, 2006; Clotfelter, Ladd, & Vigdor, 2011; Rickles, 2011; Stein et al, 2011) Some districts and states have made policy shifts as a result of negative outcomes (Fensterwald, 2013) Relationship/ role of increasing competition at low end in advanced courses 36/11
37 The Math Acceleration Policy in Wake County 15 th largest school district in the US (>150,000 students) 50% White, 25% Black, 15% Hispanic, 6% Asian. One-third are eligible for free or reduced-price lunch Task force focusing on equity for disadvantaged and minority students pushed for increased access to Algebra I in middle school. SAS s Education Value-Added Assessment System (EVAAS) predicts probability that a student will pass Algebra I End-of-Course exam. Starting in , students with EVAAS 70% were recommended for Advanced 6 th grade Math (6), Pre-Algebra (7), or Algebra I (8). A directive from the superintendent led to stronger compliance with this rule in the school year. WCPSS now a partner with the Strategic Data Project to research outcomes and inform policy decisions. 37/11
38 Empirical strategy A fuzzy regression discontinuity design compares students who barely qualified for acceleration to those who barely missed qualifying, two nearly identical groups but for math placement. We fit the following RD model in which share of years in advanced math has been instrumented by having an EVAAS probability of at least 70% (Elig=1): Y it 0 1 Advanced it EVAAS 2 it Elig 3 it EVAAS it it β 1 measures the impact of math acceleration on students induced to enroll as a result of the assignment rule. Running variable is each student s end of 5 th grade EVAAS score, to avoid endogeneity concerns. 38/11
39 Math acceleration rates Clear discontinuity in share of middle-school math years spent in advanced math coursework at the assignment threshold, implying a strong first stage. ~17 pp 39/11
40 Components of the treatment Students at or above the 70% probability threshold were recommended for classes designated as advanced. Accelerated students were in classes with: Much more highly skilled peers (1.3 standard deviations higher) Fewer minority peers (29 pp increase in % of peers white/asian) More students (accelerated classes were 4 students larger) No difference in peer heterogeneity (measured by st. dev. of skill) Accelerated students were: More likely to be a taught by a novice (7.2 percentage points) Less likely to be taught by a teacher in lower-tail of ability (34 percentage points) 40/11
41 Outcomes: Math GPA & Test Scores Modest negative impacts on Math GPA Little clear overall impact on end-of-grade math test scores Math GPA Math Z-score ~-0.1 GP ~-0.02 SD 41/11
42 Outcomes: Heterogeneity of effect Negative effects are particularly large for female students (possible small difference in take-up). ~ -0.2 GP Math GPA ~ SD Math Z-score 42/11
43 Sensitivity Tests No difference in first-stage take up of treatment by gender, race/ethnicity, or low-income status. Gender results not sensitive to choice of bandwidth. Results are stronger (though power more limited) when we drop the first year of implementation. These results are preliminary. 43/11
44 Implications We provide preliminary evidence of negative impact of middle-school math acceleration on short-run measures of student achievement. Negative results are largely driven by girls, with no differential effect by race/ethnicity. Girls more at risk for internal distress at challenging times in their educational trajectory (Angold & Rutter, 1992) and most vulnerable when doing poorly in school (Pomerantz et al., 2002) We hypothesize that the higher math track may be a more competitive environment and that girls induced by the policy to enroll respond negatively given their position as lower performers relative to the rest of class (Niederle & Rustichini, 2003; Niederle & Vesterlund, 2010). 44/11
45 Next steps How do the patterns in test scores relate to students selfperceptions? Are students induced into advanced math in middle school more likely to complete a college-preparatory curriculum in high school? How do these short-run effects for girls impact long-term likelihood of enrolling and succeeding in higher-level math courses? What can we learn from cross-school variation in policy implementation? What is the impact of the policy on behavioral outcomes and attendance? 45/11
46 QUESTIONS? 46
Teach For America alumni 37,000+ Alumni working full-time in education or with low-income communities 86%
 About Teach For America Teach For America recruits, trains, and supports top college graduates and professionals who make an initial commitment to teach for two years in urban and rural public schools
Peer Influence on Academic Achievement: Mean, Variance, and Network Effects under School Choice
 Megan Andrew Cheng Wang Peer Influence on Academic Achievement: Mean, Variance, and Network Effects under School Choice Background Many states and municipalities now allow parents to choose their children
Practices Worthy of Attention Step Up to High School Chicago Public Schools Chicago, Illinois
 Step Up to High School Chicago Public Schools Chicago, Illinois Summary of the Practice. Step Up to High School is a four-week transitional summer program for incoming ninth-graders in Chicago Public Schools.
SAT Results December, 2002 Authors: Chuck Dulaney and Roger Regan WCPSS SAT Scores Reach Historic High
 ABOUT THE SAT 2001-2002 SAT Results December, 2002 Authors: Chuck Dulaney and Roger Regan WCPSS SAT Scores Reach Historic High The Scholastic Assessment Test (SAT), more formally known as the SAT I: Reasoning
Basic Skills Initiative Project Proposal Date Submitted: March 14, Budget Control Number: (if project is continuing)
") Basic Skills Initiative Project Proposal 2016-2017 Date Submitted: March 14, 2016 Check One: New Proposal: Continuing Project: X Budget Control Number: (if project is continuing) Control # 87-413 - EOPS
Basic Skills Initiative Project Proposal 2016-2017 Date Submitted: March 14, 2016 Check One: New Proposal: Continuing Project: X Budget Control Number: (if project is continuing) Control # 87-413 - EOPS
Trends & Issues Report
 Trends & Issues Report prepared by David Piercy & Marilyn Clotz Key Enrollment & Demographic Trends Options Identified by the Eight Focus Groups General Themes 4J Eugene School District 4J Eugene, Oregon
Psychometric Research Brief Office of Shared Accountability
 August 2012 Psychometric Research Brief Office of Shared Accountability Linking Measures of Academic Progress in Mathematics and Maryland School Assessment in Mathematics Huafang Zhao, Ph.D. This brief
5 Programmatic. The second component area of the equity audit is programmatic. Equity
 5 Programmatic Equity It is one thing to take as a given that approximately 70 percent of an entering high school freshman class will not attend college, but to assign a particular child to a curriculum
2012 New England Regional Forum Boston, Massachusetts Wednesday, February 1, More Than a Test: The SAT and SAT Subject Tests
 2012 New England Regional Forum Boston, Massachusetts Wednesday, February 1, 2012 More Than a Test: The SAT and SAT Subject Tests 1 Presenters Chris Lucier Vice President for Enrollment Management, University
READY OR NOT? CALIFORNIA'S EARLY ASSESSMENT PROGRAM AND THE TRANSITION TO COLLEGE
 READY OR NOT? CALIFORNIA'S EARLY ASSESSMENT PROGRAM AND THE TRANSITION TO COLLEGE Michal Kurlaender University of California, Davis Policy Analysis for California Education March 16, 2012 This research
Coming in. Coming in. Coming in
 212-213 Report Card for Glenville High School SCHOOL DISTRICT District results under review by the Ohio Department of Education based upon 211 findings by the Auditor of State. Achievement This grade combines
Shelters Elementary School
 Shelters Elementary School August 2, 24 Dear Parents and Community Members: We are pleased to present you with the (AER) which provides key information on the 23-24 educational progress for the Shelters
A Diverse Student Body
 A Diverse Student Body No two diversity plans are alike, even when expressing the importance of having students from diverse backgrounds. A top-tier school that attracts outstanding students uses this
Multiple Measures Assessment Project - FAQs
 Multiple Measures Assessment Project - FAQs (This is a working document which will be expanded as additional questions arise.) Common Assessment Initiative How is MMAP research related to the Common Assessment
An Empirical Analysis of the Effects of Mexican American Studies Participation on Student Achievement within Tucson Unified School District
 An Empirical Analysis of the Effects of Mexican American Studies Participation on Student Achievement within Tucson Unified School District Report Submitted June 20, 2012, to Willis D. Hawley, Ph.D., Special
EXECUTIVE SUMMARY. Online courses for credit recovery in high schools: Effectiveness and promising practices. April 2017
 EXECUTIVE SUMMARY Online courses for credit recovery in high schools: Effectiveness and promising practices April 2017 Prepared for the Nellie Mae Education Foundation by the UMass Donahue Institute 1
The Demographic Wave: Rethinking Hispanic AP Trends
 The Demographic Wave: Rethinking Hispanic AP Trends Kelcey Edwards & Ellen Sawtell AP Annual Conference, Las Vegas, NV July 19, 2013 Exploring the Data Hispanic/Latino US public school graduates The Demographic
Queens University of Charlotte
 IHE Bachelor Performance Report Queens University of Charlotte 2004-2005 Overview of the Institution Queens University of Charlotte, located in Charlotte, North Carolina, is a private, co-educational,
John F. Kennedy Middle School
 John F. Kennedy Middle School CUPERTINO UNION SCHOOL DISTRICT Steven Hamm, Principal hamm_steven@cusdk8.org School Address: 821 Bubb Rd. Cupertino, CA 95014-4938 (408) 253-1525 CDS Code: 43-69419-6046890
Transportation Equity Analysis
 2015-16 Transportation Equity Analysis Each year the Seattle Public Schools updates the Transportation Service Standards and bus walk zone boundaries for use in the upcoming school year. For the 2014-15
The Impacts of Regular Upward Bound on Postsecondary Outcomes 7-9 Years After Scheduled High School Graduation
 Contract No.: EA97030001 MPR Reference No.: 6130-800 The Impacts of Regular Upward Bound on Postsecondary Outcomes 7-9 Years After Scheduled High School Graduation Final Report January 2009 Neil S. Seftor
2013 TRIAL URBAN DISTRICT ASSESSMENT (TUDA) RESULTS
 RESULTS") 3 TRIAL URBAN DISTRICT ASSESSMENT (TUDA) RESULTS Achievement and Accountability Office December 3 NAEP: The Gold Standard The National Assessment of Educational Progress (NAEP) is administered in reading
3 TRIAL URBAN DISTRICT ASSESSMENT (TUDA) RESULTS Achievement and Accountability Office December 3 NAEP: The Gold Standard The National Assessment of Educational Progress (NAEP) is administered in reading
Undergraduate Admissions Standards for the Massachusetts State University System and the University of Massachusetts. Reference Guide April 2016
 Undergraduate Admissions Standards for the Massachusetts State University System and the University of Massachusetts Reference Guide April 2016 Massachusetts Department of Higher Education One Ashburton
EFFECTS OF MATHEMATICS ACCELERATION ON ACHIEVEMENT, PERCEPTION, AND BEHAVIOR IN LOW- PERFORMING SECONDARY STUDENTS
 EFFECTS OF MATHEMATICS ACCELERATION ON ACHIEVEMENT, PERCEPTION, AND BEHAVIOR IN LOW- PERFORMING SECONDARY STUDENTS Jennifer Head, Ed.S Math and Least Restrictive Environment Instructional Coach Department
Wisconsin 4 th Grade Reading Results on the 2015 National Assessment of Educational Progress (NAEP)
") Wisconsin 4 th Grade Reading Results on the 2015 National Assessment of Educational Progress (NAEP) Main takeaways from the 2015 NAEP 4 th grade reading exam: Wisconsin scores have been statistically flat
Wisconsin 4 th Grade Reading Results on the 2015 National Assessment of Educational Progress (NAEP) Main takeaways from the 2015 NAEP 4 th grade reading exam: Wisconsin scores have been statistically flat
Minnesota s Consolidated State Plan Under the Every Student Succeeds Act (ESSA)
") Minnesota s Consolidated State Plan Under the Every Student Succeeds Act (ESSA) To be submitted to the U.S. Department of Education in September 2017 IMPORTANT NOTE: This is an early draft prepared for
Minnesota s Consolidated State Plan Under the Every Student Succeeds Act (ESSA) To be submitted to the U.S. Department of Education in September 2017 IMPORTANT NOTE: This is an early draft prepared for
Miami-Dade County Public Schools
 ENGLISH LANGUAGE LEARNERS AND THEIR ACADEMIC PROGRESS: 2010-2011 Author: Aleksandr Shneyderman, Ed.D. January 2012 Research Services Office of Assessment, Research, and Data Analysis 1450 NE Second Avenue,
Strategic Plan Dashboard Results. Office of Institutional Research and Assessment
 29-21 Strategic Plan Dashboard Results Office of Institutional Research and Assessment Binghamton University Office of Institutional Research and Assessment Definitions Fall Undergraduate and Graduate
Evaluation of a College Freshman Diversity Research Program
 Evaluation of a College Freshman Diversity Research Program Sarah Garner University of Washington, Seattle, Washington 98195 Michael J. Tremmel University of Washington, Seattle, Washington 98195 Sarah
Executive Summary. Laurel County School District. Dr. Doug Bennett, Superintendent 718 N Main St London, KY
 Dr. Doug Bennett, Superintendent 718 N Main St London, KY 40741-1222 Document Generated On January 13, 2014 TABLE OF CONTENTS Introduction 1 Description of the School System 2 System's Purpose 4 Notable
African American Male Achievement Update
 Report from the Department of Research, Evaluation, and Assessment Number 8 January 16, 2009 African American Male Achievement Update AUTHOR: Hope E. White, Ph.D., Program Evaluation Specialist Department
Idaho Public Schools
 Advanced Placement: Student Participation 13.5% increase in the number of students participating between 25 and 26 In 26: 3,79 Idaho Public School Students took AP Exams In 25: 3,338 Idaho Public School
Cooper Upper Elementary School
 LIVONIA PUBLIC SCHOOLS http://cooper.livoniapublicschools.org 215-216 Annual Education Report BOARD OF EDUCATION 215-16 Colleen Burton, President Dianne Laura, Vice President Tammy Bonifield, Secretary
The Effects of Statewide Private School Choice on College Enrollment and Graduation
 E D U C A T I O N P O L I C Y P R O G R A M R E S E A RCH REPORT The Effects of Statewide Private School Choice on College Enrollment and Graduation Evidence from the Florida Tax Credit Scholarship Program
Robert S. Unnasch, Ph.D.
 Introduction External Reviewer s Final Report Project DESERT Developing Expertise in Science Education, Research, and Technology National Science Foundation Grant #0849389 Arizona Western College November
Every Student Succeeds Act: Building on Success in Tennessee. ESSA State Plan. Tennessee Department of Education December 19, 2016 Draft
 Every Student Succeeds Act: Building on Success in Tennessee ESSA State Plan Tennessee Department of Education December 19, 2016 Draft Table of Contents INTRODUCTION... 1 TENNESSEE SUCCEEDS... 1 Ambitious
State Improvement Plan for Perkins Indicators 6S1 and 6S2
 State Improvement Plan for Perkins Indicators 6S1 and 6S2 Submitted by: Dr. JoAnn Simser State Director for Career and Technical Education Minnesota State Colleges and Universities St. Paul, Minnesota
ILLINOIS DISTRICT REPORT CARD
 -6-525-2- HAZEL CREST SD 52-5 HAZEL CREST SD 52-5 HAZEL CREST, ILLINOIS and federal laws require public school districts to release report cards to the public each year. 2 7 ILLINOIS DISTRICT REPORT CARD
ILLINOIS DISTRICT REPORT CARD
 -6-525-2- Hazel Crest SD 52-5 Hazel Crest SD 52-5 Hazel Crest, ILLINOIS 2 8 ILLINOIS DISTRICT REPORT CARD and federal laws require public school districts to release report cards to the public each year.
Race, Class, and the Selective College Experience
 Race, Class, and the Selective College Experience Thomas J. Espenshade Alexandria Walton Radford Chang Young Chung Office of Population Research Princeton University December 15, 2009 1 Overview of NSCE
National Survey of Student Engagement Spring University of Kansas. Executive Summary
 National Survey of Student Engagement Spring 2010 University of Kansas Executive Summary Overview One thousand six hundred and twenty-one (1,621) students from the University of Kansas completed the web-based
National Survey of Student Engagement The College Student Report
 The College Student Report This is a facsimile of the NSSE survey (available at nsse.iub.edu/links/surveys). The survey itself is administered online. 1. During the current school year, about how often
10/6/2017 UNDERGRADUATE SUCCESS SCHOLARS PROGRAM. Founded in 1969 as a graduate institution.
 UNDERGRADUATE SUCCESS SCHOLARS PROGRAM THE UNIVERSITY OF TEXAS AT DALLAS Founded in 1969 as a graduate institution. Began admitting upperclassmen in 1975 and began admitting underclassmen in 1990. 1 A
NC Education Oversight Committee Meeting
 NC Education Oversight Committee Meeting November 7, 2017 Nathan Currie, Superintendent Bridget Phifer, NCCA Board Chair Agenda School Demographics Achievements & Improvements Critical Needs Q&A Mission
SMILE Noyce Scholars Program Application
 ONLINE POST-BABACCALAUREATE TEACHER PREPARATION PROGRAM SMILE yce Scholars Program Application Introduction: Rio Salado College is soliciting applicants for the Science and Math Innovative Learning Environments
University of Utah. 1. Graduation-Rates Data a. All Students. b. Student-Athletes
 University of Utah FRESHMAN-COHORT GRADUATION RATES All Students Student-Athletes # 2009-10 Graduation Rate 64% 64% Four-Class Average 61% 64% Student-Athlete Graduation Success Rate 87% 1. Graduation-Rates
Early Warning System Implementation Guide
 Linking Research and Resources for Better High Schools betterhighschools.org September 2010 Early Warning System Implementation Guide For use with the National High School Center s Early Warning System
Student Support Services Evaluation Readiness Report. By Mandalyn R. Swanson, Ph.D., Program Evaluation Specialist. and Evaluation
 Student Support Services Evaluation Readiness Report By Mandalyn R. Swanson, Ph.D., Program Evaluation Specialist and Bethany L. McCaffrey, Ph.D., Interim Director of Research and Evaluation Evaluation
Supply and Demand of Instructional School Personnel
 Supply and Demand of Instructional School Personnel Presentation to the 82 nd Annual Virginia Middle and High School Principals Conference and Exposition Mrs. Patty S. Pitts Assistant Superintendent of
NORTH CAROLINA VIRTUAL PUBLIC SCHOOL IN WCPSS UPDATE FOR FALL 2007, SPRING 2008, AND SUMMER 2008
 E&R Report No. 08.29 February 2009 NORTH CAROLINA VIRTUAL PUBLIC SCHOOL IN WCPSS UPDATE FOR FALL 2007, SPRING 2008, AND SUMMER 2008 Authors: Dina Bulgakov-Cooke, Ph.D., and Nancy Baenen ABSTRACT North
Evaluation of Teach For America:
 EA15-536-2 Evaluation of Teach For America: 2014-2015 Department of Evaluation and Assessment Mike Miles Superintendent of Schools This page is intentionally left blank. ii Evaluation of Teach For America:
Cuero Independent School District
 Cuero Independent School District Texas Superintendent: Henry Lind Primary contact: Debra Baros, assistant superintendent* 1,985 students, prek-12, rural District Description Cuero Independent School District
Iowa School District Profiles. Le Mars
 Iowa School District Profiles Overview This profile describes enrollment trends, student performance, income levels, population, and other characteristics of the public school district. The report utilizes
University-Based Induction in Low-Performing Schools: Outcomes for North Carolina New Teacher Support Program Participants in
 University-Based Induction in Low-Performing Schools: Outcomes for North Carolina New Teacher Support Program Participants in 2014-15 In this policy brief we assess levels of program participation and
Junior (61-90 semester hours or quarter hours) Two-year Colleges Number of Students Tested at Each Institution July 2008 through June 2013
 Two-year Colleges Number of Students Tested at Each Institution July 2008 through June 2013") Number of Students Tested at Each Institution July 2008 through June 2013 List of Institutions Number of School Name Students AIKEN TECHNICAL COLLEGE, SC 119 ARKANSAS NORTHEASTERN COLLEGE, AR 66 ASHLAND
Number of Students Tested at Each Institution July 2008 through June 2013 List of Institutions Number of School Name Students AIKEN TECHNICAL COLLEGE, SC 119 ARKANSAS NORTHEASTERN COLLEGE, AR 66 ASHLAND
The Talent Development High School Model Context, Components, and Initial Impacts on Ninth-Grade Students Engagement and Performance
 The Talent Development High School Model Context, Components, and Initial Impacts on Ninth-Grade Students Engagement and Performance James J. Kemple, Corinne M. Herlihy Executive Summary June 2004 In many
The following resolution is presented for approval to the Board of Trustees. RESOLUTION 16-
 1. Adoption of Wright State 2016 Campus Completion Plan The following resolution is presented for approval to the Board of Trustees. RESOLUTION 16- WHEREAS, Section 3345.81 of the Ohio Revised Code requires
Cooper Upper Elementary School
 LIVONIA PUBLIC SCHOOLS www.livoniapublicschools.org/cooper 213-214 BOARD OF EDUCATION 213-14 Mark Johnson, President Colleen Burton, Vice President Dianne Laura, Secretary Tammy Bonifield, Trustee Dan
EDUCATIONAL ATTAINMENT
 EDUCATIONAL ATTAINMENT By 2030, at least 60 percent of Texans ages 25 to 34 will have a postsecondary credential or degree. Target: Increase the percent of Texans ages 25 to 34 with a postsecondary credential.
Personnel Administrators. Alexis Schauss. Director of School Business NC Department of Public Instruction
 Personnel Administrators Alexis Schauss Director of School Business NC Department of Public Instruction Delivering Bad News in a Good Way Planning Allotments are NOT Allotments Budget tool New Allotted
California Professional Standards for Education Leaders (CPSELs)
") Standard 1 STANDARD 1: DEVELOPMENT AND IMPLEMENTATION OF A SHARED VISION Education leaders facilitate the development and implementation of a shared vision of learning and growth of all students. Element
Standard 1 STANDARD 1: DEVELOPMENT AND IMPLEMENTATION OF A SHARED VISION Education leaders facilitate the development and implementation of a shared vision of learning and growth of all students. Element
Final. Developing Minority Biomedical Research Talent in Psychology: The APA/NIGMS Project
 Final Report Developing Minority Biomedical Research Talent in Psychology: A Collaborative and Systemic Approach for Strengthening Institutional Capacity for Recruitment, Retention, Training, and Research
Essays on the Economics of High School-to-College Transition Programs and Teacher Effectiveness. Cecilia Speroni
 Essays on the Economics of High School-to-College Transition Programs and Teacher Effectiveness Cecilia Speroni Submitted in partial fulfillment of the requirements for the degree of Doctor of Philosophy
2015 High School Results: Summary Data (Part I)
") 1 2015 High School Results: Summary Data (Part I) October 27, 2015 Dr. Gregory E. Thornton CEO, Baltimore City Public Schools Theresa D. Jones Chief Achievement and Accountability Officer HS Data Summary
1 2015 High School Results: Summary Data (Part I) October 27, 2015 Dr. Gregory E. Thornton CEO, Baltimore City Public Schools Theresa D. Jones Chief Achievement and Accountability Officer HS Data Summary
Unequal Opportunity in Environmental Education: Environmental Education Programs and Funding at Contra Costa Secondary Schools.
 Unequal Opportunity in Environmental Education: Environmental Education Programs and Funding at Contra Costa Secondary Schools Angela Freitas Abstract Unequal opportunity in education threatens to deprive
Best Colleges Main Survey
 Best Colleges Main Survey Date submitted 5/12/216 18::56 Introduction page 1 / 146 BEST COLLEGES Data Collection U.S. News has begun collecting data for the 217 edition of Best Colleges. The U.S. News
ASCD Recommendations for the Reauthorization of No Child Left Behind
 ASCD Recommendations for the Reauthorization of No Child Left Behind The Association for Supervision and Curriculum Development (ASCD) represents 178,000 educators. Our membership is composed of teachers,
Los Angeles City College Student Equity Plan. Signature Page
 Los Angeles City College Student Equity Plan Signature Page Los Angeles Community College Los Angeles City College President, Board of Trustees Date District Chancellor: College President: Academic Senate
ADDENDUM 2016 Template - Turnaround Option Plan (TOP) - Phases 1 and 2 St. Lucie Public Schools
 - Phases 1 and 2 St. Lucie Public Schools") ADDENDUM 2016 Template - Turnaround Option Plan (TOP) - Phases 1 and 2 St. Lucie Public Schools The district requests an additional year to implement the previously approved turnaround option. Evidence
ADDENDUM 2016 Template - Turnaround Option Plan (TOP) - Phases 1 and 2 St. Lucie Public Schools The district requests an additional year to implement the previously approved turnaround option. Evidence
State Parental Involvement Plan
 A Toolkit for Title I Parental Involvement Section 3 Tools Page 41 Tool 3.1: State Parental Involvement Plan Description This tool serves as an example of one SEA s plan for supporting LEAs and schools
Facts and Figures Office of Institutional Research and Planning
 Facts and Figures 2008-2009 Office of Institutional Research and Planning Office of Institutional Research Fall 2009 Facts at a Glance Credit Headcount Enrollments Headcount Ethnicity Headcount Percent
The Condition of College & Career Readiness 2016
 The Condition of College and Career Readiness This report looks at the progress of the 16 ACT -tested graduating class relative to college and career readiness. This year s report shows that 64% of students
North Carolina Teacher Corps Final Report
 Consortium for Educational Research and Evaluation North Carolina North Carolina Teacher Corps Final Report Impact, Qualitative Assessment, and Policy Recommendations Authors: Robert Maser, Avril Smart,
Invest in CUNY Community Colleges
 Invest in Opportunity Invest in CUNY Community Colleges Pat Arnow Professional Staff Congress Invest in Opportunity Household Income of CUNY Community College Students
Data Diskette & CD ROM
 Data File Format Data Diskette & CD ROM Texas Assessment of Academic Skills Fall 2002 through Summer 2003 Exit Level Test Administrations Attention Macintosh Users To accommodate Macintosh systems a delimiter
The number of involuntary part-time workers,
 University of New Hampshire Carsey School of Public Policy CARSEY RESEARCH National Issue Brief #116 Spring 2017 Involuntary Part-Time Employment A Slow and Uneven Economic Recovery Rebecca Glauber The
CHAPTER 4: REIMBURSEMENT STRATEGIES 24
 CHAPTER 4: REIMBURSEMENT STRATEGIES 24 INTRODUCTION Once state level policymakers have decided to implement and pay for CSR, one issue they face is simply how to calculate the reimbursements to districts
Effective Recruitment and Retention Strategies for Underrepresented Minority Students: Perspectives from Dental Students
 Critical Issues in Dental Education Effective Recruitment and Retention Strategies for Underrepresented Minority Students: Perspectives from Dental Students Naty Lopez, Ph.D.; Rose Wadenya, D.M.D., M.S.;
Description of Program Report Codes Used in Expenditure of State Funds
 Program Report Codes (PRC) A program report code (PRC) is an accounting term and is used for the allocation and accounting of funds. The PRCs (allocations) may change from year to year depending on the
This Access Agreement is for only, to align with the WPSA and in light of the Browne Review.
 University of Essex Access Agreement 2011-12 The University of Essex Access Agreement has been updated in October 2010 to include new tuition fee and bursary provision for 2011 entry and account for the
Legacy of NAACP Salary equalization suits.
 Why tests, anyway? Legacy of NAACP Salary equalization suits. If you can t beat em, test em. Boom! Legacy of teacher tests NTE PRAXIS-II Pearson Content Examinations GRE ACT SAT All are statistically significantly
Superintendent s 100 Day Entry Plan Review
 Superintendent s 100 Day Entry Plan Review January 10, 2012 Thelma Meléndez de Santa Ana, Ph.D. Superintendent 2 The 100-Day Entry Plan Roll-Out What We ll Cover Reflections & Observations on Our Aha!
BUILDING CAPACITY FOR COLLEGE AND CAREER READINESS: LESSONS LEARNED FROM NAEP ITEM ANALYSES. Council of the Great City Schools
 1 BUILDING CAPACITY FOR COLLEGE AND CAREER READINESS: LESSONS LEARNED FROM NAEP ITEM ANALYSES Council of the Great City Schools 2 Overview This analysis explores national, state and district performance
Networks and the Diffusion of Cutting-Edge Teaching and Learning Knowledge in Sociology
 RESEARCH BRIEF Networks and the Diffusion of Cutting-Edge Teaching and Learning Knowledge in Sociology Roberta Spalter-Roth, Olga V. Mayorova, Jean H. Shin, and Janene Scelza INTRODUCTION How are transformational
RAISING ACHIEVEMENT BY RAISING STANDARDS. Presenter: Erin Jones Assistant Superintendent for Student Achievement, OSPI
 RAISING ACHIEVEMENT BY RAISING STANDARDS Presenter: Erin Jones Assistant Superintendent for Student Achievement, OSPI Agenda Introductions Definitions History of the work Strategies Next steps Debrief
What We Are Learning about Successful Programs In College Calculus
 What We Are Learning about Successful Programs In College Calculus David Bressoud St. Paul, MN Knox College Galesburg, IL May 15, 2014 A pdf file of this PowerPoint is available at www.macalester.edu/~bressoud/talks
Summary of Special Provisions & Money Report Conference Budget July 30, 2014 Updated July 31, 2014
 6.4 (b) Base Budget This changes how average daily membership is built in the Budget. Until now, projected ADM increases have been included in the continuation budget. This special provision defines what
Annual Report to the Public. Dr. Greg Murry, Superintendent
 Annual Report to the Public Dr. Greg Murry, Superintendent 1 Conway Board of Education Ms. Susan McNabb Mr. Bill Clements Mr. Chuck Shipp Mr. Carl Barger Dr. Adam Lamey Dr. Quentin Washispack Mr. Andre
Women, Minorities, and Persons with Disabilities in Science and Engineering
 2017 Women, Minorities, and Persons with Disabilities in Science and Engineering Emilda B. Rivers, Deputy Director National Center for Science and Engineering Statistics National Science Foundation www.nsf.gov/statistics
APPLICANT INFORMATION. Area Code: Phone: Area Code: Phone:
 MARQUETTE UNIVERSITY HEALTH CAREERS OPPORTUNITY PROGRAM College Science Enrichment Program (CSEP) & Pre-Enrollment Support Program (PESP) Website: http://www.mu.edu/hcop INSTRUCTIONS: Please type or print
CSU East Bay EAP Breakfast. CSU Office of the Chancellor Student Academic Services Lourdes Kulju Academic Outreach and Early Assessment
 CSU East Bay EAP Breakfast CSU Office of the Chancellor Student Academic Services Lourdes Kulju Academic Outreach and Early Assessment 2015 CAASPP EAP Testing 3.2 million students tested in grades 3-11.
LEARN. LEAD. DISCOVER.
 LEARN. LEAD. DISCOVER. WHAT IS MMI? Your Master s Degree in 12 months The MMI Program is an accelerated professional degree at the University of Toronto Mississauga (UTM) which focuses on the management
EDELINA M. BURCIAGA 3151 Social Science Plaza Irvine, CA
 EDELINA M. BURCIAGA 3151 Social Science Plaza Irvine, CA 92697-5000 eburciag@uci.edu EDUCATION UNIVERSITY OF CALIFORNIA, IRVINE, Irvine, CA Doctoral candidate, Department of Sociology. Expected graduation
Data Glossary. Summa Cum Laude: the top 2% of each college's distribution of cumulative GPAs for the graduating cohort. Academic Honors (Latin Honors)
") Institutional Research and Assessment Data Glossary This document is a collection of terms and variable definitions commonly used in the universities reports. The definitions were compiled from various
Institutional Research and Assessment Data Glossary This document is a collection of terms and variable definitions commonly used in the universities reports. The definitions were compiled from various
Hokulani Elementary School
 Hokulani Elementary Code: 109 Status and Improvement Report Year -11 Contents Focus On Standards Grades K-5 This Status and Improvement Report has been prepared as part of the Department's education accountability
Massachusetts Juvenile Justice Education Case Study Results
 Massachusetts Juvenile Justice Education Case Study Results Principal Investigator: Thomas G. Blomberg Dean and Sheldon L. Messinger Professor of Criminology and Criminal Justice Prepared by: George Pesta
Enrollment Trends. Past, Present, and. Future. Presentation Topics. NCCC enrollment down from peak levels
 Presentation Topics 1. Enrollment Trends 2. Attainment Trends Past, Present, and Future Challenges & Opportunities for NC Community Colleges August 17, 217 Rebecca Tippett Director, Carolina Demography
Estimating the Cost of Meeting Student Performance Standards in the St. Louis Public Schools
 Estimating the Cost of Meeting Student Performance Standards in the St. Louis Public Schools Prepared by: William Duncombe Professor of Public Administration Education Finance and Accountability Program