The Relation of Dropout Prevention Programs in West Virginia Schools to Dropout Rates and Principal Perceptions of Effectiveness
|
|
|
- Darlene Anderson
- 6 years ago
- Views:
Transcription

1 Marshall University Marshall Digital Scholar Theses, Dissertations and Capstones 2016 The Relation of Dropout Prevention Programs in West Virginia Schools to Dropout Rates and Principal Perceptions of Effectiveness Vicky Callison Cline Follow this and additional works at: Part of the Educational Assessment, Evaluation, and Research Commons Recommended Citation Cline, Vicky Callison, "The Relation of Dropout Prevention Programs in West Virginia Schools to Dropout Rates and Principal Perceptions of Effectiveness" (2016). Theses, Dissertations and Capstones This Dissertation is brought to you for free and open access by Marshall Digital Scholar. It has been accepted for inclusion in Theses, Dissertations and Capstones by an authorized administrator of Marshall Digital Scholar. For more information, please contact
2 THE RELATION OF DROPOUT PREVENTION PROGRAMS IN WEST VIRGINIA SCHOOLS TO DROPOUT RATES AND PRINCIPAL PERCEPTIONS OF EFFECTIVENESS A dissertation submitted to the Graduate School of Marshall University In partial fulfillment of the requirements for the degree of Doctor of Education in Educational Leadership by Vicky Callison Cline Approved by Dr. Louis K. Watts, Committee Chairperson Dr. Edna Meisel Dr. Tom Hisiro Dr. N. Dwight Livesay Marshall University May 2016
3 ii
4 2016 Vicky Callison Cline ALL RIGHTS RESERVED iii
5 DEDICATION I would like to dedicate this study to my husband, Mark, who colors my life with his music and art; to my father, Dale Callison, who taught me that meaningful work was the best way to find happiness; to my mother, Judy Callison, who inspires me to enjoy life and keep chasing my dreams; to my children, Emily and Ethan, who have brought me great joy and strengthened my resolve; to friends like Daryl, Kim, and Jeanne, who listened to my complaining and encouraged me anyway, and to Avian and all future grandchildren, who represent the future and everything we hope it will be. iv
6 ACKNOWLEDGEMENTS The author wishes to express sincere appreciation to the faculty of the Marshall College of Education and Professional Development for their support and encouragement, particularly Dr. Louis Watts, my Committee Chairperson and mentor, who started me on the path to a doctoral degree and supported me throughout the process. His ability to laugh and make me laugh even as he told me to revise yet again was inspirational, and I appreciate the way he helped me keep things in perspective. I thank Dr. Edna Meisel for her assistance with statistical analysis, for the way she helped me actually enjoy statistics in class, and for her insistence on getting it right. I thank Dr. N. Dwight Livesay, for his wise counsel and encouragement. Dr. Livesay always helped me to see the bigger picture, and he is one of the kindest human beings I have ever known. I would also like to thank Dr. Tom Hisiro for being willing to step in and work with me on short notice. Finally, thanks must also go to Dr. Michael Cunningham, for his insistence on attention to detail and guidance throughout the many years of this program. These dedicated professionals inspire and mentor students every day, and I will always appreciate them. v
7 TABLE OF CONTENTS SIGNATURE PAGE... ii COPYRIGHT... iii DEDICATION... iv ACKNOWLEDGEMENTS... v TABLE OF CONTENTS... vi LIST OF TABLES... ix ABSTRACT... x Chapter One: Introduction, Overview, Problem Statement... 1 West Virginia s Challenges... 2 Statement of Purpose Significance and Justification... 5 Limitations of Study... 6 Research Questions... 6 Delimitations... 6 Definitions... 7 Chapter Two: Review of the Literature... 9 History of Dropout Prevention Studies in the United States Programs to Address Dropout Rates Use of Multiple Approaches to Address Dropout Prevention Organization of Dropout Prevention Programs in West Virginia Principals Role in Dropout Prevention vi
8 Chapter Three: Research Methods Research Design Research Questions Population and Sample Instrumentation Data Collection and Analysis Chapter Four: Findings Sample Analysis of Data Question One Question Two Question Three Question Four Question Five Provision for Protection of Student Information Chapter Five: Summary Discussion of Findings, Conclusions, and Recommendations.. 36 Discussion of Findings Question One Question Two Question Three Question Four Question Five Conclusions vii
9 Recommendations Best Practices ZoomWVe Longitudinal Studies Program Participants Studies Implementation Studies REFERENCES APPENDICES APPENDIX A: ANONYMOUS SURVEY CONSENT APPENDIX B: SURVEY INSTRUMENT CURRICULUM VITAE viii
10 LIST OF TABLES Table 1 Percentage of Schools with Each Program in Place in Page 29 Table 2 Pearson Product-Moment Correlation Between Number of Programs Page 30 in Place and Graduation Rate Table 3 Principal Perceptions of Effectiveness of School Programs Using Page 32 Chi Square and Means Table 4 ANOVA Relationship Between Principal Perceptions of Effectiveness Page 34 and Graduation Rate Table 5 Difference in Mean Graduation Rate due to Programs in Place/Not in Page 35 Place ix
11 ABSTRACT This study used non-experimental survey research to gather data on the kinds of dropout prevention programs in place in West Virginia high schools in and to evaluate their effectiveness based on possible relationships between principals perceptions of the programs and graduation rates. The study focused on nine of 15 effective strategies for dropout prevention identified by the National Dropout Prevention Center: School-Community Collaboration, Safe Learning Environment, Family Engagement, Mentoring/Tutoring, Service Learning, Alternative School, After School, Individualized Instructional, and Career and Technical Education Programs. A tenth program, Alternative Pathways to Diploma, cited as one of four policy recommendations and best practices for West Virginia by a National Governors Association Grant Study, was added. Survey data were collected via Internet and the United States Postal Service from among the entire population of 116 West Virginia high school principals for the school year with a response rate of 72% (n = 83). The study identified percentages for each of the 10 programs. The Pearson Product-Moment Correlation statistical test revealed no correlation between the number of programs used and graduation rates. Independent Samples T- tests showed no relationship between programs not in use and graduation rate. A Chi-Square test did show statistical significance among principals perceptions of effectiveness. The ANOVA showed a relationship between principals perceptions and graduation rate for one program, Alternative Pathways to Diploma. x
12 CHAPTER ONE INTRODUCTION, OVERVIEW, PROBLEM STATEMENT Despite increasing public attention to high school dropout rates, nearly one in three high school students in the United States fails to graduate. This crisis parallels increasing technology demands and the fact that workers can expect to hold more than 10 jobs during their early working careers, based on baby boomers employment between ages (Bureau of Labor Statistics, 2010). The dropout crisis in the United States prompted President Obama to add an additional $900 million in federal dollars in March 2010 to improve the nation s graduation rates, but the degree to which states have addressed this issue varies widely. In addition, issues related to dropout rates will likely increase due to the youth population s movement toward a higher number of low-income, immigrant and minority students, who are among the groups with lower graduation rates (Steinberg & Almeida, 2004). In , all states began using a common measure, the four-year cohort graduation rate, for reporting graduation rates. This uniform measure, designed to provide a more meaningful comparison of graduation rates across states and school districts, is defined as a group of students who enters the ninth grade for the first time together with the expectation of graduating within four years. The graduation rate for the cohort is calculated based on the percentage of students in a cohort who earn a diploma within four years of entering the ninth grade, and the dropout rate is calculated based on the percentage of students in the cohort who drop out during the same period. A four-year adjusted cohort graduation rate, as defined in federal regulation 34 C.F.R (b) (1) (i)-(iv), is the number of students who graduate in four years with a regular high school diploma divided by the number of students who form the 1
13 adjusted cohort for the graduating class. The cohort is adjusted by adding transfer students and subtracting students who transfer out, emigrate out of the country, or die during that time period. The averaged freshman cohort dropout rate ranged from 7% for Vermont to 32% for Mississippi (Kids Count Data Center, 2015). Unfortunately, high dropout rates correlate with increased poverty rates, creating a cycle of poverty that is difficult to address. In 2008, young adults ages 25-34, with a four-year degree, earned 28% more than young adults with a two-year degree, 53% more than high school completers, and 96% more than dropouts (Aud & Hannes, 2010). The statistics speak for themselves. Improving graduation rates not only helps individuals but also benefits communities and states. In the United States, in 2009, 16.6% of children in the Northeast lived in poverty, 19.1 and 19.2% in the Midwest and West lived in poverty, and 22.8% in the South lived in poverty (Djamba, Davidson, & Aga, 2012). States with the highest poverty rates also have the poorest rural populations (Johnson, Showalter, Klein, & Lester, 2014), which is associated with other social issues. Poverty coexists in West Virginia, for example, with lower educational achievement for women and higher teen pregnancy rates (Djamba et al., 2012), along with high dropout rates. Much has been written about the dropout crisis and programs that attempt to address the issue, but the issue of program effectiveness is complex, and there is a lack of definitive directives for programs. In fact, many dropout prevention programs are being used in schools across the nation with little to no tracking of these programs effectiveness (Catalano, Berglund, Ryan, Lonczak, & Hawkins, 2004). West Virginia s Challenges Drop-out prevention in West Virginia, like that in many rural and poor states or districts, faces many challenges. West Virginia s challenges include high poverty rates, increased costs 2
14 due to transportation difficulties caused by a rugged terrain, student academic performance that is among the lowest in the nation, high numbers of special education students, and low teacher pay. The Why Rural Matters : The Condition of Rural Education in the 50 States report sets West Virginia s priority needs ranking at 13 out of 50 when compared to states with rural schools in need based on the poverty level, its mediocre graduation rates, and low national test scores (Johnson et al., 2014). West Virginia ranks eighth out of 50 on socioeconomic challenges. The report shows 27% of families with children ages 0-5 living in poverty, and 67.1% of single mother families as living in poverty. West Virginia s median household income for rural adults is among the lowest in the nation, despite an unemployment rate that hovers near the national average, two factors rated as crucial by Why Rural Matters (Johnson et al., 2014). The Center for Law and Social Policy (CLASP), a non-profit organization in Washington, D.C. that seeks to develop and support federal, state, and local policies to strengthen low-income families and create pathways to work, sets the number at 24% for West Virginia s children living in poverty (2012). Pockets of multigenerational poverty, such as that seen in McDowell County, with a poverty rate of 37.7%, free and reduced lunch rates of 82%, and a dropout rate that was 50% in 2000, reflect the same increased dropout rate phenomenon (Erickson, Reid, Nelson, O Shaughnessy, & Berube, 2008). In addition to high poverty rates, West Virginia faces challenges based on the rugged terrain and harsh winter weather. More than half of West Virginia s schools are in rural, mountainous areas, and over one-third of all students live in rural school districts (Johnson et al., 2014). The West Virginia Blue Ribbon Commission on Highways reports that more than onethird (36%) of West Virginia s major roads are either in poor or mediocre condition, and 33% of West Virginia s rural roads are in poor condition, the third highest percentage in the nation 3
15 (2015). Add to that number the roads that are not state-maintained and the often-harsh winters, and the result is high absenteeism and higher transportation costs for students. Increased transportation costs drain West Virginia s educational funds, reducing funds that can be spent on other educational initiatives. On average, school districts nationwide spend $11.71 on educational initiatives for every dollar spent on transportation; West Virginia, however, spends only $7.40 on educational initiatives for every dollar spent on transportation, the lowest of all states, at least partly due to transportation difficulties (Johnson et al., 2014). Why Rural Matters rates this spending disparity as a crucial factor that must be addressed for West Virginia students. In addition, high numbers of special needs students and low teacher pay contribute to lower test scores and increased difficulty in attracting qualified teachers. In educational outcomes, according to Why Rural Matters , West Virginia ranks 2nd out of the 50 states, a ranking of urgent, and nearly one in six school age children is identified as having special needs. Only rural New Mexico has lower average scores on reading and mathematics on the National Assessment of Educational Progress (NAEP), the largest nationally representative assessment of America s students, and according to the Kids Count Data Center (2015), two out of 10 WV students did not graduate with their cohort group in Statement of Purpose The purpose of this study is to gather information about the kinds of dropout intervention programs in place in in West Virginia high schools and to evaluate their effectiveness based on graduation rate and principals perceptions of the programs impact. These intervention programs are based on those identified by West Virginia Senate Bill 228 and subsequently placed in the West Virginia Department of Education s Comprehensive District/School Dropout 4
16 Prevention Plans (CDSDPP) Guidance Document (2012). The document specifically references the National Dropout Prevention Center s Effective Strategies for Dropout Prevention (2015), 10 of which are reproduced word for word in Senate Bill 228. This study uses 9 of the 10 strategies identified by the National Dropout Prevention Center and adopted by West Virginia, excluding only early childhood literacy, as this is not a subject a high school principal could be expected to address with reference to school year In addition, this study includes principals perceptions of the state s use of multiple pathways to graduation, as this is suggested for county use in the WVDE CDSDPP Guidance Document, which was developed to help counties develop comprehensive district/school dropout prevention and alternative education plans, as mandated by Senate Bill 228. Significance and Justification This study identifies dropout prevention programs put in place in high schools across West Virginia as a result of Senate Bill 228 and explores principals perceptions of the programs used in conjunction with the graduation rates in their schools. This investigation, with its specific focus on dropout prevention program participation, is significant in that it provides data as to which programs principals believe to be effective in improving graduation rates, and it also creates an overview of programs in place in West Virginia. Findings offer insight into commonly used programs directly related to West Virginia s guidance document for dropout prevention and initiatives put in place at the state level and based on guidance from national organizations such as the National Center for Dropout Prevention. This evaluation of dropout prevention programs currently in place indicates possible effectiveness of these programs and applicability of specific programs to situations with similar participants. Exploring the programs effects on student graduation rates and administrators perceptions of the programs 5
17 impact may assist those designing programs or considering further implementation of programs already in place. Limitations of the Study The study is limited by the veracity and thoughtfulness of the principals as they record their perceptions. It is also limited in that it looks only at graduation rate increases for one year, which may not be reflective of the cumulative or longitudinal effects of programs. Research Questions The following research questions guide this inquiry: 1) What dropout prevention programs do principals identify as being in place in West Virginia high schools? 2) What relationship, if any, exists between the number of dropout prevention programs in place and graduation rates? 3) What are principals perceptions of the effectiveness of each dropout prevention program? 4) What relationship, if any, exists between principals perceptions of the effectiveness of each dropout prevention program and graduation rates? 5) What relationship, if any, exists between programs not used and graduation rates? Delimitations The study does not attempt to look at factors that may affect dropout rates, such as socioeconomic issues, familial considerations, or cultural expectations. Also, the study does not look at community-based programs that may affect the dropout rate. Instead, the study looks specifically at interventions put in place by high schools throughout the state during
18 The study also assesses only the principals perceptions of program effectiveness rather than those of other educators, parents, students, or community members. Definitions Averaged Freshman Graduation Rate (AFGR) measure that uses aggregate student enrollment data to estimate the size of an incoming freshman class and aggregate counts of the number of regular diplomas awarded four years later. This rate focuses on public high school students as opposed to all high school students or the general population. Dropout any student who leaves school and does not enroll in another school or program that culminates in a high school diploma or certificate. Dropout Prevention Programs - for the purposes of this study, dropout prevention programs considered by principals are defined as those programs that were identified by the National Dropout Prevention Center as effective strategies for dropout prevention and subsequently cited in West Virginia Senate Bill 228, passed March 12, 2011, which created the Local Solution Dropout Prevention and Recovery Act of 2011, in addition to multiple pathways to graduation, cited as one of four policy recommendations and best practices for West Virginia by the National Governors Association (NGA) grant study (Achieving Graduation for All West Virginians, 2011). Graduation Rates for the purposes of this study, graduation rates with reference to the research questions will use the Averaged Freshman Graduation Rate, a measure that uses aggregate student enrollment data to estimate the size of an incoming freshman class and aggregate counts of the number of regular diplomas awarded four years later. National Event Dropout Rate measure based on the Current Population Survey that estimates the percentage of private and public school students who left high school between the beginning 7
19 of one school year and the beginning of the next without earning either a high school diploma or an equivalency certificate. This measure provides information about United States high school students who are leaving school without receiving a diploma or certificate, which means it may not provide an accurate picture of the dropout rate overall but rather provides a snapshot of dropouts in a particular school year. National Status Dropout Rate measure based on Child Protective Services data and American Community Survey information that estimates the percentage of individuals in a given age range who are not in school and have not earned a high school diploma or equivalency certificate. This measure focuses on an overall age group rather than United States high school students and can be used to study general population issues. Number of Dropout Prevention Programs in Place in Each School - this number is tallied from the 10 programs listed in the survey distributed to West Virginia High School principals and is based on nine of 15 programs identified by the National Dropout Prevention Center as effective strategies for dropout prevention and one additional program, multiple pathways to graduation, which was cited as one of four policy recommendations and best practices for West Virginia by the National Governors Association (NGA) grant study (Achieving Graduation for All West Virginians, 2011). Principals Perceptions of the Effectiveness of Each Dropout Prevention Program refers to the four-point ranking, from highly effective to highly ineffective by each responding principals of his/her perceived effectiveness of the particular program in reducing the dropout rate at his/her school for the school year. 8
20 CHAPTER TWO REVIEW OF THE LITERATURE Policy researchers have called for national graduation rates of 90% by the year 2020 (Zaff et al., 2014). Despite efforts at the state and national levels, the dropout rate remained relatively consistent through the last quarter of the 20 th century. Local efforts brought about a decrease in dropout rates overall over the last five years, but the progress is uneven among states, with large populations of low-income and minority students still leaving school without completing (DePaoli et al., 2015). The dropout problem in the United States is not a new one, but the stakes are increasingly high. Labor economist Anthony Carnevale, Georgetown University, predicts that by 2018 nearly two-thirds of United States jobs will require some college education in addition to a high school diploma (Carnevale, Smith, & Strohl, 2010). According to this report, postsecondary education will provide access to occupations across the economy, while dropouts will be limited to three occupational clusters that are either declining or offer low wages: food and personal services, sales and office support, and blue collar jobs (Carnevale et al., 2010). The costs associated with dropouts do not end with lost wages. Increases in healthcare costs, crime spending, and other social issues associated with high dropout rates compound the problem. The benefits of an educated populace and the high costs of dropouts have been well documented (Levin, Belfield, Muennig, & Rouse, 2007; National Center on Education and the Economy, 2007; Rumberger, 2013). A high school diploma helps ensure happier, healthier citizens and a stronger, safer economy. High school graduates are more likely to be employed, earn more, and generate a stronger economy (Statista Portal, 2013). The median income of dropouts in 2009 was approximately $25,000, compared to approximately $43,000 for a high 9
21 school graduate, translating into approximately $630,000 in lost income over a dropout s lifetime (Rouse, 2007). Multiply that amount by the number of dropouts nationwide, and the societal costs are staggering. The Alliance for Excellent Education, a Washington, D.C.-based national policy and advocacy organization, reports that dropouts cost the nation billions in lost wages, taxes, and productivity over their lifetimes, with the 1.2 million dropouts reported in 2011 costing the nation approximately $154 billion over these students lifetimes (2011). Dropout rates affect quality of life in other ways, including overall health, as high school graduates have fewer health problems and longer life expectancies (Blackwell, Lucas, & Clarke, 2014; Rumberger, 2012). High school dropouts experience more heart and lung disease, including high blood pressure, stroke, emphysema, asthma, hay fever, chronic bronchitis, and obstructive pulmonary disease. They have more diabetes and kidney and liver problems, more back and neck pain, more vision and dental problems, and more mental health issues. Despite these problems, they are less likely to have a regular doctor or visit a doctor for care and more likely to visit the emergency room (Blackwell et al., 2014). Not only do high school graduates live healthier lives, they are also more likely to be involved in social and political issues. In both the 2004 and 2008 national elections, voting participation increased in direct proportion to educational attainment. In 2008, for example, 71% of those with a bachelor's degree reported voting, compared to 57% of those with some college education, 40% of high school graduates and 27% of high school dropouts (National Center for Educational Statistics, 2011). In addition to improved personal benefits and increased contributions to the economy and civic life, high school graduates are less likely to engage in criminal behavior or require social services (Machin, Marie, & Vujic, 2011; Moretti, 2005; Sum, Khatiwada, McLaughlin, & Palma, 10
22 2009). Failure to recognize the importance of high school graduation to the welfare of the general population may result in more serious overarching social issues. An independent task force chaired by former head of New York City Public Schools Joel Klein and former U.S. Secretary of State Condoleezza Rice charged that the United States failure to educate students threatens the country s ability to compete in a global economy and maintain its leadership role, and possibly even threatens national security (Klein, Rice, & Levy, 2012). This report highlights that dropouts are three times as likely to be unemployed as college graduates, three times as likely to live in poverty, and more likely to end up incarcerated. In addition, high school dropouts cannot serve in the United States military or serve in many roles that aid in national and local security (Klein et al., 2012). The benefits of dropout prevention both for individuals and for society are obvious, but identifying the most effective solutions has not been adequately addressed. History of Dropout Preventions Studies in the United States Federal, state and local programs to decrease dropout rates have been put in place throughout the United States, and results have been mixed. According to the National Center for Education Statistics, the dropout rate decreased from 12% to 7% from 1990 to 2013 (Kena et al., 2015), an encouraging statistic. In addition, studies have aided those attempting to curb the dropout rate; for example, the probability that a student will drop out increases based on several factors that have remained relatively stable. Socioeconomic status, for example, has consistently been a determining factor in dropout rates since 1972, when the National Council of Educational Statistics (NCES) began collecting data, with students from low-income families five times more likely to drop out than students from high-income families (Chapman, Laird, Ifill, & KewalRamani, 2011). This information is based on the national event dropout rate, an early 11
23 method used to collect data on dropout rates. The NCES defines the national event dropout rate as the percentage of private and public school students who left high school between the beginning of one school year and the beginning of the next without earning either a high school diploma or an equivalency certificate, which means it may not provide an accurate picture of the dropout rate overall but rather provides a snapshot of a particular school year (Chapman et al., 2011). However, because this data has been consistently gathered, it does provide data from the past 43 years that shed light on dropout trends. Since 1972, for example, national event dropout rates have been trending downward, from 6.1% in 1972 to 3.4% in In other words, fewer students are leaving school without receiving a diploma or certificate in recent years, and the trend holds true or Whites, African Americans, and Hispanics. Another method used to look at dropout rates is the national status dropout rate, which measures the percentage of individuals in a specific age range who are not enrolled in high school and who do not have a high school diploma or certificate. This rate will be higher in any given year than the event dropout rate because it includes all United States youth in the 16- to 24-year-old age range, which is an indicator or the proportion of young people without a high school diploma or certificate. In 2009, there were approximately three million 16- to 24-yearolds not enrolled in high school who had not received a high school diploma or certificate (Chapman et al., 2011). From 1972 to 2013, the status dropout rate was consistently highest for Hispanics, followed by Black, and then Whites. The rate during this period declined from 12.3 to 5.2% for Whites, from 21.3 to 9.3% for African Americans, and from 32.4 to 17.6% for Hispanics (Chapman et al., 2011). 12
24 Comparing these numbers to those of students who are members of the national averaged freshman graduation rate (AFGR), which uses aggregate student enrollment data to estimate the size of an incoming freshman class and aggregate counts of the number of regular diplomas awarded four years later, is difficult. AFGR numbers have only been tracked since 2004, and not all states began participating in the same year. In addition, current collection systems are inconsistent, providing further difficulties. However one looks at the AFGR numbers, they tell a darker story. The AFGR for public school students in the United States for the school year was 75.5%, ranging from 56.3% in Nevada to 90.7% in Wisconsin (Chapman et al., 2011). Despite the downward trends in dropout rates seen in both the national event dropout rate and status dropout rate measures, approximately one-fourth of students who begin with their cohort group in ninth grade do not graduate in four years with a high school diploma or certificate. Programs to Address Dropout Rates Dropout prevention programs to address the needs of at-risk students abound, and the approach each takes varies due to factors such as demographics, trained personnel, and funding sources. Researchers have attempted to identify key components of successful dropout prevention programs, and despite the disparate approaches, some commonalities have emerged that allow for classification of programs. Dynarski (2001) evaluated 20 programs funded by the School Dropout Demonstration Assistance Program. The report found effective interventions to include: (a) creating smaller schools with small class sizes, (b) encouraging teachers to develop better relationships with students, (c) providing individual educational assistance, (d) focusing on addressing personal and family issues, and (e) assisting students in obtaining GED certificates. Fashola & Slavin (1998) reviewed six dropout prevention programs for at-risk youth and found successful interventions to be (a) creating meaningful bonds between students and teachers 13
25 and among students, (b) connecting students to an attainable future, (c) providing academic assistance, and (d) recognizing family importance in children s achievement and school completion. Similarly, McPartland (1994), in reviewing dropout prevention programs and interviews from students who dropped out of school, found several successful academic intervention programs, including (a) offering academic assistance, (b) providing a caring, supportive environment, (c) connecting education to future endeavors, and (d) helping students resolve personal problems. Hayward & Tallmadge (1995), in an evaluation of dropout prevention and reentry projects in vocational education, supported smaller, more personal environments and also noted the importance of career-technical courses, formal counseling, and a structured environment with clear behavioral expectations. Programs created for students with identified problems varied but also included similar successful strategies. For example, three programs focusing on middle school students with learning and emotional/behavioral disabilities identified successful interventions as those that focused on (a) engagement, (b) strong adult relationships, (c) monitoring of interventions, (d) belongingness, and (e) problem-solving skills (Thurlow, Christenson, Sinclair, Evelo, & Thornton, 1995). In addition, Schargel & Smink (2001) looked at a program database generated by the National Dropout Prevention Center and noted that several factors played positive roles in dropout prevention, including (a) early intervention, with family involvement and strong reading and writing programs; (b) strong relationships; (c) personalized instruction; and (d) family and community involvement. Programs consistently emphasized the importance of strong relationships with teachers or adult role models in reducing dropout rates. These relationships were built through mentoring, extracurricular activities, tutoring, or related community 14
26 programs, but the importance of strong adult relationships in lowering dropout rates emerged in every study (Dynarski, 2001; Fashola & Slavin, 1998; Hayward & Tallmadge, 1995; McPartland, 1994; Schargel & Smink, 2001; Thurlow et al., 1995). Understanding the effectiveness of dropout prevention programs presents a challenge due to sheer number and variety, along with a lack of research-based evidence detailing outcomes. This study was designed to identify the types of dropout prevention programs in place in West Virginia schools in and examine their effectiveness as measured by graduation rates and principals perceptions. Use of Multiple Approaches to Address Dropout Prevention There is evidence supporting the idea that multiple approaches to preventing dropouts more effectively reduces dropout rates than using only one approach. Building a Grad Nation: Progress and Challenge in Ending the High School Dropout Epidemic reported that the programs achieving the best results in dropout prevention are those tackling multiple risk factors at once (Balfanz et al., 2014). Best practice guidance documents from multiple studies evaluating dropout prevention programs detail many programs addressing multiple risk factors for students (Balfanz et al., 2014; Christenson, 2002; Schargel & Smink, 2001), and some go so far as to state that multiple programs yield more effective intervention (Dynarski et al., 2008; Lehr, Johnson, Bremer, Cosio, & Thompson, 2004). The National Dropout Prevention Center noted that although interventions may appear to work independently, they actually work well together and frequently overlap in addressing dropout prevention (Effective Strategies for Dropout Prevention, 2015). Lehr, Johnson, Bremer, Cosio, & Thompson (2004), in a study designed to synthesize and identify effective research-based interventions, categorized dropout interventions into 15
27 personal/affective, academic, family outreach, school structure, and work-related. According to Lehr et al., 71% of effective programs studied included a personal/affective focus, 49% included an academic focus, and 73% included more than one type of intervention, an approach endorsed by many researchers as most effective (Dynarski et al., 2008). Lehr et al., defined the five intervention types and explained how they provide a variety of implementation approaches. Personal-affective interventions are defined as those related to self-esteem enhancement, individual counseling, or participation in interpersonal relations instruction. Academic interventions include those that provide special courses, individualized instruction, or tutoring. Family outreach interventions provide increased feedback to parents, home visits, or opportunities for increased school-related activities. School structure interventions create a school within a school, redefine the homeroom teacher role, reduce class size, or create an alternative school, and work-related interventions provide vocational training or participation in volunteer or service programs. The fact that key intervention components make up a part of many programs indicates that continued attention to empirical data supporting these as effective intervention components both alone and in combination is warranted. Student engagement interventions are indirectly targeted in these five categories and have increasingly gained attention as effective components of dropout prevention programs (Dynarski et al., 2008; Grannis, 1994), with academic, behavioral, cognitive, and psychological engagement interventions working together to help reduce dropout rates (Christenson, 2002). Student engagement may, however, be considered in a different context, as part of the workrelated/engagement component, when considered with such programs as fine arts, careertechnical exploration, and apprenticeship programs designed to empower youth and provide intrinsic motivation. Studies indicate that a combination of approaches may better address 16
28 multiple risk factors and offer educators more opportunities to tailor intervention efforts to local needs. Organization of Dropout Prevention Programs in West Virginia Evaluating the programs in place in West Virginia and understanding the key components that reduce dropout rates requires an understanding of the initiatives West Virginia has undertaken to address its high dropout rates. In December 2009, West Virginia and five other states were selected to participate in the National Governors Association Center for Best Practices Policy Academy on State Strategies to Achieve Graduation for All Grant. This grant provided the states with data analysis, technical assistance, and funds to help develop a comprehensive state plan for decreasing numbers of student dropouts. The report that came out of that grant, Achieving Graduation for All West Virginians (2011), helped guide West Virginia s policy development. According to the report, approximately 6900 students from the Class of 2009 did not graduate, resulting in combined lost lifetime earnings of $1.8 billion for that class and an increase to healthcare costs of $55.3 million. The report further states that a 5% increase in the West Virginia male graduation rate would result in an extra $35.8 million in revenue from increased earnings and reduced crime spending. West Virginia Senate Bill 228, passed March 12, 2011, created the Local Solution Dropout Prevention and Recovery Act (2011). Senate Bill 228 emphasizes the importance of high school graduation to individuals, the community, and the state, and acknowledges that dropping out is a process rather than an event, with factors that can be addressed over time. The bill specifically mentions 10 of the 15 strategies for dropout prevention cited by the National Dropout Prevention Center (NDPC) (Effective Strategies for Dropout Prevention, 2015), whose study addressing the 15 most effective strategies is also cited in the West Virginia Department of 17
29 Education s Comprehensive District/School Dropout Prevention Plans Guidance Document (2012). These 10 strategies include: (a) school-community collaboration; (b) safe learning environments; (c) family engagement; (d) early literacy development; (e) mentoring and tutoring services; (f) service learning opportunities; (g) alternative and nontraditional schools; (h) afterschool opportunities; (i) individualized instruction, and (j) career and technical education. In addition, the bill specifies offering multiple pathways and settings for attaining high school diplomas, which is not specifically named in the NDPC s study but was cited as one of four policy recommendations and best practices for West Virginia by the National Governors Association (NGA) grant study (Achieving Graduation for All West Virginians, 2011). This approach is also endorsed by organizations such as the America s Promise Alliance (Balfanz et al., 2014) and the Center on Reinventing Public Education, University of Washington, which defines multiple pathways to graduation as a problem-solving approach that assumes high school students need to learn at different times and in different ways and that the traditional approach to high school education does not address these needs (Marsh & Hill, 2010). Other recommendations by the NGA were to develop a statewide, early warning data system to increase dropout prevention training for teachers and administrators, and to create a fund to support collaborative, local solutions to the dropout problem. Senate Bill 228 addressed the National Governors Association recommendations by providing counties great leeway in implementation of dropout prevention programs through grant-writing opportunities that allow counties to bypass county and state board rules, policies, and interpretations within the confines of approved Innovation Zone Grants. West Virginia counties can write Innovation Zone grant proposals to address dropout prevention innovatively and obtain funds through a special revenue fund in the West Virginia 18
30 State Treasury. The Local Solution Dropout Prevention and Recovery Innovation Zones funding allows a school, group of schools, or school district to be declared a Local Solution Dropout Prevention and Recovery Innovation Zone, with the provisions that they provide evidence of individual, entity or community organization partnerships; proof of commitment from staff, parents, students, the county board of education, the local school improvement council and the school s business partners; and evidence of a plan for community awareness (Local Solution Dropout Prevention, 2011). Innovation Zone grantees must also utilize the statewide early warning system to identify students at risk. Designation as an Innovation Zone provides exception to county and state board rules, policies, and interpretations delineated within the grant plan, and funding is provided by the Local Solutions Dropout Prevention and Recovery Fund (Local Solution Dropout Prevention, 2011). The High School Graduation Improvement Act (HSGIA), also part of Senate Bill 228, further defines West Virginia s commitment to assisting students in earning a high school diploma and cites the need for vibrant, engaging programs, a plan for addressing truancy, an emphasis on career-technical education and job placement, credit recovery opportunities, optional pathways for graduation, and family and drug counseling services (High School Graduation Improvement Act, 2011). This Act requires county boards to demonstrate how they will use available funds to implement the HSGIA, with the goals of increasing the county graduation rate, identifying at-risk students as early as possible, providing options for at-risk students to obtain their diplomas and recovery credits, and offering GED services for students. Programs specifically named as options for academic credentials and career-technical training include Techademics, Earn a Degree-Graduate Early (EDGE), Health Sciences and Technology Academy (HSTA), Gaining Early Awareness and Readiness for Undergraduate Programs 19
31 (GEAR UP), truancy diversion, early intervention, dropout prevention, prevention resource officers, GED option, credit recovery, and alternative learning environments (High School Graduation Improvement Act, 2011). Principals Role in Dropout Prevention West Virginia holds principals responsible, in large part, for students academic performance and the overall performance of their schools. Students who are successful are students who graduate, so responsibility for graduation rate falls heavily on principals shoulders. According to West Virginia Code, 18A-1-1 (2015), principals are responsible for the supervision, management and control of a school or schools with a principal s major responsibility the general supervision of all the schools and all school activities involving students, teachers and other school personnel. West Virginia Code 18A-2-9 (2015) further defines principals as having, under the supervision of the county superintendent, administrative and instructional supervisory responsibility for the planning, management, operation and evaluation of the total educational program of his or her assigned schools. Further, the West Virginia Board of Education, through the Office of Educational Performance Audits (OEPA), holds schools, under the direction of the principals, responsible for students success, with the primary measures being attendance, academic performance, and graduation rate (West Virginia State Board Policy 2320, 2015). In West Virginia Code 18A-3A-2b (2015), the Legislature finds that the quality of the principal of a school is one of the most important factors in determining the academic achievement of students. Principals whose schools do not meet OEPA standards are required to attend the West Virginia Principals Leadership Academy, further emphasizing the state s assignation of responsibility for school and student success to the principal. 20
32 This assignation of principals responsibility for student achievement outcomes is supported in the literature in studies documenting principals role in school effectiveness. Hallinger and Heck (1998), in an article that reviews research from exploring the link between principals leadership and student achievement, affirm that this link is statistically significant, although indirect and relatively small. Research makes it clear that the foundation for instructional leadership rests with principals (Center for Comprehensive School Reform and Improvement, 2005; Soehner & Ryan, 2011). A meta-analysis by Waters, Marzano, and McNulty (2003) that explores 30 years of research on the effects of leadership practices on students achievement also indicates that school leadership plays a substantial role in student outcomes. This study explores a lengthy list of principals responsibilities, including culture, order, discipline, resources, curriculum, instruction, assessment, focus, visibility contingent rewards, communication, and many others. The key factor here is that principals do influence student outcomes, including academic achievement and graduation, but the way in which this is accomplished is complex and not easily interpreted. Although the research calls for more exploration of the specific methods by which principals influence student outcomes, the literature seems clear that principals play a key role and this role should be explored in determining effective interventions in preventing dropouts. This study will ask principals to identify key components of their schools dropout prevention programs based on those recommended in the West Virginia Department of Education s Comprehensive District/School Dropout Prevention Plans Guidance Document. This study will also explore principals perceptions of the effectiveness of these programs. The study will then seek to determine if there is a correlation between programs in place or not in place and principals perceptions with graduation rates during
33 CHAPTER 3 RESEARCH METHODS The purpose of this study is to explore the kinds of dropout intervention programs in place in in West Virginia high schools and to evaluate their effectiveness based on graduation rate changes, as well as principals perceptions of the programs impact. This study is set within the context of West Virginia s attempts to address high dropout rates by utilizing research from the National Dropout Prevention Center that identified 15 effective strategies for dropout prevention (Effective Strategies for Dropout Prevention, 2015). The study focuses specifically on nine of the 15 strategies that West Virginia adopted and referenced in their Comprehensive District/School Dropout Prevention Plan (CDSDPP) Guidance Document. The study also includes a tenth strategy, alternative paths to diploma, which was cited as one of four policy recommendations and best practices for West Virginia by the National Governors Association grant study (Achieving Graduation for All West Virginians, 2011). Research Design The researcher used non-experimental, survey research to collect and analyze data for this study. Data were collected from an Internet URL link to a survey ed to the entire population of 116 West Virginia high school principals for the school year (See Appendix B). Data were also collected from the same survey in the form of hard copies mailed via the United States Postal Service to the same population of 116 West Virginia high school principals for the school year Distributing the survey both online and via the U.S. Postal Service yielded 83 returned surveys, a response rate of 72%. Survey research was selected because questionnaires allow for contact with a large population, are relatively anonymous, easily scored, and allow respondents time to think about responses without pressure. 22
34 Data from the questionnaires were used to determine the percentage of responding schools utilizing each dropout prevention program in West Virginia High Schools during and the principals perceptions of programs effectiveness. The study also sought to determine if there was a correlation between use of multiple programs and low dropout rates and if not using a program affected graduation rate. Finally, the study sought to determine if principal perception of program effectiveness correlated with lower dropout rates. The survey instrument first asked principals to identify dropout prevention programs in place in their schools. Percentages were used to identify which programs were in place throughout West Virginia high schools. The researcher then used the number of programs in place in responding schools to determine if any relationship existed between the number of programs used and graduation rates. The instrument utilized statements that allowed principals to enter responses about their perceptions of the effectiveness of individual programs in place, based on a Likert-type scale, with four possible responses ranging from very effective to very ineffective. The survey included the option of indicating dropout prevention strategies that were not used in principals schools during the school year, and the researcher used this data to determine if a relationship existed between not using a program and graduation rates. Finally, the study compared principals perceptions of program effectiveness to dropout rates for the school year to determine if there was any relationship between principals perception of program effectiveness and dropout rates. Research Questions 1) What dropout prevention programs do principals identify as being in place in West Virginia high schools? 23
35 2) What relationship, if any, exists between the number of dropout prevention programs in place and graduation rates? 3) What are principals perceptions of the effectiveness of each dropout prevention program? 4) What relationship, if any, exists between principals perceptions of the effectiveness of each dropout prevention program and graduation rates? 5) What relationship, if any, exists between programs not used and graduation rates? Population and Sample The sample consisted of 116 West Virginia high school principals listed in the 2015 West Virginia School Directory, published by the West Virginia Department of Education. Because this is a relatively small population, the entire population was surveyed. Survey invitations were sent directly to 116 individuals (n=116) via online survey and also via hard copy mailed through the United State Postal Service. Eighty-three principals chose to participate (n=83). This response rate was 72%. Although a response rate of >80% is considered optimum, Evans deems a 70% response rate acceptable for studies of this type (1991). Eighty-three respondents yielded a confidence rate of 95% with a 5.8% margin of error (Sample Size Calculator, 2016). Instrumentation The researcher-created survey instrument in this study was designed to determine what dropout prevention programs were in place in and principals perceptions of those programs effectiveness (See Appendix B). Examples of school-specific programs that would fall under each general program were drawn from the West Virginia Comprehensive District/School Dropout Prevention Plans Guidance Document (2012). The instrument provided respondents with a list of dropout prevention programs, along with some examples of each and 24
36 asked them, using a Likert-type scale, to rate each program based on their perceptions of its effectiveness in decreasing dropout rates. The instrument also gave the option of identifying the program as one not used at the principals schools during the school year. A field test of the survey instrument, using a small sample of high school counselors, was conducted to ensure that the survey sent to the larger population allowed the research questions to be answered and that the questions were properly phrased (i.e., free of bias and not confusing). High school counselors were chosen because they have access to similar information regarding dropout prevention as high school principals and are frequently involved in dropout prevention efforts. The survey instrument was administered electronically using the web-based Survey Monkey survey tool. Potential respondents were contacted via and provided with a link to the survey. To increase the number of respondents after the initial was sent with two reminders, a mailed copy, via the United States Postal Service, was sent to all principals with a stamped return envelope. Great care was taken, both in the design of the survey instrument and in the collection and analysis of results, to maintain the confidentiality of respondents to the greatest extent possible. Principals were not asked to identify themselves or their schools, and the survey questions did not offer hints as to schools identities. Data Collection and Analysis Surveys were distributed to 116 administrators working as West Virginia high school principals in , via an online electronic survey instrument, in early October Those who did not reply received an automatically generated second and third request. This initial request for information yielded 51 respondents, so hard copies of the survey were sent to all principals. This yielded an additional 32 responses, for a total of 83. Survey data from 25
37 responses were entered into and analyzed using the IBM SPSS Statistics Program (SPSS), version 22, to produce comparative statistics from survey responses. Question One was answered by adding numbers of programs used by responding schools, converting this information into percentages, and entering those percentages into a table (See Table 1). Question Two was answered using a Pearson Product-Moment Correlation to determine if having more programs in place resulted in a higher graduation rate (See Table 2). Question Three used a Chi-square test to determine how principals as a whole felt about each of the 10 programs (See Table 3). Mean ratings of the programs based on principals perceptions were also obtained (See Table 3). An Analysis of Variance (ANOVA) was run for each school to determine if graduation rates were related to principals perceptions to answer Question Four (See Table 4). Question Five, which explored the relationship between graduation rates and programs that were not in place, was analyzed using Independent Samples T-tests (See Table 5). 26
38 CHAPTER FOUR FINDINGS In this study, data were collected and analyzed from surveys both online and via hard copy in order to determine 1) what dropout prevention programs principals identify as being in place in West Virginia high schools; 2) what relationship, if any, exists between the number of dropout prevention programs in place and graduation rates; 3) principals perceptions of the effectiveness of each dropout prevention program; 4) what relationship, if any, exists between principals perceptions of the effectiveness of each dropout prevention program and graduation rates, and 5) what relationship, if any, exists between programs not in place and graduation rates? The purpose of this chapter is to provide an analysis of the data collected from these surveys. Surveys were collected from 83 of 116 West Virginia high school principals regarding programs in place in This chapter includes information on the sample and analysis for each question. Sample The sample for this study included the entire population of 116 West Virginia high school principals for The entire population was surveyed because of the small population size. From the 116 principals invited to participate, 83 responded, for a response rate of 72%. Analysis of Data Question One: What dropout prevention programs do principals identify as being in place in West Virginia high schools? Answers for principals for Question One were chosen based on those identified by the National Dropout Prevention Center as effective strategies for dropout prevention and subsequently cited in West Virginia Senate Bill 228, passed March 12, 2011, which created the Local Solution Dropout Prevention and Recovery Act of 2011, in 27
39 addition to multiple pathways to graduation, cited as one of four policy recommendations and best practices for West Virginia by the National Governors Association (NGA) grant study (Achieving Graduation for All West Virginians, 2011). The results of Question One, which asks what types of dropout prevention programs are in place in West Virginia, are detailed below in Table 1, with the percentages of responding principals indicating each program s use in their schools. A rating of any type was considered confirmation of the program being in place, as an option of the program not being used at the school was also part of each survey question. The data were gathered by counting the occurrences in columns entered into SPSS, as reported by responding principals. Table 1 Percentage of Schools with Each Program in Place in School Program (n=83) Percentage of Schools Reporting Program in Place School-Community Collaboration Programs 71% Safe Learning Environment Programs 81% Family Engagement Programs 86% Mentoring/Tutoring Programs 89% Service Learning Programs 63% Alternative School Programs 94% Alternative Pathways to Diploma Programs 89% After School Opportunities 95% Individualized Instructional Programs 89% Career and Technical Education Programs 93% The programs reported in place by the greatest percentage of schools included After School Opportunities (95%), Alternative School Programs (94%), and Career and Technical 28
40 Education Programs (93%). The least-represented programs were Service Learning Programs (63%) and School-Community Collaboration Programs (71%). These data serve to give an overall picture of the programs in place in West Virginia for Question Two: What relationship, if any, exists between the number of dropout prevention programs in place and graduation rates? Question Two explores the possible relationship between the number of dropout programs in place in each responding school and graduation rates at those schools. The programs principals indicated as being in place at each responding school were added to get the total number of programs in place at each school. A Pearson Product-Moment Correlation test was used to determine if more programs in place correlated to a higher graduation rate. In this case, variable X is the number of programs in place at each responding school, and variable Y is the graduation rate at each responding school. A Pearson Product-Moment Correlation was run to answer Question Two and determine the relationship between the number of dropout prevention programs and the high schools graduation rates. There was a weak, negative correlation between number of programs and graduation rate, which was not statistically significant (p <.05). See Table 2. Table 2 Pearson Product-Moment Correlation Between Number of Programs in Place and Graduation Rate Variable Response Pearson Correlation Significance Number of Programs n=83 Graduation Rate n= Note: p <.05 29
41 Question Three: What are principals perceptions of the effectiveness of each dropout prevention program? Question Three explores the responding principals perceptions about the effectiveness of dropout prevention programs in place in their schools. First, mean ratings of the programs based on principals perceptions were obtained. All programs were rated with some degree of effectiveness by principals overall. School-Community Collaboration had the lowest mean rating, while Career/Technical Education Programs had the highest. See Table 3. Then, the data were analyzed using the Chi-square test to determine how principals as a whole group felt about each of the 10 programs. The data were entered into SPSS with principals (represented by numbers) entered as nominal data. The number assigned to each principal guaranteed anonymity on the survey, and it allowed SPSS to differentiate among responders. The ordinal data being analyzed were represented by numbers 1 through 4 assigned to the percentages reported by principals, with 1 representing Very Ineffective, 2 representing Ineffective, 3 representing Effective, and 4 representing Very Effective. No value was recorded for programs reported by responding principals as not in place at their schools. The Chi-square test was used to examine proportions of principals perceptions with expected proportions to see if they were significantly different. The Chi-square value was expected to increase as the difference between observed proportions and expected proportions increased. Whether the calculated Chi-square value was significant was determined by comparing it with the value from the table. If the calculated value exceeded the table value, the difference between the observed and expected frequencies was taken as significant; otherwise, it was considered insignificant. Table 3 gives details about the results obtained. 30
42 Table 3 Principal Perceptions of Effectiveness of School Programs Using Chi Square and Means School Program Chi Square statistic Probability level attained Mean Rating Of Effectiveness Frequency of Participant Responses Q1 n=59** School-Comm. Collaboration Programs Q2 n= 67** Safe Learning Environment Programs Q3 n=71** Family Engagement Programs Q4 n=74** Mentoring/Tutor ing Programs Q5 n= 52** Service Learning Programs Q6 n=78** Alternative School Programs Q7 N=74** Alt. Pathways to Diploma Programs Q8 n=79** After School Opportunities Q9 n=74** Individualized Instructional Programs Q10 n=77** Career and Technical Ed. Programs Very Ineffective Ineffective Effective Very Effective * * * * * * * * * * * Significance attained at the p<0.05 level **n= number of programs reported in use out of 83 responding principals of WV high schools 31
43 The Chi Square test showed significance for every question principals used to rate dropout prevention programs. This would indicate that principals agree on relative effectiveness or ineffectiveness of programs. For Questions 1, 2, 3, and 9, significance occurs between Effective and the other three levels, including Very Effective, Ineffective, and Very Ineffective. These programs include School-Community Collaboration, Safe-Learning Environment, Family Engagement, and Individualized Instructional programs. For Questions 4, 6, 8, and 10, significance occurs between both Very Effective and Effective and the other two areas. These programs include Mentoring/Tutoring, Alternative School, After School Opportunities, and Career and Technical Education programs. This would indicate that more principals believe these four programs are effective than the others, overall. For Question 5, the significance occurs between Effective and the areas of Very Effective and Ineffective, as no respondents chose Very Ineffective. For Question 7, significance occurs between Very Effective and the other three areas. Alternative Pathways to Diploma Programs is the only program where the significance occurs between Very Effective and the three other areas, indicating principals believe this is the most effective program. Question Four: What relationship, if any, exists between principals perceptions of the effectiveness of each dropout prevention program and graduation rates? Data for Question Four, which explores the possible relationship between principals perceptions and the actual graduation rates at responding schools, were statistically analyzed using an ANOVA. The null hypothesis was that the distribution of graduation rates would be the same across all categories (Very Effective, Effective, Ineffective, and Very Ineffective) of each question. For Question Seven, significance was attained at.042, (p <.05), indicating a relationship between 32
44 principals perceptions and graduation rates for Alternative Pathways to Diploma Programs. The ANOVA yielded no other significance for any program. See Table 4. Table 4 ANOVA - Relationship Between Principal Perceptions of Effectiveness and Graduation Rate School Program Significance Q1 n=59 School-Community Collaboration Programs.091 Q2 n= 67 Safe Learning Environment Programs.661 Q3 n=71 Family Engagement Programs.852 Q4 n=74 Mentoring/Tutoring Programs.169 Q5 n= 52 Service Learning Programs.704 Q6 n=78 Alternative School Programs.987 Q7 N=74 Alternative Pathways to Diploma Programs.042* Q8 n=79 After School Opportunities.453 Q9 n=74 Individualized Instructional Programs.462 Q10 n=77 Career and Technical Education Programs.744 *Significance attained at p<.05 33
45 Question Five: What relationship, if any, exists between programs not used and graduation rates? Question Five, which explores the possible relationship between graduation rate and whether or not programs were in place, was statistically analyzed using an Independent Samples T-test to determine if graduation rates were related to whether or not a program was in place. See Table 5. Table 5 Difference in Mean Graduation Rate due to Programs in Place/Not in Place School Program Q1 School-Comm. Collaboration Programs Q2 Safe Learning Environment Programs Q3 Family Engagement Programs Q4 Mentoring/Tutoring Programs Q5 Service Learning Programs Q6 Alternative School Programs Q7 Alt. Pathways to Diploma Programs Q8 After School Opportunities Q9 Individualized Instructional Programs Q10 Career and Technical Education Programs Schools With or Without Programs in Place Mean (SD) Graduation Rate t-test Statistic Probability level attained In Place (5.49) Not in Place (4.24) In Place (5.21) Not in Place (4.53) In Place (5.06) Not in Place (5.63) In Place (5.21) Not in Place (4.77) In Place (4.98) Not in Place (5.43) In Place (5.08) Not in Place (4.66) In Place (5.09) Not in Place (5.37) In Place (5.20) Not in Place (3.86) In Place (4.82) Not in Place (7.26) In Place (5.09) Not in Place (6.22) * Significance attained at the p<0.05 level The researcher found no statistically significant results showing a relationship between programs not in place and graduation rate. 34
46 Provisions for Protection of Student Information No information specific to individual students was be gathered, so students were not directly affected in any way by the study itself. Principals filled out surveys online or filled out and returned mailed copies anonymously. Because principals indicated their own graduation rate data for , schools were not identified in any way. In addition, the questions asked did not in any way give information about or link to a particular school or principal. 35
47 CHAPTER FIVE SUMMARY DISCUSSION OF FINDINGS, CONCLUSIONS, AND RECOMMENDATIONS Chapter Five presents a summary discussion of findings, conclusions, and recommendations based on study results. The study used non-experimental survey research to determine 1) what dropout prevention programs principals identify as being in place in West Virginia high schools; 2) what relationship, if any, exists between the number of dropout prevention programs in place and graduation rates; 3) principals perceptions of the effectiveness of each dropout prevention program; 4) what relationship, if any, exists between principals perceptions of the effectiveness of each dropout prevention program and graduation rates, and 5) what relationship, if any, exists between programs not in place and graduation rates. Eightythree principals (72%) returned questionnaires from among those ed and mailed via United States Postal Service to 116 West Virginia high school principals. Descriptive statistics were used to present the questionnaire data analysis. Discussion of Findings The following sections deals with the study s five research questions and the findings for each question. Question One asks principals to identify the dropout prevention programs in place in West Virginia high schools by identifying those in place at their schools from a list of 10 programs. Nine of the 10 intervention programs used in this study were identified by the National Dropout Prevention Center as effective dropout prevention programs and were adopted by West Virginia. In addition, this study included principals perceptions of the state s use of multiple pathways to graduation, as this is suggested for county use in the WVDE CDSDPP Guidance Document, which was developed to help counties develop comprehensive 36
48 district/school dropout prevention and alternative education plans, as mandated by Senate Bill 228. Question Two explores whether a relationship exists between the number of dropout programs in place and graduation rates at these schools. Question Three explores principals perceptions of the effectiveness of each of the 10 dropout prevention programs used in the study. Question Four explores the relationship between principals perceptions of the effectiveness of each dropout prevention program and graduation rates. Question Five explores whether or not a relationship exists between a school not having a particular program in place and that school s graduation rate. This section deals with each question, in the order given. Question One: What dropout prevention programs do principals identify as being in place in West Virginia high schools? Six programs were reported as in place by 89% or more of principals. Three programs were reported to be in place in more than 92% of schools: After School Programs (95%), Alternative School Programs (94%), and Career and Technical Programs (93%). After School Programs and Alternative School Programs both target students who are not successful in the regular classroom setting, either because of behavioral problems or failure to successfully complete work. Career and Technical Programs attempt to target students career interests. Mentoring/Tutoring Programs, Alternative Pathways to Diploma, and Individualized Instructional Programs are reported as being in place by 89% of principals. All three of these programs target individual needs, including assistance in passing classes, alternative methods for attaining a diploma, and programs directed at students individual learning styles. Over 80% of principals reported Family Engagement Programs and Safe Learning Environment Programs as being in place. These programs target environmental and familial issues that may affect students learning. Seventy-one percent reported School-Community 37
49 Collaboration Programs in place. These programs vary greatly but attempt to tap into community resources in some way. These programs are related to Service Learning Programs, the least reported at 63%, which are programs that attempt to engage students in service projects that serve their community in some way and are related to their academic programs. Question Two: What relationship, if any, exists between the number of dropout prevention programs in place and graduation rates? A Pearson Product-Moment Correlation was run to see if there was a relationship between the number of programs in place and graduation rates. The resulting significance of was not significant at the p <.05 level, indicating a lack of significant correlation here between number of programs in place and graduation rates. See Table 2. This result does show an extremely weak correlation between having more programs and a lower graduation rate. Question Three: What are principals perceptions of the effectiveness of each dropout prevention program? Question Three looked at the perceptions of the principals as a whole regarding each program studied. The null hypothesis tested by Chi Square is that there will be no difference between an even distribution of principals perceptions across the four choices and what principals actually choose. The Chi Square analysis showed significance for every question, indicating that principals responses concerning perceived effectiveness of these programs is statistically significant. See Table 3. Chance alone cannot account for this, which indicates that principals have a strong level of agreement in their perceptions of programs effectiveness. It is important to note that the small sample size influenced the mean level of effectiveness. For example, despite the fact that the majority of principals rated School- Community Collaboration Programs as Effective, the mean level of effectiveness was This mean was affected by the sample size of 59 principals reporting the program in place. 38
50 Question Four: What relationship, if any, exists between principals perceptions of the effectiveness of each dropout prevention program and graduation rates? Question Four examines the relationship between principals perceptions and the actual graduation rates at their schools. The ANOVA shows significance between principals perceptions and graduation rates for Alternative Pathways to Diploma. The fact that the only significance found is for Alternative Pathways to Diploma programs indicates there is little support for a relationship between principals perceptions of programs effectiveness and graduation rates. A closer look at Alternative Pathways to Diploma may shed some light on why this is the only program showing significance, and this will be discussed further in Conclusions and Recommendations sections. Table 4 demonstrates the same effect of small sample size on mean discussed with regard to School-Community Collaboration Programs in the discussion of Question Three. When considering the Chi Square results, Alternative Pathways to Diploma, with a mean of (n=74), shows significance between Very Effective and the three other areas. Comparing this to Career and Technical programs, with a mean of (n=77), where the significance is seen between the combined Effective and Very Effective and the other two areas, shows the effect of a relatively small sample size on mean. Both programs had 41 principals rate them Very Effective, but significance is seen for Alternative Pathways to Diploma Programs and not for Career and Technical Programs, despite the lower mean score for Alternative Pathways to Diploma. This highlights the difficulties of drawing conclusions with a small sample size, as every respondent has a greater effect on the results than would be seen with a larger sample size. Question 5: What relationship, if any, exists between programs not used and graduation rates? This question sought to determine if a relationship exists between programs not used and graduation rates in order to determine if the absence of any program affected 39
51 graduation rates. The study did not find any relationship between programs not in place and graduation rate. Conclusions Programs put in place after West Virginia participated in the National Governors Association grant and developed the Achieving Graduation for All West Virginians report (2011) may be having a positive effect. In , West Virginia led the nation in improving graduation rates, with the fourth-greatest increase, from 81.4% in to 84.5% in (Hodousek, 2015). This included an increase from 62.1% to 70.3% for students with disabilities and an increase of 73.7% to 80.1% for economically disadvantaged students. In February 2016, Governor Tomblin recognized 47 West Virginia high schools whose graduation rates exceeded 90% in 2015 (Kercheval, 2016). Despite this encouraging news, 47 of 116 schools is only 41%, and State Superintendent Martirano declared a goal of 90% for all West Virginia high schools by 2020 (Hodousek, 2015). West Virginia schools have a long way to go to achieve this goal, and dropout prevention programs will continue to play a role in helping high schools get there. Question One in this study sought to determine the percentage of schools using each of the 10 programs included in the study. The most commonly used programs were After School Opportunities (95%), Alternative School Programs (94%), and Career and Technical Education Programs (93%). These were followed closely, at 89% each, by Mentoring/Tutoring Programs, Alternative Pathways to Diploma, and Individualized Instructional Programs. Greater use of these six programs would imply that schools are responding to the need to address problem behaviors, failures, and individualized learning needs most often when implementing innovative programs. 40
52 Career and Technical Education (CTE) Programs, in addition to addressing individual needs, have long been used to prepare students for employment. CTE Programs ability to engage students and build bridges to employment opportunities and higher education is welldocumented (Guarino & Yoder, 2015; Brand, Valent, & Browning, 2013; United States Department of Education, 2012). Some counties have what are called Comprehensive High Schools, with CTE programs integrated into the school day, while others have centralized CTE Centers, where students from multiple schools and sometimes multiple counties gather for at least part of the school day to take career and technical classes. The four remaining programs are Family Engagement (86%), Safe Learning Environment (81%), School-Community Collaboration (71%), and Service Learning (63%). These four programs often involve partnerships with outside entities and may require more collaboration to implement than programs such as the first six, which fall under the purview of school management. In considering whether more programs resulted in a higher graduation rate (Question Two), the study did not consider specific combinations but looked only at the number of programs in place. The Pearson Product-Moment Correlation showing an extremely weak correlation (-.126, with significance attained at p <.05) between having more programs and a lower graduation rate may or may not indicate a direction to seek more information. At most, these results suggest that simply using more programs does not yield higher graduation rates. In fact, it suggests that using more programs may lower graduation rates. Further study would have to be done to determine if this is the case and what the reason for this relationship might be. In other words, determining if a broader focus is not necessarily a more effective focus would need more in-depth study. 41
53 The study did find that principals have a strong level of agreement in their perceptions regarding programs effectiveness. For example, the results of Question Three indicate that principals agree that four of the dropout prevention programs in the study are Effective or Very Effective. Three of these four programs Mentoring/Tutoring, Alternative Schools, and After School Opportunities Programs offer students academic assistance or alternative settings when they have not been successful in the regular classroom environment. This would include students experiencing academic and social/emotional problems that may display as disciplinary issues. Students for these programs self-identify or are funneled into programs based on need or inability to function successfully in the normal classroom. Participants vary from students who are remediating an individual class or need tutoring assistance to be successful to those who have been expelled and are mandated to attend an alternative school program. The fourth of the four dropout prevention programs that principals indicate as being Effective or Very Effective is Career and Technical Education programs. These programs, formerly called vocational classes, appeal to students interests and desire to build job skills. All four of these programs are in place at 89% or more of the schools surveyed. The second group of programs that principals as a group identify as being Effective rather than Very Effective, Ineffective, or Very Ineffective are School-Community Collaboration, Safe-Learning Environment, Family Engagement, and Individualized Instruction. Three of these four programs are based on building relationships to support students. School- Community Collaboration and Family Engagement Programs work to bring in community and family support, while Safe-Learning Programs often focus on building relationships and responsible behavior among students. In all three programs, responsibility and a sense of obligation to others underlie many activities of these programs. Individualized instruction is 42
54 another program that targets individual learning needs, and it is usually attempted in the regular classroom setting. Generally, an individualized instructional program is set up not in response to deficits but rather as a teaching method or classroom offering that attempts to differentiate instruction or offer classes based on student learning modalities and levels of mastery. Service Learning Programs was the only category where no principal rated the program as Very Ineffective, with significance occurring between Effective and the other two areas of Very Effective and Ineffective. Service Learning Programs in high schools often fall under other organizations, such as honor societies, clubs, or the Junior Reserves Officer s Training Corp (JROTC) programs. These organizations goals, which seek to help students understand the meaning of citizenship, civic engagement and their own ability to determine and affect the quality of life in their communities, often overlap with Service Learning Program goals (Army Junior Reserves Officer Training Corps, 2015). Service Learning Programs do not have as many grant opportunities as some other dropout prevention programs, and the impact of such programs may not be as apparent due to their often-embedded nature and the fact that they frequently target all students rather than only at-risk students. Alternative Pathways to Diploma, Question 7, is the only question where significance occurs between Very Effective and the other three areas. Programs falling under this category focus on getting students to graduate through innovative means that target potential dropouts as well as students who do not fit the typical high school student profile. This program is also the only one showing a relationship between principals perceptions and graduation rate on the ANOVA. The fact that this study found principals perceptions of program effectiveness to be consistent implies that schools are garnering similar results and struggling with similar issues 43
55 emanating from these programs and the issues they are designed to address. This study did not attempt to determine consistency of program implementation, and many of these programs are adapted to suit a particular school s needs, so drawing conclusions about these programs in very specific terms remains impossible without further study. The program principals agree to be most effective, Alternative Pathways to Diploma, is the most consistently implemented among the programs, as the structure of both Option Pathways and EDGE is mandated by the West Virginia Department of Education (WVDE). This might imply that more directives with regard to dropout prevention programs would yield more positive results. While the WVDE has encouraged innovative programs through such grants as the Innovation Zone Dropout Prevention Grant Program and policy implementation that supports CTE programs and community involvement, there has been little in the way of information regarding best practices and successful programs. The WVDE encourages informal visits to existing programs from schools attempting to implement new programs, but no formalized program study guide exists. Studies that probe the implementation and effectiveness of these programs could add valuable information to high schools repertoire of dropout prevention solutions. After offering alternative pathways to earning a diploma, principals responses indicate that programs focusing on remediating struggling students academic deficits continues to be the primary target in decreasing dropout rates. The fact that fewer principals indicated that schoolcommunity collaboration, family involvement and safe-learning environment programs are effective might simply indicate more attention should be paid to structure and implementation of these programs. The additional burden of establishing partnerships and working in collaboration 44
56 with outside entities and family members adds to the complexity of implementing these types of programs effectively. As stated, only Alternate Pathways to Diploma shows significance between principals perceptions and graduation rates (Question Four). Interestingly, this program is also the only program that principals most often rated as Very Effective. An example of this type of program is West Virginia s Option 1 Pathway program, a blend of Career Technical Education (CTE) courses and the Test Assessing Secondary Completion (TASC ) Tests (2015). Students remain enrolled at an accredited high school while participating in TASC classes, formerly known as General Equivalency Diploma (GED) classes. This voluntary program requires both parent/guardian and student signatures on the Student/Parent Application and Contract, and an Option Pathway Team meets to determine if this is an appropriate placement for the student. Option team members may include, but are not limited to, a CTE administrator/ principal/director, a school counselor, a CTE staff member, a school principal, an Option Pathway teacher, and a special education director/teacher if the candidate has an Individualized Education Plan and is receiving special education services (Option 1 Pathway, 2015). All Option Pathways fall under the supervision of the WVDE. Other options include Option Pathway 2 and Option Pathway 3. Option Pathway 2, Credit Recovery, allows seniors needing to pass only one subject (or several subjects in the same content area) in order to graduate to take that one content area of the High School Equivalency Diploma (HSEA). Option Pathway 3, High School Equivalency Diploma, allows students dropping out of school to take the HSEA prior to leaving school. In addition, Virtual Career Technical Concentrations provides flexible scheduling through virtual CTE concentrations; ontargetwv Credit Recovery allows students to recover credits they need for graduation and helps them develop academically 45
57 targeted skills and work habits, and the Individualized Work Readiness Credential (IWRC) provides students with moderate learning deficits the opportunity to gain work readiness and occupation specific skills through a CTE career. Another Alternative Pathways to Diploma Program is EDGE, short for Earn a Degree, Graduate Early (EDGE, 2006). The program allows high school students to earn free college credit while still enrolled in high school. Students can study health, human services, business, engineering and technical majors, among others. This program aims to motivate students and get them started on college credit that may encourage them to pursue higher education after high school. WVDE outlines requirements for each program, and schools throughout the state must follow WVDE guidelines. Principals may be especially familiar with these programs for use in dropout prevention. While Alternative Pathways to Diploma Programs are in place in 89% of reporting schools, this type of program is not the most frequently implemented. The fact that Alternative Pathways to Diploma is rated highly by principals in terms of effectiveness and also that it is the only program with statistical evidence suggesting improved graduation rates associated with its implementation may indicate that its usage should be considered a best practice. Question Five, which sought to determine if a relationship existed between programs not in place, and Question Two, which sought to determine if a relationship existed between number of programs in place and graduation rate, are indirectly related. Because the study did not find a relationship between programs not in place and graduation rate (Question Five), and the study did not find any relationship between the number of programs in place and graduation rate (Question Two), this raises the question of whether there might be a relationship between any specific combination of programs and higher graduation rates. It also suggests that the programs 46
58 used or not used may not be as important as the implementation of those programs. This provides yet another avenue to pursue in seeking information about program effectiveness. Perhaps the clearest conclusion to be gained from this study is that dropout prevention programs should not be implemented based solely on individual perception of a program s effectiveness. This study found little support for a relationship between principals perceptions and graduation rates at their schools. This information may inform those seeking programs to address dropout prevention in high schools across West Virginia. The next section deals with additional study that would increase understanding of program effectiveness and provide assistance in assessing programs. Recommendations Additional research on effective programs, completed by determining how programs are implemented and what components are most essential, should yield more detailed data on the approach educators could take to target at-risk students. The continued development of quality programs addressing at-risk students needs requires that schools receive more guidance in developing and implementing programs. Best Practices. Principals perceptions are important, but their perceptions were necessarily based perceptions on programs with which they are familiar as implemented at their schools. As there is currently little state guidance for most programs implementation, it is likely that program implementation varied widely. Alternative Pathways to Diploma, the one program that showed significance between principals perceptions and graduation rates, is also the one program of the 10 that has significant state guidance for implementation. Development of Best Practices for programs recommended in West Virginia s CDSDPP Guidance Document, with 47
59 program implementation guidance and examples of successful programs, would be useful to schools seeking to decrease dropout rates. ZoomWVe. The West Virginia Department of Education has been working to develop a better system for tracking student information over time. The public site for this information is called the ZoomWV Data Dashboard (ZoomWV, 2015). A more detailed site that provides educators with student-specific information, ZoomWVe, includes the ability to create cohort groups of students and track grades, attendance, and discipline. A study that assists principals in setting up such cohorts and tracking students changes over time while enrolled in specific dropout prevention programs could yield significant results. Longitudinal Studies. Studies of existing programs in West Virginia schools where dropout rates have declined (and graduation rates increased) over the past five years would be helpful in guiding such information. A study of existing programs would do well to consider a longitudinal study of program implementation over that same five year period. Qualitative study of program participants and administrators over time, in addition to more in-depth information from principals, could provide a better understanding of what is working and what is not working. Such studies would necessarily have to be within the past five years due to the cohort graduation rate computation. Program Participants Studies. In addition, studies that involve students who successfully graduate through participation in dropout prevention programs could produce useful information. The difficulties associated with finding and interviewing these students might prove daunting, but student insights would add depth to understanding dropout prevention programs effectiveness. 48
60 Implementation Studies. Finally, to trace graduation rates over the time period of implementation of a specific dropout prevention program could be helpful in evaluating a program s effectiveness, but this should also include a careful study of the method of implementation. The current study looked at principals perceptions, and while principals agreed in their overall assessment of program effectiveness, there is little statistical evidence to indicate these perceptions have a relationship to graduation rate. The study raised many interesting questions. For example, how involved with dropout prevention programs were the principals who answered the study? How were programs set up and evaluated? On what did principals base their assessment of program effectiveness? Interviews with principals themselves could offer insight into these questions and others raised by the study. Graduation rates in West Virginia are improving, and the dropout prevention programs in place throughout the state undoubtedly have had some impact on that phenomenon, but more studies need to be conducted. To fully understand the impact of these programs on graduation rate, a much more in-depth look at the programs and participants, the methods of implementation, and the impact of the program on graduation rates over time would be needed. Perceptions of principals, administrative personnel, and students themselves continues to be of interest as well, and more study exploring the relationship between perceptions and programs may help guide dropout prevention efforts. 49
61 REFERENCES Achieving Graduation for all West Virginians. (2011). Recommendations from the National Governors Association State Strategies to Achieve Graduation for All Planning Grant. Retrieved from NGA_Planning_Grant.pdf Alliance for Excellent Education. (2011). The high cost of high school dropouts: What the nation pays for inadequate high schools. Retrieved from /uploads/2013/06/highcost.pdf Army Junior Reserves Officer Training Corps. (2015). Retrieved from jrotc.com/jrotc-program/jrotc-program-information Aud, S., and Hannes, G. (Eds.). (2010). The condition of education 2010 in brief (NCES Washington, D.C.: National Center for Education Statistics, Institute of Education Sciences, U.S. Department of Education. Retrieved from Balfanz, R., Bridgeland, J. M., Fox, J. H., DePaoli, J. L., Ingram, E. S., & Maushard, M. (2014). Building a grad nation: Progress and challenge in ending the high school dropout epidemic. A Report by Civic Enterprises, Everyone Graduates Center at Johns Hopkins University, America s Promise Alliance, and Alliance for Excellent Education. Retrieved from FULL pdf Blackwell, D. L., Lucas, J. W., & Clarke, T. C. (2014). Summary health statistics for U.S. adults: National Health Interview Survey, National Center for Health Statistics. 50
62 Vital and Health Statistics, 10(260). Retrieved from series/sr_10/sr10 _260.pdf Brand, B., Valent, A., & Browning, A. (2013). How Career and Technical Education can help students be college and career ready: A primer. American Institutes for Research, College & Career Readiness & Success Center. Retrieved from Bureau of Labor Statistics. (2010). Number of jobs held, labor market activity, and earnings growth among the youngest baby boomers: Results from a longitudinal survey. U.S. Department of Labor, USDL Retrieved from /pdf/nlsoy.pdf Carnevale, A., Smith, N., & Strohl, J. (2010). Help wanted: Projections of jobs and education requirements through Washington, D.C.: Georgetown University Center on Education and the Workforce. Retrieved from Catalano, R. F., Berglund, M. L., Ryan, J. A. M., Lonczak, H. S., & Hawkins, J. D. (2004). Positive youth development in the United States: Research findings on evaluations of positive youth development programs. Annals of the American Academy of Political and Social Science, 591, Center for Comprehensive School Reform and Improvement. (2005). Role of principal leadership in improving student achievement. Retrieved from rockets.org/article/role-principal-leadership-improving-student-achievement Center for Law and Social Policy. (2012). Annual report. Retrieved from /clasp/docs/annual_report_web 51
63 Chapman, C., Laird, J., Ifill, N., & KewalRamani, A. (2011). Trends in high school dropout and completion rates in the United States: (NCES ). U.S. Department of Education. Washington, DC: National Center for Education Statistics. Retrieved from Christenson, S. L. (2002). Families, educators, and the family-school partnership: Issues or opportunities for promoting children s learning competence? Paper prepared for The Future of School Psychology Conference, Indianapolis, IN. Comprehensive District/School Dropout Prevention Plans Guidance Document. (2012). Charleston, WV: West Virginia Department of Education. Retrieved from https: //wvde.state.wv.us/innovationzones/documents/guidance%20document%20(3).pdf DePaoli, J. L., Fox, J. H., Ingram, E. S., Maushard, M., Bridgeland, J. M., & Balfanz, R. (2015). Building a grad nation: Progress and challenge in ending the high school dropout epidemic. Report by Civic Enterprises, Everyone Graduates Center at Johns Hopkins University, America s Promise Alliance, and Alliance for Excellent Education. Retrieved from /18006_CE_BGN_Full_vFNL.pdf Djamba, Y. K., Davidson, T. C., & Aga, M. G. (2012). Sexual health of young people in the U.S. South: Challenges and opportunities. Montgomery, AL: Center for Demographic Research. Dynarski, M. (2001). Making do with less: Interpreting the evidence from recent federal evaluations of dropout-prevention programs. Paper presented at Dropouts: Implications and Findings Conference, Cambridge, MA. Dynarski, M., Clarke, L., Cobb, B., Finn, J., Rumberger, R., and Smink, J. (2008). Dropout prevention: A practice guide (NCEE ). Washington, DC: National Center for 52
64 Education Evaluation and Regional Assistance, Institute of Education Sciences, U.S. Department of Education. Retrieved from EDGE. (2006). EDGE allows students to earn a degree, graduate early. West Virginia Department of Education. Retrieved from Effective Strategies for Dropout Prevention. (2015). National Dropout Prevention Center. Clemson, SC: National Dropout Prevention Center/Network. Retrieved from Erickson, D., Reid, C., Nelson, L., O Shaughnessy, A., & Berube, A. (Eds.). (2008). The enduring challenge of concentrated poverty in America: Case studies from communities across the U.S. Washington, D.C.: Federal Reserve System and the Metropolitan Policy Program at the Brookings Institution. Evans, S. J. (1991). Good surveys guide. BMJ, 302(6772), Retrieved from /pmc/articles/pmc /pdf/bmj pdf Fashola, O. S., & Slavin, R. E. (1998). Effective dropout prevention and college attendance programs for students placed at risk. Journal of Education for Students Placed at Risk, 3 (2), Grannis, J. C. (1994). The dropout prevention initiative in New York City: Educational reforms for at-risk students. In R.J. Rossi (Ed.), Schools and students at risk: Context and framework for positive change (pp ). New York, NY: Teachers College. Guarino, H. & Yoder, S. (2015). Seizing the future: How Ohio s career-technical education programs fuse academic rigor and real-world experiences to prepare students for college and careers. Washington, D.C.: Achieve. Retrieved from /fulltext/ed pdf 53
65 Hallinger, P. & Heck, R.H. (1998). Exploring the principal s contribution to school effectiveness: School Effectiveness and School Improvement: An International Journal of Research, Policy and Practice, 9(2), Hayward, B.J. & Tallmadge, G.K. (1995). Strategies for keeping kids in school: Evaluation of dropout prevention and reentry projects in vocational education. Washington, DC: U.S. Government Printing Office. High School Graduation Improvement Act of 2011, West Virginia Legislature, S (2011). Retrieved from SESSIONS/RS/Bills/SB228%20SUB1%20ENR.htm Hodousek, C. (2015, October 20). W.Va. high school graduation rates continue to improve. MetroNews. Retrieved from /2015/10/20/w-va-high-schoolgraduation-rates-continue-to-improve/ Johnson, J., Showalter, D., Klein, R., & Lester, C. (2014). Why rural matters : The condition of rural education in the 50 states. Washington, DC: Rural School and Community Trust. Kena, G., Musu-Gillette, L., Robinson, J., Want, X., Rathbun, A., Zhang, J., Wilkinson-Flicker, S., Barmer, A., Velez, E. D., Nachazel, T., Dziuba, A., Smith, W., Nelson, V., Robles- Villalba, V., Soo, W., & Ballard, D. (2015). The condition of education (NCES ). Retrieved from Kercheval, H. (2016, February 29). WV high school graduation rate improving. MetroNews. Retrieved from 54
66 Kids Count Data Center (2015). High school students not graduating on time. Annie E. Casey Foundation. Retrieved from school-students-not-graduating-on-time?loc=50&loct=2#detailed/2/2-52/false/1024,937,809,712,517/any/14289,14290 Klein, J. I., Rice, C., & Levy, J. (2012). U.S. education reform and national security. Council on Foreign Relations (Independent Task Force Report No. 68). Washington, D.C.: Brookings Institution Press. Lehr, C. A., Johnson, D. R., Bremer, C. D., Cosio, A., & Thompson, M. (2004). Essential toolsincreasing rates of school completion: Moving from policy and research to practice. National Center on Secondary Education and Transition, University of Minnesota. Retrieved from Levin, H., Belfield, C., Muennig, P., & Rouse, C. (2007). The costs and benefits of an excellent education for all of America s children. Columbia University. Retrieved from Local Solution Dropout Prevention and Recovery Innovation Zone Act of 2011, West Virginia Legislature, S B-11 (2011). Retrieved from Bill_Text_HTML/2011_SESSIONS/RS/Bills/SB228%20SUB1%20ENR.htm Machin, S., Marie, O., & Vujic, S. (2011). The crime reducing effect of education. The Economic Journal, 121(552), Retrieved from /enhanced/doi/ /j x/ Marsh, S. & Hill, P. (2010). Multiple pathways to graduation: New routes to high school completion (crpe working paper # 2010_2). Center on Reinventing Public Education, 55
67 University of Washington. Retrieved from files/wp_crpe2_multpathwys_may10_0.pdf McPartland, J. M. (1994). Dropout prevention in theory and practice. In R.J. Rossi (Ed.), Schools and students at risk: Context and framework for positive change (pp ). New York: Teachers College. Moretti, E. (2005). Does education reduce participation in criminal activities? Presented at the Social Costs of Inadequate Education Symposium, New York, NY. Retrieved from symposium/files/74_moretti_symp.pdf National Center for Educational Statistics. (2011). Youth indicators 2011 America s youth: Transitions to adulthood. U. S. Department of Education Institute of Education Sciences. Retrieved from National Center on Education and the Economy. (2007). Tough choices or tough times: The report of the New Commission on the Skills of the American Workforce. San Francisco, CA: Jossey-Bass. Option 1 Pathway. (2015). West Virginia Department of Education. Retrieved from Rouse, C. E. (2007). Quantifying the Costs of Inadequate Education: Consequences of the Labor Market. In C. R. Belfield & H. M. Levin (Eds.), The Price We Pay: Economic and Social Consequences of Inadequate Education (pp ). Washington, DC: Brookings Institution Press. Rumberger, R. W. (2012). America cannot afford the stiff price of a dropout nation. Silicon Valley Education Foundation. Retrieved from /01/24/america-cannot-afford-the-stiff-price-of-a-dropout-nation/ 56
68 Rumberger, R. W. (2013). Poverty and high school dropouts. American Psychological Association. Retrieved from /05/poverty-dropouts.aspx Sample Size Calculator. (2016). SurveyMonkey. Retrieved from monkey.com/mp/sample-size-calculator/ Schargel, F. P., & Smink, J. (2001). Strategies to help solve our school dropout problem. Larchmont, NY: Eye on Education. Soehner, D., & Ryan, T. (2011). The interdependence of principal school leadership and student achievement. Scholar-Practitioner Quarterly, 5(3), Statista Portal. (2013). Unemployment rate of high school graduates and dropouts not enrolled in school in the United States from Retrieved from statista.com/statistics/184996/unemployment-rate-of-high-school-graduates-anddropouts/ Steinberg, A. & Almeida, C. (2004). The dropout crisis: Promising approaches in prevention and recovery. Washington, D.C.; Carnegie Corp. of New York, NY. Retrieved from ERIC database. (ED497810) Sum, A., Khatiwada, I., McLaughlin, J., & Palma, S. (2009). The consequences of dropping out of high school: Joblessness and jailing for high school dropouts and the high cost for taxpayers. Boston, MA: Northeastern University Center for Labor Market Studies. Retrieved from Consequences_of_Dropping_Out_of_High_School.pdf Thurlow, M. L., Christenson, S., Sinclair, M., Evelo, D.L., & Thornton, H. (1995). Staying in school: Middle school students with learning and emotional disabilities. (ABC Dropout 57
69 Prevention and Intervention Series). Minneapolis, MN: University of Minnesota, Institute on Community Integration. Retrieved from ERIC database. (ED398671) United States Department of Education. (2012). Investing in America s future: A blueprint for transforming career and technical education. Washington, D.C.: Office of Vocational and Adult Education. Retrieved from Waters, T., Marzano, R. J., & McNulty, B. (2003). Balanced leadership: What 30 years of research tells us about the effect of leadership on student achievement. Aurora, CO: Mid-Continent Research for Education and Learning. Retrieved from West Virginia Blue Ribbon Commission on Highways. (2015). Investing in West Virginia s future: Phase I. Retrieved from commission/documents/wvbrc%20final%20report.pdf West Virginia Code, 18A-1-1. (2015). Retrieved from Code.cfm?chap=18&art=1 West Virginia Code 18A-2-9. (2015). Retrieved from ChapterEntire.cfm?chap=18a&art=2§ion=9#02 West Virginia Code 18A-3A-2b. (2015). Retrieved from WVCODE/ChapterEntire.cfm?chap=18a&art=3A§ion=2B#03A Zaff, J. F., Jones, E. P., Anderson, S. E., McClay, C., Maharaj, M., Carvalho, A., Otto, S., Prescott, J.E., & Johnson, A.R. (2014). Don t call them dropouts: Understanding the experiences of young people who leave high school before graduation. Tufts University: 58
70 America s Promise Alliance and its Center for Promise. Retrieved from ZoomWV. (2015). ZoomWV Data Dashboard. West Virginia Department of Education. Retrieved from 59

71 APPENDIX A: ANONYMOUS SURVEY CONSENT 60
72 APPENDIX B: SURVEY INSTRUMENT Appendix B is the paper copy of the survey Dropout Prevention Programs in West Virginia Principals Feedback that principals received via United States Postal Service and also the form exported from the online survey program used initially to collect information from principals. 61
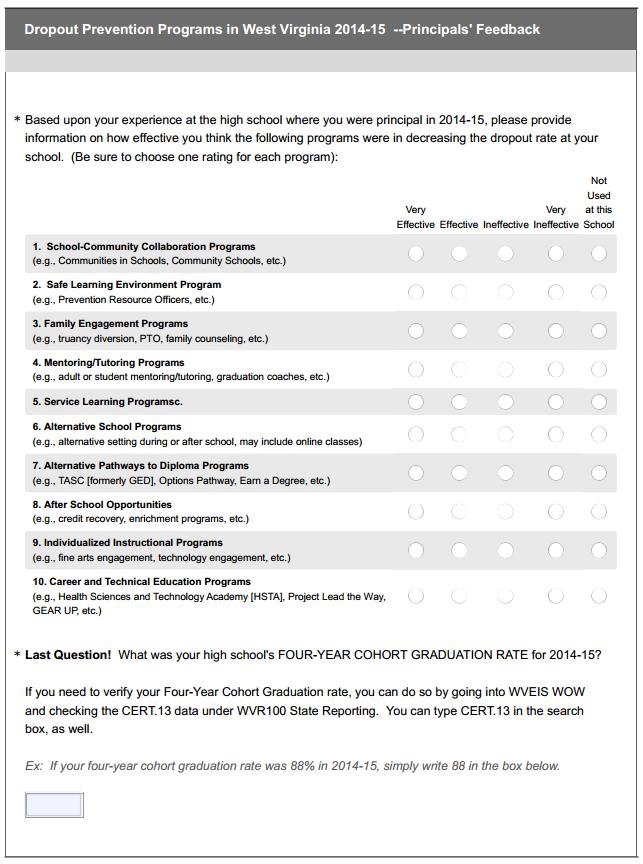
73 62
Chapter Six The Non-Monetary Benefits of Higher Education
 Chapter Six The Non-Monetary Benefits of Higher Education This Chapter addresses the third objective of the thesis. The purpose of this chapter is to document some of the non-monetary benefits associated
Updated: December Educational Attainment
 Updated: Educational Attainment Among 25- to 29-year olds, the proportions who have attained a high school education, some college, or a bachelor s degree are all rising, according to longterm trends.
Building a Grad Nation
 Building a Grad Nation Progress and Challenge in Ending the High School Dropout Epidemic Executive Summary Annual Update 2012 A report by Civic Enterprises Everyone Graduates Center at Johns Hopkins University
Trends in Tuition at Idaho s Public Colleges and Universities: Critical Context for the State s Education Goals
 1 Trends in Tuition at Idaho s Public Colleges and Universities: Critical Context for the State s Education Goals June 2017 Idahoans have long valued public higher education, recognizing its importance
Testimony to the U.S. Senate Committee on Health, Education, Labor and Pensions. John White, Louisiana State Superintendent of Education
 Testimony to the U.S. Senate Committee on Health, Education, Labor and Pensions John White, Louisiana State Superintendent of Education October 3, 2017 Chairman Alexander, Senator Murray, members of the
Executive Summary. Walker County Board of Education. Dr. Jason Adkins, Superintendent 1710 Alabama Avenue Jasper, AL 35501
 Dr. Jason Adkins, Superintendent 1710 Alabama Avenue Jasper, AL 35501 Document Generated On November 3, 2016 TABLE OF CONTENTS Introduction 1 Description of the School System 2 System's Purpose 4 Notable
THE ECONOMIC AND SOCIAL IMPACT OF APPRENTICESHIP PROGRAMS
 THE ECONOMIC AND SOCIAL IMPACT OF APPRENTICESHIP PROGRAMS March 14, 2017 Presentation by: Frank Manzo IV, MPP Illinois Economic Policy Institute fmanzo@illinoisepi.org www.illinoisepi.org The Big Takeaways
The number of involuntary part-time workers,
 University of New Hampshire Carsey School of Public Policy CARSEY RESEARCH National Issue Brief #116 Spring 2017 Involuntary Part-Time Employment A Slow and Uneven Economic Recovery Rebecca Glauber The
Delaware Performance Appraisal System Building greater skills and knowledge for educators
 Delaware Performance Appraisal System Building greater skills and knowledge for educators DPAS-II Guide for Administrators (Assistant Principals) Guide for Evaluating Assistant Principals Revised August
Moving the Needle: Creating Better Career Opportunities and Workforce Readiness. Austin ISD Progress Report
 Moving the Needle: Creating Better Career Opportunities and Workforce Readiness Austin ISD Progress Report 2013 A Letter to the Community Central Texas Job Openings More than 150 people move to the Austin
SASKATCHEWAN MINISTRY OF ADVANCED EDUCATION
 SASKATCHEWAN MINISTRY OF ADVANCED EDUCATION Report March 2017 Report compiled by Insightrix Research Inc. 1 3223 Millar Ave. Saskatoon, Saskatchewan T: 1-866-888-5640 F: 1-306-384-5655 Table of Contents
Descriptive Summary of Beginning Postsecondary Students Two Years After Entry
 NATIONAL CENTER FOR EDUCATION STATISTICS Statistical Analysis Report June 994 Descriptive Summary of 989 90 Beginning Postsecondary Students Two Years After Entry Contractor Report Robert Fitzgerald Lutz
Title II of WIOA- Adult Education and Family Literacy Activities 463 Guidance
 Title II of WIOA- Adult Education and Family Literacy Activities 463 Guidance This narrative is intended to provide guidance to all parties interested in the Oklahoma AEFLA competition to be held in FY18
Governors and State Legislatures Plan to Reauthorize the Elementary and Secondary Education Act
 Governors and State Legislatures Plan to Reauthorize the Elementary and Secondary Education Act Summary In today s competitive global economy, our education system must prepare every student to be successful
Educational Attainment
 A Demographic and Socio-Economic Profile of Allen County, Indiana based on the 2010 Census and the American Community Survey Educational Attainment A Review of Census Data Related to the Educational Attainment
State Budget Update February 2016
 State Budget Update February 2016 2016-17 BUDGET TRAILER BILL SUMMARY The Budget Trailer Bill Language is the implementing statute needed to effectuate the proposals in the annual Budget Bill. The Governor
The Dropout Crisis is a National Issue
 2012 ANNUAL REPORT The Dropout Crisis is a National Issue Thirty percent of U.S. students drop out of high school, with dropout rates exceeding 50% in poor urban communities. Students who dropout face
Early Warning System Implementation Guide
 Linking Research and Resources for Better High Schools betterhighschools.org September 2010 Early Warning System Implementation Guide For use with the National High School Center s Early Warning System
Invest in CUNY Community Colleges
 Invest in Opportunity Invest in CUNY Community Colleges Pat Arnow Professional Staff Congress Invest in Opportunity Household Income of CUNY Community College Students
The Oregon Literacy Framework of September 2009 as it Applies to grades K-3
 The Oregon Literacy Framework of September 2009 as it Applies to grades K-3 The State Board adopted the Oregon K-12 Literacy Framework (December 2009) as guidance for the State, districts, and schools
Creating Collaborative Partnerships: The Success Stories and Challenges
 Creating Collaborative Partnerships: The Success Stories and Challenges Community College Center of Excellence Building a World Class Workforce Through Community College Partnerships Cari Mallory National
Executive Summary. Laurel County School District. Dr. Doug Bennett, Superintendent 718 N Main St London, KY
 Dr. Doug Bennett, Superintendent 718 N Main St London, KY 40741-1222 Document Generated On January 13, 2014 TABLE OF CONTENTS Introduction 1 Description of the School System 2 System's Purpose 4 Notable
Ensure Economic Success for Tomorrow: Graduate All Students Today. Kansas Commission on Graduation and Dropout Prevention and Recovery Final Report
 Ensure Economic Success for Tomorrow: Graduate All Students Today Kansas Commission on Graduation and Dropout Prevention and Recovery Final Report January 2011 Table of Contents Letter from Dr. Diane
UPPER SECONDARY CURRICULUM OPTIONS AND LABOR MARKET PERFORMANCE: EVIDENCE FROM A GRADUATES SURVEY IN GREECE
 UPPER SECONDARY CURRICULUM OPTIONS AND LABOR MARKET PERFORMANCE: EVIDENCE FROM A GRADUATES SURVEY IN GREECE Stamatis Paleocrassas, Panagiotis Rousseas, Vassilia Vretakou Pedagogical Institute, Athens Abstract
EDUCATIONAL ATTAINMENT
 EDUCATIONAL ATTAINMENT By 2030, at least 60 percent of Texans ages 25 to 34 will have a postsecondary credential or degree. Target: Increase the percent of Texans ages 25 to 34 with a postsecondary credential.
EXECUTIVE SUMMARY. Online courses for credit recovery in high schools: Effectiveness and promising practices. April 2017
 EXECUTIVE SUMMARY Online courses for credit recovery in high schools: Effectiveness and promising practices April 2017 Prepared for the Nellie Mae Education Foundation by the UMass Donahue Institute 1
A Guide to Adequate Yearly Progress Analyses in Nevada 2007 Nevada Department of Education
 A Guide to Adequate Yearly Progress Analyses in Nevada 2007 Nevada Department of Education Note: Additional information regarding AYP Results from 2003 through 2007 including a listing of each individual
Graduate Division Annual Report Key Findings
 Graduate Division 2010 2011 Annual Report Key Findings Trends in Admissions and Enrollment 1 Size, selectivity, yield UCLA s graduate programs are increasingly attractive and selective. Between Fall 2001
TRENDS IN. College Pricing
 2008 TRENDS IN College Pricing T R E N D S I N H I G H E R E D U C A T I O N S E R I E S T R E N D S I N H I G H E R E D U C A T I O N S E R I E S Highlights 2 Published Tuition and Fee and Room and Board
Iowa School District Profiles. Le Mars
 Iowa School District Profiles Overview This profile describes enrollment trends, student performance, income levels, population, and other characteristics of the public school district. The report utilizes
PROFESSIONAL TREATMENT OF TEACHERS AND STUDENT ACADEMIC ACHIEVEMENT. James B. Chapman. Dissertation submitted to the Faculty of the Virginia
 PROFESSIONAL TREATMENT OF TEACHERS AND STUDENT ACADEMIC ACHIEVEMENT by James B. Chapman Dissertation submitted to the Faculty of the Virginia Polytechnic Institute and State University in partial fulfillment
ILLINOIS DISTRICT REPORT CARD
 -6-525-2- HAZEL CREST SD 52-5 HAZEL CREST SD 52-5 HAZEL CREST, ILLINOIS and federal laws require public school districts to release report cards to the public each year. 2 7 ILLINOIS DISTRICT REPORT CARD
U VA THE CHANGING FACE OF UVA STUDENTS: SSESSMENT. About The Study
 About The Study U VA SSESSMENT In 6, the University of Virginia Office of Institutional Assessment and Studies undertook a study to describe how first-year students have changed over the past four decades.
Executive Summary. Gautier High School
 Pascagoula School District Mr. Boyd West, Principal 4307 Gautier-Vancleave Road Gautier, MS 39553-4800 Document Generated On January 16, 2013 TABLE OF CONTENTS Introduction 1 Description of the School
Financing Education In Minnesota
 Financing Education In Minnesota 2016-2017 Created with Tagul.com A Publication of the Minnesota House of Representatives Fiscal Analysis Department August 2016 Financing Education in Minnesota 2016-17
ILLINOIS DISTRICT REPORT CARD
 -6-525-2- Hazel Crest SD 52-5 Hazel Crest SD 52-5 Hazel Crest, ILLINOIS 2 8 ILLINOIS DISTRICT REPORT CARD and federal laws require public school districts to release report cards to the public each year.
46 Children s Defense Fund
 Nationally, about 1 in 15 teens ages 16 to 19 is a dropout. Fewer than two-thirds of 9 th graders in Florida, Georgia, Louisiana and Nevada graduate from high school within four years with a regular diploma.
Long Beach Unified School District
 Long Beach Unified School District Male Academy Closing The Achievement Gap Targeted Intervention College Board A Dream Deferred The Future of African American Education Conference April 25, 2012 Presented
Like much of the country, Detroit suffered significant job losses during the Great Recession.
 36 37 POPULATION TRENDS Economy ECONOMY Like much of the country, suffered significant job losses during the Great Recession. Since bottoming out in the first quarter of 2010, however, the city has seen
The Effect of Income on Educational Attainment: Evidence from State Earned Income Tax Credit Expansions
 The Effect of Income on Educational Attainment: Evidence from State Earned Income Tax Credit Expansions Katherine Michelmore Policy Analysis and Management Cornell University km459@cornell.edu September
Trends & Issues Report
 Trends & Issues Report prepared by David Piercy & Marilyn Clotz Key Enrollment & Demographic Trends Options Identified by the Eight Focus Groups General Themes 4J Eugene School District 4J Eugene, Oregon
FRANKLIN D. CHAMBERS,
 CURRICULUM VITAE FRANKLIN D. CHAMBERS, Ph.D. EDUCATIONAL BACKGROUND Doctor of Philosophy: Organizational Communications Howard University, Washington, D.C. Masters Degree: Educational Administration Howard
Miami-Dade County Public Schools
 ENGLISH LANGUAGE LEARNERS AND THEIR ACADEMIC PROGRESS: 2010-2011 Author: Aleksandr Shneyderman, Ed.D. January 2012 Research Services Office of Assessment, Research, and Data Analysis 1450 NE Second Avenue,
RAISING ACHIEVEMENT BY RAISING STANDARDS. Presenter: Erin Jones Assistant Superintendent for Student Achievement, OSPI
 RAISING ACHIEVEMENT BY RAISING STANDARDS Presenter: Erin Jones Assistant Superintendent for Student Achievement, OSPI Agenda Introductions Definitions History of the work Strategies Next steps Debrief
Is Open Access Community College a Bad Idea?
 Is Open Access Community College a Bad Idea? The authors of the book Community Colleges and the Access Effect argue that low expectations and outside pressure to produce more graduates could doom community
An Empirical Analysis of the Effects of Mexican American Studies Participation on Student Achievement within Tucson Unified School District
 An Empirical Analysis of the Effects of Mexican American Studies Participation on Student Achievement within Tucson Unified School District Report Submitted June 20, 2012, to Willis D. Hawley, Ph.D., Special
Institution-Set Standards: CTE Job Placement Resources. February 17, 2016 Danielle Pearson, Institutional Research
 Institution-Set Standards: CTE Job Placement Resources February 17, 2016 Danielle Pearson, Institutional Research Standard 1.B.3 states: The institution establishes institution-set standards for student
Availability of Grants Largely Offset Tuition Increases for Low-Income Students, U.S. Report Says
 Wednesday, October 2, 2002 http://chronicle.com/daily/2002/10/2002100206n.htm Availability of Grants Largely Offset Tuition Increases for Low-Income Students, U.S. Report Says As the average price of attending
International Literacy Day and National Adult Education and Family Literacy Week TOOLKIT 2015
 International Literacy Day and National Adult Education and Family Literacy Week TOOLKIT 2015 ABOUT THIS TOOLKIT The media provides an important channel for getting the message out about the adult literacy
EARNING. THE ACCT 2016 INVITATIONAL SYMPOSIUM: GETTING IN THE FAST LANE Ensuring Economic Security and Meeting the Workforce Needs of the Nation
 THE ACCT 2016 INVITATIONAL SYMPOSIUM: GETTING IN THE FAST LANE Ensuring Economic Security and Meeting the Workforce Needs of the Nation Discussion Papers 2016 Invitational Symposium LEARNING WHILE EARNING
Trends in College Pricing
 Trends in College Pricing 2009 T R E N D S I N H I G H E R E D U C A T I O N S E R I E S T R E N D S I N H I G H E R E D U C A T I O N S E R I E S Highlights Published Tuition and Fee and Room and Board
BASIC EDUCATION IN GHANA IN THE POST-REFORM PERIOD
 BASIC EDUCATION IN GHANA IN THE POST-REFORM PERIOD By Abena D. Oduro Centre for Policy Analysis Accra November, 2000 Please do not Quote, Comments Welcome. ABSTRACT This paper reviews the first stage of
House Finance Committee Unveils Substitute Budget Bill
 April 28, 2017 House Finance Committee Unveils Substitute Budget Bill On Tuesday, April 25, the House Finance Committee adopted a substitute version of House Bill 49, the budget bill for Fiscal Years (FY)
Effectiveness and Successful Program Elements of SOAR s Afterschool Programs
 Effectiveness and Successful Program Elements of SOAR s Afterschool Programs Janet L. Johnson, President Philip Van Vleck Jennifer S. Peach Rita G. Lewis Raleigh, NC rglewis@edstar.org Volume 1, Number
NDPC-SD Data Probes Worksheet
 NDPC-SD Data Probes Worksheet This worksheet from the National Dropout Prevention Center for Students with Disabilities (NDPC- SD) is an optional tool to help schools organize multiple years of student
HOUSE OF REPRESENTATIVES AS REVISED BY THE COMMITTEE ON EDUCATION APPROPRIATIONS ANALYSIS
 BILL #: HB 269 HOUSE OF REPRESENTATIVES AS REVISED BY THE COMMITTEE ON EDUCATION APPROPRIATIONS ANALYSIS RELATING TO: SPONSOR(S): School District Best Financial Management Practices Reviews Representatives
No Child Left Behind Bill Signing Address. delivered 8 January 2002, Hamilton, Ohio
 George W. Bush No Child Left Behind Bill Signing Address delivered 8 January 2002, Hamilton, Ohio AUTHENTICITY CERTIFIED: Text version below transcribed directly from audio Okay! I know you all are anxious
ANALYSIS: LABOUR MARKET SUCCESS OF VOCATIONAL AND HIGHER EDUCATION GRADUATES
 ANALYSIS: LABOUR MARKET SUCCESS OF VOCATIONAL AND HIGHER EDUCATION GRADUATES Authors: Ingrid Jaggo, Mart Reinhold & Aune Valk, Analysis Department of the Ministry of Education and Research I KEY CONCLUSIONS
Practices Worthy of Attention Step Up to High School Chicago Public Schools Chicago, Illinois
 Step Up to High School Chicago Public Schools Chicago, Illinois Summary of the Practice. Step Up to High School is a four-week transitional summer program for incoming ninth-graders in Chicago Public Schools.
WORKFORCE DEVELOPMENT: WHAT WORKS? WHO BENEFITS? Harry J. Holzer Georgetown University The Urban Institute February 2010
 WORKFORCE DEVELOPMENT: WHAT WORKS? WHO BENEFITS? Harry J. Holzer Georgetown University The Urban Institute February 2010 1 Outline Labor Market: Demand v. Supply of Skills; Middle- v. High-Skill Jobs Effective
NCEO Technical Report 27
 Home About Publications Special Topics Presentations State Policies Accommodations Bibliography Teleconferences Tools Related Sites Interpreting Trends in the Performance of Special Education Students
The Talent Development High School Model Context, Components, and Initial Impacts on Ninth-Grade Students Engagement and Performance
 The Talent Development High School Model Context, Components, and Initial Impacts on Ninth-Grade Students Engagement and Performance James J. Kemple, Corinne M. Herlihy Executive Summary June 2004 In many
Integrated Pell Grant Expansion and Bachelor s Completion Pay for Performance: A Cost-Effectiveness Analysis. Harrison G. Holcomb William T.
 1 Integrated Pell Grant Expansion and Bachelor s Completion Pay for Performance: A Cost-Effectiveness Analysis Harrison G. Holcomb William T. Drier School of Public Affairs University of Colorado Denver
Connecting to the Big Picture: An Orientation to GEAR UP
 Connecting to the Big Picture: An Orientation to GEAR UP About the National Council for Community and Education Partnerships (NCCEP) Our mission is to build the capacity of communities to ensure that underserved
Lesson M4. page 1 of 2
 Lesson M4 page 1 of 2 Miniature Gulf Coast Project Math TEKS Objectives 111.22 6b.1 (A) apply mathematics to problems arising in everyday life, society, and the workplace; 6b.1 (C) select tools, including
What Is The National Survey Of Student Engagement (NSSE)?
?") National Survey of Student Engagement (NSSE) 2000 Results for Montclair State University What Is The National Survey Of Student Engagement (NSSE)? US News and World Reports Best College Survey is due next
National Survey of Student Engagement (NSSE) 2000 Results for Montclair State University What Is The National Survey Of Student Engagement (NSSE)? US News and World Reports Best College Survey is due next
RCPCH MMC Cohort Study (Part 4) March 2016
 March 2016") RCPCH MMC Cohort Study (Part 4) March 2016 Acknowledgements Dr Simon Clark, Officer for Workforce Planning, RCPCH Dr Carol Ewing, Vice President Health Services, RCPCH Dr Daniel Lumsden, Former Chair,
RCPCH MMC Cohort Study (Part 4) March 2016 Acknowledgements Dr Simon Clark, Officer for Workforce Planning, RCPCH Dr Carol Ewing, Vice President Health Services, RCPCH Dr Daniel Lumsden, Former Chair,
UK Institutional Research Brief: Results of the 2012 National Survey of Student Engagement: A Comparison with Carnegie Peer Institutions
 UK Institutional Research Brief: Results of the 2012 National Survey of Student Engagement: A Comparison with Carnegie Peer Institutions November 2012 The National Survey of Student Engagement (NSSE) has
Charter School Performance Accountability
 sept 2009 Charter School Performance Accountability The National Association of Charter School Authorizers (NACSA) is the trusted resource and innovative leader working with educators and public officials
Wisconsin 4 th Grade Reading Results on the 2015 National Assessment of Educational Progress (NAEP)
") Wisconsin 4 th Grade Reading Results on the 2015 National Assessment of Educational Progress (NAEP) Main takeaways from the 2015 NAEP 4 th grade reading exam: Wisconsin scores have been statistically flat
Wisconsin 4 th Grade Reading Results on the 2015 National Assessment of Educational Progress (NAEP) Main takeaways from the 2015 NAEP 4 th grade reading exam: Wisconsin scores have been statistically flat
1.0 INTRODUCTION. The purpose of the Florida school district performance review is to identify ways that a designated school district can:
 1.0 INTRODUCTION 1.1 Overview Section 11.515, Florida Statutes, was created by the 1996 Florida Legislature for the purpose of conducting performance reviews of school districts in Florida. The statute
The Impact of Honors Programs on Undergraduate Academic Performance, Retention, and Graduation
 University of Nebraska - Lincoln DigitalCommons@University of Nebraska - Lincoln Journal of the National Collegiate Honors Council - -Online Archive National Collegiate Honors Council Fall 2004 The Impact
A Systems Approach to Principal and Teacher Effectiveness From Pivot Learning Partners
 A Systems Approach to Principal and Teacher Effectiveness From Pivot Learning Partners About Our Approach At Pivot Learning Partners (PLP), we help school districts build the systems, structures, and processes
The Impacts of Regular Upward Bound on Postsecondary Outcomes 7-9 Years After Scheduled High School Graduation
 Contract No.: EA97030001 MPR Reference No.: 6130-800 The Impacts of Regular Upward Bound on Postsecondary Outcomes 7-9 Years After Scheduled High School Graduation Final Report January 2009 Neil S. Seftor
The Value of English Proficiency to the. By Amber Schwartz and Don Soifer December 2012
 The Value of English Proficiency to the United States Economy By Amber Schwartz and Don Soifer December 2012 Also by the Lexington Institute: English Language Learners and NAEP: Progress Through Inclusion,
Proficiency Illusion
 KINGSBURY RESEARCH CENTER Proficiency Illusion Deborah Adkins, MS 1 Partnering to Help All Kids Learn NWEA.org 503.624.1951 121 NW Everett St., Portland, OR 97209 Executive Summary At the heart of the
2/3 9.8% 38% $0.78. The Status of Women in Missouri: 2016 ARE WOMEN 51% 22% A Comprehensive Report of Leading Indicators and Findings.
 A Missouri WOMAN WORKING FULL-TIME EARNS ONLY $0.78 FOR EACH DOLLAR A MAN EARNS 2/3 OF Missouri SENIORS LIVING IN POVERTY ARE WOMEN 9.8% The Status of Women in Missouri: 2016 A Comprehensive Report of
Pierce County Schools. Pierce Truancy Reduction Protocol. Dr. Joy B. Williams Superintendent
 Pierce County Schools Pierce Truancy Reduction Protocol 2005 2006 Dr. Joy B. Williams Superintendent Mark Dixon Melvin Johnson Pat Park Ken Jorishie Russell Bell 1 Pierce County Truancy Reduction Protocol
CONNECTICUT GUIDELINES FOR EDUCATOR EVALUATION. Connecticut State Department of Education
 CONNECTICUT GUIDELINES FOR EDUCATOR EVALUATION Connecticut State Department of Education October 2017 Preface Connecticut s educators are committed to ensuring that students develop the skills and acquire
Los Angeles City College Student Equity Plan. Signature Page
 Los Angeles City College Student Equity Plan Signature Page Los Angeles Community College Los Angeles City College President, Board of Trustees Date District Chancellor: College President: Academic Senate
EDUCATIONAL ATTAINMENT
 EDUCATIONAL ATTAINMENT By 2030, at least 60 percent of Texans ages 25 to 34 will have a postsecondary credential or degree. Target: Increase the percent of Texans ages 25 to 34 with a postsecondary credential.
National Survey of Student Engagement (NSSE) Temple University 2016 Results
 Temple University 2016 Results") Introduction The National Survey of Student Engagement (NSSE) is administered by hundreds of colleges and universities every year (560 in 2016), and is designed to measure the amount of time and effort
Introduction The National Survey of Student Engagement (NSSE) is administered by hundreds of colleges and universities every year (560 in 2016), and is designed to measure the amount of time and effort
Children and Adults with Attention-Deficit/Hyperactivity Disorder Public Policy Agenda for Children
 Children and Adults with Attention-Deficit/Hyperactivity Disorder Public Policy Agenda for Children 2008 2009 Accepted by the Board of Directors October 31, 2008 Introduction CHADD (Children and Adults
Principal vacancies and appointments
 Principal vacancies and appointments 2009 10 Sally Robertson New Zealand Council for Educational Research NEW ZEALAND COUNCIL FOR EDUCATIONAL RESEARCH TE RŪNANGA O AOTEAROA MŌ TE RANGAHAU I TE MĀTAURANGA
California s Bold Reimagining of Adult Education. Meeting of the Minds September 6, 2017
 California s Bold Reimagining of Adult Education Meeting of the Minds September 6, 2017 Adult Education in California Historically CDE State Run Program $750M (est) Ten Program Areas K12 Districts / County
ADULT BASIC EDUCATION CURRICULUM GUIDE TABLE OF CONTENTS
 ADULT BASIC EDUCATION CURRICULUM GUIDE TABLE OF CONTENTS 2006 revisions noted as revised SECTION 1: GOALS AND PHILOSOPHY Pages 2 14 SECTION 2: ENROLLMENT All revised Pages 15 55 15 19 BASED Course Descriptions
EFFECTS OF MATHEMATICS ACCELERATION ON ACHIEVEMENT, PERCEPTION, AND BEHAVIOR IN LOW- PERFORMING SECONDARY STUDENTS
 EFFECTS OF MATHEMATICS ACCELERATION ON ACHIEVEMENT, PERCEPTION, AND BEHAVIOR IN LOW- PERFORMING SECONDARY STUDENTS Jennifer Head, Ed.S Math and Least Restrictive Environment Instructional Coach Department
Student Support Services Evaluation Readiness Report. By Mandalyn R. Swanson, Ph.D., Program Evaluation Specialist. and Evaluation
 Student Support Services Evaluation Readiness Report By Mandalyn R. Swanson, Ph.D., Program Evaluation Specialist and Bethany L. McCaffrey, Ph.D., Interim Director of Research and Evaluation Evaluation
November 6, Re: Higher Education Provisions in H.R. 1, the Tax Cuts and Jobs Act. Dear Chairman Brady and Ranking Member Neal:
 The Honorable Kevin Brady The Honorable Richard Neal Chairman Ranking Member Ways and Means Committee Ways and Means Committee United States House of Representatives United States House of Representatives
San Diego State University Division of Undergraduate Studies Sustainability Center Sustainability Center Assistant Position Description
 San Diego State University Division of Undergraduate Studies Sustainability Center Sustainability Center Assistant Position Description I. POSITION INFORMATION JOB TITLE DEPARTMENT Sustainability Center
Educational Quality Assurance Standards. Residential Juvenile Justice Commitment Programs DRAFT
 Educational Quality Assurance Standards Residential Juvenile Justice Commitment Programs 2009 2010 Bureau of Exceptional Education and Student Services Division of K-12 Public Schools Florida Department
Welcome. Paulo Goes Dean, Eller College of Management Welcome Our region
 Welcome. Paulo Goes Dean, Welcome. Our region Outlook for Tucson Patricia Feeney Executive Director, Southern Arizona Market Chase George W. Hammond, Ph.D. Director, University of Arizona 1 Visit the award-winning
THE ECONOMIC IMPACT OF THE UNIVERSITY OF EXETER
 THE ECONOMIC IMPACT OF THE UNIVERSITY OF EXETER Report prepared by Viewforth Consulting Ltd www.viewforthconsulting.co.uk Table of Contents Executive Summary... 2 Background to the Study... 6 Data Sources
The mission of the Grants Office is to secure external funding for college priorities via local, state, and federal funding sources.
 Southwest Tennessee Community College Grants Office Project Summary Grants Office The mission of the Grants Office is to secure external funding for college priorities via local, state, and federal funding
Table of Contents Welcome to the Federal Work Study (FWS)/Community Service/America Reads program.
/Community Service/America Reads program.") Table of Contents Welcome........................................ 1 Basic Requirements for the Federal Work Study (FWS)/ Community Service/America Reads program............ 2 Responsibilities of All Participants
Table of Contents Welcome........................................ 1 Basic Requirements for the Federal Work Study (FWS)/ Community Service/America Reads program............ 2 Responsibilities of All Participants
Transportation Equity Analysis
 2015-16 Transportation Equity Analysis Each year the Seattle Public Schools updates the Transportation Service Standards and bus walk zone boundaries for use in the upcoming school year. For the 2014-15
About the College Board. College Board Advocacy & Policy Center
 15% 10 +5 0 5 Tuition and Fees 10 Appropriations per FTE ( Excluding Federal Stimulus Funds) 15% 1980-81 1981-82 1982-83 1983-84 1984-85 1985-86 1986-87 1987-88 1988-89 1989-90 1990-91 1991-92 1992-93
Rural Education in Oregon
 Rural Education in Oregon Overcoming the Challenges of Income and Distance ECONorthwest )'3231-'7 *-2%2') 40%22-2+ Cover photos courtesy of users Lars Plougmann, San José Library, Jared and Corin, U.S.Department
Presentation of the English Montreal School Board To Mme Michelle Courchesne, Ministre de l Éducation, du Loisir et du Sport on
 Presentation of the English Montreal School Board To Mme Michelle Courchesne, Ministre de l Éducation, du Loisir et du Sport on «DÉMOCRATIE ET GOUVERNANCE DES COMMISSIONS SCOLAIRES Éléments de réflexion»
National Survey of Student Engagement
 National Survey of Student Engagement Report to the Champlain Community Authors: Michelle Miller and Ellen Zeman, Provost s Office 12/1/2007 This report supplements the formal reports provided to Champlain