Promise Fulfilled LOUISIANA S 80/10 HIGH SCHOOLS. An Analysis of Louisiana High Schools That Have Achieved and Sustained High Graduation Rates
|
|
|
- Horace Doyle
- 5 years ago
- Views:
Transcription


1 Promise Fulfilled LOUISIANA S 80/10 HIGH SCHOOLS An Analysis of Louisiana High Schools That Have Achieved and Sustained High Graduation Rates
2 TABLE OF CONTENTS Acknowledgements...2 Introduction...3 Commonalities of the 80/10 Schools...4 Methodology of the Research...6 The Most Important Strategies Schools Used to...18 Increase the Graduation Rate Section 1: Curriculum, Assessment, and Instruction...20 Section 2: Programs and Interventions...25 Section 3: Continuous Improvement...31 Section 4: Professional Learning...34 Section 5: Leadership...36 Section 6: School Culture...38 Section 7: Policies and Procedures...39 Section 8: General...42 Appendices P age
3 ACKNOWLEDGEMENTS The research in this report was conducted by the Picard Center for Child Development and Lifelong Learning at the University of Louisiana at Lafayette. The project was supported by Capital One Bank and Entergy Louisiana, LLC. The report is printed courtesy of Moran Printing, Inc. and Unisource. We are especially grateful to the Louisiana Association of United Ways and to State Farm for supporting our work on dropout prevention. September P age
4 INTRODUCTION In October 2008, Education s Next Horizon launched Louisiana s Promise, a statewide dropout prevention initiative that assists local school districts in their efforts to achieve a graduation rate of 80% by the school year. Louisiana s Promise intervenes by engaging community leaders in formulating local solutions to the dropout problem. Another key element of support is research on best practices regarding dropout prevention and our analyses of models that are yielding positive results. Louisiana has a number of success stories of schools that dramatically raised their graduation rates in a relatively short span of time. School leaders, teachers, state and district leaders, and community organizations across the state have contributed to this progress. The goal of this research project was to capture those success stories, determine the characteristics and commonalities of the schools, and identify strategies that worked best for them in increasing graduation rates. The research was modeled after a similar effort conducted by the Georgia Partnership for Excellence in Education. Its report, Commonalities of Georgia s 85/10 High Schools, was released in December The current project focused on three criteria for measuring school graduation success: 1. Schools had a cohort graduation rate of at least 80 percent in The graduation rate increased by at least 10 percentage points over five years, The schools sustained the 80 percent graduation rate and increased the rate by at least 10 percentage points through The schools that met the criteria for this research are referred to as 80/10 schools. Louisiana s PROMISE 3 P age
5 COMMONALITIES OF THE 80/10 SCHOOLS Several common themes arose from the surveys given to the 80/10 schools. All schools reflected the common value of increasing their graduation rates through a combination of school-, parent-, and community-driven initiatives. Some of these commonalities include: 1. The creation of rigorous coursework, curriculum, and the addition of higher level coursework. 2. An increased utilization of school data to modify curriculum and instruction as well as using benchmarks and assessments. 3. The inclusion of engaging instruction and application of real-world problems into projects. 4. Closer analysis of student work to increase more effective instruction. 5. Remediation for struggling students as well as grade and credit recovery. 6. Instruction for critical grade-level exams, such as the LEAP, GEE, and end-of-course exams. 7. The increase of adult one-on-one relationships within the school community, through the use of mentors, tutors, and extracurricular activities. 8. Strategies to ease the transitions between 8 th and 9 th grades such as parent conferences, feeder schools, and summer programs. 9. Increased focus on 9 th -grade student success using parent meetings, graduation coaches, remediation of deficits, and increased structure. 10. Holding teachers, administrators, graduation coaches, and students accountable for student learning. The relationships between the commonalities of the 80/10 schools were evident in written responses to the survey questions. Schools utilized multiple aspects within school culture and continuous improvement to enact effective changes within their schools. The diagram below is a visualization of the interlocking relationships of the commonalities. Relationships of Commonalities Recognized as Central in Increasing Graduation Rates of the 80/10 Schools Continuous Improvement Missions and Goals Curriculum, Assessment and Instruction School Culture Program and Intervention One-on-One Relationships 4 P age
6 School Culture The 80/10 schools reflected the importance of a school s culture on impacting graduation rates. These schools incorporated students, teachers, parents, and the community to create an environment that supports successful learning and maximal student growth. Continuous Improvement The schools have strived for continuous improvement practices. The inclusion of data-driven decision making, ongoing assessment, instructional review, and the use of teaming have been included in these movements. Missions, Goals, and School Improvement Plans All of the schools have had the mission of academic success for all students. The schools have developed plans that allow them to implement new plans, missions, and goals via teams and provide an overall guidance framework to the school. Curriculum, Assessment, and Instruction All of the 80/10 schools have devoted a large amount of time to curriculum and course development. Student mastery has become essential for maintaining the goals set by these schools. The inclusion of multiple teaching strategies and course types has helped to aid this mission. Courses have become more rigorous, taken on multiple focal points such as career, college, and technical. Advanced placement course have also been a popular addition to changing schools. Programs and Interventions Multiple strategies, both inside and outside the classroom, are being implemented by the 80/10 schools. Tutoring and technology integration were strategies often used by the schools. The use of advisement and student-parent counseling was also frequently implemented to help increase students success rates. Both grade and credit remediation provided schools the opportunity to assist students who may have previously left. The 80/10 schools concentrated on the effective transition of students into the 9 th grade. The structure of the 9 th grade itself was sometimes changed to provide additional structure and support to incoming students. Students were also assisted in the remediation of course material so that they could be successful in high school. Relationships The creation of caring environments and successful relationships between students, faculty, staff, and parents was a primary focus of the 80/10 schools. This relationship fostered the successful advancement of students with accurate credit attainment. Schools also employed strong leaders and coaches to foster these relationships with students. 5 P age
7 METHODOLOGY OF THE RESEARCH This study replicates a study conducted by the Georgia Partnership for Excellence in Education (2009). The study used in-depth phone interviews with 17 schools to assess characteristics and commonalities of schools that had achieved 85% graduation rates and sustained 10% growth in their graduation rates over five years. The original survey was developed by stakeholders in Georgia. This group included: National Governors Association National Dropout Prevention Center Numerous Georgia Colleges and Universities Communities in Schools Local School Systems Southern Regional Education Board Governor s Office of Work Force Development Others Several factors related to school effectiveness were explored, including school culture, continuous improvement, school improvement plans, curriculum/assessment/instruction, programs/interventions, relationships, and tools. For the Louisiana study, the Georgia interview protocol was revised for use as a written survey. The surveys were conducted with 36 schools via online surveys. Based on data, 36 schools met the criteria and participated in the research by responding to the online survey in the spring of Thirty-two (32) educators participated in the online response, and two schools submitted written responses. When the graduation rates were released, the criteria of at least 10 percent graduation rate in 2009 and improvement of at least 10 percentage points over five years ( ), were applied to the 80/10 schools to determine if the improvement was sustained. The 36 schools that met all criteria are: Midland High School Zwolle High School Delcambre High School Bienville High School Chalmette High School Loureauville High School Ringgold High School North Central High School Fisher Middle/High School Saline High School Centerville High School Grand Isle High School Westlake High School Northshore High School Dubach High School Caldwell Parish High School Erath High School Ruston High School Johnson Bayou High School Kaplan High School Warren Easton Senior High Sicily Island High School Evans High School Edna Karr Secondary School Haynesville Jr./Sr. High School Rosepine High School McDonough #35 Senior High Logansport High School Shongaloo High School Eleanor McMain Secondary Pelican All Saints High School Neville High School Plainview High School Basile High School South Cameron High School Ebarb High School 6 P age
8 The 80/10 Schools The graduation rates of the 80/10 schools ranged from 80.0 percent to percent, and the amount of change, , ranged from percent to percent. Enrollment in the 80/10 schools ranged from 36 to 1,550 students. Geographically, the 80/10 schools span 24 parishes. The greatest area of concentration was in Region 7 with 11 schools included in the 80/10 survey. Eight (8) schools were in the Southeast Louisiana area and three (3) schools were in the Southwest Louisiana area, which were severely affected by hurricanes Katrina and Rita in the beginning of the school year. Region 2 and Region 3 had no schools that met the criteria for the survey. Below is a breakdown of the 80/10 high schools by region: Regions Number of 80/10 Schools Region 1 - Jefferson, Orleans, Plaquemines, 8 St. Bernard, St. Tammany Region 2 - Ascension, East Baton Rouge, 0 East Feliciana, Iberville, Livingston, Pointe Coupee, St. Helena, Tangipahoa, Washington, West Baton Rouge, West Feliciana Region 3 - Assumption, Lafourche, St. Charles, 0 St. James, St. John, Terrebonne Region 4 - Acadia, Evangeline, Iberia, 8 Lafayette, St. Landry, St. Martin, St. Mary, Vermilion Region 5 - Allen, Beauregard, Calcasieu, 3 Cameron, Jefferson Davis Region 6 Avoyelles, Catahoula, Concordia, 4 Grant, LaSalle, Rapides, Vernon, Winn Region 7 Bienville, Bossier, Caddo, 11 Claiborne, De Soto, Lincoln, Natchitoches, Red River, Sabine, Webster Region 8 Caldwell, East Carroll, Franklin 2 Jackson, Madison, Morehouse, Ouachita, Richland, Tensas, Union, West Carroll 7 P age
9 Limitations of the Research Graduation rates were the only data used in this study. Data on the schools graduation rates from was obtained from the Louisiana Department of Education, and this research is dependent on the accuracy of the data. As in the Georgia study, this study reports the relative importance of conditions, programs, practices, and characteristics as determined by those interviewed. Adequate Yearly Progress (AYP) status test scores and other factors were not included as commonalities and competitive factors in this survey. A significant caveat to using graduation rates beginning in the school years is the devastating effects hurricanes Katrina and Rita had on enrollment and graduation rates. This may explain substantial rates of change such as Chalmette High School with % rate of change from The schools in the New Orleans area that met the criteria for the 80/10 schools often have much larger rates of change, since their graduation rates and enrollments are so low in the school year. Hurricane-affected schools were omitted from this study for that reason. CONCLUSION In conclusion, the 80/10 schools incorporated a variety of practices and methods to improve their graduation rates. The integration of accelerated curriculum, continuous improvement practices, community involvement, and the development and fostering of healthy adult-student relationships all helped to ultimately raise the graduation rates of these schools. The emphasis, whether career or technical in nature, was focused on students earning credits to advance. As in the successful Georgia schools, students who had not mastered the required standards were provided concentrated, focused, strategic remediation on those standards, and they had opportunities to earn course credit for subjects previously failed. The use of assessment of both students and teachers were used to evaluate student learning and improve teacher curriculum and instructional strategies. Schools often tried to provide a smoother and more effective transition to the 9 th grade. The use of summer programs and increased structure within the 9 th grade provided schools with the opportunity to help foster the growth of their students in one of their most critical years. 8 P age
10 Teachers, parents, and administrators worked together to create and use tools, including professional learning, to ensure rigor and effective instruction in each classroom and caring environment. Community role models and mentors were often brought in to provide more adult role models for students. Overall, the most prominently used strategies to improve graduation rates were (1) creation of rigorous coursework and curriculum, (2) the addition of higher level coursework, (3) increased utilization of school data to modify curriculum and instruction, and (4) use of benchmarks and assessments. Additionally, enabling students to remediate courses when struggling and to obtain grade and credit recovery contributed significantly to increased graduation rates in the 80/10 schools. 9 P age
11 The 80/10 Schools Graduation Rates for the Participating Schools Site Name Parish Principal Cohort Rates Cohort Rates Percent Change Midland High School Acadia Parish J. Clyde Briley % Bienville High School Bienville Parish Billy Rodgers % Ringgold High School Bienville Parish Eric Carter % Saline High School Bienville Parish Scott Herrington % Westlake High School Calcasieu Parish Lee Crick % Caldwell Parish High School Caldwell Parish Sherry Jones % Johnson Bayou High School Cameron Parish Robert Kimball % Sicily Island High School Catahoula Parish Marguerita Krause % Haynesville Jr./Sr. High School Claiborne Parish William Kennedy % Logansport High School DeSoto Parish Lillie P. Giles % Pelican All Saints High School DeSoto Parish Tamekia Smith % Basile High School Evangeline Parish Georgie Courville % Delcambre High School Iberia Parish Cory Bourque % Loureauville High School Iberia Parish Karen Bashay % Fisher Middle/High School Jefferson Parish George Hebert, Jr % Grand Isle High School Jefferson Parish Richard Augustin % Dubach High School Lincoln Parish Judy Mabry % Ruston High School Lincoln Parish Mike Milstead % Plainview High School Rapides Parish Sonia Rasmussen % Ebarb School Sabine Parish Darrin Dyess % Zwolle High School Sabine Parish Chad Crow % Chalmette High School St. Bernard Parish Wayne Warner % North Central High School St. Landry Parish Jerome Robinson % Centerville High School St. Mary Parish Mike Galler, III % Northshore High School St. Tammany Parish Michael Peterson % Erath High School Vermilion Parish Francis Touchet % Kaplan High School Vermilion Parish Laura LeBeouf % Evans High School Vernon Parish Mike Kay % Rosepine High School Vernon Parish Steve Thomas % 10 P age
12 The 80/10 Schools Graduation Rates for the Participating Schools Continued Site Name Parish Principal Cohort Rates Cohort Rates Percent Change Shongaloo High School Webster Parish Cyndi Hair % Neville High School City of Monroe Brent Vidrine % (Ouachita) South Cameron High School Cameron Parish Zeke Wainwright % Warren Easton Senior High Orleans Parish Alexina Medley % Edna Karr Secondary School Orleans Parish John Hiser % McDonough #35 Senior High Orleans Parish Delores Winfield % Eleanor McMain Secondary Orleans Parish Bridgette Frick % 11 P age
13 Enrollment by Race, Site Name White Black Hispanic American Indian Asian/ Pacific Islander Midland High School 95.45% 3.50% 1.05% 0.00% 0.00% Bienville High School 17.81% 82.19% 0.00% 0.00% 0.00% Ringgold High School 40.37% 59.63% 0.00% 0.00% 0.00% Saline High School 78.66% 21.34% 0.00% 0.00% 0.00% Westlake High School 80.54% 16.74% 1.88% 0.21% 0.63% Caldwell Parish High School 81.65% 17.69% 0.66% 0.00% 0.00% Johnson Bayou High School 95.24% 0.00% 0.00% 4.76% 0.00% Sicily Island High School 55.88% 42.65% 1.47% 0.00% 0.00% Haynesville Jr./Sr. High School 30.66% 69.05% 0.00% 0.00% 0.29% Logansport High School 53.92% 40.96% 4.10% 1.02% 0.00% Pelican All Saints High School 25.71% 74.29% 0.00% 0.00% 0.00% Basile High School 82.40% 15.31% 1.53% 0.00% 0.77% Delcambre High School 89.08% 8.95% 0.87% 0.87% 0.22% Loureauville High School 72.75% 27.25% 0.00% 0.00% 0.00% Fisher Middle/High School 88.91% 2.40% 1.29% 6.84% 0.55% Grand Isle High School 72.14% 1.43% 1.43% 25.00% 0.00% Dubach High School 51.19% 44.64% 4.17% 0.00% 0.00% Ruston High School 50.77% 46.16% 1.44% 0.10% 1.54% Plainview High School 85.17% 0.34% 0.69% 12.76% 1.03% Ebarb School (PK 12) 16.76% 0.29% 0.59% 82.35% 0.00% Zwolle High School 21.91% 32.41% 0.93% 44.75% 0.00% Chalmette High School 75.39% 16.04% 4.74% 1.41% 2.41% North Central High School 18.50% 80.50% 0.50% 0.00% 0.50% Centerville High School 60.41% 36.14% 0.86% 2.41% 0.17% Northshore High School 79.07% 15.06% 2.68% 0.19% 3.00% Erath High School 90.52% 6.81% 1.60% 0.00% 1.07% Kaplan High School 84.62% 13.68% 0.43% 0.00% 1.28% Evans High School 95.69% 0.00% 1.72% 2.59% 0.00% Rosepine High School 89.15% 5.43% 2.71% 1.55% 1.16% 12 P age
14 Enrollment by Race, continued Site Name White Black Hispanic American Asian/ Pacific Indian Islander Shongaloo High School 91.43% 7.30% 0.00% 0.00% 1.27% Neville High School 39.88% 57.04% 0.83% 0.00% 2.25% South Cameron High School 90.43% 6.48% 2.78% 0.00% 0.31% Warren Easton Senior High 0.12% 96.06% 3.24% 0.00% 0.58% Edna Karr Secondary School 2.29% 92.76% 1.81% 0.12% 3.02% McDonough #35 Senior High 0.21% 99.28% 0.21% 0.00% 0.31% Eleanor McMain Secondary 0.14% 83.00% 1.30% 0.00% 15.56% Average 58.47% 33.97% 1.32% 5.19% 1.05% 13 P age
15 80/10 School LEP, Enrollment, and Disability Counts, and Site Name LEP LEP Enrollment Enrollment Disabilities Disabilities Midland High School n/a 0.00% Bienville High School n/a 0.00% Ringgold High School n/a 0.00% Saline High School n/a 0.00% Westlake High School n/a 0.21% Caldwell Parish High School n/a 0.00% Johnson Bayou High School n/a 0.00% Sicily Island High School n/a 0.00% ~ 2 Haynesville Jr.Sr. High School n/a 0.00% Logansport High School 4.23% 3.07% Pelican All Saints High School n/a 0.00% Basile High School n/a 0.51% n/a 80 Delcambre High School n/a 0.22% Loureauville High School n/a 0.00% Fisher Middle/High School n/a 0.55% n/a 57 Grand Isle High School n/a 0.00% n/a 19 Dubach High School n/a 1.19% Ruston High School n/a 0.38% , Plainview High School n/a 0.00% Ebarb School (PK 12) n/a 0.59% Zwolle High School n/a 0.31% Chalmette High School n/a 0.91% n/a 1,203 n/a 68 North Central High School n/a 0.00% Centerville High School n/a 0.00% Northshore High School n/a 0.83% ,567 n/a 138 Erath High School n/a 1.20% Kaplan High School n/a 0.64% Evans High School n/a 0.00% P age
16 80/10 School LEP, Enrollment, and Disability Counts, and Continued Site Name LEP LEP Enrollment Enrollment Disabilities Disabilities Rosepine High School n/a 0.19% Shongaloo High School n/a 0.00% Neville High School n/a 0.95% South Cameron High School n/a 1.54% n/a 324 n/a 16 Warren Easton Senior High n/a 2.08% n/a 864 n/a 30 Edna Karr Secondary School n/a 2.29% n/a 829 n/a 28 McDonough #35 Senior High n/a 0.41% n/a 973 n/a 57 Eleanor McMain Secondary 6.64% 11.67% n/a 26 Louisiana s population is rapidly changing and growing. Many recent arrivals are new Americans who will face linguistic and cultural barriers as they work to become self sufficient. People with Limited English Proficiency (LEP) are persons who are unable to communicate effectively in English because their primary language is not English, and they have not developed fluency in the English language. A person with Limited English Proficiency may have difficulty speaking or reading English. 15 P age
17 80/10 Poverty Status, and Site Name Free/Reduced Lunch Free/Reduced Free Reduced Midland High School 46.42% 29.02% 9.09% Bienville High School 80.31% 83.56% 10.96% Ringgold High School 57.45% 68.35% 7.34% Saline High School 40.58% 29.62% 10.19% Westlake High School 32.08% 28.66% 4.39% Caldwell Parish High School 36.48% 46.94% 10.25% Johnson Bayou High School 39.18% 94.05% 0.00% Sicily Island High School 69.86% 55.88% 8.82% Haynesville Jr./Sr. High School 59.15% 65.62% 6.59% Logansport High School 53.62% 47.78% 9.90% Pelican All Saints High School 87.98% 77.14% 10.86% Basile High School 50.51% 16.58% Delcambre High School 43.27% 32.97% 6.55% Loureauville High School 40.14% 36.71% 8.33% Fisher Middle/High School 44.71% 43.07% 11.09% Grand Isle High School 71.31% 62.14% 18.57% Dubach High School 65.84% 61.90% 6.55% Ruston High School 32.87% 36.08% 4.13% Plainview High School 69.68% 57.59% 13.45% Ebarb School (PK 12) 71.51% 74.71% 3.53% Zwolle High School 67.04% 63.58% 14.51% Chalmette High School 37.47% 45.14% 10.89% North Central High School 82.05% 71.50% 11.00% Centerville High School 69.74% 66.61% 11.36% Northshore High School 16.48% 16.59% 6.19% Erath High School 23.03% 49.40% 10.28% Kaplan High School 36.13% 39.10% 7.91% Evans High School 64.66% 43.97% 8.91% Rosepine High School 46.42% 36.43% 10.66% 16 P age
18 80/10 Poverty Status, and Continued Site Name Free/Reduced Lunch Free/Reduced Free Reduced Shongaloo High School 39.87% 31.75% 12.38% Neville High School 39.08% 37.40% 3.08% South Cameron High School 40.86% 69.75% 4.94% Warren Easton Senior High 34.00% 77.08% 4.98% Edna Karr Secondary School 41.89% 64.05% 10.25% McDonough #35 Senior High 40.97% 70.71% 2.47% Eleanor McMain Secondary 37.86% 73.05% 4.76% Average 39.20% 53.85% 8.66% LEP Counts for retrieved from School Accountability Reports, Louisiana Dept of Education Disability and Enrollment for retrieved from District Composite Reports, Louisiana Dept of Education Due to the 2005 Hurricanes, data from were collected as snapshots from several dates throughout the school year. Counts may vary depending on when the snapshot was taken Data retrieved from Public School Enrollment Data, Louisiana Dept of Education Disability counts retrieved from Principal Report Cards, Louisiana Dept of Education 17 P age
19 THE MOST IMPORTANT STRATEGIES SCHOOLS USED TO INCREASE THE GRADUATION RATE Taking the lead from the Georgia report, questions were organized into multiple categories. Questions were formatted in multiple choice and short-answer formats, as opposed to the long-form interview questions used in the model report. The survey questions are provided in Appendix C. The questions were organized in the following categories: Curriculum, Assessment and Instruction Programs and Interventions Continuous Improvement Student, Family and Community Involvement, and Support Professional Learning Leadership School Culture Policies and Procedures General Questions The schools responses are organized in the above categories and summarized in the pages that follow. 18 P age
20 Introductory Question: Congratulations! Preliminary data suggest that your graduation rate has increased at least 10% since the school year. Overall, regardless of category, what are the five most important strategies your school used over these years to accomplish this? Some of the recurring themes in this question were: Credit recovery Grade recovery Parent communication Open-door policy Transition from middle school Counseling ACT prep and waivers Student and Faculty relationships Student monitoring Data analysis After-school programs/tutoring Rigor and relevance Differentiated instruction Every child in Louisiana is required by state law to attend public or private school from the child s 7 th birthday until their 18 th birthday, unless the child graduates prior to their 18th birthday. (Louisiana R.S. 17:221) 19 P age
21 Section 1 CURRICULUM, ASSESSMENT, AND INSTRUCTION 30 How has your curriculum changed over the past five years? New courses, 63% Connected to students world or their future, 51% Challenging curriculum, 57% Advanced placement courses, 46% International Baccalaureate courses, 0.03% Integrate academic and technical courses, 34% Our curriculum has not changed in the past 5 years, 1% 6 Other, 17% 5 4 Rigor, 69% total respondents 30 respondents selected more than one strategy Rigor, New Courses, and Challenging curriculum most commonly occurring together Use of data most popular answer, even when only answer chosen 20 P age

22 33 total respondents According to the Louisiana Dept of Education website, more than 90 percent of Louisiana students who complete at least three CTE credits earn a high school diploma There are more than 150 different CTE courses offered by Louisiana public schools. 21 P age
23 30 Which of the following strategies have had the greatest impact on increasing the graduation rate? (choose all that apply) New courses, 63% Connected to students world or their future, 51% 22 Challenging curriculum, 57% Advanced placement courses, 46% International Baccalaureate courses, 0.03% Integrate academic and technical courses, 34% Our curriculum has not changed in the past 5 years, 1% Other, 17% 1 Rigor, 69% 0 35 total respondents 25 respondents selected more than one strategy Rigor, New Courses, and Challenging curriculum most commonly occurring together Use of data most popular answer, even when only answer chosen 22 P age
 27 25 20 20 20 Classroom instruction that works, 77% Learning focused schools, 14% 15 Reading strategies, 57% 10 5 5 6 11 High schools that work, 17% Differentiated")
24 30 Which of the following instructional practices have had the greatest impact on increasing the graduation rate? (choose all that apply) Classroom instruction that works, 77% Learning focused schools, 14% 15 Reading strategies, 57% High schools that work, 17% Differentiated instruction57% Other, 31% 0 Count The most important practice is to have caring, meaningful mentoring relationships between teachers and students. 35 total respondents, 29 respondents with multiple responses Classroom instruction that works commonly chosen along with reading strategies and differentiated instruction The model of differentiated instruction requires teachers to be flexible in their approach to teaching and adjust the curriculum and presentation of information to learners 23 P age
 Challenging instruction programs, 49% 25 25 25 Analysis of student work and assignments, 60% 20 17 21 18 Needs of disabled students, 20% Instruction more engaging, 71% 15")
25 30 What additional strategies do you think would help improve the graduation rate? (choose all that apply) Challenging instruction programs, 49% Analysis of student work and assignments, 60% Needs of disabled students, 20% Instruction more engaging, 71% 15 Co-teaching model, 20% Integrated technology into instruction, 51% 7 7 Applied authentic, realworld problems and projects, 71% 5 4 Equitable distribution of effective teachers, 29% Other, 11% 0 Count 35 total respondents, 31 respondents with multiple responses Focusing on students with disabilities and co-teaching were not popular strategies for improving graduation rates 24 P age
 20 24 19 21 Remediation for struggling students, 80% Tutoring for LEAP, GEE, and End of Course, 89% exams After-school learning opportunities, 57% Small learning communities,")
26 Section 2 PROGRAMS AND INTERVENTIONS What are the most successful programs or interventions you used to increase the graduation rate? (choose all that apply) Remediation for struggling students, 80% Tutoring for LEAP, GEE, and End of Course, 89% exams After-school learning opportunities, 57% Small learning communities, 29% Career academies, 11% Credit recovery, 69% Grade recovery, 54% Teachers as advisors, 40% Assistance for pregnant students, 9% Assistance for parenting students, 9% Fidelity of Implementation, 29% Personal Relationships, 60% 0 Count Other, 17% 35 total respondents, 33 respondents with multiple responses No schools noted assistance for pregnant and parenting students as a successful program to increase graduation rates 25 P age
27 35 What strategies have you used to engage students in a one-on-one relationship with an adult in the school? (choose all that apply) Connect students to an adult in the school, 28% Advisement program, 53% Extracurricular and cocurricular activities, 88% Connected with a responsible adult in the community or on a work site, 9% Transition from Middle School, 53% Other, 20% 7 3 None 0 Count 34 total respondents, 33 respondents with multiple responses Nearly all respondents chose Extracurricular and co-curricular activities as a way to engage students with an adult at school We have a family advocacy program, where students are assigned to an adult mentor and meet with them weekly. 26 P age
28 25 What strategies did you use to ease the transition from eighth grade to ninth grade? (choose all that apply) Feeder schools impact, 24% Summer programs, 24% Vertical teaming, 18% Meetings with students and parents, 68% Other, 35% 5 4 None, 12% 0 Count 34 total respondents 19 respondents with multiple responses 4 schools indicated that they did nothing to ease the transition between 8 th and 9 th grade 27 P age
29 25 25 What strategies have you used to to make ninth grade successful for students? (choose all all that apply) 23 Ninth grade academy or or other, 23 38% other, 38% Ninth grade structure, 41% 41% Remediation of of deficits, 51% 51% Reduce course failure rates, rates, 38% Parent meetings, 68% 68% Graduation Coaches, 38% 38% 5 Other, 24% 0 Count 1 None, 3% 34 total respondents 30 respondents with multiple responses Most schools used multiple strategies to make students successful in the 9 th grade including remediation, academies, and parent involvement 28 P age
30 What are the most important strategies the graduation coach used that led to an increase in the graduation rate? (choose all that apply) Count Role of graduation coach, 20% Identification of potential dropouts, 50% Support of potential dropouts, 53% Work with students, parents, 56% Work with students who are out of school, 0% Dropout prevention efforts, 38% Dropout recovery efforts, 15% Work with your feeder middle school, 15% Other, 20% Since we do not have a graduation coach, we use our own personnel. 34 total respondents, 24 respondents with multiple responses 7 schools indicated that their graduation coach used other unlisted strategies to increase graduation rate. No school indicated that graduation coaches worked with students who were out of school 29 P age
31 What are the most important ways you structured the time in in the school for a focus on increasing the graduation rate? (choose all all that apply) Organizational structure, 65% Modified the school day, 26% Modified school year, 6% 10 9 Other, 3% None, 18% 0 Count 34 total respondents Only 6 respondents with multiple responses Most schools used organizational structure to increase graduation rates Professional development sessions are held with teachers and staff on "using data to improve student achievement rates." All must be involved in continuous growth. 30 P age
32 Section 3 CONTINUOUS IMPROVEMENT How were the mission, goals, and school improvement plan created? 7, 20% 2, 6% 5, 15% Aligned with school district Created by teams of teachers and others 20, 59% Describe the mission, goals, and school improvement plan Other 34 total respondents Most schools used teams of teachers and others to create the School Improvement Plan According to the Louisiana Dept of Education- The School Improvement Plan (SIP) assesses the school's strengths and weaknesses, implements strategies and activities to address the school's needs, and continually evaluates the school's progress toward achieving its objectives and meeting its goals. Plans focus on improving student achievement at the school by addressing state goals and performance standards. 31 P age
 33 30 25 28 25 Plan-Do-Check- Act, 6% Balanced Scorecard, 3% 20 15 STUDENT, FAMILY & COMMUNITY INVOLVEMENT Faculty & SUPPORT involved, 10 Analysis of data, 97% Use of data,")
33 35 Do you use any continuous improvement processes? (Choose all that apply) Plan-Do-Check- Act, 6% Balanced Scorecard, 3% STUDENT, FAMILY & COMMUNITY INVOLVEMENT Faculty & SUPPORT involved, 10 Analysis of data, 97% Use of data, 82% 74% Other, 12% Count 34 total respondents 33 respondents with multiple responses All but one school employed analysis of data to improve graduation rates Plan-Do-Check-Act is also referred to as the Deming Cycle 32 P age
34 Identify the most successful strategies used by your teachers to engage students in their learning. Project-based learning Student accountability Integrated technology Differentiated instruction Cooperative grouping Real-life teaching Discovery learning techniques Cooperative groups Use of technology in the classroom Practice testing on computers Use of real-world experiences Relevant strategies Developing relationships with students Regular parent contact Rigorous and challenging curriculum Integration of technology Use of literacy strategies Identify the most important strategy used to engage families in their students learning. 3, 9% 14, 41% Aware of the student s progress toward graduation Involve entire family 16, 47% Meetings with teachers 1, 3% Other Identify the most important strategies used to involve the community in increasing the graduation rate. PTO and parent involvement nights Community activities and updates Tutor remediation Partners in Education Judges for club functions Guest speakers Parent contact for awareness of student's progress, graduation requirements, attendance and available programs Mailings, newsletters, phone contact, and websites Parental involvement at school 33 P age
 7 16 14 Count 10 2 Private or public, state or national organizations, 20% Louisiana Department of Education, 47% Regional Education Service Agencies, 41% Other, 21% None, 6%")
35 Section 4 PROFESSIONAL LEARNING What were the professional learning opportunities that contributed the most to increasing the graduation rate? (choose all that apply) Count 10 2 Private or public, state or national organizations, 20% Louisiana Department of Education, 47% Regional Education Service Agencies, 41% Other, 21% None, 6% 34 total respondents 13 respondents with multiple responses Almost 30% of the respondents chose either none or other for professional learning opportunities that helped increase their graduation rate. 34 P age
36 30 Why were the previous professional development opportunities successful? (choose all that apply) Identify professional learning needed, 56% Aligned with your school improvement plan, 70% Topics, 35% Amount of time in professional learning, 24% Other, 12% Count 34 total respondents 20 respondents with multiple responses Respondents felt most professional development opportunities were successful because they aligned with the school improvement plan. 35 P age
 27 25 20 15 22 Leadership strategies, 79% Changes made by new principal, 24% Hiring strategies, 21% 10 8 10 6 Evaluation of teachers, 65% Other, 18% 5 0 Count 34 total")
37 Section 5 LEADERSHIP 30 Identify best practices used by school leaders that led to the increase in the graduation rate. (choose all that apply) Leadership strategies, 79% Changes made by new principal, 24% Hiring strategies, 21% Evaluation of teachers, 65% Other, 18% 5 0 Count 34 total respondents 22 respondents with multiple responses Almost 80% of school leaders reported using leadership strategies to increase graduation rates 36 P age
38 Describe how your school includes teachers and others in decision-making processes. Academies at all grade levels Team meeting collaboration Focus groups to make decisions School Improvement Plan Department-specific meetings about students Conferences with teachers Whole-faculty study groups Shared decision-making Teacher interviews Advisory committees Analyze data and brainstorming solutions Unfunded mandates from the state must cease. More control needed over students who register for home school through the state. Grade recovery or credit recovery is just another way of socially promoting students. Transition programs and connection programs are also ways of socially promoting students. 37 P age
 30 30 27 Failure not an option, 50% 25 25 Warm, caring environment, 88% 20 17 Change in leadership, structure, 24% Involvement of school staff, 79% 15 13 Stakeholder groups,")
39 Section 6 SCHOOL CULTURE 35 How has school culture contributed to the increase in the graduation rate? (choose all that apply) Failure not an option, 50% Warm, caring environment, 88% Change in leadership, structure, 24% Involvement of school staff, 79% Stakeholder groups, 32% Teacher involvement in decision-making, 74% Student leader involvement, 38% Other, 3% 0 Count 1 34 total respondents 31 respondents with multiple responses 88% of schools reported that a warm, caring environment contributed to an overall increase in graduation rate 38 P age
40 Section 7 POLICIES AND PROCEDURES How has the state or district provided any flexibility regarding people, money, time, or organizational structure to improve graduation rates? Providing necessary guidance Graduation coach; new administration. Restructured graduation requirements/curriculum; career certification; support of dual-enrollment program DEWS monthly report Funding for credit recovery and afterschool programs Allowed a low student-teacher ratio Provided training and support Funding for GEE tutoring and remediation; time for professional development Allowed the principal wide ranges of discretion Professional development Everybody Graduates grant Were there any district or state policies that helped or hindered your efforts to increase the graduation rate? One policy that the state has that actually hurts our graduation rate is the cohort rate. Being penalized for students not graduating in 4-year span is unfair to the school and to the student. Some of our hardest working kids will graduate in 5 or 6 years. Their persistence and the school s patience should not be a penalty factor. Nearly half of the respondents surveyed indicated that the state and district neither helped nor hindered school efforts to increase graduation rates. GED students were being counted double We were being penalized for large group of GED students Budget cuts Fewer teachers Parish reduction of teacher allotments The district and state policies hinder many efforts through rules and regulations No flexibility in school calendar that prevents some innovations that could help Number of credits required towards graduation 39 P age
41 What is the procedure for students withdrawing from your school? Exit Interview with Counselor or Principals: The student and his parent(s) meet with a counselor to begin the process. After conferencing with the family, a decision is made as to whether the student will complete the withdrawal or be placed in another program at school. Counselor guidance and exit interview Student must meet with the principal for exit process Pre-enrollment, Records Transfer, and Adult Education: The new procedure requires parents to provide proof of pre-enrollment at the receiving school. For example, a request for records. We discuss their plans for transferring to a new school. Records are sent to receiving school in a timely manner. If a student intends to drop out, we follow-up to offer options towards keeping the student in school. Options may even include assisting a student with child care. Counsel students to stay in school or provide other options. Follow up to check the enrollment in adult education, etc. Must identify next enrollment. Students must enroll in another school, and we must receive a request for records before we can drop that student from our records. Age-related Comments: If underage, students must seek Child Welfare and Attendance supervisor for waiver. Student can only withdraw from school at 18 years of age. Student has to be 17; parent must sign withdrawal form, indicating that the student will attend adult education. There is a parish survey, but that is the most we do. We try to convince them to stay, but most of the time, they lack parent support. What is your exit interview process for students who are dropping out of school, and how do you use the information? Most of the responses were similar to the previous questions, indicating that exit counseling was the primary mode for student withdrawal. Few of the responses included the utilization of the withdrawal data to target at-risk students or predict patterns of withdrawal. The data was not reported to be a utilized portion of the exit interview process. 40 P age
42 Meet with the counselor and an administrator to complete the paperwork. We discuss the information to see what else could have been done to prevent the dropout. My exit interview is we do not allow kids to drop - we look for solutions or encourage homeschool as a last solution. We encourage the student to complete their education or even continue it. If a student intends to drop out, we follow-up to offer options towards keeping the student in school. Options may even include assisting a student with child care. 1. The administration meets with them to discourage the dropout and to discuss other options for the student. 2. The administration makes note of the meeting and uses the notes to try to use preventative measures on other students who may show signs this student is displaying. I provide students with other options...credit recovery, extended semesters, flexible day, incomplete grade with the option to make-up missing work, technical school, GED. Students and their guardians are interviewed by our registrar or appropriate counselor and given options waiting them if they drop out. Sometimes the kid is persuaded to remain in school. We try to deter dropouts, but when the students and parents are not receptive to other alternatives, I try to get a reason for the dropout and use this information with the school leadership team to plan further school improvement. What strategies have you used to promote graduation with students in at-risk populations such as over-age and Special Needs? We offer inclusion help for students with IEPs; for other "at-risk" students, we monitor them closely through our guidance department. Grad coach-volunteer; we track students and then assign a mentor. We provide tutors and programs such as credit recovery through our after-school PALS programs. We also partner with the local technical college and encourage enrollment in courses via dualenrollment opportunities. 1. Placement on career diploma track 2. Credit recovery 3. JAG 4. Presentations provided by military recruiters. Transition class in middle school, graduation coach, differentiated instruction, grade recovery, credit recovery. Teachers are willing to take students under their wings and provide assistance to our at-risk populations. Encouragement from our staff has played a major part in keeping at-risk students in school. Motivational presenters were available. We have just monitored these students closely to ensure their success. 41 P age


43 Section 8 GENERAL Do you think your graduation rate is affected more by which of the following? 9, 28% Other 23, 72% students failure to pass a minimum number of courses What kind of support have you received from the district office to increase the graduation rate? Credit recovery program/summer programs Assistance with credit recovery through training, curriculum support, technology, and after-school program Graduation coach, career coach, new administration Flexibility in scheduling, restructuring of curriculum Funding for programs and support with attendance issues None The LEA provided programs for the students to catch up during and after school Hiring of a graduation coach Statistics on students to help identify atrisks students and help with implementing strategies to help those students Federal funding that helps to provide remediation/tutorials 42 P age
44 What, if anything, have you done to lower absentee rates? Phone calls and conferences with parents Admin conference with student s social services provided by school Call the police Notify DA Letters home After-school make-up days Home visits Verification on doctor's notes Four-day week Incentives for perfect attendance Incentives for perfect attendance, daily calls to parents of absent students, report students to the D.A., FINS, and Student Services. This is not working at the moment. What challenges - structural, financial, or otherwise - do you still face? Financial We could always use more people to help with this Staffing Without a grant, we only receive $2,000 from our school district Needs for more technology No money for counselors We may have to increase the student-teacher ratio Unfunded mandates by the state Funding for after-school tutoring Always financial, never enough money! The biggest challenge to attendance is fueled by the poor economy. I still have students who need to work to help pay bills at home Structural More challenging curriculums, especially in technical fields, are also barriers for rural districts High-stakes testing Limited amount of qualified staff Limited staff, limited course offerings, and limited classroom space are some of our challenges GEE Testing Teacher allotment for special programs Large class sizes due to MFP cuts I would like to offer more courses 9 th -grade students enter reading at 5 th or 6 th grade level 43 P age
45 Other Helping the parents understand the need to require, support, encourage, and/or demand that their child completes high school Absenteeism Convincing parents to keep their child in school No jobs for graduates What other supports can the state or the district provide to continue your school s progress? Increase per-pupil allocation In general, assistance needed in addressing ever-changing issues of small, rural schools so that students have same opportunities as other students across the state Counselors to work with students to solve problems that could hinder their education, and to provide them with guidance about their future plans Increase the number of qualified staff in all areas Transportation for students who wish to take advantage of courses offered at the vo-tech Policies for home-schooling students must change. Students with absence and discipline problems go on to Home School too frequently without anyone making home visits to see if any education is taking place Less mandates without funding and allowing schools to put programs into place that will work at the local school level Additional financial support as resources become available State-made curriculum guidelines instead of mandates. Cut out the paperwork and let teachers teach. Continued alternative programs for at-risk children and financial support We need another counselor to serve as curriculum interventionist. We are understaffed. I will be looking for other jobs if things do not change because we are so short staffed 44 P age
46 What do you anticipate will be your graduation rate for 2014? 12 Number of Respondents % 85-89% 90-94% 95-99% 100% Predicted Graduation Rate 95%. But, you will need to realize that with a graduation class of 30, losing one student drops us down to 96%. Losing two is 93%. 45 P age
47 Appendices Appendix A Letter to Participating Individuals...41 Appendix B List of Invited Participants...43 Appendix C 80/10 Survey Questions...45 Appendix D Glossary...51 Appendix E Cohort Graduation Rates P age
48 Appendix A: Letter to Participating Individuals 47 P age
49 48 P age
50 Appendix B List of Invited Participants 49 P age
51 Site Name Parish Principal Midland High School Acadia J. Clyde Briley Bienville High School Bienville Billy Rodgers Ringgold High School Bienville Eric Carter Saline High School Bienville Parish Scott Herrington Westlake High School Calcasieu Parish Lee Crick Caldwell Parish High School Caldwell Sherry Jones Johnson Bayou High School Cameron Robert Kimball Sicily Island High School Catahoula Parish Marguerita Krause Haynesville Jr./Sr. High School Claiborne Parish William Kennedy Logansport High School DeSoto Parish Lillie P. Giles Pelican All Saints High School DeSoto Parish Tamekia Smith Basile High School Evangeline Parish Georgie Courville Delcambre High School Iberia Parish Cory Bourque Loureauville High School Iberia Parish Karen Bashay Fisher Middle/High School Jefferson Parish George Hebert, Jr. Grand Isle High School Jefferson Parish Richard Augustin Dubach High School Lincoln Parish Judy Mabry Ruston High School Lincoln Parish Mike Milstead Plainview High School Rapides Parish Sonia Rasmussen Ebarb High School Sabine Parish Darrin Dyess Zwolle High School Sabine Parish Chad Crow Chalmette High School St. Bernard Parish Wayne Warner North Central High School St. Landry Parish Jerome Robinson Centerville High School St. Mary Parish Mike Galler, III Northshore High School St. Tammany Parish Michael R. Peterson, Erath High School Vermilion Parish Francis Touchet Kaplan High School Vermilion Parish Laura LeBeouf Evans High School Vernon Parish Mike Kay Rosepine High School Vernon Parish Mr. Steve Thomas Shongaloo High School Webster Parish Cyndi Hair Neville High School City of Monroe Brent Vidrine South Cameron High School Cameron Parish Zeke Wainwright Warren Easton Senior High School Orleans Parish Alexina Medley Edna Karr Secondary School Orleans Parish John Hiser McDonough #35 Senior High School Orleans Parish Delores Winfield Eleanor McMain Secondary School Orleans Parish Bridgette Frick 50 P age
52 Appendix C: 80/10 Survey Questions 51 P age
53 [80/10 PROJECT SURVEY] Congratulations! Your graduation rate increased significantly from in to in Overall, regardless of category, what are the five most important strategies your school used over these years to accomplish this? CURRICULUM, ASSESSMENT, & INSTRUCTION 1) How has your curriculum changed over the past five years? (choose all that apply) a) Rigor b) New courses c) Connected to students world or their future d) Challenging curriculum f) International Baccalaureate courses g) Integrate academic and technical courses h) Our curriculum has not changed in the past 5 years e) Advanced placement courses i) Other 2) What is the career and technical focus of your school? a) Emphasize careers b) Career and technical course enrollment increase c) Other 3) Which of the following strategies has had the greatest impact on increasing the graduation rate? (choose all that apply) a) Benchmarks e) Use of data to modify curriculum and b) Formative assessment instruction c) Standard-based assessments f) Other d) Diagnostic assessments 4) Which of the following instructional practices have had the greatest impact on increasing the graduation rate? (choose all that apply) a) Classroom instruction that works d) High schools that work b) Learning focused schools e) Differentiated instruction c) Reading strategies f) Other 5) What additional strategies do you think would help improve the graduation rate? (choose all that apply) a) Challenging instruction programs b) Analysis of student work and d) Instruction more engaging e) Co-teaching model assignments c) Needs of disabled students f) Integrated technology into instruction 52 P age
54 g) Applied authentic, real-world problems and projects h) Equitable distribution of effective teachers i) Other PROGRAMS AND INTERVENTIONS 6) What are the most successful programs or interventions you used to increase the graduation rate? (choose all that apply) a) Remediation for struggling students b) Tutoring for LEAP, GEE, and End of Course exams c) After-school learning opportunities d) Small learning communities e) Career academies f) Credit recovery g) Grade recovery h) Teachers as advisors i) Assistance for pregnant students j) Assistance for parenting students k) Fidelity of Implementation l) Personal Relationships m) Other 7) What strategies have you used to engage students in a one-on-one relationship with an adult at the school? (choose all that apply) a) Connect students to an adult in the d) Connected with a responsible adult in school the community or on a work site b) Advisement program e) Transition from middle school c) Extracurricular and co-curricular f) Other activities g) None 8) What strategies did you use to ease the transition from 8 th grade to 9 th grade? (choose all that apply) a) Feeder schools impact d) Meetings with students and parents b) Summer programs e) Other c) Vertical teaming f) None 9) What strategies have you used to make 9 th grade successful for students? (choose all that apply) a) Ninth grade academy or any other e) Parent meetings support for ninth grade f) Graduation Coaches b) Ninth grade structure g) Other c) Remediation of deficits h) None d) Reduce course failure rates 10) What are the most important strategies the graduation coach used that led to an increase in the graduation rate? (choose all that apply) a) Role of graduation coach b) Identification of potential dropouts c) Support of potential dropouts f) Dropout prevention efforts g) Dropout recovery efforts h) Work with your feeder middle school d) Work with students, parents e) Work with students who are out of school i) Other 11) What are the most important ways you structured the time in the school for a focus on increasing the graduation rate? (choose all that apply) a) Organizational structure b) Modified the school day 53 P age
55 c) Modified school year d) Other e) None Comments: CONTINUOUS IMPROVEMENT 12) How were the mission, goals, and school improvement plan created? a) Created by teams of teachers and c) Related to the graduation rate others d) Aligned with school district b) Describe the mission, goals, and school e) Other improvement plan. 13) Do you use any continuous improvement processes? a) Plan-Do-Check-Act b) Balanced Scorecard c) Analysis of data d) Use of data e) Faculty involved f) Other Comments: STUDENT, FAMILY & COMMUNITY INVOLVEMENT & SUPPORT 14) Identify the most successful strategies used by your teachers to engage students in their learning. 15) Identify the most important strategy used to engage families in their students learning. a) Involve entire family c) Meetings with teachers b) Aware of the student s progress toward d) Other graduation e) None 16) Identify the most important strategies used to involve the community in increasing the graduation rate. Comments: PROFESSIONAL LEARNING 17) What were the professional learning opportunities that contributed the most to increasing the graduation rate? 54 P age
56 a) Private or public, state or national organizations b) Louisiana Department of Education, 18) Why were the previous opportunities successful? a) Identify professional learning needed b) Aligned with your school improvement plan c) Regional Education Service Agencies d) Other e) None c) Topics d) Amount of time in professional learning e) Other Comments: LEADERSHIP 19) Identify best practices used by school leaders that led to the increase in the graduation rate. a) Leadership strategies d) Evaluation of teachers b) Changes made by new principal c) Hiring strategies e) Other f) None 20) Describe how your school includes teachers and others in decision-making processes. Comments: SCHOOL CULTURE 21) How has school culture contributed to the increase in the graduation rate? a) Failure not an option b) Warm, caring environment c) Change in leadership, structure d) Involvement of school staff f) Teacher involvement in decisionmaking g) Student leader involvement h) Other e) Stakeholder groups i) None Comments: POLICIES AND PROCEDURES 22) How has the state or district provided any flexibility regarding people, money, time, or organizational structure to improve graduation rates? 55 P age
57 23) Were there any district or state policies that helped or hindered your efforts to increase the graduation rate? 24) What is the procedure for students withdrawing from your school? 25) What is your exit interview process for students who are dropping out of school and how do you use the information? 26) What strategies have you used to promote graduation with students in at-risk populations such as over-age and Special Needs? Comments: GENERAL 27) 1. Do you think your graduation rate is affected more by which of the following? a) Students failure to pass a minimum number of courses b) Students failure to pass one or more graduation tests c) Other Explain: 28) What kind of support have you received from the district office to increase the graduation rate? 29) What, if anything, have you done to lower absentee rates? 30) What challenges - structural, financial, or otherwise - do you still face? 31) What other supports can the state or the district provide to continue your school s progress? 32) What do you anticipate will be your graduation rate for 2014? Comments: 56 P age
58 Appendix D: Glossary 57 P age
59 Glossary of Terms Used in Survey and Report ACTIVE LEARNING: A process whereby learners are actively engaged in the learning process, rather than "passively" absorbing lectures. Active learning involves reading, writing, discussion, and engagement in solving problems, analysis, synthesis, and evaluation. Active learning often involves cooperative learning. ASSESSMENT: A means of measuring student progress toward national and state goals. ADVANCED PLACEMENT PROGRAM (commonly known as Advanced Placement, or AP): A United States and Canada-based program that offers high school students the opportunity to receive university credit for their work during high school. EDUCATION POLICY: the collection of rules, both stated and implicit, or the regularities in practice that govern the behavior of persons in schools. Education policy analysis is the scholarly study of education policy. FORMATIVE ASSESSMENT: "...part of the instructional process. When incorporated into classroom practice, it provides the information needed to adjust teaching and learning while they are happening. In this sense, formative assessment informs both teachers and students about student understanding at a point when timely adjustments can be made. These adjustments help to ensure students achieve targeted standards-based learning goals within a set time frame. Although formative assessment strategies appear in a variety of formats, there are some distinct ways to distinguish them from summative assessments." SUMMATIVE ASSESSMENT: "...are given periodically to determine at a particular point in time what students know and do not know. Many associate summative assessments only with standardized tests such as state assessments, but they are an important part of district and classroom programs. Summative assessment at the district/classroom level is an accountability measure that is generally used as part of the grading process... BENCHMARKS OR MILESTONES: Tangible, incremental steps toward meeting specific goals and national standards. BRIDGING: A teacher helping students make connections between what they are studying and real-life, out-of-school experiences. COLLABORATIVE LEARNING: Views all knowledge as "the common property of a group." CONSENSUS BUILDING: The process by which students, schools, communities or groups of people learn to compromise individual beliefs and ideas in order to seek "common ground" and 58 P age
60 come to consensus. This pre-planned consensus may be dictated from the top-down (national to local), yet be promoted as grassroots ideologies. It changes beliefs through pressure to conform to group-thinking. (See Synthesis) CONTENT STANDARDS: Descriptions of what students should know and demonstrate in each subject area. CRITICAL THINKING: Challenging students' traditional beliefs, values and authorities through values clarification strategies and Mastery Learning DISCOVERY LEARNING: The student supposedly generates and tests his own ideas, conclusions, concepts, etc., creating his own understanding of reality and giving new meanings to traditional words. In reality, he or she is prompted toward a pre-planned understanding through stories, suggestions, questions, and group dialogue. LEARNING OUTCOME: The term may refer to course aims (intended learning outcomes) or may be roughly synonymous with educational objectives (observed learning outcomes). Usage varies between organizations. LIFELONG LEARNING: A continuous, lifelong program to re-educate the masses in preparation for the 21st Century workforce and community. All adults must meet the social, psychological, and work skills standards required for work and citizenship. MENTORING: A developmental relationship between a more experienced mentor and a less experienced partner referred to as a mentee or protégé. OBJECTIVE: An educational objective is a statement of a goal that successful participants are expected demonstrably to achieve before the course or unit is completed. OUTCOMES: "What students must know, and be able to do, and be like." Determined at the national and international level, they must be met locally. Called learning goals, performance objectives, standards, competencies or capacities, they all require students to embrace "new thinking, new strategies, new behavior, and new beliefs." PARENTS AS TEACHERS: Brings the state educator into homes to make sure each child starts school "ready to learn" and "able to learn. The child is given a personal computer code number, and a computer record is initiated that will enable the national data system to track each child for the rest of his life. Parents as well as children are evaluated. 59 P age
61 REMEDIATION: A stage in the Outcome-Based Education /mastery learning loop, which applies to students who resist change or fail to show expected progress. Remediation continues until the student learns the required outcomes and demonstrates them on standardized tests. WORK-BASED LEARNING: Programs designed to teach older students (grades 7 and up) work skills on the job site, thereby assuring that the student can perform the task needed by local employers when he graduates from public school. It replaces traditional academics with work skills for a particular job P age
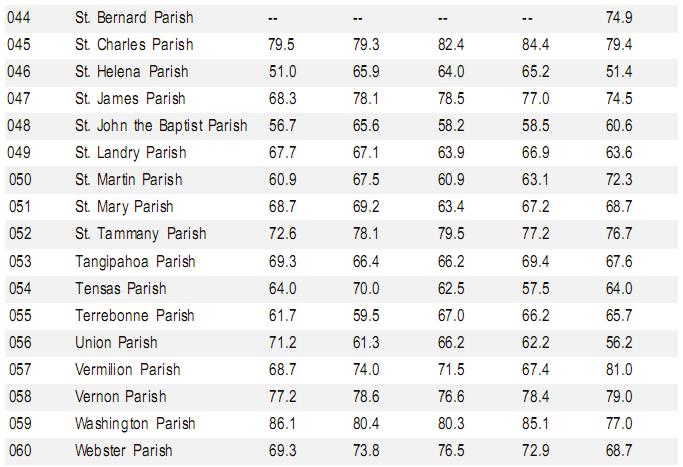
62 Appendix E: Cohort Graduation Rates P age
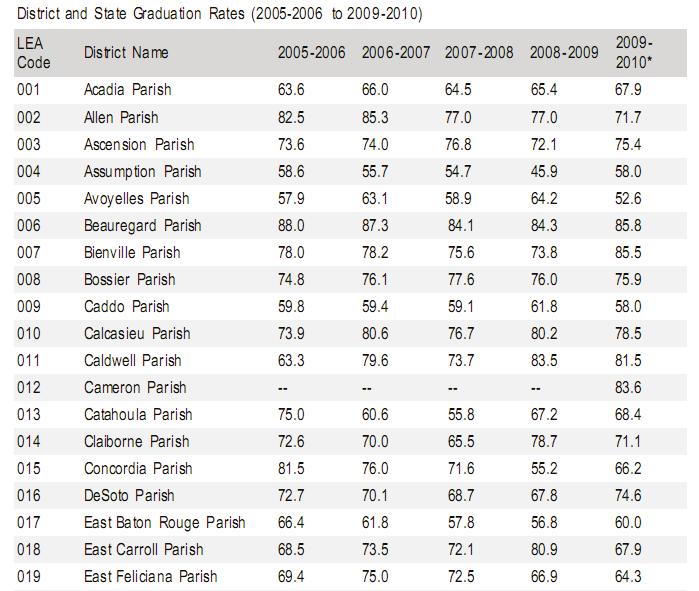
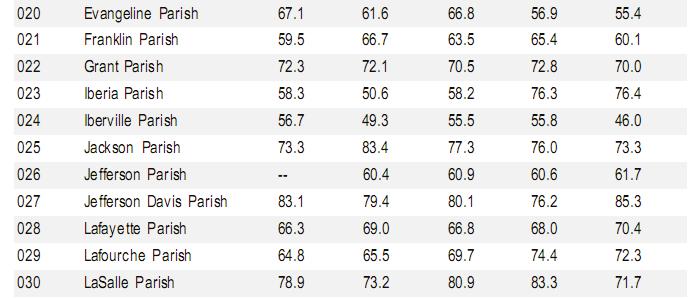
63 62 P age
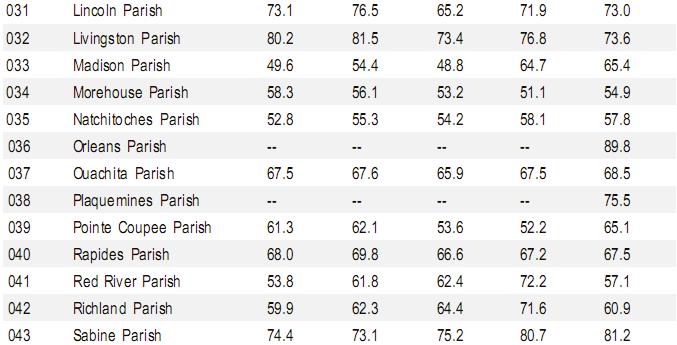
64 63 P age
A Guide to Adequate Yearly Progress Analyses in Nevada 2007 Nevada Department of Education
 A Guide to Adequate Yearly Progress Analyses in Nevada 2007 Nevada Department of Education Note: Additional information regarding AYP Results from 2003 through 2007 including a listing of each individual
Early Warning System Implementation Guide
 Linking Research and Resources for Better High Schools betterhighschools.org September 2010 Early Warning System Implementation Guide For use with the National High School Center s Early Warning System
Educational Attainment
 A Demographic and Socio-Economic Profile of Allen County, Indiana based on the 2010 Census and the American Community Survey Educational Attainment A Review of Census Data Related to the Educational Attainment
The Condition of College & Career Readiness 2016
 The Condition of College and Career Readiness This report looks at the progress of the 16 ACT -tested graduating class relative to college and career readiness. This year s report shows that 64% of students
Executive Summary. Laurel County School District. Dr. Doug Bennett, Superintendent 718 N Main St London, KY
 Dr. Doug Bennett, Superintendent 718 N Main St London, KY 40741-1222 Document Generated On January 13, 2014 TABLE OF CONTENTS Introduction 1 Description of the School System 2 System's Purpose 4 Notable
Governors and State Legislatures Plan to Reauthorize the Elementary and Secondary Education Act
 Governors and State Legislatures Plan to Reauthorize the Elementary and Secondary Education Act Summary In today s competitive global economy, our education system must prepare every student to be successful
State Parental Involvement Plan
 A Toolkit for Title I Parental Involvement Section 3 Tools Page 41 Tool 3.1: State Parental Involvement Plan Description This tool serves as an example of one SEA s plan for supporting LEAs and schools
Testimony to the U.S. Senate Committee on Health, Education, Labor and Pensions. John White, Louisiana State Superintendent of Education
 Testimony to the U.S. Senate Committee on Health, Education, Labor and Pensions John White, Louisiana State Superintendent of Education October 3, 2017 Chairman Alexander, Senator Murray, members of the
KDE Comprehensive School. Improvement Plan. Harlan High School
 KDE Comprehensive School Improvement Plan Harlan Independent Britt Lawson, Principal 420 E Central St Harlan, KY 40831 Document Generated On December 22, 2014 TABLE OF CONTENTS Introduction 1 Executive
Getting Results Continuous Improvement Plan
 Page of 9 9/9/0 Department of Education Market Street Harrisburg, PA 76-0 Getting Results Continuous Improvement Plan 0-0 Principal Name: Ms. Sharon Williams School Name: AGORA CYBER CS District Name:
Emerald Coast Career Institute N
 Okaloosa County School District Emerald Coast Career Institute N 2017-18 School Improvement Plan Okaloosa - 0791 - - 2017-18 SIP 500 ALABAMA ST, Crestview, FL 32536 [ no web address on file ] School Demographics
Implementing an Early Warning Intervention and Monitoring System to Keep Students On Track in the Middle Grades and High School
 Implementing an Early Warning Intervention and Monitoring System to Keep Students On Track in the Middle Grades and High School National High School Center Facilitator: Joseph Harris, Ph.D. Presenters:
For Your Future. For Our Future. ULS Strategic Framework
 For Your Future. For Our Future. ULS Strategic Framework Contents Mission Vision Development Introduction Framework For Your Future. For Our Future. Academic Success, Student Success & Educational Attainment
Elementary and Secondary Education Act ADEQUATE YEARLY PROGRESS (AYP) 1O1
 1O1") Elementary and Secondary Education Act ADEQUATE YEARLY PROGRESS (AYP) 1O1 1 AYP Elements ALL students proficient by 2014 Separate annual proficiency goals in reading & math 1% can be proficient at district
Elementary and Secondary Education Act ADEQUATE YEARLY PROGRESS (AYP) 1O1 1 AYP Elements ALL students proficient by 2014 Separate annual proficiency goals in reading & math 1% can be proficient at district
School Performance Plan Middle Schools
 SY 2012-2013 School Performance Plan Middle Schools 734 Middle ALternative Program @ Lombard, Principal Roger Shaw (Interim), Executive Director, Network Facilitator PLEASE REFER TO THE SCHOOL PERFORMANCE
World s Best Workforce Plan
 2017-18 World s Best Workforce Plan District or Charter Name: PiM Arts High School, 4110-07 Contact Person Name and Position Matt McFarlane, Executive Director In accordance with Minnesota Statutes, section
NORTH CAROLINA VIRTUAL PUBLIC SCHOOL IN WCPSS UPDATE FOR FALL 2007, SPRING 2008, AND SUMMER 2008
 E&R Report No. 08.29 February 2009 NORTH CAROLINA VIRTUAL PUBLIC SCHOOL IN WCPSS UPDATE FOR FALL 2007, SPRING 2008, AND SUMMER 2008 Authors: Dina Bulgakov-Cooke, Ph.D., and Nancy Baenen ABSTRACT North
Price Sensitivity Analysis
 Executive Summary The present study set out to determine whether relationships existed between the change in tuition rates, tuition and fees rates, and tuition, fees, and room and board rates at Illinois
Expanded Learning Time Expectations for Implementation
 I. ELT Design is Driven by Focused School-wide Priorities The school s ELT design (schedule, staff, instructional approaches, assessment systems, budget) is driven by no more than three school-wide priorities,
Running Head GAPSS PART A 1
 Running Head GAPSS PART A 1 Current Reality and GAPSS Assignment Carole Bevis PL & Technology Innovation (ITEC 7460) Kennesaw State University Ed.S. Instructional Technology, Spring 2014 GAPSS PART A 2
Iowa School District Profiles. Le Mars
 Iowa School District Profiles Overview This profile describes enrollment trends, student performance, income levels, population, and other characteristics of the public school district. The report utilizes
Cooper Upper Elementary School
 LIVONIA PUBLIC SCHOOLS http://cooper.livoniapublicschools.org 215-216 Annual Education Report BOARD OF EDUCATION 215-16 Colleen Burton, President Dianne Laura, Vice President Tammy Bonifield, Secretary
Self Assessment. InTech Collegiate High School. Jason Stanger, Director 1787 Research Park Way North Logan, UT
 Jason Stanger, Director 1787 Research Park Way North Logan, UT 84341-5600 Document Generated On June 13, 2016 TABLE OF CONTENTS Introduction 1 Standard 1: Purpose and Direction 2 Standard 2: Governance
Collegiate Academies Response to Livingston School Facility RFA Submitted January 23, 2015
 Collegiate Academies Response to Livingston School Facility RFA Submitted January 23, 2015! I. APPLICANT INFORMATION Please provide the information below. Name of charter operator Application contact name
Kansas Adequate Yearly Progress (AYP) Revised Guidance
 Revised Guidance") Kansas State Department of Education Kansas Adequate Yearly Progress (AYP) Revised Guidance Based on Elementary & Secondary Education Act, No Child Left Behind (P.L. 107-110) Revised May 2010 Revised May
Kansas State Department of Education Kansas Adequate Yearly Progress (AYP) Revised Guidance Based on Elementary & Secondary Education Act, No Child Left Behind (P.L. 107-110) Revised May 2010 Revised May
K-12 Academic Intervention Plan. Academic Intervention Services (AIS) & Response to Intervention (RtI)
 & Response to Intervention (RtI)") K-12 Academic Intervention Plan Academic Intervention Services (AIS) & Response to Intervention (RtI) September 2016 June 2018 2016 2018 K 12 Academic Intervention Plan Table of Contents AIS Overview...Page
K-12 Academic Intervention Plan Academic Intervention Services (AIS) & Response to Intervention (RtI) September 2016 June 2018 2016 2018 K 12 Academic Intervention Plan Table of Contents AIS Overview...Page
EXECUTIVE SUMMARY. Online courses for credit recovery in high schools: Effectiveness and promising practices. April 2017
 EXECUTIVE SUMMARY Online courses for credit recovery in high schools: Effectiveness and promising practices April 2017 Prepared for the Nellie Mae Education Foundation by the UMass Donahue Institute 1
Moving the Needle: Creating Better Career Opportunities and Workforce Readiness. Austin ISD Progress Report
 Moving the Needle: Creating Better Career Opportunities and Workforce Readiness Austin ISD Progress Report 2013 A Letter to the Community Central Texas Job Openings More than 150 people move to the Austin
Connecting to the Big Picture: An Orientation to GEAR UP
 Connecting to the Big Picture: An Orientation to GEAR UP About the National Council for Community and Education Partnerships (NCCEP) Our mission is to build the capacity of communities to ensure that underserved
ILLINOIS DISTRICT REPORT CARD
 -6-525-2- HAZEL CREST SD 52-5 HAZEL CREST SD 52-5 HAZEL CREST, ILLINOIS and federal laws require public school districts to release report cards to the public each year. 2 7 ILLINOIS DISTRICT REPORT CARD
ILLINOIS DISTRICT REPORT CARD
 -6-525-2- Hazel Crest SD 52-5 Hazel Crest SD 52-5 Hazel Crest, ILLINOIS 2 8 ILLINOIS DISTRICT REPORT CARD and federal laws require public school districts to release report cards to the public each year.
State Budget Update February 2016
 State Budget Update February 2016 2016-17 BUDGET TRAILER BILL SUMMARY The Budget Trailer Bill Language is the implementing statute needed to effectuate the proposals in the annual Budget Bill. The Governor
Trends & Issues Report
 Trends & Issues Report prepared by David Piercy & Marilyn Clotz Key Enrollment & Demographic Trends Options Identified by the Eight Focus Groups General Themes 4J Eugene School District 4J Eugene, Oregon
Executive Summary. Walker County Board of Education. Dr. Jason Adkins, Superintendent 1710 Alabama Avenue Jasper, AL 35501
 Dr. Jason Adkins, Superintendent 1710 Alabama Avenue Jasper, AL 35501 Document Generated On November 3, 2016 TABLE OF CONTENTS Introduction 1 Description of the School System 2 System's Purpose 4 Notable
Hokulani Elementary School
 Hokulani Elementary Code: 109 Status and Improvement Report Year -11 Contents Focus On Standards Grades K-5 This Status and Improvement Report has been prepared as part of the Department's education accountability
Lakewood Board of Education 200 Ramsey Avenue, Lakewood, NJ 08701
 March 20, 2017 Judee DeStefano-Anen Interim Executive County Superintendent 212 Washington Street Toms River, NJ 08753 Dear Dr. DeStefano-Anen: It is with great sadness that I must inform you that the
John F. Kennedy Middle School
 John F. Kennedy Middle School CUPERTINO UNION SCHOOL DISTRICT Steven Hamm, Principal hamm_steven@cusdk8.org School Address: 821 Bubb Rd. Cupertino, CA 95014-4938 (408) 253-1525 CDS Code: 43-69419-6046890
Week 4: Action Planning and Personal Growth
 Week 4: Action Planning and Personal Growth Overview So far in the Comprehensive Needs Assessment of your selected campus, you have analyzed demographic and student learning data through the AYP report,
RtI: Changing the Role of the IAT
 RtI: Changing the Role of the IAT Aimee A. Kirsch Akron Public Schools Akron, Ohio akirsch@akron.k12.oh.us Urban Special Education Leadership Collaborative November 3, 2006 1 Introductions Akron Public
School Balanced Scorecard 2.0 (Single Plan for Student Achievement)
") School Balanced Scorecard 2.0 (Single Plan for Student Achievement) School Name: A. P. Giannini Middle School 1: Access and Equity- Make Social Justice a Reality What does this goal mean at your school?
School Balanced Scorecard 2.0 (Single Plan for Student Achievement) School Name: A. P. Giannini Middle School 1: Access and Equity- Make Social Justice a Reality What does this goal mean at your school?
READY OR NOT? CALIFORNIA'S EARLY ASSESSMENT PROGRAM AND THE TRANSITION TO COLLEGE
 READY OR NOT? CALIFORNIA'S EARLY ASSESSMENT PROGRAM AND THE TRANSITION TO COLLEGE Michal Kurlaender University of California, Davis Policy Analysis for California Education March 16, 2012 This research
Every Student Succeeds Act: Building on Success in Tennessee. ESSA State Plan. Tennessee Department of Education December 19, 2016 Draft
 Every Student Succeeds Act: Building on Success in Tennessee ESSA State Plan Tennessee Department of Education December 19, 2016 Draft Table of Contents INTRODUCTION... 1 TENNESSEE SUCCEEDS... 1 Ambitious
ADDENDUM 2016 Template - Turnaround Option Plan (TOP) - Phases 1 and 2 St. Lucie Public Schools
 - Phases 1 and 2 St. Lucie Public Schools") ADDENDUM 2016 Template - Turnaround Option Plan (TOP) - Phases 1 and 2 St. Lucie Public Schools The district requests an additional year to implement the previously approved turnaround option. Evidence
ADDENDUM 2016 Template - Turnaround Option Plan (TOP) - Phases 1 and 2 St. Lucie Public Schools The district requests an additional year to implement the previously approved turnaround option. Evidence
Cuero Independent School District
 Cuero Independent School District Texas Superintendent: Henry Lind Primary contact: Debra Baros, assistant superintendent* 1,985 students, prek-12, rural District Description Cuero Independent School District
NDPC-SD Data Probes Worksheet
 NDPC-SD Data Probes Worksheet This worksheet from the National Dropout Prevention Center for Students with Disabilities (NDPC- SD) is an optional tool to help schools organize multiple years of student
Newburgh Enlarged City School District Academic. Academic Intervention Services Plan
 Newburgh Enlarged City School District Academic Academic Intervention Services Plan Revised September 2016 October 2015 Newburgh Enlarged City School District Elementary Academic Intervention Services
1.0 INTRODUCTION. The purpose of the Florida school district performance review is to identify ways that a designated school district can:
 1.0 INTRODUCTION 1.1 Overview Section 11.515, Florida Statutes, was created by the 1996 Florida Legislature for the purpose of conducting performance reviews of school districts in Florida. The statute
Massachusetts Juvenile Justice Education Case Study Results
 Massachusetts Juvenile Justice Education Case Study Results Principal Investigator: Thomas G. Blomberg Dean and Sheldon L. Messinger Professor of Criminology and Criminal Justice Prepared by: George Pesta
Shelters Elementary School
 Shelters Elementary School August 2, 24 Dear Parents and Community Members: We are pleased to present you with the (AER) which provides key information on the 23-24 educational progress for the Shelters
School Leadership Rubrics
 School Leadership Rubrics The School Leadership Rubrics define a range of observable leadership and instructional practices that characterize more and less effective schools. These rubrics provide a metric
CONNECTICUT GUIDELINES FOR EDUCATOR EVALUATION. Connecticut State Department of Education
 CONNECTICUT GUIDELINES FOR EDUCATOR EVALUATION Connecticut State Department of Education October 2017 Preface Connecticut s educators are committed to ensuring that students develop the skills and acquire
SSTATE SYSIP STEMIC IMPROVEMENT PL A N APRIL 2016
 SSIP S TATE S Y S TEM I C I M P R O V EM EN T PL A N APRIL 2016 CONTENTS Acronym List... 2 Executive Summary... 3 Infrastructure Development... 5 1(a) Specify improvements that will be made to the State
SECTION I: Strategic Planning Background and Approach
 JOHNS CREEK HIGH SCHOOL STRATEGIC PLAN SY 2014/15 SY 2016/17 APPROVED AUGUST 2014 SECTION I: Strategic Planning Background and Approach In May 2012, the Georgia Board of Education voted to make Fulton
Volunteer State Community College Strategic Plan,
 Volunteer State Community College Strategic Plan, 2005-2010 Mission: Volunteer State Community College is a public, comprehensive community college offering associate degrees, certificates, continuing
Mooresville Charter Academy
 NORTH CAROLINA CHARTER SCHOOL APPLICATION Mooresville Charter Academy Public charter schools opening the fall of 2015 Due by 5:00 pm, December 6, 2013 North Carolina Department of Public Instruction NCDPI/Office
Colorado s Unified Improvement Plan for Schools for Online UIP Report
 Colorado s Unified Improvement Plan for Schools for 2015-16 Online UIP Report Organization Code: 2690 District Name: PUEBLO CITY 60 Official 2014 SPF: 1-Year Executive Summary How are students performing?
MIDDLE SCHOOL. Academic Success through Prevention, Intervention, Remediation, and Enrichment Plan (ASPIRE)
") MIDDLE SCHOOL Academic Success through Prevention, Intervention, Remediation, and Enrichment Plan (ASPIRE) Board Approved July 28, 2010 Manual and Guidelines ASPIRE MISSION The mission of the ASPIRE program
MIDDLE SCHOOL Academic Success through Prevention, Intervention, Remediation, and Enrichment Plan (ASPIRE) Board Approved July 28, 2010 Manual and Guidelines ASPIRE MISSION The mission of the ASPIRE program
Katy Independent School District Paetow High School Campus Improvement Plan
 Katy Independent School District 2017-2018 Campus Improvement Plan Generated by Plan4Learningcom 1 of 15 Table of Contents Comprehensive Needs Assessment 3 Demographics 3 Student Academic Achievement 4
Orleans Central Supervisory Union
 Orleans Central Supervisory Union Vermont Superintendent: Ron Paquette Primary contact: Ron Paquette* 1,142 students, prek-12, rural District Description Orleans Central Supervisory Union (OCSU) is the
Executive Summary. Hialeah Gardens High School
 Miami-Dade County Public Schools Dr. Louis Algaze, Principal 11700 Hialeah Gardens Blvd Hialeah Gardens, FL 33018 Document Generated On March 19, 2014 TABLE OF CONTENTS Introduction 1 Description of the
Public School Choice DRAFT
 Public School Choice DRAFT Why Public School Choice? The educational ecosystem continues to see different types of schools and instructional choices being offered by private schools, charter organizations,
Karla Brooks Baehr, Ed.D. Senior Advisor and Consultant The District Management Council
 Karla Brooks Baehr, Ed.D. Senior Advisor and Consultant The District Management Council This paper aims to inform the debate about how best to incorporate student learning into teacher evaluation systems
LEAD AGENCY MEMORANDUM OF UNDERSTANDING
 LEAD AGENCY MEMORANDUM OF UNDERSTANDING The Memorandum of Understanding (MOU) describes and confirms an Agreement between Lincoln Public Schools / Lincoln Community Learning Centers (CLC) and. The purpose
Port Graham El/High. Report Card for
 School: District: Kenai Peninsula Grades: K - 12 School Enrollment: 20 Title I School? No Title 1 Program: Accreditation: Report Card for 2008-2009 A Title 1 school receives federal money in support low-achieving
Practices Worthy of Attention Step Up to High School Chicago Public Schools Chicago, Illinois
 Step Up to High School Chicago Public Schools Chicago, Illinois Summary of the Practice. Step Up to High School is a four-week transitional summer program for incoming ninth-graders in Chicago Public Schools.
The Talent Development High School Model Context, Components, and Initial Impacts on Ninth-Grade Students Engagement and Performance
 The Talent Development High School Model Context, Components, and Initial Impacts on Ninth-Grade Students Engagement and Performance James J. Kemple, Corinne M. Herlihy Executive Summary June 2004 In many
Common Core Path to Achievement. A Three Year Blueprint to Success
 Common Core Path to Achievement A Three Year Blueprint to Success The Winds of Change Continue to Blow!!! By the beginning of the 2014-2015 School Year, there will be a new accountability system in place
Data Glossary. Summa Cum Laude: the top 2% of each college's distribution of cumulative GPAs for the graduating cohort. Academic Honors (Latin Honors)
") Institutional Research and Assessment Data Glossary This document is a collection of terms and variable definitions commonly used in the universities reports. The definitions were compiled from various
Institutional Research and Assessment Data Glossary This document is a collection of terms and variable definitions commonly used in the universities reports. The definitions were compiled from various
Intervention in Struggling Schools Through Receivership New York State. May 2015
 Intervention in Struggling Schools Through Receivership New York State May 2015 The Law - Education Law Section 211-f and Receivership In April 2015, Subpart E of Part EE of Chapter 56 of the Laws of 2015
Cooper Upper Elementary School
 LIVONIA PUBLIC SCHOOLS www.livoniapublicschools.org/cooper 213-214 BOARD OF EDUCATION 213-14 Mark Johnson, President Colleen Burton, Vice President Dianne Laura, Secretary Tammy Bonifield, Trustee Dan
Student Mobility Rates in Massachusetts Public Schools
 Student Mobility Rates in Massachusetts Public Schools Introduction The Massachusetts Department of Elementary and Secondary Education (ESE) calculates and reports mobility rates as part of its overall
Sunnyvale Middle School School Accountability Report Card Reported Using Data from the School Year Published During
 Sunnyvale Middle School School Accountability Report Card Reported Using Data from the 2014-15 School Year Published During 2015-16 By February 1 of each year, every school in California is required by
Kannapolis Charter Academy
 NORTH CAROLINA CHARTER SCHOOL APPLICATION Kannapolis Charter Academy Public charter schools opening the fall of 2015 Due by 5:00 pm, December 6, 2013 North Carolina Department of Public Instruction NCDPI/Office
CHAPTER 4: REIMBURSEMENT STRATEGIES 24
 CHAPTER 4: REIMBURSEMENT STRATEGIES 24 INTRODUCTION Once state level policymakers have decided to implement and pay for CSR, one issue they face is simply how to calculate the reimbursements to districts
ASCD Recommendations for the Reauthorization of No Child Left Behind
 ASCD Recommendations for the Reauthorization of No Child Left Behind The Association for Supervision and Curriculum Development (ASCD) represents 178,000 educators. Our membership is composed of teachers,
Bellevue University Bellevue, NE
 C O L L E G E P R O F I L E - O V E R V I E W Bellevue University Bellevue, NE Bellevue, founded in 1966, is a private university. Its campus is located in Bellevue, in the Omaha metropolitan area. Web
Executive Summary. Belle Terre Elementary School
 Flagler County School District Dr. TC Culver, Principal 5545 Belle Terre Pkwy Palm Coast, FL 32137-3847 Document Generated On February 6, 2013 TABLE OF CONTENTS Introduction 1 Description of the School
Executive Summary. Gautier High School
 Pascagoula School District Mr. Boyd West, Principal 4307 Gautier-Vancleave Road Gautier, MS 39553-4800 Document Generated On January 16, 2013 TABLE OF CONTENTS Introduction 1 Description of the School
Coming in. Coming in. Coming in
 212-213 Report Card for Glenville High School SCHOOL DISTRICT District results under review by the Ohio Department of Education based upon 211 findings by the Auditor of State. Achievement This grade combines
Chart 5: Overview of standard C
 Chart 5: Overview of standard C Overview of levels of achievement of the standards in section C Indicate with X the levels of achievement for the standards as identified by each subject group in the table
Best Colleges Main Survey
 Best Colleges Main Survey Date submitted 5/12/216 18::56 Introduction page 1 / 146 BEST COLLEGES Data Collection U.S. News has begun collecting data for the 217 edition of Best Colleges. The U.S. News
RAISING ACHIEVEMENT BY RAISING STANDARDS. Presenter: Erin Jones Assistant Superintendent for Student Achievement, OSPI
 RAISING ACHIEVEMENT BY RAISING STANDARDS Presenter: Erin Jones Assistant Superintendent for Student Achievement, OSPI Agenda Introductions Definitions History of the work Strategies Next steps Debrief
The Dropout Crisis is a National Issue
 2012 ANNUAL REPORT The Dropout Crisis is a National Issue Thirty percent of U.S. students drop out of high school, with dropout rates exceeding 50% in poor urban communities. Students who dropout face
Invest in CUNY Community Colleges
 Invest in Opportunity Invest in CUNY Community Colleges Pat Arnow Professional Staff Congress Invest in Opportunity Household Income of CUNY Community College Students
College and Career Ready Performance Index, High School, Grades 9-12
 Dr. John D. Barge, State School Superintendent Making Education Work for All of Georgia s Students College and Career Ready Performance Index, High School, Grades 9-12 CONTENT MASTERY (END of COURSE TESTS
EFFECTS OF MATHEMATICS ACCELERATION ON ACHIEVEMENT, PERCEPTION, AND BEHAVIOR IN LOW- PERFORMING SECONDARY STUDENTS
 EFFECTS OF MATHEMATICS ACCELERATION ON ACHIEVEMENT, PERCEPTION, AND BEHAVIOR IN LOW- PERFORMING SECONDARY STUDENTS Jennifer Head, Ed.S Math and Least Restrictive Environment Instructional Coach Department
Teach For America alumni 37,000+ Alumni working full-time in education or with low-income communities 86%
 About Teach For America Teach For America recruits, trains, and supports top college graduates and professionals who make an initial commitment to teach for two years in urban and rural public schools
Minnesota s Consolidated State Plan Under the Every Student Succeeds Act (ESSA)
") Minnesota s Consolidated State Plan Under the Every Student Succeeds Act (ESSA) To be submitted to the U.S. Department of Education in September 2017 IMPORTANT NOTE: This is an early draft prepared for
Minnesota s Consolidated State Plan Under the Every Student Succeeds Act (ESSA) To be submitted to the U.S. Department of Education in September 2017 IMPORTANT NOTE: This is an early draft prepared for
SCHOOL IMPROVEMENT PLAN Salem High School
 Mission Statement The mission of is to offer all students the opportunity to demonstrate independence, self- motivation, and responsibility for self and others. Provided with a safe learning environment
Rhyne Elementary School Improvement Plan Rhyne Elementary School Contact Information
 School Address - 2016 Rhyne Elementary School Improvement Plan Rhyne Elementary School Contact Information Rhyne Elementary School Courier Number 360484 1900 West Davidson Avenue Phone Number 704-866-6098
Educational Quality Assurance Standards. Residential Juvenile Justice Commitment Programs DRAFT
 Educational Quality Assurance Standards Residential Juvenile Justice Commitment Programs 2009 2010 Bureau of Exceptional Education and Student Services Division of K-12 Public Schools Florida Department
Miami-Dade County Public Schools
 ENGLISH LANGUAGE LEARNERS AND THEIR ACADEMIC PROGRESS: 2010-2011 Author: Aleksandr Shneyderman, Ed.D. January 2012 Research Services Office of Assessment, Research, and Data Analysis 1450 NE Second Avenue,
Clark Lane Middle School
 152-51 STRATEGIC SCHOOL PROFILE 2010-11 Middle and Junior High School Edition Clark Lane Middle School Waterford School District MICHAEL LOVETERE, Principal LYNN M. LYNCH, Asst. Principal Telephone: (860)
ALABAMA ARKANSAS DISTRICT OF COLUMBIA FLORIDA. Gavin Miller Speech Clients. Southern Arkansas University (Baptist Student Union) :: Magnolia, AR
 :: Magnolia, AR") ABAMA Southern Arkansas University (Baptist Student Union) :: Magnolia, AR 1 of 10 Bayside Academy :: Fairhope, AL Fairhope High School :: Fairhope, AL Fairhope Middle School :: Fairhope, AL First United
ABAMA Southern Arkansas University (Baptist Student Union) :: Magnolia, AR 1 of 10 Bayside Academy :: Fairhope, AL Fairhope High School :: Fairhope, AL Fairhope Middle School :: Fairhope, AL First United
University of Toronto
 University of Toronto OFFICE OF THE VICE PRESIDENT AND PROVOST 1. Introduction A Framework for Graduate Expansion 2004-05 to 2009-10 In May, 2000, Governing Council Approved a document entitled Framework
64% :Trenton High School. School Grade A; AYP-No. *FCAT Level 3 and Above: Reading-80%; Math-
 I. Current School Status: A. School Information: 1. School-Level Information: a. School: Trenton High School b. Principal's name: Cheri Langford c. School Advisory Council chair's name: Heather Rucker
MPA Internship Handbook AY
 MPA Internship Handbook AY 2017-2018 Introduction The primary purpose of the MPA internship is to provide students with a meaningful experience in which they can apply what they have learned in the classroom
PEIMS Submission 1 list
 Campus PEIMS Preparation FALL 2014-2015 D E P A R T M E N T O F T E C H N O L O G Y ( D O T ) - P E I M S D I V I S I O N PEIMS Submission 1 list The information on this page provides instructions for
DATE ISSUED: 11/2/ of 12 UPDATE 103 EHBE(LEGAL)-P
-P") TITLE III REQUIREMENTS STATE POLICY DEFINITIONS DISTRICT RESPONSIBILITY IDENTIFICATION OF LEP STUDENTS A district that receives funds under Title III of the No Child Left Behind Act shall comply with the
TITLE III REQUIREMENTS STATE POLICY DEFINITIONS DISTRICT RESPONSIBILITY IDENTIFICATION OF LEP STUDENTS A district that receives funds under Title III of the No Child Left Behind Act shall comply with the
Executive Summary. Osan High School
 Pacific: Korea Mr. Morgan Nugent, Principal Unit 2037 APO, AP 96278-2039 Document Generated On December 9, 2014 TABLE OF CONTENTS Introduction 1 Description of the School 2 School's Purpose 3 Notable Achievements