Introduction to Regression Analysis Grade 11 and 12
|
|
|
- Steven Fitzgerald
- 6 years ago
- Views:
Transcription
1 State Standards Data Analysis and Probability Objective 1: Create and analyze tabular and graphical displays of data using appropriate tools, including spreadsheets and graphing calculators. Indicators 4. Create a scatter plot of bivariate data, identify trends, and find a function to model the data. 5. Use technology to find the Least Squares Regression Line, the regression coefficient, and the correlation coefficient for bivariate data with a linear trend, and interpret each of these statistics in the context of the problem situation. 8. Analyze and interpret univariate and bivariate data to identify patterns, note trends, draw conclusions, and make predictions. Objective 2: Use descriptive statistics to analyze and summarize data, including measures of center, dispersion, correlation and variability. Lesson Summary: Working together, students determine a regression line and a coefficient of correlation for bivariate data. Students determine relationships between the regression line and the coefficient of correlation in a group learning activity. Students examine scatter plots with similar lines of regression and different correlation coefficients to explore the value of correlation coefficients. Estimated Duration: 90 minutes Commentary: This lesson provides a review discussion of correlation versus causation as part of the pre-assessment. The lesson also provides the opportunity for students to learn the material in different ways, including visually, and symbolically. The lesson gives options for flexible use of time and gives an excellent introduction on lines of regression. Pre-Assessment: Pair students and distribute Getting Started, Attachment A. This activity is a review of making a scatter plots and estimating a line of best fit. Discuss the students answers for the line of best fit. Ask students why different pairs may have slightly different equations for the line of best fit. Discuss the decisions each pair made when determining which points to use to write the line equation and how those choices affected the equation. Discuss the students graphs in Part Two of Attachment A, Getting Started. Discuss with students how as one variable increases (i.e. time spent on a diet) and the other decreases (i.e. weight), a negative correlation occurs. If one variable increases as the second one also increases, then a positive correlation occurs. Instructional Tip: Use uncooked spaghetti for this activity. If this is not available, use clear rulers. Scoring Guidelines: Informally observe students progress and provide intervention as necessary. Post-Assessment: Allow students a few minutes to measure each other s arm and index finger lengths to the nearest tenth of a centimeter. Write the information as ordered pairs, (arm length, finger length), in a 1
2 State Standards Indicator 8 Analyze and interpret univariate and bivariate data to identify patterns, note trends, draw conclusions, and make predictions. Mathematical Processes Objective 3: Assess the adequacy and reliability of information available to solve a problem. location visible to all students, and direct students to plot each ordered pair on a coordinate plane. Instruct students to use technology to determine the regression equation and calculate the coefficient of correlation for the data. Ask students to describe a relationship between a person s arm length and index finger length using the calculated data. Instructional Tip: Depending on the class size, additional data can be collected from another class to make the relationship more obvious. Give students the following scenario: Measure each foot in inches and make a table of data for ten students. Use the information calculated earlier to predict the arm length. Write a statement about the reliability of this prediction, using the coefficient of correlation. Scoring Guidelines: Evaluate students work using the rubric below. Creates a scatterplot correctly Calculates the line of best fit, equation of line and the 3 coefficient of correlation correctly Describes the relationship between the two variables Writes a prediction and a statement about the reliability of this prediction for the scenario using his/her information Creates a scatterplot correctly Calculates an equation for the line of best fit as well as the 2 coefficient of correlation, but one or both contain minor errors Does not clearly describe the relationship between the two variables Makes an accurate prediction and a statement about the reliability of this prediction for the scenario based on the flawed regression equation and/or correlation coefficient Includes a scatterplot Calculates the line of best fit and its equation as well as 1 the coefficient of correlation incorrectly Does not clearly describe the relationship between the two variables Writes a prediction and a statement about the reliability of this prediction for the scenario that does not follow from the inaccurate regression equation or correlation coefficient 2
3 Instructional Procedures: Part One 1. Administer the pre-assessment. 2. Ask students what they know about bivariate data. Some students may analyze the prefix of the word (bi) and the stem (variate) to conclude that bivariate data measure two things that change in relationship to each other. Some students may remember discussing relationships such as weight and age or speed and distance. 3. Create an overhead transparency for Attachment B, Putting It Together, and display both graphs for students. Have students make conjectures about measurements that could be represented by the data. As students offer suggestions of possible representations, discuss whether or not those variables would have a cause and effect relationship or a coincidental relationship. 4. Assign students to small groups of three or four students. Have them plot the points on Attachment C, Group Activity. Have each group provide a story for each set of data and identify the variables in those situations. 5. Ask groups to share with the class the stories they created and the variables that go with those stories. As a class, select one story to represent each graph. On a transparency of the graphs, write the variables and a brief description of each situation. Discuss the relationships evident in the graphs and decide as a class how strong those relationships are (e.g., not very well related; appears very predictable; as one goes up, the other seems to go down). Instructional Tip: Allow the use of informal language at this point in the mathematical discussion. The formal language and explanations will make more sense to the students later in the lesson, once they have already understood the ideas in everyday language. 6. Explain to students that formal methods of finding the line of best fit and a number to represent the strength of the relationship between variables exists. Provide some explanation about the range of correlations coefficients (closer to 1 being stronger, zero meaning there is no relationship). However, do NOT at this point discuss the range going from -1 to 1. This will be discovered by the students later in the lesson. Ask students to brainstorm situations whose correlation coefficient would be closer to zero or closer to Demonstrate how to use technology (computer software or graphing calculator) to find the line of best fit and the correlation coefficient for the data on Page One of Attachment B, Putting it Together. Then have students work in pairs to find the equation and correlation coefficient for page two of Attachment B. Ask questions to summarize findings such as: Ask students to compare the two problems. How are they alike? How are they different? Could they predict which problem would have a higher coefficient of correlation by looking at the graphs? What characteristics do they think make the correlation stronger (closer to one)? 3
4 Instructional Tips: If students are already familiar with using technology to find the line of best fit and coefficient of correlation using technology, divide them into groups to do so. If students are unfamiliar with the technology, use the demonstration to help students become familiar with the features of the calculator or computer software being used. Providing a list of steps (buttons to push or features to select) is helpful. Refer to the user s manual for instructions on graphing scatter plots and calculating the regression equation and correlation coefficient with a graphing calculator or computer. 8. Have students share with a partner something new they learned about correlation coefficients and lines of best fit today. Also have them share a question they still have about either topic. Part Two 9. Ask students to state in one sentence what Part One of the lesson covered. Have students share the questions they still have about correlation coefficients or lines of best fit. 10. Divide the students into small groups of three or four. Ask students to refer to Attachment C, Group Activity, used in Part One of the lesson. Have the students work in their groups to make predictions about what the correlation coefficient might be for each graph. Share and record the groups predictions. 11. Divide students into small groups of three to four students. Assign each group two problems from Attachment C, Group Activity, used in Part One of the lesson. Each group uses technology to create a scatter plot, find the line of best fit and calculate the coefficient of correlation for their assigned problems. Each group draws a scatter plot and records the coefficient and line equation for each problem on chart paper or a poster to display to the other groups. 12. Assign problems to at least two different groups, so each group can confirm the work on each problem with a different group. Provide time for groups to compare their results. Instructional Tip: Stress the importance of recording the data in a manner that others will be able to read clearly, when it is displayed 13. Instruct the groups to display their information after they have compared matching problems with another group. 14. Instruct students to circulate around the room, looking at the results for each problem. Allow about 10 minutes for viewing of results, and then have students return to their groups. 15. Ask students to discuss the following questions in their groups: What do you notice about the regression equations? How were the correlation coefficients similar or different? What relationship or connection do you see between the slope of the line and the correlation coefficient? How could a person tell which graphs represent a high correlation by looking at the scatter plots? What does it mean to have a high or low correlation? 16. Discuss these questions as a class. Be sure during the discussion that students talk about why a negative correlation occurs, how as one variable increases (i.e. time spent on a diet), the 4
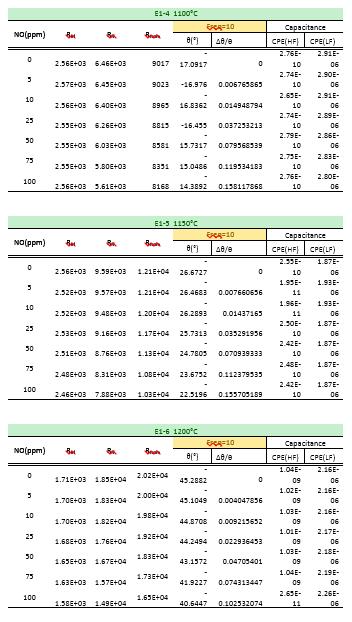
5 other decreases (i.e. weight). Also emphasize that correlation does not imply causation. For example, the age a child begins to crawl may correlate with how well the child reads, but one does not actually cause the other. 17. Instruct students to create an example of two types of data that have similar numbers but different correlation coefficients. Each group should provide a scenario to describe and share the information with the class. Differentiated Instructional Support: Instruction is differentiated according to learner needs, to help all learners either meet the intent of the specified indicator(s) or, if the indicator is already met, to advance beyond the specified indicator(s). Students who need more practice with the technology used in this lesson may need detailed instructions to follow or more examples to help them remember the steps needed to create scatter plots, lines of best fit, and correlation coefficients. Students demonstrating evidence of understanding of the concepts may locate data in the Internet, or do a mini-research project to collect data to analyze, present as a scatter plot and determine the correlation. Students demonstrating evidence of understanding of the concepts may be interested in finding the line of best fit by hand. Many statistics textbooks and other resources provide instructions for doing the calculations. Extensions: Show students the examples from Putting It Together, Attachment B. Graph the line of best fit found using technology. Demonstrate finding the distance from a data point to the line (draw vertical lines connecting each data point to the line of best fit). Find the length of each vertical line. Ask students how this might relate to the coefficient of correlation. Discuss how the numbers are related. Discuss with students research applications of correlation coefficients and how researchers use correlations to make decisions. For example, when testing a new medical treatment, is a correlation of.786 acceptable? What are typical correlation coefficients in medical research? Research as a class how to create a Least Squares Regression Line. Home Connections: Encourage students to read a newspaper or magazine and find a table or scatter plot involving bivariate data. Enrichment Activity: Using the skills you have learned in the lesson, find the relationship of each bivariate data on the Diesel Sensor Activity and determine the best function in calculating the sensitivity of the sensor for diesel engine fired in different temperatures. ( Hint: just calculate the sensitivity and paired it with different temperatures.) Graph the data and determine the coefficients of correlations and line of best fit. 5
6 For the teacher: grid paper, uncooked spaghetti or clear rulers, scissors, envelopes, graphing calculator or computer with software for scatter plots, regression equations and coefficients of correlation, scissors and envelopes., and a transparency of Attachment B For the student: copies of Attachment A, uncooked spaghetti or clear rulers, a graphing calculator or computer with software capable of performing required calculations, Group Activity, Attachment C (pre-cut for the activity), paper or flip chart paper for displaying data, and grid paper Vocabulary: bivariate data coefficient of correlation/correlation coefficient collinear line of best fit line of regression linear scatter plot Technology Connections: Technology is used in this lesson to calculate the regression lines and coefficient of correlation, and to create scatter plots. Students use the Internet to find information about bivariate data and correlation coefficients. Research Connections: Arter, Judith and Jay McTighe. Scoring Rubrics in the Classroom: Using Performance Criteria for Assessing and Improving Student Performance. Thousand Oaks, Calif: Corwin Press, General Tips: Prepare the group activity before class. Cut the problems and directions for student use. Attachments: Attachment A, Getting Started Attachment B, Putting It Together Attachment C, Group Activity Attachment D, Group Activity Answer Key 6
7 7
8 Attachment A Getting Started Answers Key Name Date Part One Directions: The table below details the number of students in an after school program over a period of ten weeks. Use the information to draw a scatter plot. The points are not collinear. Place a piece of spaghetti so it fits the data as closely as possible. Use two points from the line (your spaghetti) to write the equation for that line. Part Two Directions: Sketch a graph to represent how each of the following may look on a graph. a. time spent on a diet and weight b. age of a car and its value c. amount of education and salary Sample graphs include: 8
9 Attachment A (continued) Getting Started Answer Key The regression equation and coefficient of correlation are given as a guide. Answers for the equation may vary. Regression Equation: y = x Coefficient of Correlation: Sketches for the second part may vary. Parts a and b represent a negative correlation while part c represents a positive correlation (although students may question part c). Answers for Attachment B: Page One: Regression equation: y = 0.3x r = Page Two: Regression equation: y = x r =
10 Attachment B Putting it Together Page one 10
11 Attachment B (continued) Putting it Together Page two 11
12 Attachment C Group Activity Name Date 12
13 A. y = 1x r =.648 Introduction to Regression Analysis Grade 11 and 12 Attachment D Group Activity Answer Key B. y = 1.06x r =.953 C. y =.926x r =
14 Attachment D (continued) Group Activity Answer Key D. y = x r = E. y = x r = F. y = x r =

15 Enrichment Activity: Sensor for Diesel Engine 15
16 16
AGS THE GREAT REVIEW GAME FOR PRE-ALGEBRA (CD) CORRELATED TO CALIFORNIA CONTENT STANDARDS
 CORRELATED TO CALIFORNIA CONTENT STANDARDS") AGS THE GREAT REVIEW GAME FOR PRE-ALGEBRA (CD) CORRELATED TO CALIFORNIA CONTENT STANDARDS 1 CALIFORNIA CONTENT STANDARDS: Chapter 1 ALGEBRA AND WHOLE NUMBERS Algebra and Functions 1.4 Students use algebraic
AGS THE GREAT REVIEW GAME FOR PRE-ALGEBRA (CD) CORRELATED TO CALIFORNIA CONTENT STANDARDS 1 CALIFORNIA CONTENT STANDARDS: Chapter 1 ALGEBRA AND WHOLE NUMBERS Algebra and Functions 1.4 Students use algebraic
Probability and Statistics Curriculum Pacing Guide
 Unit 1 Terms PS.SPMJ.3 PS.SPMJ.5 Plan and conduct a survey to answer a statistical question. Recognize how the plan addresses sampling technique, randomization, measurement of experimental error and methods
Characteristics of Functions
 Characteristics of Functions Unit: 01 Lesson: 01 Suggested Duration: 10 days Lesson Synopsis Students will collect and organize data using various representations. They will identify the characteristics
Cal s Dinner Card Deals
 Cal s Dinner Card Deals Overview: In this lesson students compare three linear functions in the context of Dinner Card Deals. Students are required to interpret a graph for each Dinner Card Deal to help
Measurement. When Smaller Is Better. Activity:
 Measurement Activity: TEKS: When Smaller Is Better (6.8) Measurement. The student solves application problems involving estimation and measurement of length, area, time, temperature, volume, weight, and
Algebra 1, Quarter 3, Unit 3.1. Line of Best Fit. Overview
 Algebra 1, Quarter 3, Unit 3.1 Line of Best Fit Overview Number of instructional days 6 (1 day assessment) (1 day = 45 minutes) Content to be learned Analyze scatter plots and construct the line of best
STA 225: Introductory Statistics (CT)
") Marshall University College of Science Mathematics Department STA 225: Introductory Statistics (CT) Course catalog description A critical thinking course in applied statistical reasoning covering basic
Marshall University College of Science Mathematics Department STA 225: Introductory Statistics (CT) Course catalog description A critical thinking course in applied statistical reasoning covering basic
Mathematics Success Level E
 T403 [OBJECTIVE] The student will generate two patterns given two rules and identify the relationship between corresponding terms, generate ordered pairs, and graph the ordered pairs on a coordinate plane.
AP Statistics Summer Assignment 17-18
 AP Statistics Summer Assignment 17-18 Welcome to AP Statistics. This course will be unlike any other math class you have ever taken before! Before taking this course you will need to be competent in basic
Grade 6: Correlated to AGS Basic Math Skills
 Grade 6: Correlated to AGS Basic Math Skills Grade 6: Standard 1 Number Sense Students compare and order positive and negative integers, decimals, fractions, and mixed numbers. They find multiples and
STT 231 Test 1. Fill in the Letter of Your Choice to Each Question in the Scantron. Each question is worth 2 point.
 STT 231 Test 1 Fill in the Letter of Your Choice to Each Question in the Scantron. Each question is worth 2 point. 1. A professor has kept records on grades that students have earned in his class. If he
Curriculum Design Project with Virtual Manipulatives. Gwenanne Salkind. George Mason University EDCI 856. Dr. Patricia Moyer-Packenham
 Curriculum Design Project with Virtual Manipulatives Gwenanne Salkind George Mason University EDCI 856 Dr. Patricia Moyer-Packenham Spring 2006 Curriculum Design Project with Virtual Manipulatives Table
Dublin City Schools Mathematics Graded Course of Study GRADE 4
 I. Content Standard: Number, Number Sense and Operations Standard Students demonstrate number sense, including an understanding of number systems and reasonable estimates using paper and pencil, technology-supported
Interpreting Graphs Middle School Science
 Middle School Free PDF ebook Download: Download or Read Online ebook interpreting graphs middle school science in PDF Format From The Best User Guide Database. Rain, Rain, Go Away When the student council
The lab is designed to remind you how to work with scientific data (including dealing with uncertainty) and to review experimental design.
 and to review experimental design.") Name: Partner(s): Lab #1 The Scientific Method Due 6/25 Objective The lab is designed to remind you how to work with scientific data (including dealing with uncertainty) and to review experimental design.
Name: Partner(s): Lab #1 The Scientific Method Due 6/25 Objective The lab is designed to remind you how to work with scientific data (including dealing with uncertainty) and to review experimental design.
Math-U-See Correlation with the Common Core State Standards for Mathematical Content for Third Grade
 Math-U-See Correlation with the Common Core State Standards for Mathematical Content for Third Grade The third grade standards primarily address multiplication and division, which are covered in Math-U-See
Research Design & Analysis Made Easy! Brainstorming Worksheet
 Brainstorming Worksheet 1) Choose a Topic a) What are you passionate about? b) What are your library s strengths? c) What are your library s weaknesses? d) What is a hot topic in the field right now that
Chapters 1-5 Cumulative Assessment AP Statistics November 2008 Gillespie, Block 4
 Chapters 1-5 Cumulative Assessment AP Statistics Name: November 2008 Gillespie, Block 4 Part I: Multiple Choice This portion of the test will determine 60% of your overall test grade. Each question is
Function Tables With The Magic Function Machine
 Brief Overview: Function Tables With The Magic Function Machine s will be able to complete a by applying a one operation rule, determine a rule based on the relationship between the input and output within
Getting Started with TI-Nspire High School Science
 Getting Started with TI-Nspire High School Science 2012 Texas Instruments Incorporated Materials for Institute Participant * *This material is for the personal use of T3 instructors in delivering a T3
Sample Problems for MATH 5001, University of Georgia
 Sample Problems for MATH 5001, University of Georgia 1 Give three different decimals that the bundled toothpicks in Figure 1 could represent In each case, explain why the bundled toothpicks can represent
Learning Disability Functional Capacity Evaluation. Dear Doctor,
 Dear Doctor, I have been asked to formulate a vocational opinion regarding NAME s employability in light of his/her learning disability. To assist me with this evaluation I would appreciate if you can
Spinners at the School Carnival (Unequal Sections)
") Spinners at the School Carnival (Unequal Sections) Maryann E. Huey Drake University maryann.huey@drake.edu Published: February 2012 Overview of the Lesson Students are asked to predict the outcomes of
Spinners at the School Carnival (Unequal Sections) Maryann E. Huey Drake University maryann.huey@drake.edu Published: February 2012 Overview of the Lesson Students are asked to predict the outcomes of
What s Different about the CCSS and Our Current Standards?
 The Common Core State Standards and CPM Educational Program The Need for Change in Our Educational System: College and Career Readiness Students are entering into a world that most of us would have found
Common Core State Standards
 Common Core State Standards Common Core State Standards 7.NS.3 Solve real-world and mathematical problems involving the four operations with rational numbers. Mathematical Practices 1, 3, and 4 are aspects
Table of Contents. Introduction Choral Reading How to Use This Book...5. Cloze Activities Correlation to TESOL Standards...
 Table of Contents Introduction.... 4 How to Use This Book.....................5 Correlation to TESOL Standards... 6 ESL Terms.... 8 Levels of English Language Proficiency... 9 The Four Language Domains.............
Visit us at:
 White Paper Integrating Six Sigma and Software Testing Process for Removal of Wastage & Optimizing Resource Utilization 24 October 2013 With resources working for extended hours and in a pressurized environment,
Average Number of Letters
 Find the average number of letters in a group of 5 names. As a group, discuss strategies to figure out how to find the average number of letters in a group of 5 names. Remember that there will be 5 groups
Classroom Connections Examining the Intersection of the Standards for Mathematical Content and the Standards for Mathematical Practice
 Classroom Connections Examining the Intersection of the Standards for Mathematical Content and the Standards for Mathematical Practice Title: Considering Coordinate Geometry Common Core State Standards
Math 96: Intermediate Algebra in Context
 : Intermediate Algebra in Context Syllabus Spring Quarter 2016 Daily, 9:20 10:30am Instructor: Lauri Lindberg Office Hours@ tutoring: Tutoring Center (CAS-504) 8 9am & 1 2pm daily STEM (Math) Center (RAI-338)
FIGURE IT OUT! MIDDLE SCHOOL TASKS. Texas Performance Standards Project
 FIGURE IT OUT! MIDDLE SCHOOL TASKS π 3 cot(πx) a + b = c sinθ MATHEMATICS 8 GRADE 8 This guide links the Figure It Out! unit to the Texas Essential Knowledge and Skills (TEKS) for eighth graders. Figure
ASSESSMENT TASK OVERVIEW & PURPOSE:
 Performance Based Learning and Assessment Task A Place at the Table I. ASSESSMENT TASK OVERVIEW & PURPOSE: Students will create a blueprint for a decorative, non rectangular picnic table (top only), and
Mathematics subject curriculum
 Mathematics subject curriculum Dette er ei omsetjing av den fastsette læreplanteksten. Læreplanen er fastsett på Nynorsk Established as a Regulation by the Ministry of Education and Research on 24 June
OVERVIEW OF CURRICULUM-BASED MEASUREMENT AS A GENERAL OUTCOME MEASURE
 OVERVIEW OF CURRICULUM-BASED MEASUREMENT AS A GENERAL OUTCOME MEASURE Mark R. Shinn, Ph.D. Michelle M. Shinn, Ph.D. Formative Evaluation to Inform Teaching Summative Assessment: Culmination measure. Mastery
Exploring Derivative Functions using HP Prime
 Exploring Derivative Functions using HP Prime Betty Voon Wan Niu betty@uniten.edu.my College of Engineering Universiti Tenaga Nasional Malaysia Wong Ling Shing Faculty of Health and Life Sciences, INTI
Introducing the New Iowa Assessments Mathematics Levels 12 14
 Introducing the New Iowa Assessments Mathematics Levels 12 14 ITP Assessment Tools Math Interim Assessments: Grades 3 8 Administered online Constructed Response Supplements Reading, Language Arts, Mathematics
Creating a Test in Eduphoria! Aware
 in Eduphoria! Aware Login to Eduphoria using CHROME!!! 1. LCS Intranet > Portals > Eduphoria From home: LakeCounty.SchoolObjects.com 2. Login with your full email address. First time login password default
LLD MATH. Student Eligibility: Grades 6-8. Credit Value: Date Approved: 8/24/15
 PUBLIC SCHOOLS OF EDISON TOWNSHIP DIVISION OF CURRICULUM AND INSTRUCTION LLD MATH Length of Course: Elective/Required: School: Full Year Required Middle Schools Student Eligibility: Grades 6-8 Credit Value:
MADERA SCIENCE FAIR 2013 Grades 4 th 6 th Project due date: Tuesday, April 9, 8:15 am Parent Night: Tuesday, April 16, 6:00 8:00 pm
 MADERA SCIENCE FAIR 2013 Grades 4 th 6 th Project due date: Tuesday, April 9, 8:15 am Parent Night: Tuesday, April 16, 6:00 8:00 pm Why participate in the Science Fair? Science fair projects give students
Radius STEM Readiness TM
 Curriculum Guide Radius STEM Readiness TM While today s teens are surrounded by technology, we face a stark and imminent shortage of graduates pursuing careers in Science, Technology, Engineering, and
Statewide Framework Document for:
 Statewide Framework Document for: 270301 Standards may be added to this document prior to submission, but may not be removed from the framework to meet state credit equivalency requirements. Performance
Unit 3. Design Activity. Overview. Purpose. Profile
 Unit 3 Design Activity Overview Purpose The purpose of the Design Activity unit is to provide students with experience designing a communications product. Students will develop capability with the design
Honors Mathematics. Introduction and Definition of Honors Mathematics
 Honors Mathematics Introduction and Definition of Honors Mathematics Honors Mathematics courses are intended to be more challenging than standard courses and provide multiple opportunities for students
Math Grade 3 Assessment Anchors and Eligible Content
 Math Grade 3 Assessment Anchors and Eligible Content www.pde.state.pa.us 2007 M3.A Numbers and Operations M3.A.1 Demonstrate an understanding of numbers, ways of representing numbers, relationships among
Using Proportions to Solve Percentage Problems I
 RP7-1 Using Proportions to Solve Percentage Problems I Pages 46 48 Standards: 7.RP.A. Goals: Students will write equivalent statements for proportions by keeping track of the part and the whole, and by
Content Language Objectives (CLOs) August 2012, H. Butts & G. De Anda
 August 2012, H. Butts & G. De Anda") Content Language Objectives (CLOs) Outcomes Identify the evolution of the CLO Identify the components of the CLO Understand how the CLO helps provide all students the opportunity to access the rigor of
Content Language Objectives (CLOs) Outcomes Identify the evolution of the CLO Identify the components of the CLO Understand how the CLO helps provide all students the opportunity to access the rigor of
Paper 2. Mathematics test. Calculator allowed. First name. Last name. School KEY STAGE TIER
 259574_P2 5-7_KS3_Ma.qxd 1/4/04 4:14 PM Page 1 Ma KEY STAGE 3 TIER 5 7 2004 Mathematics test Paper 2 Calculator allowed Please read this page, but do not open your booklet until your teacher tells you
Biome I Can Statements
 Biome I Can Statements I can recognize the meanings of abbreviations. I can use dictionaries, thesauruses, glossaries, textual features (footnotes, sidebars, etc.) and technology to define and pronounce
Missouri Mathematics Grade-Level Expectations
 A Correlation of to the Grades K - 6 G/M-223 Introduction This document demonstrates the high degree of success students will achieve when using Scott Foresman Addison Wesley Mathematics in meeting the
Airplane Rescue: Social Studies. LEGO, the LEGO logo, and WEDO are trademarks of the LEGO Group The LEGO Group.
 Airplane Rescue: Social Studies LEGO, the LEGO logo, and WEDO are trademarks of the LEGO Group. 2010 The LEGO Group. Lesson Overview The students will discuss ways that people use land and their physical
EDEXCEL FUNCTIONAL SKILLS PILOT TEACHER S NOTES. Maths Level 2. Chapter 4. Working with measures
 EDEXCEL FUNCTIONAL SKILLS PILOT TEACHER S NOTES Maths Level 2 Chapter 4 Working with measures SECTION G 1 Time 2 Temperature 3 Length 4 Weight 5 Capacity 6 Conversion between metric units 7 Conversion
End-of-Module Assessment Task
 Student Name Date 1 Date 2 Date 3 Topic E: Decompositions of 9 and 10 into Number Pairs Topic E Rubric Score: Time Elapsed: Topic F Topic G Topic H Materials: (S) Personal white board, number bond mat,
School of Innovative Technologies and Engineering
 School of Innovative Technologies and Engineering Department of Applied Mathematical Sciences Proficiency Course in MATLAB COURSE DOCUMENT VERSION 1.0 PCMv1.0 July 2012 University of Technology, Mauritius
Unit 3 Ratios and Rates Math 6
 Number of Days: 20 11/27/17 12/22/17 Unit Goals Stage 1 Unit Description: Students study the concepts and language of ratios and unit rates. They use proportional reasoning to solve problems. In particular,
Statistical Analysis of Climate Change, Renewable Energies, and Sustainability An Independent Investigation for Introduction to Statistics
 5/22/2012 Statistical Analysis of Climate Change, Renewable Energies, and Sustainability An Independent Investigation for Introduction to Statistics College of Menominee Nation & University of Wisconsin
How to Judge the Quality of an Objective Classroom Test
 How to Judge the Quality of an Objective Classroom Test Technical Bulletin #6 Evaluation and Examination Service The University of Iowa (319) 335-0356 HOW TO JUDGE THE QUALITY OF AN OBJECTIVE CLASSROOM
Statistical Studies: Analyzing Data III.B Student Activity Sheet 7: Using Technology
 Suppose data were collected on 25 bags of Spud Potato Chips. The weight (to the nearest gram) of the chips in each bag is listed below. 25 28 23 26 23 25 25 24 24 27 23 24 28 27 24 26 24 25 27 26 25 26
If we want to measure the amount of cereal inside the box, what tool would we use: string, square tiles, or cubes?
 String, Tiles and Cubes: A Hands-On Approach to Understanding Perimeter, Area, and Volume Teaching Notes Teacher-led discussion: 1. Pre-Assessment: Show students the equipment that you have to measure
Florida Reading for College Success
 Core provides an English curriculum focused on developing the mastery of skills identified as critical to postsecondary readiness in reading. This single semester elective aligns to Florida's Postsecondary
Prentice Hall Literature: Timeless Voices, Timeless Themes Gold 2000 Correlated to Nebraska Reading/Writing Standards, (Grade 9)
") Nebraska Reading/Writing Standards, (Grade 9) 12.1 Reading The standards for grade 1 presume that basic skills in reading have been taught before grade 4 and that students are independent readers. For
Nebraska Reading/Writing Standards, (Grade 9) 12.1 Reading The standards for grade 1 presume that basic skills in reading have been taught before grade 4 and that students are independent readers. For
TEKS Resource System. Effective Planning from the IFD & Assessment. Presented by: Kristin Arterbury, ESC Region 12
 TEKS Resource System Effective Planning from the IFD & Assessments Presented by: Kristin Arterbury, ESC Region 12 karterbury@esc12.net, 254-297-1115 Assessment Curriculum Instruction planwithifd.wikispaces.com
Literature and the Language Arts Experiencing Literature
 Correlation of Literature and the Language Arts Experiencing Literature Grade 9 2 nd edition to the Nebraska Reading/Writing Standards EMC/Paradigm Publishing 875 Montreal Way St. Paul, Minnesota 55102
Planning for Preassessment. Kathy Paul Johnston CSD Johnston, Iowa
 Planning for Preassessment Kathy Paul Johnston CSD Johnston, Iowa Why Plan? Establishes the starting point for learning Students can t learn what they already know Match instructional strategies to individual
Create A City: An Urban Planning Exercise Students learn the process of planning a community, while reinforcing their writing and speaking skills.
 Create A City: An Urban Planning Exercise Students learn the process of planning a community, while reinforcing their writing and speaking skills. Author Gale Ekiss Grade Level 4-8 Duration 3 class periods
Contents. Foreword... 5
 Contents Foreword... 5 Chapter 1: Addition Within 0-10 Introduction... 6 Two Groups and a Total... 10 Learn Symbols + and =... 13 Addition Practice... 15 Which is More?... 17 Missing Items... 19 Sums with
Planning for Preassessment. Kathy Paul Johnston CSD Johnston, Iowa
 Planning for Preassessment Kathy Paul Johnston CSD Johnston, Iowa Why Plan? Establishes the starting point for learning Students can t learn what they already know Match instructional strategies to individual
THE PENNSYLVANIA STATE UNIVERSITY SCHREYER HONORS COLLEGE DEPARTMENT OF MATHEMATICS ASSESSING THE EFFECTIVENESS OF MULTIPLE CHOICE MATH TESTS
 THE PENNSYLVANIA STATE UNIVERSITY SCHREYER HONORS COLLEGE DEPARTMENT OF MATHEMATICS ASSESSING THE EFFECTIVENESS OF MULTIPLE CHOICE MATH TESTS ELIZABETH ANNE SOMERS Spring 2011 A thesis submitted in partial
Plainfield Public School District Reading/3 rd Grade Curriculum Guide. Modifications/ Extensions (How will I differentiate?)
") Grade level: 3 rd Grade Content: Reading NJCCCS: STANDARD 3.1Reading All students will understand and apply the knowledge of sounds, letters,and words in written english to become independent and fluent
Grade level: 3 rd Grade Content: Reading NJCCCS: STANDARD 3.1Reading All students will understand and apply the knowledge of sounds, letters,and words in written english to become independent and fluent
Office Hours: Mon & Fri 10:00-12:00. Course Description
 1 State University of New York at Buffalo INTRODUCTION TO STATISTICS PSC 408 4 credits (3 credits lecture, 1 credit lab) Fall 2016 M/W/F 1:00-1:50 O Brian 112 Lecture Dr. Michelle Benson mbenson2@buffalo.edu
Physics 270: Experimental Physics
 2017 edition Lab Manual Physics 270 3 Physics 270: Experimental Physics Lecture: Lab: Instructor: Office: Email: Tuesdays, 2 3:50 PM Thursdays, 2 4:50 PM Dr. Uttam Manna 313C Moulton Hall umanna@ilstu.edu
Prentice Hall Literature: Timeless Voices, Timeless Themes, Platinum 2000 Correlated to Nebraska Reading/Writing Standards (Grade 10)
") Prentice Hall Literature: Timeless Voices, Timeless Themes, Platinum 2000 Nebraska Reading/Writing Standards (Grade 10) 12.1 Reading The standards for grade 1 presume that basic skills in reading have
Prentice Hall Literature: Timeless Voices, Timeless Themes, Platinum 2000 Nebraska Reading/Writing Standards (Grade 10) 12.1 Reading The standards for grade 1 presume that basic skills in reading have
Sul Ross State University Spring Syllabus for ED 6315 Design and Implementation of Curriculum
 Sul Ross State University Spring 2017 Syllabus for ED 6315 Design and Implementation of Curriculum Instructor: Rebecca Schlosser, J.D., Ed.D. Office Hours via Blackboard Instant Messaging: Mon, Tues, Wedn,
The following shows how place value and money are related. ones tenths hundredths thousandths
 2-1 The following shows how place value and money are related. ones tenths hundredths thousandths (dollars) (dimes) (pennies) (tenths of a penny) Write each fraction as a decimal and then say it. 1. 349
Secondary English-Language Arts
 Secondary English-Language Arts Assessment Handbook January 2013 edtpa_secela_01 edtpa stems from a twenty-five-year history of developing performance-based assessments of teaching quality and effectiveness.
Mathematics Scoring Guide for Sample Test 2005
 Mathematics Scoring Guide for Sample Test 2005 Grade 4 Contents Strand and Performance Indicator Map with Answer Key...................... 2 Holistic Rubrics.......................................................
TASK 2: INSTRUCTION COMMENTARY
 TASK 2: INSTRUCTION COMMENTARY Respond to the prompts below (no more than 7 single-spaced pages, including prompts) by typing your responses within the brackets following each prompt. Do not delete or
*Lesson will begin on Friday; Stations will begin on the following Wednesday*
 UDL Lesson Plan Template Instructor: Josh Karr Learning Domain: Algebra II/Geometry Grade: 10 th Lesson Objective/s: Students will learn to apply the concepts of transformations to an algebraic context
Paper Reference. Edexcel GCSE Mathematics (Linear) 1380 Paper 1 (Non-Calculator) Foundation Tier. Monday 6 June 2011 Afternoon Time: 1 hour 30 minutes
 1380 Paper 1 (Non-Calculator) Foundation Tier. Monday 6 June 2011 Afternoon Time: 1 hour 30 minutes") Centre No. Candidate No. Paper Reference 1 3 8 0 1 F Paper Reference(s) 1380/1F Edexcel GCSE Mathematics (Linear) 1380 Paper 1 (Non-Calculator) Foundation Tier Monday 6 June 2011 Afternoon Time: 1 hour
Centre No. Candidate No. Paper Reference 1 3 8 0 1 F Paper Reference(s) 1380/1F Edexcel GCSE Mathematics (Linear) 1380 Paper 1 (Non-Calculator) Foundation Tier Monday 6 June 2011 Afternoon Time: 1 hour
Technical Manual Supplement
 VERSION 1.0 Technical Manual Supplement The ACT Contents Preface....................................................................... iii Introduction....................................................................
success. It will place emphasis on:
 1 First administered in 1926, the SAT was created to democratize access to higher education for all students. Today the SAT serves as both a measure of students college readiness and as a valid and reliable
UNIT 3: Research & Methodology
 One Stop Shop For Educators The following instructional plan is part of a GaDOE collection of Unit Frameworks, Performance Tasks, examples of Student Work, and Teacher Commentary. UNIT 3: Research & Methodology
(I couldn t find a Smartie Book) NEW Grade 5/6 Mathematics: (Number, Statistics and Probability) Title Smartie Mathematics
 NEW Grade 5/6 Mathematics: (Number, Statistics and Probability) Title Smartie Mathematics") (I couldn t find a Smartie Book) NEW Grade 5/6 Mathematics: (Number, Statistics and Probability) Title Smartie Mathematics Lesson/ Unit Description Questions: How many Smarties are in a box? Is it the
(I couldn t find a Smartie Book) NEW Grade 5/6 Mathematics: (Number, Statistics and Probability) Title Smartie Mathematics Lesson/ Unit Description Questions: How many Smarties are in a box? Is it the
November 2012 MUET (800)
") November 2012 MUET (800) OVERALL PERFORMANCE A total of 75 589 candidates took the November 2012 MUET. The performance of candidates for each paper, 800/1 Listening, 800/2 Speaking, 800/3 Reading and 800/4
November 2012 MUET (800) OVERALL PERFORMANCE A total of 75 589 candidates took the November 2012 MUET. The performance of candidates for each paper, 800/1 Listening, 800/2 Speaking, 800/3 Reading and 800/4
BENCHMARK MA.8.A.6.1. Reporting Category
 Grade MA..A.. Reporting Category BENCHMARK MA..A.. Number and Operations Standard Supporting Idea Number and Operations Benchmark MA..A.. Use exponents and scientific notation to write large and small
Edexcel GCSE. Statistics 1389 Paper 1H. June Mark Scheme. Statistics Edexcel GCSE
 Edexcel GCSE Statistics 1389 Paper 1H June 2007 Mark Scheme Edexcel GCSE Statistics 1389 NOTES ON MARKING PRINCIPLES 1 Types of mark M marks: method marks A marks: accuracy marks B marks: unconditional
VOL. 3, NO. 5, May 2012 ISSN Journal of Emerging Trends in Computing and Information Sciences CIS Journal. All rights reserved.
 Exploratory Study on Factors that Impact / Influence Success and failure of Students in the Foundation Computer Studies Course at the National University of Samoa 1 2 Elisapeta Mauai, Edna Temese 1 Computing
Mathematics. Mathematics
 Mathematics Program Description Successful completion of this major will assure competence in mathematics through differential and integral calculus, providing an adequate background for employment in
PAGE(S) WHERE TAUGHT If sub mission ins not a book, cite appropriate location(s))
 WHERE TAUGHT If sub mission ins not a book, cite appropriate location(s))") Ohio Academic Content Standards Grade Level Indicators (Grade 11) A. ACQUISITION OF VOCABULARY Students acquire vocabulary through exposure to language-rich situations, such as reading books and other
Ohio Academic Content Standards Grade Level Indicators (Grade 11) A. ACQUISITION OF VOCABULARY Students acquire vocabulary through exposure to language-rich situations, such as reading books and other
Syllabus ENGR 190 Introductory Calculus (QR)
") Syllabus ENGR 190 Introductory Calculus (QR) Catalog Data: ENGR 190 Introductory Calculus (4 credit hours). Note: This course may not be used for credit toward the J.B. Speed School of Engineering B. S.
Syllabus ENGR 190 Introductory Calculus (QR) Catalog Data: ENGR 190 Introductory Calculus (4 credit hours). Note: This course may not be used for credit toward the J.B. Speed School of Engineering B. S.
State University of New York at Buffalo INTRODUCTION TO STATISTICS PSC 408 Fall 2015 M,W,F 1-1:50 NSC 210
 1 State University of New York at Buffalo INTRODUCTION TO STATISTICS PSC 408 Fall 2015 M,W,F 1-1:50 NSC 210 Dr. Michelle Benson mbenson2@buffalo.edu Office: 513 Park Hall Office Hours: Mon & Fri 10:30-12:30
Teaching a Laboratory Section
 Chapter 3 Teaching a Laboratory Section Page I. Cooperative Problem Solving Labs in Operation 57 II. Grading the Labs 75 III. Overview of Teaching a Lab Session 79 IV. Outline for Teaching a Lab Session
Analysis of Enzyme Kinetic Data
 Analysis of Enzyme Kinetic Data To Marilú Analysis of Enzyme Kinetic Data ATHEL CORNISH-BOWDEN Directeur de Recherche Émérite, Centre National de la Recherche Scientifique, Marseilles OXFORD UNIVERSITY
Broward County Public Schools G rade 6 FSA Warm-Ups
 Day 1 1. A florist has 40 tulips, 32 roses, 60 daises, and 50 petunias. Draw a line from each comparison to match it to the correct ratio. A. tulips to roses B. daises to petunias C. roses to tulips D.
LA LETTRE DE LA DIRECTRICE
 LE GRIOT John Hanson French Immersion School 6360 Oxon Hill Road Oxon Hill, MD 20745 301-749-4780 Dr. Lysianne Essama, Principal MARCH 2008 Le compte à rebours a commencé: Le MSA est là. It does not matter
learning collegiate assessment]
![learning collegiate assessment]](/thumbs/71/66063392.jpg "learning collegiate assessment]") [ collegiate learning assessment] INSTITUTIONAL REPORT 2005 2006 Kalamazoo College council for aid to education 215 lexington avenue floor 21 new york new york 10016-6023 p 212.217.0700 f 212.661.9766
[ collegiate learning assessment] INSTITUTIONAL REPORT 2005 2006 Kalamazoo College council for aid to education 215 lexington avenue floor 21 new york new york 10016-6023 p 212.217.0700 f 212.661.9766
PRIMARY ASSESSMENT GRIDS FOR STAFFORDSHIRE MATHEMATICS GRIDS. Inspiring Futures
 PRIMARY ASSESSMENT GRIDS FOR STAFFORDSHIRE MATHEMATICS GRIDS Inspiring Futures ASSESSMENT WITHOUT LEVELS The Entrust Mathematics Assessment Without Levels documentation has been developed by a group of
Montana Content Standards for Mathematics Grade 3. Montana Content Standards for Mathematical Practices and Mathematics Content Adopted November 2011
 Montana Content Standards for Mathematics Grade 3 Montana Content Standards for Mathematical Practices and Mathematics Content Adopted November 2011 Contents Standards for Mathematical Practice: Grade
Facing our Fears: Reading and Writing about Characters in Literary Text
 Facing our Fears: Reading and Writing about Characters in Literary Text by Barbara Goggans Students in 6th grade have been reading and analyzing characters in short stories such as "The Ravine," by Graham
Janine Williams, Mary Rose Landon
 TI-nspire Activity Janine Williams, Mary Rose Landon Course Level: Advanced Algebra, Precalculus Time Frame: 2-3 regular (45 min.) class sessions Objectives: Students will... 1. Explore the Unit Circle,