Technical Manual Supplement
|
|
|
- Lindsay McDowell
- 6 years ago
- Views:
Transcription

1 VERSION 1.0 Technical Manual Supplement The ACT
2 Contents Preface iii Introduction iv 1. ACT Test Reporting Categories and Blueprints English Test English Reporting Categories English Test Blueprints Mathematics Test Mathematics Reporting Categories Mathematics Test Blueprints Reading Test Reading Reporting Categories Reading Test Blueprints Science Test Science Reporting Categories Science Test Blueprints Writing Test Writing Scores and Domains Writing Scoring Rubric Writing Field Tests, Prompt Selection, and Comparability of the Overall Writing Scores Scaling and Equating of the Writing Scores for ELA Calculation Writing Reliability and Standard Error of Measurement Additional Scores and Indicators STEM and ELA Scores Understanding Complex Texts Progress Toward the ACT National Career Readiness Certificate Interest-Major Fit Student, High School, and College Reports Student Report High School Report College Report Online Testing and Mode Comparability ACT Online Test Administration Online Platform and Capabilities Comparability of Scores from Online and Paper Testing Fall 2013 Timing Study Spring 2014 and Spring 2015 Mode Comparability Studies References i
3 Tables Table 1.1. Reliability and Standard Error of Measurement Summary Statistics of the ACT Tests Reporting Category Scores Table 1.2. Specification Ranges by Item Type and Reporting Category for English Table 1.3. Specification Ranges by Item Type and Reporting Category for Mathematics Table 1.4. Specification Ranges by Item Type and Reporting Category for Reading Table 1.5. Specification Ranges by Item Type and Reporting Category for Science Table 1.6. Writing Test Analytic Scoring Rubric Table 2.1. Scale Score Summary Statistics of the ACT Test Scores for Five of the National ACT Administrations Table 2.2. Scale Score Reliability and Standard Error of Measurement Summary Statistics for Five of the National ACT Administrations Table 2.3. Composite Score Ranges for the ACT NCRC Levels Figures Figure 1.1. Detailed Results example from the ACT score report Figure 1.2. Average and fitted CSEMs for writing scores Figure 2.1. Conditional standard errors of measurement of the STEM scores for five of the forms used in national ACT administrations Figure 2.2. Conditional standard errors of measurement of the ELA scores for five of the forms used in national ACT administrations Figure 2.3. Probability of persisting in a STEM major at years 2, 3, and 4 by ACT STEM score at a typical four-year institution Figure ACT sample student report Figure ACT sample high school report Figure ACT sample college report ii
4 Preface This supplement contains technical information about updates to the ACT. It is intended to accompany the ACT Technical Manual as the two together represent comprehensive documentation of the technical characteristics of the ACT in light of its intended purposes. ACT regularly conducts research as part of the ongoing evaluation of its programs. The research is intended to ensure that the programs remain technically sound. ACT endorses and is committed to industry standards and criteria. ACT endorses and is committed to complying with the Standards for Educational and Psychological Testing (AERA, APA, & NCME, 2014). ACT also endorses the Code of Fair Testing Practices in Education (Joint Committee on Testing Practices, 2004), which is a statement of the obligations to test takers of those who develop, administer, or use educational tests and test data in the following four areas: developing and selecting appropriate tests, administering and scoring tests, reporting and interpreting test results, and informing test takers. ACT endorses and is committed to complying with the Code of Professional Responsibilities in Educational Measurement (NCME Ad Hoc Committee on the Development of a Code of Ethics, 1995), which is a statement of professional responsibilities for those involved with various aspects of assessments, including development, marketing, interpretation, and use. We encourage individuals who want more detailed information on a topic discussed in this manual, or on a related topic, to contact ACT. Please direct comments or inquiries to the address below: Research Services ACT, Inc. 500 ACT Drive Iowa City, Iowa by ACT, Inc. All rights reserved. OPS1245 iii
5 Introduction Starting in the fall of 2015, ACT began implementing a series of updates to the ACT tests, including changes to the ACT writing test, reporting of new scores, inclusion of an online testing option for state and district testing, and enhancements to the student, high school, and college score reports. These updates are presented in this supplement to the ACT Technical Manual. Prior to September 2015, scale scores from the four multiple-choice tests, composite scores, subscores, writing scores, and combined English/writing scores were reported to students. In September 2015, ACT began reporting Science, Technology, Engineering, and Mathematics (STEM) and English Language Arts (ELA) scores in addition to the four multiple-choice test scale scores and Composite scores. Understanding Complex Texts and Progress Toward the ACT National Career Readiness Certificate indicators were also first reported to students in Changes were made to the ACT writing test beginning in the academic year, including the adoption of analytic scoring for essays and reporting of four new writing domain scores. Beginning in September 2016, ACT is reporting the overall ACT writing test score as the average of the four domain scores. In addition, reporting category scores and ACT Readiness Ranges replace subscores, and score reports are redesigned to allow students and educators to better navigate results and gain more meaningful insights. This document provides information about the reporting categories, changes in the writing test, and other newly reported scores, followed by a detailed introduction of the redesigned score reports. Studies supporting the comparability of scores from online and paper testing are also described. iv
6 CHAPTER 1 ACT Test Reporting Categories and Blueprints Since fall 2015, score reports have contained readiness scores and indicators designed to show performance and preparedness in areas important to success after high school. For students to gain insights into possible directions for college and career, they need to understand their areas of strength and also those areas where they need to improve. Starting in the academic year, the addition of ACT reporting categories and ACT Readiness Ranges are important enhancements to the ACT score reports. The new score reports incorporate a comprehensive set of reporting categories for each subject area of the test (see Figure 1.1 below). Reporting categories group and report on similar skills to provide students with more detailed information within each subject. The new reporting category scores replace the subscores (e.g., Intermediate Algebra/Coordinate Geometry) that were previously reported. ACT reporting categories are aligned with ACT College and Career Readiness Standards and other standards that target college and career readiness. There are three reporting categories each for English, reading, and science and eight for mathematics. The number of items for a particular reporting category can vary across different test forms. Because these scores are raw scores, they are not directly comparable across different test forms. For each reporting category, the score report shows the total number of points possible, the number of correct responses, the percent of correct responses, and the ACT Readiness Range. Also, the blueprint tables for each subject test include information about the Depth of Knowledge (DOK) levels assessed across items. DOK levels reflect the complexity of the cognitive process required to solve the item, not the psychometric difficulty of the item. Unlike other DOK interpretations, ACT only assigns a DOK level 4 value to describe multiday, potentially collaborative classroom activities and assessments designed for learning purposes. By this definition, DOK assignments on any summative assessment (including the ACT) are limited to values from 1 to

7 ACT TEST REPORTING CATEGORIES AND BLUEPRINTS The ACT Readiness Ranges enable students to see at a glance how their performance on each reporting category compares to students who have met the ACT College Readiness Benchmark for that specific subject. For each reporting category, the ACT Readiness Range was calculated by regressing the percentage of points achieved on students scale scores for the corresponding subject. The minimum value of the range is the point that corresponds to the predicted percentage of points that would be achieved by a student whose score is at the ACT College Readiness Benchmark on the overall subject test. The maximum value of the range corresponds to answering all questions in that reporting category correctly. The ACT Readiness Ranges appear on the Student Score Report and the High School Score Report. The combination of reporting category scores and the ACT Readiness Ranges provides educators and students with information to more clearly show which areas require the most assistance for additional learning and intervention. Figure 1.1. Detailed Results example from the ACT score report. Reliability and Standard Error of Measurement (SEM) The reliability (coefficient alpha) and SEM for the reporting category number correct scores are shown in Table 1.1. Data were compiled from 12 forms administered in For some of the reporting categories, particularly those with very few items, the reliability is low. However, reporting category scores are not intended for high stakes decisions. They are intended to guide instruction and help identify students strengths and weaknesses. For more information on the interpretation of the reporting categories, see Powers, Li, Suh, and Harris (2016). 1.2
8 ACT TEST REPORTING CATEGORIES AND BLUEPRINTS Table 1.1. Reliability and SEM* Summary Statistics of the ACT Tests Reporting Category Scores Reliability SEM Test/Reporting Categories Median # of Items Median Minimum Maximum Median Minimum Maximum English Production of Writing Knowledge of Language Conventions of Standard English Mathematics Preparing for Higher Math Number & Quantity Algebra Functions Geometry Statistics & Probability Integrating Essential Skills Modeling Reading Key Ideas & Details Craft & Structure Integration of Knowledge & Ideas Science Interpretation of Data Scientific Investigation Evaluation of Models, Inferences & Experimental Results *Standard error of measurement 1.3
9 ACT TEST REPORTING CATEGORIES AND BLUEPRINTS 1.1. English Test English Reporting Categories Four scores are reported for the ACT English test: a total test score based on all 75 questions and three reporting category scores. The three reporting categories associated with the English test are Production of Writing, Knowledge of Language, and Conventions of Standard English. These reporting categories are subdivided into six elements, each of which targets an aspect of effective writing. A brief description of the reporting categories is provided below, and the approximate percentage of the test items in each reporting category are given in Table 1.2. In addition, the overall English test score, along with the reading and writing test scores, is used to determine the ELA score. Production of Writing Students apply their understanding of the rhetorical purpose and focus of a piece of writing to develop a topic effectively and use various strategies to achieve logical organization, topical unity, and general cohesion. Topic Development: Students demonstrate an understanding of, and control over, the rhetorical aspects of texts by identifying the purposes of parts of texts, determining whether a text or part of a text has met its intended goal, and evaluating the relevance of material in terms of a text s focus. Organization, Unity, and Cohesion: Students use various strategies to ensure that a text is logically organized, flows smoothly, and has an effective introduction and conclusion. Knowledge of Language Students demonstrate effective language use through ensuring precision and concision in word choice and maintaining consistency in style and tone. Conventions of Standard English Students apply an understanding of the conventions of Standard English grammar, usage, and mechanics to revise and edit text. Sentence Structure and Formation: Students apply an understanding of relationships between and among clauses, placement of modifiers, and shifts in sentence construction. Usage: Students edit text to conform to Standard English usage. Punctuation: Students edit text to conform to Standard English punctuation. 1.4
10 ACT TEST REPORTING CATEGORIES AND BLUEPRINTS English Test Blueprints Table 1.2. Specification Ranges by Item Type and Reporting Category for English Number of Items Percentage of Test Reporting Categories Production of Writing % Knowledge of Language % Conventions of Standard English % Depth of Knowledge (DOK) DOK Level % DOK Level % DOK Level % Total Number of Items % 1.2. Mathematics Test Mathematics Reporting Categories Nine scores are reported for the ACT mathematics test: a total test score based on all 60 questions and eight reporting category scores. The eight reporting categories addressed in the mathematics test are Preparing for Higher Math, which includes separate scores for Number & Quantity, Algebra, Functions, Geometry, and Statistics & Probability; Integrating Essential Skills; and Modeling. A description and the approximate percentage of the test devoted to each reporting category are given in Table 1.3. The overall score on the mathematics test is also used, with the science score, to determine the STEM score. Preparing for Higher Math This reporting category captures the more recent mathematics that students are learning, starting when students begin using algebra as a general way of expressing and solving equations. This category is divided into the following five subcategories. Number & Quantity Coming into high school, students have some knowledge of the real number system. Because they have an understanding of and fluency with rational numbers and the four basic operations, they can work with irrational numbers by manipulating rational numbers that are close. Students are ready to move from integer exponents to rational exponents and are also ready to probe deeper into properties of the real number system. Students extend their knowledge to include complex numbers, which offer the solutions to some simple equations that have no real-number solutions, and students learn to compute in this system. Students go further, exploring properties of complex numbers again, learning more about real numbers. Students explore vectors and matrices and view them as number systems with properties, operations, and applications. 1.5
11 ACT TEST REPORTING CATEGORIES AND BLUEPRINTS Throughout high school, students are maturing in their understanding of quantity and its connections to measurement. Attending to the types of quantities and units can guide solution strategies and help avoid errors. Students work with derived quantities, and when modeling, they choose appropriate quantities to model. Algebra Students coming into high school build on their understanding of linear equations to make sense of other kinds of equations and inequalities: what their graphs look like, how to solve them, and what kinds of applications they have for modeling. They continue to make sense of expressions in terms of their parts in order to use their fluency strategically and to solve problems. Through repeated reasoning, students develop a general understanding of solving equations as a process that provides justification that all the solutions will be found. Students extend their proficiency to equations such as quadratic, polynomial, rational, radical, and systems, integrating an understanding of solutions in terms of graphs. Families of equations have properties that make them useful for modeling. Polynomials form a system analogous to adding, subtracting, and multiplying integers; solutions of polynomial equations are related to factors of a polynomial. Students recognize these relationships in applications and create expressions, equations, and inequalities to represent problems and constraints. Students see rational expressions as a system analogous to rational numbers, apply the binomial theorem, and solve simple matrix equations that represent systems of linear equations. Functions Functions have been with students since their early years: consider the counting function that takes an input of seven and gives eight and an input of twelve to give thirteen. Understanding general properties of functions will equip students for problem solving with new functions they create over their continued studies and careers. Functions provide a framework for modeling real-world phenomena, and students become adept at interpreting the characteristics of functions in the context of a problem and become attuned to differences between a model and reality. Some functions accept all numbers as inputs, but many accept only some numbers. Function notation gives another way to express functions that highlights properties and behaviors. Students work with functions that have no equation, functions that follow the pattern of an equation, and functions based on sequences, which can even be recursive. Students investigate particular families of functions like linear, quadratic, and exponential in terms of the general function framework: looking at rates of change, algebraic properties, and connections to graphs and tables, and applying these functions in modeling situations. Students also examine a range of functions like those defined in terms of square roots, cube roots, polynomials, exponentials, logarithms, and trigonometric relationships, and also piecewise-defined functions. Students see solving an equation in terms of an inverse function. Students have seen shifts in graphs due to parameter changes, but now they develop a unified understanding of translations and scaling through forms such as f(x c), f(x) + c, a f(x) and f( ax). Students connect the trigonometry of right triangles to the unit circle to make 1.6
12 ACT TEST REPORTING CATEGORIES AND BLUEPRINTS trigonometric functions, and they explore algebraic relationships among these functions. They use these functions to model periodic behavior. Students graph rational functions and learn about asymptotes. They compose functions in other ways besides translation and scaling, going deeper into how inverse functions apply to solving equations with more than one solution, in particular for trigonometric functions. They explore algebraic properties of trigonometric functions such as angle addition properties. Geometry In high school, students add depth to what they know about transformations, reflections, rotations, and dilations and add precision to their understanding of congruence, similarity, and symmetry. Students justify by using definitions and theorems, tying in calculations and diagrams, considering cases, understanding general versus specific statements, applying counterexamples, and putting statements together into coherent arguments. Students make constructions, solve problems, and model with geometric objects. Informal arguments give a chain of reasoning that leads to formulas for the area of a circle and then on to volume of cylinders, pyramids, and cones. Students understand trigonometric ratios as functions of the angle through the lens of similar triangles, and they solve right-triangle problems. All these results transfer to the coordinate plane, where analytic treatment of distance allows students to derive conditions for parallel and perpendicular lines, to split a line segment into pieces with a given ratio of lengths, to find areas, and to develop equations for circles and for parabolas that have a directrix parallel to an axis. Students go further into trigonometry, deriving a formula for the area of a general triangle in terms of side lengths and the sine of an angle, moving on to the law of sines and law of cosines, which give straightforward answers to questions about nonright triangles. Students derive equations for ellipses and hyperbolas. Students use Cavalieri's principle to justify formulas, such as the formula for volume of a sphere. Statistics & Probability In high school, students add to their understanding of distributions of a single quantity, describing center and spread with statistics and interpreting these in the context of the data. Students describe distance from the mean in standard-deviation units, and for distributions that look approximately normal, they approximate the probability of events using probabilities from the normal distribution. Before high school, students have used two-way tables and scatter plots to look at relationships between different quantities and have used linear functions to model relationships that look linear. Now students pay more attention to informal model fit and use other functions to model relationships; they use models for prediction, interpreting characteristics of the model in the context of the data, and interpreting the correlation coefficient for linear models. From two-way tables, students interpret relative probabilities (including joint, marginal, and conditional relative frequencies but not tied to these terms) and relate these to probabilities. Students look for association and distinguish correlation and causation. 1.7
13 ACT TEST REPORTING CATEGORIES AND BLUEPRINTS Students learn about the role of randomness in sample surveys, experiments, and observational studies. Students use data to estimate population mean or proportion and make informal inferences based on their maturing judgment of likelihood. They can compare qualities of research reports based on data and can use simulation data to make estimates and inform judgment. Before high school, students have tacitly used independence, but now the idea is developed with a precise definition. Students relate the sample space to events defined in terms of and, or, and not, and calculate probabilities, first using empirical results or independence assumptions, and later using the ideas of conditional probability. Students understand the multiplicative rule for conditional probability and study permutations and combinations as a tool for counting. Students model a sample space with a random variable by giving a numerical value to each event. Students apply expected value and probability to help inform decisions. Integrating Essential Skills Students learn some of the most useful mathematics before eighth grade: rates and percentages; proportional relationships; area, surface area, and volume; average and median; expressing numbers in different ways; using expressions to represent quantities and equations to capture relationships; and other topics. Each year, students should grow in what they can accomplish using learning from prior years. Students should be able to solve problems of increasing complexity, combine skills in longer chains of steps, apply skills in more varied contexts, understand more connections, and increase fluency. In order to assess whether students have had appropriate growth, questions in this reporting category are at a cognitive level of at least depth of knowledge level 2 for high school students, with a significant portion at depth of knowledge level 3. Modeling Modeling uses mathematics to represent with a model an analysis of an actual, empirical situation. Models often help us predict or understand the actual. However, sometimes knowledge of the actual helps us understand the model, such as when addition is introduced to students as a model of combining two groups. The Modeling reporting category represents all questions that involve producing, interpreting, understanding, evaluating, and improving models. Each modeling question is also counted in the other appropriate reporting categories above. Thus, the Modeling reporting category is an overall measure of how well a student uses modeling skills across mathematical topics. 1.8
14 ACT TEST REPORTING CATEGORIES AND BLUEPRINTS Mathematics Test Blueprints Table 1.3. Specification Ranges by Item Type and Reporting Category for Mathematics Number of Items Percentage of Test Reporting Categories Preparing for Higher Math % Number & Quantity % Algebra % Functions % Geometry % Statistics & Probability % Integrating Essential Skills % Modeling 16 27% Depth of Knowledge (DOK) DOK Level Preparing for Higher Math % 1 Integrating Essential Skills 0% DOK Level Preparing for Higher Math % 2 Integrating Essential Skills % DOK Level 3 Preparing for Higher Math % Integrating Essential Skills % Total Number of Items % 1.3. Reading Test Reading Reporting Categories Five scores are reported for the ACT reading test: a total test score based on all 40 questions, three reporting category scores based on specific knowledge and skills, and an Understanding Complex Texts indicator. The three reporting categories addressed in the reading test are Key Ideas & Details, Craft & Structure, and Integration of Knowledge & Ideas. In addition, the overall reading test score, along with the English and writing test scores, is used to determine the ELA score. A description and the approximate percentage of the test devoted to each reporting category are given in Table 1.4. Key Ideas & Details Students read texts closely to determine central ideas and themes; summarize information and ideas accurately; and read closely to understand relationships and draw logical inferences and conclusions, including understanding sequential, comparative, and cause-effect relationships. Craft & Structure Students determine word and phrase meanings, analyze an author s word choice rhetorically, analyze text structure, understand authorial purpose and perspective, and analyze characters points of view. They interpret authorial decisions rhetorically and differentiate between various perspectives and sources of information. 1.9
15 ACT TEST REPORTING CATEGORIES AND BLUEPRINTS Integration of Knowledge & Ideas Students understand authors claims, differentiate between facts and opinions, and use evidence to make connections between different texts that are related by topic. Some questions will require students to analyze how authors construct arguments, evaluating reasoning and evidence from various sources Reading Test Blueprints Table 1.4. Specification Ranges by Item Type and Reporting Category for Reading Number of Items Percentage of Test Reporting Categories Key Ideas & Details % Craft & Structure % Integration of Knowledge & Ideas % Depth of Knowledge (DOK) DOK Level % DOK Level % DOK Level % Total Number of Items % 1.4. Science Test Science Reporting Categories Four scores are reported for the ACT science test: a total test score based on all 40 questions and three reporting category scores based on scientific knowledge, skills, and practices. The three reporting categories addressed in the science test are Interpretation of Data; Scientific Investigation; and Evaluation of Models, Inferences & Experimental Results. A description and the approximate percentage of the test devoted to each reporting category are given in Table 1.5. The overall score on the science test is also used, with the math score, to determine the STEM score. Interpretation of Data Students manipulate and analyze scientific data presented in tables, graphs, and diagrams (e.g., recognize trends in data, translate tabular data into graphs, interpolate and extrapolate, and reason mathematically). Scientific Investigation Students understand experimental tools, procedures, and design (e.g., identify variables and controls) and compare, extend, and modify experiments (e.g., predict the results of additional trials). Evaluation of Models, Inferences & Experimental Results 1.10
16 ACT TEST REPORTING CATEGORIES AND BLUEPRINTS Students judge the validity of scientific information and formulate conclusions and predictions based on that information (e.g., determine which explanation for a scientific phenomenon is supported by new findings) Science Test Blueprints Table 1.5. Specification Ranges by Item Type and Reporting Category for Science Number of Items Percentage of Test Reporting Categories Interpretation of Data % Scientific Investigation % Evaluation of Models, Inferences & Experimental Results % Depth of Knowledge (DOK) DOK Level % DOK Level % DOK Level % Total Number of Items % 1.5. Writing Test The ACT writing test is a 40-minute essay test that measures students writing skills specifically those skills emphasized in high school English classes and in entry-level college composition courses. The information from the writing test tells postsecondary institutions about students ability to think critically about an issue, consider different perspectives on it, and compose an effective argumentative essay in a timed condition. An image of the essay will be available to the student s high school and the colleges selected for score reporting. The writing test underwent a number of enhancements that became operational in September The enhanced test consists of one writing prompt that describes a complex issue and presents three different perspectives on that issue. Students are asked to read the prompt and write an essay in which they develop their own perspective on the issue. The essay must analyze the relationship between their own perspective and one or more other perspectives. Students may adopt one of the perspectives given in the prompt as their own, or they may introduce one that is completely different from those given. Their score will not be affected by the point of view they take on the issue. 1.11
17 ACT TEST REPORTING CATEGORIES AND BLUEPRINTS Writing Scores and Domains Students who take the optional writing test receive a total of five scores: a single subject-level writing score reported on a range of and four domain scores, also 2 12, that are based on an analytic scoring rubric. The subject-level score is the rounded average of the four domain scores. Taking the writing test does not affect the student s subject area scores or Composite score. However, a writing test score, along with the overall English and reading test scores are needed to report an ELA score. The four writing test domain scores addressed in the writing test are Ideas & Analysis, Development & Support, Organization, and Language Use & Conventions. Two trained readers score each essay on a scale from 1 6 in each of the four domains. Each domain score represents the sum of the two readers scores using the analytic rubric in Table 1.6. If the readers ratings disagree by more than one point, a third reader evaluates the essay and resolves the discrepancy. Ideas & Analysis Scores in this domain reflect the ability to generate productive ideas and engage critically with multiple perspectives on the given issue. Competent writers understand the issue they are invited to address, the purpose for writing, and the audience. They generate ideas that are relevant to the situation. Development & Support Scores in this domain reflect the ability to discuss ideas, offer rationale, and strengthen an argument. Competent writers explain and explore their ideas, discuss implications, and illustrate through examples. They help the reader understand their thinking about the issue. Organization Scores in this domain reflect the ability to organize ideas with clarity and purpose. Organizational choices are integral to effective writing. Competent writers arrange their essay in a way that clearly shows the relationship between ideas, and they guide the reader through their discussion. Language Use & Conventions Scores in this domain reflect the ability to use written language to clearly convey ideas. Competent writers make use of the conventions of grammar, syntax, word usage, and mechanics. They are also aware of their audience and adjust the style and tone of their writing to communicate effectively. 1 Students who took the writing test from September 2015 to June 2016 received a subject-level writing score reported on a 1 36 scale and not the 2 12 subject-level score that is currently reported. It should also be noted that the current 2 12 subject-level writing score is not the same as the 2 12 score from the former writing test (June 2015 and before). Although both tests measure a student s ability to write an effective argumentative essay, the current test has a new design. The current test is also scored with an analytic rubric, whereas the former writing test was scored with a holistic six-point rubric. The score on the former test was the sum of the two raters (1 6) scores rather than the rounded average of four (2 12) domain scores. 1.12
18 ACT TEST REPORTING CATEGORIES AND BLUEPRINTS Writing Scoring Rubric Table 1.6. Writing Test Analytic Scoring Rubric Ideas and Analysis Development and Support Organization Language Use Score 6: Responses at this scorepoint demonstrate effective skill in writing an argumentative essay. Score 5: Responses at this scorepoint demonstrate well-developed skill in writing an argumentative essay. Score 4: Responses at this scorepoint demonstrate adequate skill in writing an argumentative essay. The writer generates an argument that critically engages with multiple perspectives on the given issue. The argument s thesis reflects nuance and precision in thought and purpose. The argument establishes and employs an insightful context for analysis of the issue and its perspectives. The analysis examines implications, complexities and tensions, and/or underlying values and assumptions. The writer generates an argument that productively engages with multiple perspectives on the given issue. The argument s thesis reflects precision in thought and purpose. The argument establishes and employs a thoughtful context for analysis of the issue and its perspectives. The analysis addresses implications, complexities and tensions, and/or underlying values and assumptions. The writer generates an argument that engages with multiple perspectives on the given issue. The argument s thesis reflects clarity in thought and purpose. The argument establishes and employs a relevant context for analysis of the issue and its perspectives. The analysis recognizes implications, complexities and tensions, and/or underlying values and assumptions. Development of ideas and support for claims deepen insight and broaden context. An integrated line of skillful reasoning and illustration effectively conveys the significance of the argument. Qualifications and complications enrich and bolster ideas and analysis. Development of ideas and support for claims deepen understanding. A mostly integrated line of purposeful reasoning and illustration capably conveys the significance of the argument. Qualifications and complications enrich ideas and analysis. Development of ideas and support for claims clarify meaning and purpose. Lines of clear reasoning and illustration adequately convey the significance of the argument. Qualifications and complications extend ideas and analysis. The response exhibits a skillful organizational strategy. The response is unified by a controlling idea or purpose, and a logical progression of ideas increases the effectiveness of the writer s argument. Transitions between and within paragraphs strengthen the relationships among ideas. The response exhibits a productive organizational strategy. The response is mostly unified by a controlling idea or purpose, and a logical sequencing of ideas contributes to the effectiveness of the argument. Transitions between and within paragraphs consistently clarify the relationships among ideas. The response exhibits a clear organizational strategy. The overall shape of the response reflects an emergent controlling idea or purpose. Ideas are logically grouped and sequenced. Transitions between and within paragraphs clarify the relationships among ideas. The use of language enhances the argument. Word choice is skillful and precise. Sentence structures are consistently varied and clear. Stylistic and register choices, including voice and tone, are strategic and effective. While a few minor errors in grammar, usage, and mechanics may be present, they do not impede understanding. The use of language works in service of the argument. Word choice is precise. Sentence structures are clear and varied often. Stylistic and register choices, including voice and tone, are purposeful and productive. While minor errors in grammar, usage, and mechanics may be present, they do not impede understanding. The use of language conveys the argument with clarity. Word choice is adequate and sometimes precise. Sentence structures are clear and demonstrate some variety. Stylistic and register choices, including voice and tone, are appropriate for the rhetorical purpose. While errors in grammar, usage, and mechanics are present, they rarely impede understanding. 1.13
19 ACT TEST REPORTING CATEGORIES AND BLUEPRINTS Score 3: Responses at this scorepoint demonstrate some developing skill in writing an argumentative essay. Score 2: Responses at this scorepoint demonstrate weak or inconsistent skill in writing an argumentative essay. Score 1: Responses at this scorepoint demonstrate little or no skill in writing an argumentative essay. Ideas and Analysis The writer generates an argument that responds to multiple perspectives on the given issue. The argument s thesis reflects some clarity in thought and purpose. The argument establishes a limited or tangential context for analysis of the issue and its perspectives. Analysis is simplistic or somewhat unclear. The writer generates an argument that weakly responds to multiple perspectives on the given issue. The argument s thesis, if evident, reflects little clarity in thought and purpose. Attempts at analysis are incomplete, largely irrelevant, or consist primarily of restatement of the issue and its perspectives. The writer fails to generate an argument that responds intelligibly to the task. The writer s intentions are difficult to discern. Attempts at analysis are unclear or irrelevant. Development and Support Development of ideas and support for claims are mostly relevant but are overly general or simplistic. Reasoning and illustration largely clarify the argument but may be somewhat repetitious or imprecise. Development of ideas and support for claims are weak, confused, or disjointed. Reasoning and illustration are inadequate, illogical, or circular, and fail to fully clarify the argument. Ideas lack development, and claims lack support. Reasoning and illustration are unclear, incoherent, or largely absent. Organization The response exhibits a basic organizational structure. The response largely coheres, with most ideas logically grouped. Transitions between and within paragraphs sometimes clarify the relationships among ideas. The response exhibits a rudimentary organizational structure. Grouping of ideas is inconsistent and often unclear. Transitions between and within paragraphs are misleading or poorly formed. The response does not exhibit an organizational structure. There is little grouping of ideas. When present, transitional devices fail to connect ideas. Language Use The use of language is basic and only somewhat clear. Word choice is general and occasionally imprecise. Sentence structures are usually clear but show little variety. Stylistic and register choices, including voice and tone, are not always appropriate for the rhetorical purpose. Distracting errors in grammar, usage, and mechanics may be present, but they generally do not impede understanding. The use of language is inconsistent and often unclear. Word choice is rudimentary and frequently imprecise. Sentence structures are sometimes unclear. Stylistic and register choices, including voice and tone, are inconsistent and are not always appropriate for the rhetorical purpose. Distracting errors in grammar, usage, and mechanics are present, and they sometimes impede understanding. The use of language fails to demonstrate skill in responding to the task. Word choice is imprecise and often difficult to comprehend. Sentence structures are often unclear. Stylistic and register choices are difficult to identify. Errors in grammar, usage, and mechanics are pervasive and often impede understanding. 1.14
20 ACT TEST REPORTING CATEGORIES AND BLUEPRINTS Writing Field Tests, Prompt Selection, and Comparability of the Overall Writing Scores ACT conducts a special field test study each year to evaluate new potential ACT writing prompts to select those suitable for operational use. Prompts are evaluated from both content and statistical perspectives to ensure scores are comparable across different test forms and different administrations. In each field test study, anchor prompts and new prompts are administered to randomly equivalent groups of approximately 1,000 students per prompt. Each student takes two prompts, and the order in which the prompts are taken is counterbalanced. Prompts are spiraled within classrooms so that, across all participating students, randomly equivalent groups of students take each prompt with about half of the students taking the prompt first and the rest taking it second. To ensure the comparability of the 2 12 overall writing scores, prompts are selected for operational use if they perform similarly to the anchor prompts, meaning the distributions of 2 12 scores is similar across the prompts, using equating methodology. A similar procedure had been used to ensure the comparability of the ACT writing scores prior to fall Scaling and Equating of the Writing Scores for ELA Calculation The writing test also has a secondary score scale ranging from 1 to 36 that is combined with the ACT English and reading scores to provide an ELA score. The 1 36 writing scale was constructed based on data from the first special field test study of the enhanced writing prompts in fall After evaluating all prompts administered in the special study, one prompt was selected to be the base prompt to establish the 1 36 scale for writing. To obtain the base prompt raw-to-scale score conversion, percentile ranks of all raw score points (i.e., the sum of the four domain scores) were calculated. Then the corresponding z-scores from a standard normal distribution were obtained for these percentile ranks. The z-scores were then linearly transformed to cover the whole score range of Finally, a seven-degree polynomial regression of the unrounded scale scores on the raw scores was used to slightly smooth the conversion prior to rounding to integer scale scores to obtain the final raw-to-scale score conversion for the base form. Although prompts are selected to ensure to a large extent that the 2 12 overall writing scores are comparable no matter which prompt the student takes, that process does not ensure that these prompts are also strictly comparable on the sum of the domain scores (ranging from 8 to 48), which are converted to the 1 36 scores. Therefore equating methodology is used to adjust for slight differences in prompt difficulty that may still remain after the writing prompt selection process. The same methodology used for equating the multiple-choice ACT tests is used for equating each prompt to the 1 36 writing scale: equipercentile equating with postsmoothing under the randomly equivalent groups design. Consequently, students with the same English, reading, and writing 2 12 scores may have slightly different ELA scores if they took different writing prompts. This process ensures year-to-year comparability in the ELA scores that are based in part on the writing scores. The ELA score is intended to be a more reliable measure of student ability than the ACT writing prompt score, which is based on a student s response to a single prompt. 1.15
21 ACT TEST REPORTING CATEGORIES AND BLUEPRINTS Writing Reliability and Standard Error of Measurement To investigate the properties of the writing scores, a generalizability study was conducted in fall The study was separated into three different parts. Each part involved a different pair of schools. Within each pair of schools, two different writing prompts were used. The responses to both writing prompts were rated by three raters on the four different domains. The same raters rated both prompts for both schools. Different pairs of prompts and different groups of three raters were used for each pair of schools. This essentially served as three different replications of the same study design. A multivariate generalizability analysis was conducted for the domain scores based on a person by prompt by rater design. The estimated variance components for the interactions between both prompt and rater as well as person and rater were quite small across all three school pairs. The estimated variance components for the interaction between person and prompt were relatively large for all three pairs, however. This is consistent with results typically found in the literature. For the unrounded average of the domain scores, the generalizability coefficients (reliability-like estimates of score consistency) ranged from 0.61 to 0.77, which are fairly high for a writing assessment. Standard errors of measurement (SEMs) ranged from 0.84 to 1.1. To estimate the reliability and SEM for writing scores on the 1 36 scale, data from the 2014 writing field test study were used. Each student took two different prompts. The data were analyzed using a person by occasion generalizability theory design. The individual conditional error variances were fit with a quadratic polynomial. The square root of these fitted values is represented by the black curve in Figure 1.2. The average conditional standard error of measurement (CSEM) values, represented by the circles, were calculated by taking the square root of the average conditional error variances at each scale score point. The generalizability coefficient was 0.68 and the SEM was This SEM value was used in the calculation of the ELA reliabilities and SEMs. Based on the same data set and using the same methodology, the reliability and SEM for the writing 2-12 rounded average domain scores were estimated. The generalizability coefficient was 0.66 and the SEM was
22 ACT TEST REPORTING CATEGORIES AND BLUEPRINTS Figure 1.2. Average and fitted CSEMs for writing scores. 1.17
23 CHAPTER 2 Additional Scores and Indicators In September 2015, ACT began reporting Science, Technology, Engineering, and Mathematics (STEM) and English Language Arts (ELA) scores in addition to the four multiple-choice test scale scores and Composite scores. Understanding Complex Texts and Progress Toward the ACT National Career Readiness Certificate indicators were also first reported to students in This section presents information related to these scores and indicators STEM and ELA Scores The STEM score is the average of the mathematics and science scale scores rounded to the nearest integer (fractions of 0.5 or greater round up). The ELA score is the average of the 1 36 scale scores for English, reading, and writing. Only students who receive scores for all three tests receive an ELA score. The STEM and ELA scores both range from 1 to 36. Equating STEM and ELA scores are not directly equated across forms. Because they are the average of scores that are equated across forms, STEM and ELA scores are comparable across forms. The same is also true for Composite scores. Standard Error of Measurement and Reliability STEM and ELA CSEMs were calculated with the same approach that is used for the calculation of Composite score CSEMs (for further details, see the ACT Technical Manual, ACT, 2014). Assuming the measurement errors on the individual tests are independent, the CSEM of the unrounded STEM score is CSEM 2 i ( ) i i CSEM STEM ( m, s ), 2 where CSEM i( i) is the CSEM for test i at true scale score i, where i = m and s for mathematics and science, respectively. Similarly, for the unrounded ELA scores, the CSEM is CSEM 2 i ( ) i i CSEM ELA( e, r, w), 3 2.1
24 ADDITIONAL SCORES AND INDICATORS where i = e, r, and w for English, reading, and writing, respectively. For each multiple-choice test (English, mathematics, reading, and science), CSEMs were computed for each student using the methods described in the ACT Technical Manual (ACT, 2014). The CSEMs for writing were from the person by occasion generalizability study described earlier. The individual CSEM values were fit with a quadratic polynomial. For calculation of the ELA CSEMs, students were assigned the fitted value for the CSEM corresponding to their observed score. The STEM and ELA CSEM plots are shown in Figures 2.1 and 2.2, respectively. The same methods for calculating the reliability and SEM for Composite scores were used for the STEM and ELA scores. STEM and ELA score descriptive statistics for students who participated in five of the national administrations are shown in Table 2.1. and reliability and SEM values are presented in Table 2.2. Table 2.1. Scale Score Summary Statistics of the ACT Test Scores for Five of the National ACT Administrations Statistic English Mathematics Reading Science ELA STEM Composite Mean SD Skewness Kurtosis Table 2.2. Scale Score Reliability and Standard Error of Measurement Summary Statistics for Five of the National ACT Administrations Reliability SEM Test Median Minimum Maximum Median Minimum Maximum English Mathematics Reading Science ELA STEM Composite
25 ADDITIONAL SCORES AND INDICATORS Figure 2.1. Conditional standard errors of measurement of the STEM scores for five of the forms used in national ACT administrations. 2.3
26 ADDITIONAL SCORES AND INDICATORS Figure 2.2. Conditional standard errors of measurement of the ELA scores for five of the forms used in national ACT administrations. 2.4
27 ADDITIONAL SCORES AND INDICATORS Development of ACT s STEM Readiness Benchmark In fall 2015, ACT introduced a STEM score for the ACT test that provides students and educators with more insight into critical aspects of students readiness for first-year college coursework in science, technology, engineering, and mathematics (STEM) disciplines. The STEM score is the rounded average of the ACT mathematics and science test scores and represents students overall performance in these subjects. A study by Mattern, Radunzel, and Westrick (2015) suggested that academic readiness for STEM coursework may require higher scores than those indicated by the ACT College Readiness Benchmarks given that Calculus instead of College Algebra appears to be the typical first mathematics course of students majoring in STEM. The typical first science course taken by students majoring in a STEMrelated field included Chemistry, Biology, Physics, or Engineering. In a subsequent study, Radunzel, Mattern, Crouse, and Westrick (2015) identified the ACT STEM score that is associated with a reasonable chance of success in first-year STEM-identified mathematics and science courses. Data and method. Data used to develop the ACT STEM Readiness Benchmark based on the ACT STEM score came from four-year postsecondary institutions that had participated in research services offered by ACT and included students from the 2005 through 2009 freshman cohorts. Results were based on 22,246 students from 37 institutions for Calculus and 69,328 students from 70 institutions for the science courses. The same methodology as the single subject area ACT College Readiness Benchmarks was used to develop the ACT STEM Readiness Benchmark (Allen, 2013; Mattern et al., 2015). Briefly, the grades earned in first-year STEM courses (Calculus, Biology, Chemistry, Physics, and Engineering) were combined in a single course success model to determine the ACT STEM test score that was associated with at least a 50% chance of earning a B or higher grade in those courses. Hierarchical logistic regression was used to model within each college the probability of success in a course as a function of ACT STEM score. The model also included an indicator for content area (mathematics versus science). Typical probabilities of success by ACT STEM score were determined by first calculating the median probabilities across institutions within each content area and then averaging the probabilities across the two content areas giving equal weight to the two areas. Results. When combining grade data for Calculus and multiple science courses into a single course-success model, the ACT STEM score associated with at least a 50% chance of earning a B or higher grade in a STEM-related course was determined to be 26. Moreover, this cutoff score was also associated with an approximate 75% chance of earning a C or higher grade. The ACT STEM score of 26 also corresponded to the average of the ACT mathematics (27) and science (25) scores, which were derived by using separate STEM content area course-success models for Calculus and a combination of science courses (Mattern et al., 2015). Summary. The ACT STEM Readiness Benchmark can be used to help gauge overall student readiness for STEM-related coursework. Based on the ACT STEM Readiness Benchmark of 26, only 20% of the 2016 ACT-tested high school graduating class was ready for first-year STEM-related college courses. 2.5
28 ADDITIONAL SCORES AND INDICATORS Statistical Relationships between ACT STEM Scores and Students Chances of Succeeding in a STEM-Related Major A study by Radunzel et al. (2015) examined the ACT STEM score in relation to the likelihood of succeeding in a variety of STEM-related college outcomes: cumulative GPA over time, persistence in a STEM major, and ultimately completing a STEM degree. Data and method. Longitudinal college outcomes data used in the study were provided by both two- and four-year postsecondary institutions who had participated in research services offered by ACT. The study focused on students from the 2005 to 2009 freshman cohorts who declared a STEM major within their first year of college. College outcomes data for the four-year sample were available from 48 four-year institutions and included approximately 53,000 students majoring in STEM who were tracked primarily at the initial institution attended. College outcomes data for the two-year sample were based on more than 10,000 students majoring in STEM who first enrolled in one of 36 two-year institutions from two state systems. For the two-year sample, students were tracked across in-state two- and four-year postsecondary institutions, so in-state transfer information was available. Due to the nested structure of the data, various hierarchical regression models were used to estimate students chances of succeeding in a STEM major at a typical institution. Success rates were estimated using the fixed-effect parameter estimates from the hierarchical regression models. Specifically, logistic regression was used to estimate students chances of earning a cumulative GPA of 3.0 or higher, multinomial regression was used for students chances of persisting in a STEM major, and discrete-time survival regression was used for students chances of completing a degree in a STEM-related field. For the four-year sample, completion of a bachelor s degree within 4, 5, or 6 years was evaluated. For the two-year sample, completion of an associate s or bachelor s degree was evaluated. For more details on the data and methods used, see the full report (Radunzel et al., 2015). Results. ACT STEM scores are positively related to students chances of achieving specific cumulative GPAs over time, persisting in a STEM major over time, and completing a degree in a STEM field (Radunzel et al., 2015). These findings hold for students who began at both two- and four-year postsecondary institutions, as well as for students in each of the four STEM major clusters (Computer Science & Mathematics, Engineering, Medical & Health, and Science). Figure 2.3 provides the results for STEM persistence at years 2, 3, and 4 for students majoring in STEM who began at a four-year institution. The chances of persisting in a STEM major are 67% at year 2, 57% at year 3, and 53% at year 4 for students with an ACT STEM score of 26. Students with STEM scores above 26 have even greater chances of success. In comparison to those with a score of 26, students chances are 12 to 14 percentage points lower across the years for those with an ACT STEM score of 22 (55%, 44%, and 39%, respectively). Moreover, students majoring in STEM with an ACT STEM score of 26 or higher were nearly three times more likely than those with a score of 22 or below to earn a STEM bachelor s degree within six years (49% vs. 17%). Only one-third of students majoring in STEM with an ACT STEM score between 23 and 25 completed a STEM bachelor s degree by the end of year 6. For additional figures illustrating the relationships between the ACT STEM score and students chances of succeeding in a STEM major, see the full report (Radunzel et al., 2015). 2.6
29 ADDITIONAL SCORES AND INDICATORS Summary. The results from the study illustrate that predicting student success in STEMrelated fields is a valid use of the ACT STEM score. Another study by Radunzel, Mattern, and Westrick (2016) suggested that the positive relationship between ACT STEM scores and students chances of succeeding in a STEM major hold even after statistically controlling for other student characteristics, such as their high school coursework taken and grades earned in those courses, their vocational interests, and their demographic characteristics. This finding is consistent with a growing body of literature that has found educational success is a product of not only academic skills and knowledge but also of noncognitive factors such as motivation, academic goals, and academic self-efficacy (Mattern, Burrus, Camara, O Connor, Hanson, Gambrell, Casillas, & Bobek, 2014). Figure 2.3. Probability of persisting in a STEM major at years 2, 3, and 4 by ACT STEM score at a typical four-year institution Understanding Complex Texts Beginning in September 2015, ACT test score reports have included an indicator for Understanding Complex Texts (UCT) to show whether students are understanding the central meaning of complex texts at a level that is needed to succeed in college courses with higher reading demand. This indicator is based on scores from a subset of items on the reading test. These items measure students global comprehension of the passages instead of sentence- or word-level understanding. Student performance on these items is classified into three performance levels: Below Proficient, Proficient, and Above Proficient. 2.7
30 ADDITIONAL SCORES AND INDICATORS The performance levels were established through a special study that linked students scores on the UCT items to their college course grades (Allen, Bolender, Fang, Li, & Thompson, 2016). Because UCT scores were not reported for earlier ACT test forms, the UCT test items were classified retroactively for each form so that students number correct UCT scores could be calculated. The number of items that contributed to the UCT score varied across forms. The number correct UCT scores were then equated across forms to an interim score scale ranging from 0 to 16. The development of the cut scores for Proficient and Above Proficient was described by Allen et al. (2016). This special study examined the UCT scores and course grades of 263,265 students from 439 postsecondary institutions and found that the UCT scores were more predictive of success in college courses that have higher demand for understanding complex texts. Hierarchical logistic regression using UCT scores was used to predict students chances of earning a B or higher in seven types of courses (American History*, Literature, Other History*, Other National Science, Physics (without Calculus), Sociology, and Zoology*). Three of the seven course types (marked with *) were also used to develop the ACT College Readiness Benchmark for the reading test. For each course and institution, the UCT score associated with a 50% chance of earning a B or higher was identified. These results were aggregated over a weighted sample of institutions to find the Proficient cut score of 9. This score is associated with a 50% chance of earning a B or higher at a typical institution. The Proficient cut score is also associated with a 78% chance of earning a C or higher grade and a 22% chance of earning an A. The Above Proficient cut score of 13 was found in a similar way. This score is associated with a 67% chance of earning a B or higher at a typical institution. The Above Proficient cut score is also associated with an 85% chance of earning a C or higher grade and a 37% chance of earning an A. The Above Proficient cut score is about two standard errors of measurement above the Proficient cut score. For additional information on the development of the UCT cut scores, see the full report by Allen et al. (2016). UCT number correct raw scores on operational forms are all equated to the interim score scale so the UCT performance levels can be interpreted consistently across forms. The classification index for these scores is described in the next section. Classification Consistency Classification consistency refers to the extent to which examinees are classified into the same category over replications of a measurement procedure. Because tests are rarely administered twice to the same examinee, classification consistency is typically estimated from a single test administration, with strong assumptions about distributions of measurement errors and true scores (e.g., Hanson & Brennan, 1990; Livingston & Lewis, 1995). Using the method described by Livingston and Lewis (1995), the true score distribution was estimated by fitting a four-parameter beta distribution. The expected conditional distribution of scores, given the true score, is a binomial distribution. With the assumption of independent errors of measurement, the probabilities that a student would be classified into each pair of categories were computed, given the true score. The conditional results were then aggregated over the true score distribution to get a contingency table containing probabilities of a student 2.8
31 ADDITIONAL SCORES AND INDICATORS receiving scores from two administrations that fall into any combination of categories. The estimated classification consistency index for the whole group is the sum of the diagonals of the contingency table, which represent the probabilities of being classified in the same category on two separate administrations. Classification consistency was computed for five of the forms used in the national ACT administrations. Across forms, the classification consistency ranged from.64 to.69, which was moderately high considering the number of items that contribute to UCT scores and the number of performance levels. The number of UCT items ranged from 16 to 21 across these five forms, and the percent of students classified as Below Proficient, Proficient, and Above Proficient across the five administrations in was 43%, 33%, and 24%, respectively Progress Toward the ACT National Career Readiness Certificate The Progress Toward the ACT National Career Readiness Certificate indicator is based on students ACT Composite scores and provides an estimate of future achievement on the ACT National Career Readiness Certificate (ACT NCRC ). The ACT NCRC is an assessmentbased credential that certifies foundational work skills important for job success across industries and occupations. The ACT NCRC is based on the results of three ACT WorkKeys assessments: Applied Mathematics, Locating Information, and Reading for Information. Scores on these assessments determine the certificate level no certificate, Bronze, Silver, Gold, or Platinum an individual can earn. The ACT NCRC gives individuals evidence that they possess the skills employers deem essential to workplace success. More information about ACT NCRC can be found at Data from over 110,000 grade 11 students who took both ACT WorkKeys (and obtained the ACT NCRC) and the ACT were used to establish a link between ACT Composite scores and the ACT NCRC levels. Because the constructs and content of the ACT test differ from that of ACT WorkKeys, logistic regression was used to predict the ACT Composite cut score that corresponded to a 50% chance of obtaining each ACT NCRC level. This method of determining cut scores was similar to the approach used to establish the ACT College Readiness Benchmarks (e.g., Allen, 2013). The study showed that the ACT Composite Scores corresponding to the Bronze, Silver, Gold, and Platinum certificates were 13, 17, 25, and 35, respectively. Based on the ACT Composite cut scores obtained for each NCRC level from the linkage study, the Progress Toward ACT NCRC indicator classifies students into one of four levels: Making Insufficient Progress Toward a Certificate, Progress Toward Bronze Level NCRC, Progress Toward Silver Level NCRC, and Progress Toward Gold Level NCRC. If a student s ACT Composite score surpassed the cut score for an NCRC level, the student is categorized as making progress toward the next higher NCRC level. The ranges of the ACT Composite scores for each level are shown in Table 2.3. Because of the small proportion of students obtaining a Platinum level, the highest level reported for this indicator is Gold. Note that the Progress Toward ACT NCRC indicator is not a prediction of students likely attainment of an NCRC level, but an indicator of the NCRC level that a student is likely progressing toward. For a comparison of the Progress Toward ACT NCRC results and predicted NCRC level results for the 2016 ACT-tested high school graduating class, see a technical brief by Allen, LeFebvre, and Mattern (2016). 2.9
32 ADDITIONAL SCORES AND INDICATORS Classification Consistency Classification consistencies of the Progress Toward ACT NCRC indicator were calculated for five of the forms used in the national administrations. The classification consistency index ranged from 0.87 to Classification consistency of the Progress Toward ACT NCRC indicator was calculated using the same approach used to calculate the classification consistency of the Understanding Complex Texts indicator. Note that the classification consistency index is an indication of the stability of Progress Toward ACT NCRC indicator if different ACT test forms were taken and is not an indication of the accuracy of the classification compared with students actual NCRC attainment. The Progress Toward ACT NCRC indicator is not a substitute for an actual ACT NCRC level obtained by taking ACT WorkKeys. Actual performance could differ from the statistically predicted performance for a variety of reasons, including differences in the ACT test and ACT WorkKeys test, statistical uncertainty in the prediction, and a student s growth trajectory. Table 2.3. Composite Score Ranges for the ACT NCRC Levels Composite Score ACT NCRC Level Range Making Insufficient Progress Toward a Certificate 1 11 Progress Toward Bronze Progress Toward Silver Progress Toward Gold Interest-Major Fit The ACT Student, High School, and College Reports display the student s level of interestmajor fit. This fit level is derived from two data elements collected from students during ACT registration: the student s ACT Interest Inventory scores and the major they plan to enter. Interest major fit measures the strength of the relationship between the individual student s profile of ACT Interest Inventory scores and the interest profile of students in the planned major. Interest profiles for each of the 294 majors on the ACT registration list are based on a large sample of undergraduate students (from 73 institutions in 21 states) with a declared major and a GPA of at least 2.0. Major was determined in the third year for students in 4-year colleges and in the second year for students in 2-year colleges. The interest-major fit level is based on an interest major fit score. Although not shown on these reports, fit scores range from 00 to 99. The higher the score, the better the interest major fit. Using data from a large sample (collected from 42 institutions in 16 states), three levels of fit were established based on the empirical relationships between interest-major fit scores and the proportion of students who persisted in their college major. The first cut score was set at 60 because the relationship between fit scores and major persistence was relatively flat for scores below 60. The relationship between fit scores and college major persistence rates displayed a steady increase above 60; therefore, the second cut score was set at the midpoint (80) of the 2.10
33 ADDITIONAL SCORES AND INDICATORS first cut score and the maximum possible score. Data from the same sample indicated that students were approximately evenly distributed across the three levels: 37% in High, 31% in Medium, and 32% in Low. Level of interest-major fit is displayed on the Student, High School, and College score reports as shading of one of the three (Low, Medium, High) sections of the interest-major fit bar. The concept of fit is foundational to understanding how people transition across and within social environments (Holland, 1997; Kristof-Brown & Guay, 2011). While frequently used to understand the relationship between a person and a work environment (e.g., in career planning), the concept of fit is equally important in academic environments, such as college majors. Different college majors and programs of study have different academic cultures. These academic cultures emphasize different tasks and skills, and many students gravitate toward majors or programs that match their own personal attributes. For example, students are more likely to select a major if it fits their interests (Porter & Umbach, 2006; Smart, Feldman, & Ethington, 2000). Of the many ways that people can potentially fit their major, focusing on interests is particularly relevant. Interests are motivational and play a role in both initiating and sustaining behavior (Silvia, 2006). In academic settings interest in an activity or content area influences important behaviors such as attention (e.g., Hidi, Renninger, & Krapp, 2004), persistence, (e.g., Krapp & Lewalter, 2001), goal setting (e.g., Harackiewicz, Durik, Barron, Linnenbrink-Garcia, & Tauer, 2008), and academic achievement (e.g., Denissen, Zarrett, & Eccles, 2007). Further, there is growing evidence that the fit between students interests and their college majors is important in understanding and predicting student outcomes. Research involving the ACT Interest Inventory suggests that if students measured interests (i.e., patterns of scores on interest inventories) are similar to the interests of people in their chosen college majors, they will be more likely to persist in college (Tracey & Robbins, 2006; Allen & Robbins, 2008), remain in their major (Allen & Robbins, 2008), and complete their college degree in a timely manner (Allen & Robbins, 2010). Even before students declare a major in college, fit between their interests and planned major is a good predictor of whether they will follow through on their college major plans (ACT, 2013). More broadly, the value of interest-major fit is not limited to the ACT Interest Inventory or to the outcomes listed above. A large-scale meta-analysis, involving data over a 60-year time period and including a range of outcome and interest measures (including the ACT Interest Inventory), found that interest-environment fit is related to persistence and performance in both academic and work settings (Nye, Su, Rounds, & Drasgow, 2012). Additional information on research involving the ACT Interest Inventory and interest-major fit is described in ACT (2009). Learn more about interest-major fit and view data in an interactive format at the following website College Choice Report Part 2: Enrollment Patterns (ACT, 2013). 2.11
34 CHAPTER 3 College and Career Planning Information on ACT Score Reports This chapter briefly describes selected elements related to college and career planning that are found on the enhanced student, high school, and college score reports. These reports allow students and educators to better navigate results and gain more meaningful insights. New measures such as Interest-Major Fit and Progress Toward the ACT National Career Readiness Certificate assist students and their counselors in charting the path to college and career. ACT has provided training and new support materials to assist schools and districts in using these new reports. Chapter 3 of The ACT Test User Handbook for Educators provides descriptions for all the sections included on the enhanced ACT score reports. The User Handbook can be found at: 3.1
35 STUDENT, HIGH SCHOOL, AND COLLEGE REPORTS Figure ACT sample student report 3.1 Student Report College and Career Planning This section of the student score report provides a visual summary of the results of the ACT Interest Inventory. The Career Connector is a two-dimensional figure with four compass points. The compass points are four basic work tasks shown to underlie the work done in all occupations: Working with People, Data, Things, and Ideas (ACT, 2009). The Career Connector summarizes the pattern of results from the scales on the ACT Interest Inventory and visually displays it as one or two directions with respect to these compass points. As currently used on the ACT Student Report, the Career Connector also includes a personalized list of five occupations that involve work tasks in this same direction. The Career Connector is derived from ACT s Career Map, an empirically based system for summarizing basic similarities and differences between groups of occupations with respect to their relative involvement with people, data, things, and ideas. The Career Map serves as an interpretive bridge linking people to occupations and is designed to engage users in the process of career exploration. Both the Career Map and the Career Connector are grounded in research involving extensive and diverse occupational data based on expert ratings, job analyses, and measured interests (ACT, 2009; Prediger & Swaney, 2004). In sum, the Career Connector serves two roles. First, it visually displays a summary of the basic work-relevant interests of the student. Second, it provides an introduction to the concepts that 3.2
36 STUDENT, HIGH SCHOOL, AND COLLEGE REPORTS serve as the foundation for ACT s Career Map. Thus the Career Connector, while not a map itself, summarizes the interest inventory results and helps to prepare students to understand and use the Career Map to explore personally relevant career options. Interest-Major Fit The ACT Student Report lists the student s planned college major and displays the level of interest-major fit. The latter is shown by shading in one of the three sections (Low, Medium, High) of the interest-major fit bar. The fit level is derived from two data elements: the student s ACT Interest Inventory scores and the self-reported major the student plans to enter. These elements are used to calculate an interest major fit score, which is converted to one of three fit levels to summarize the strength of the relationship between the student s interests and the interests of students in the planned major. Interest-major fit is described in more detail in section 2.4. Progress Toward the ACT National Career Readiness Certificate This section of the report provides Progress Toward the ACT National Career Readiness Certificate indicator based on students Composite score. This is an indicator of future performance on the ACT National Career Readiness Certificate (ACT NCRC ). The ACT NCRC is an assessment-based credential that certifies foundational work skills important for job success across industries and occupations. The Progress toward Career Readiness indicator suggests whether a student is making sufficient progress toward one of the following NCRC levels: Bronze, Silver, or Gold. 3.3


37 STUDENT, HIGH SCHOOL, AND COLLEGE REPORTS Figure ACT sample high school report 3.4
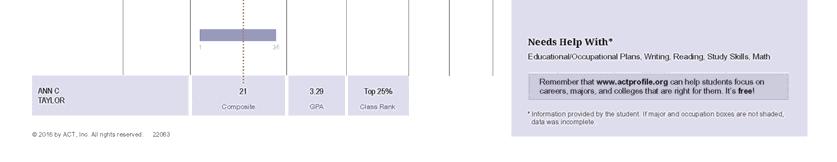
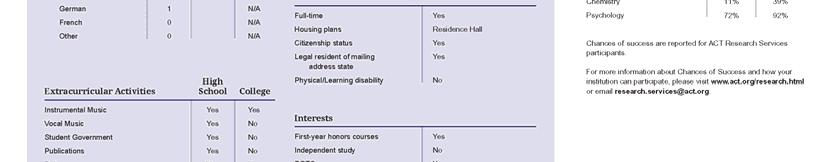
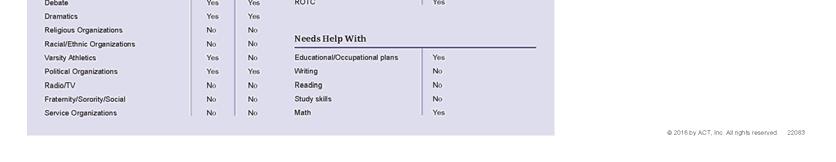
38 STUDENT, HIGH SCHOOL, AND COLLEGE REPORTS 3.2 High School Report Educational and Occupational Plans This section of the ACT High School Report consists of five parts (see Figure 3.2): (1) ACT Interest Inventory scores, (2) the student s self-reported choice of major and occupation accompanied by their level of certainty about that choice, (3) interest-major fit, (4) examples of majors related to their major choice and occupations related to their occupation choice, and (5) a list of the educational areas (e.g., writing) the student reported needing help with. Each of the five parts is based (directly or indirectly) on self-reported information collected from students during ACT registration. These five parts are described in turn. ACT Interest Inventory scores. The ACT Interest Inventory scores are reported as standard scores (Mean=50, SD=10) based on Grade 12 nationally representative norms involving over 250,000 students from over 8,000 schools (ACT, 2009). Reliability and validity of the ACT Interest Inventory for career exploration and planning are well established (ACT, 2009). These scores are made available for counselors who are familiar with Holland s theory of career types (Holland, 1997) and may want to use these scores to offer a clinical interpretation of the student s interests. Major and occupation choice. The ACT High School Report lists the student s planned college major and first choice of occupation. Also shown is the student s selfreported level of certainty (Not Sure, Fairly Sure, Very Sure) for both their current choice of major and occupation. Level of certainty has been found to be highly related to persistence of choice from planned major in high school to declared major in college (ACT, 2013). Interest-major fit. The high school score report displays the student s level of interestmajor fit, shown by shading in one of the three sections (Low, Medium, High) of the interest-major fit bar. The fit level is derived from two data elements: the student s ACT Interest Inventory scores and the self-reported major the student plans to enter. These elements are used to calculate an interest-major fit score, which is converted to one of three fit levels to summarize the strength of the relationship between the student s interests and the interests of students in the planned major. Interest-major fit is described in more detail in section 2.4. Example majors and occupations. This part lists up to eight majors related to the student s major they plan to enter and up to eight occupations related to their first occupational choice. Many students consider several possibilities before making definite career plans. These lists can be used as a starting point for considering other possibilities to explore. Needs help with. This is a list of educational areas the student reported needing help with. The student responds yes or no to each of the five areas listed in the Student Profile Section (SPS) of the ACT: educational/occupational plans, writing, reading, study skills, and math. 3.5


39 STUDENT, HIGH SCHOOL, AND COLLEGE REPORTS Figure ACT sample college report 3.6
Statewide Framework Document for:
 Statewide Framework Document for: 270301 Standards may be added to this document prior to submission, but may not be removed from the framework to meet state credit equivalency requirements. Performance
CAAP. Content Analysis Report. Sample College. Institution Code: 9011 Institution Type: 4-Year Subgroup: none Test Date: Spring 2011
 CAAP Content Analysis Report Institution Code: 911 Institution Type: 4-Year Normative Group: 4-year Colleges Introduction This report provides information intended to help postsecondary institutions better
AGS THE GREAT REVIEW GAME FOR PRE-ALGEBRA (CD) CORRELATED TO CALIFORNIA CONTENT STANDARDS
 CORRELATED TO CALIFORNIA CONTENT STANDARDS") AGS THE GREAT REVIEW GAME FOR PRE-ALGEBRA (CD) CORRELATED TO CALIFORNIA CONTENT STANDARDS 1 CALIFORNIA CONTENT STANDARDS: Chapter 1 ALGEBRA AND WHOLE NUMBERS Algebra and Functions 1.4 Students use algebraic
AGS THE GREAT REVIEW GAME FOR PRE-ALGEBRA (CD) CORRELATED TO CALIFORNIA CONTENT STANDARDS 1 CALIFORNIA CONTENT STANDARDS: Chapter 1 ALGEBRA AND WHOLE NUMBERS Algebra and Functions 1.4 Students use algebraic
Mathematics subject curriculum
 Mathematics subject curriculum Dette er ei omsetjing av den fastsette læreplanteksten. Læreplanen er fastsett på Nynorsk Established as a Regulation by the Ministry of Education and Research on 24 June
Honors Mathematics. Introduction and Definition of Honors Mathematics
 Honors Mathematics Introduction and Definition of Honors Mathematics Honors Mathematics courses are intended to be more challenging than standard courses and provide multiple opportunities for students
Grade 6: Correlated to AGS Basic Math Skills
 Grade 6: Correlated to AGS Basic Math Skills Grade 6: Standard 1 Number Sense Students compare and order positive and negative integers, decimals, fractions, and mixed numbers. They find multiples and
Algebra 1, Quarter 3, Unit 3.1. Line of Best Fit. Overview
 Algebra 1, Quarter 3, Unit 3.1 Line of Best Fit Overview Number of instructional days 6 (1 day assessment) (1 day = 45 minutes) Content to be learned Analyze scatter plots and construct the line of best
Learning Disability Functional Capacity Evaluation. Dear Doctor,
 Dear Doctor, I have been asked to formulate a vocational opinion regarding NAME s employability in light of his/her learning disability. To assist me with this evaluation I would appreciate if you can
Mathematics. Mathematics
 Mathematics Program Description Successful completion of this major will assure competence in mathematics through differential and integral calculus, providing an adequate background for employment in
STA 225: Introductory Statistics (CT)
") Marshall University College of Science Mathematics Department STA 225: Introductory Statistics (CT) Course catalog description A critical thinking course in applied statistical reasoning covering basic
Marshall University College of Science Mathematics Department STA 225: Introductory Statistics (CT) Course catalog description A critical thinking course in applied statistical reasoning covering basic
Florida Mathematics Standards for Geometry Honors (CPalms # )
") A Correlation of Florida Geometry Honors 2011 to the for Geometry Honors (CPalms #1206320) Geometry Honors (#1206320) Course Standards MAFS.912.G-CO.1.1: Know precise definitions of angle, circle, perpendicular
A Correlation of Florida Geometry Honors 2011 to the for Geometry Honors (CPalms #1206320) Geometry Honors (#1206320) Course Standards MAFS.912.G-CO.1.1: Know precise definitions of angle, circle, perpendicular
Probability and Statistics Curriculum Pacing Guide
 Unit 1 Terms PS.SPMJ.3 PS.SPMJ.5 Plan and conduct a survey to answer a statistical question. Recognize how the plan addresses sampling technique, randomization, measurement of experimental error and methods
The College Board Redesigned SAT Grade 12
 A Correlation of, 2017 To the Redesigned SAT Introduction This document demonstrates how myperspectives English Language Arts meets the Reading, Writing and Language and Essay Domains of Redesigned SAT.
Syllabus ENGR 190 Introductory Calculus (QR)
") Syllabus ENGR 190 Introductory Calculus (QR) Catalog Data: ENGR 190 Introductory Calculus (4 credit hours). Note: This course may not be used for credit toward the J.B. Speed School of Engineering B. S.
Syllabus ENGR 190 Introductory Calculus (QR) Catalog Data: ENGR 190 Introductory Calculus (4 credit hours). Note: This course may not be used for credit toward the J.B. Speed School of Engineering B. S.
Mathematics Assessment Plan
 Mathematics Assessment Plan Mission Statement for Academic Unit: Georgia Perimeter College transforms the lives of our students to thrive in a global society. As a diverse, multi campus two year college,
Extending Place Value with Whole Numbers to 1,000,000
 Grade 4 Mathematics, Quarter 1, Unit 1.1 Extending Place Value with Whole Numbers to 1,000,000 Overview Number of Instructional Days: 10 (1 day = 45 minutes) Content to Be Learned Recognize that a digit
South Carolina English Language Arts
 South Carolina English Language Arts A S O F J U N E 2 0, 2 0 1 0, T H I S S TAT E H A D A D O P T E D T H E CO M M O N CO R E S TAT E S TA N DA R D S. DOCUMENTS REVIEWED South Carolina Academic Content
Arizona s English Language Arts Standards th Grade ARIZONA DEPARTMENT OF EDUCATION HIGH ACADEMIC STANDARDS FOR STUDENTS
 Arizona s English Language Arts Standards 11-12th Grade ARIZONA DEPARTMENT OF EDUCATION HIGH ACADEMIC STANDARDS FOR STUDENTS 11 th -12 th Grade Overview Arizona s English Language Arts Standards work together
AP Calculus AB. Nevada Academic Standards that are assessable at the local level only.
 Calculus AB Priority Keys Aligned with Nevada Standards MA I MI L S MA represents a Major content area. Any concept labeled MA is something of central importance to the entire class/curriculum; it is a
Dublin City Schools Mathematics Graded Course of Study GRADE 4
 I. Content Standard: Number, Number Sense and Operations Standard Students demonstrate number sense, including an understanding of number systems and reasonable estimates using paper and pencil, technology-supported
SAT MATH PREP:
 SAT MATH PREP: 2015-2016 NOTE: The College Board has redesigned the SAT Test. This new test will start in March of 2016. Also, the PSAT test given in October of 2015 will have the new format. Therefore
Page 1 of 11. Curriculum Map: Grade 4 Math Course: Math 4 Sub-topic: General. Grade(s): None specified
: None specified") Curriculum Map: Grade 4 Math Course: Math 4 Sub-topic: General Grade(s): None specified Unit: Creating a Community of Mathematical Thinkers Timeline: Week 1 The purpose of the Establishing a Community
Curriculum Map: Grade 4 Math Course: Math 4 Sub-topic: General Grade(s): None specified Unit: Creating a Community of Mathematical Thinkers Timeline: Week 1 The purpose of the Establishing a Community
GUIDE TO THE CUNY ASSESSMENT TESTS
 GUIDE TO THE CUNY ASSESSMENT TESTS IN MATHEMATICS Rev. 117.016110 Contents Welcome... 1 Contact Information...1 Programs Administered by the Office of Testing and Evaluation... 1 CUNY Skills Assessment:...1
Number of students enrolled in the program in Fall, 2011: 20. Faculty member completing template: Molly Dugan (Date: 1/26/2012)
") Program: Journalism Minor Department: Communication Studies Number of students enrolled in the program in Fall, 2011: 20 Faculty member completing template: Molly Dugan (Date: 1/26/2012) Period of reference
Program: Journalism Minor Department: Communication Studies Number of students enrolled in the program in Fall, 2011: 20 Faculty member completing template: Molly Dugan (Date: 1/26/2012) Period of reference
TRAITS OF GOOD WRITING
 TRAITS OF GOOD WRITING Each paper was scored on a scale of - on the following traits of good writing: Ideas and Content: Organization: Voice: Word Choice: Sentence Fluency: Conventions: The ideas are clear,
PAGE(S) WHERE TAUGHT If sub mission ins not a book, cite appropriate location(s))
 WHERE TAUGHT If sub mission ins not a book, cite appropriate location(s))") Ohio Academic Content Standards Grade Level Indicators (Grade 11) A. ACQUISITION OF VOCABULARY Students acquire vocabulary through exposure to language-rich situations, such as reading books and other
Ohio Academic Content Standards Grade Level Indicators (Grade 11) A. ACQUISITION OF VOCABULARY Students acquire vocabulary through exposure to language-rich situations, such as reading books and other
 Math 150 Syllabus Course title and number MATH 150 Term Fall 2017 Class time and location INSTRUCTOR INFORMATION Name Erin K. Fry Phone number Department of Mathematics: 845-3261 e-mail address erinfry@tamu.edu
Linking the Ohio State Assessments to NWEA MAP Growth Tests *
 Linking the Ohio State Assessments to NWEA MAP Growth Tests * *As of June 2017 Measures of Academic Progress (MAP ) is known as MAP Growth. August 2016 Introduction Northwest Evaluation Association (NWEA
OFFICE SUPPORT SPECIALIST Technical Diploma
 OFFICE SUPPORT SPECIALIST Technical Diploma Program Code: 31-106-8 our graduates INDEMAND 2017/2018 mstc.edu administrative professional career pathway OFFICE SUPPORT SPECIALIST CUSTOMER RELATIONSHIP PROFESSIONAL
SOUTHERN MAINE COMMUNITY COLLEGE South Portland, Maine 04106
 SOUTHERN MAINE COMMUNITY COLLEGE South Portland, Maine 04106 Title: Precalculus Catalog Number: MATH 190 Credit Hours: 3 Total Contact Hours: 45 Instructor: Gwendolyn Blake Email: gblake@smccme.edu Website:
Missouri Mathematics Grade-Level Expectations
 A Correlation of to the Grades K - 6 G/M-223 Introduction This document demonstrates the high degree of success students will achieve when using Scott Foresman Addison Wesley Mathematics in meeting the
Teachers Guide Chair Study
 Certificate of Initial Mastery Task Booklet 2006-2007 School Year Teachers Guide Chair Study Dance Modified On-Demand Task Revised 4-19-07 Central Falls Johnston Middletown West Warwick Coventry Lincoln
learning collegiate assessment]
![learning collegiate assessment]](/thumbs/71/66063392.jpg "learning collegiate assessment]") [ collegiate learning assessment] INSTITUTIONAL REPORT 2005 2006 Kalamazoo College council for aid to education 215 lexington avenue floor 21 new york new york 10016-6023 p 212.217.0700 f 212.661.9766
[ collegiate learning assessment] INSTITUTIONAL REPORT 2005 2006 Kalamazoo College council for aid to education 215 lexington avenue floor 21 new york new york 10016-6023 p 212.217.0700 f 212.661.9766
Bittinger, M. L., Ellenbogen, D. J., & Johnson, B. L. (2012). Prealgebra (6th ed.). Boston, MA: Addison-Wesley.
. Prealgebra (6th ed.). Boston, MA: Addison-Wesley.") Course Syllabus Course Description Explores the basic fundamentals of college-level mathematics. (Note: This course is for institutional credit only and will not be used in meeting degree requirements.
Course Syllabus Course Description Explores the basic fundamentals of college-level mathematics. (Note: This course is for institutional credit only and will not be used in meeting degree requirements.
TABE 9&10. Revised 8/2013- with reference to College and Career Readiness Standards
 TABE 9&10 Revised 8/2013- with reference to College and Career Readiness Standards LEVEL E Test 1: Reading Name Class E01- INTERPRET GRAPHIC INFORMATION Signs Maps Graphs Consumer Materials Forms Dictionary
Rubric for Scoring English 1 Unit 1, Rhetorical Analysis
 FYE Program at Marquette University Rubric for Scoring English 1 Unit 1, Rhetorical Analysis Writing Conventions INTEGRATING SOURCE MATERIAL 3 Proficient Outcome Effectively expresses purpose in the introduction
Grade 11 Language Arts (2 Semester Course) CURRICULUM. Course Description ENGLISH 11 (2 Semester Course) Duration: 2 Semesters Prerequisite: None
 CURRICULUM. Course Description ENGLISH 11 (2 Semester Course) Duration: 2 Semesters Prerequisite: None") Grade 11 Language Arts (2 Semester Course) CURRICULUM Course Description ENGLISH 11 (2 Semester Course) Duration: 2 Semesters Prerequisite: None Through the integrated study of literature, composition,
Grade 11 Language Arts (2 Semester Course) CURRICULUM Course Description ENGLISH 11 (2 Semester Course) Duration: 2 Semesters Prerequisite: None Through the integrated study of literature, composition,
Instructor: Matthew Wickes Kilgore Office: ES 310
 MATH 1314 College Algebra Syllabus Instructor: Matthew Wickes Kilgore Office: ES 310 Longview Office: LN 205C Email: mwickes@kilgore.edu Phone: 903 988-7455 Prerequistes: Placement test score on TSI or
Julia Smith. Effective Classroom Approaches to.
 Julia Smith @tessmaths Effective Classroom Approaches to GCSE Maths resits julia.smith@writtle.ac.uk Agenda The context of GCSE resit in a post-16 setting An overview of the new GCSE Key features of a
EGRHS Course Fair. Science & Math AP & IB Courses
 EGRHS Course Fair Science & Math AP & IB Courses Science Courses: AP Physics IB Physics SL IB Physics HL AP Biology IB Biology HL AP Physics Course Description Course Description AP Physics C (Mechanics)
Common Core State Standards for English Language Arts
 Reading Standards for Literature 6-12 Grade 9-10 Students: 1. Cite strong and thorough textual evidence to support analysis of what the text says explicitly as well as inferences drawn from the text. 2.
This Performance Standards include four major components. They are
 Environmental Physics Standards The Georgia Performance Standards are designed to provide students with the knowledge and skills for proficiency in science. The Project 2061 s Benchmarks for Science Literacy
THE PENNSYLVANIA STATE UNIVERSITY SCHREYER HONORS COLLEGE DEPARTMENT OF MATHEMATICS ASSESSING THE EFFECTIVENESS OF MULTIPLE CHOICE MATH TESTS
 THE PENNSYLVANIA STATE UNIVERSITY SCHREYER HONORS COLLEGE DEPARTMENT OF MATHEMATICS ASSESSING THE EFFECTIVENESS OF MULTIPLE CHOICE MATH TESTS ELIZABETH ANNE SOMERS Spring 2011 A thesis submitted in partial
Physics 270: Experimental Physics
 2017 edition Lab Manual Physics 270 3 Physics 270: Experimental Physics Lecture: Lab: Instructor: Office: Email: Tuesdays, 2 3:50 PM Thursdays, 2 4:50 PM Dr. Uttam Manna 313C Moulton Hall umanna@ilstu.edu
MYP Language A Course Outline Year 3
 Course Description: The fundamental piece to learning, thinking, communicating, and reflecting is language. Language A seeks to further develop six key skill areas: listening, speaking, reading, writing,
Livermore Valley Joint Unified School District. B or better in Algebra I, or consent of instructor
 Livermore Valley Joint Unified School District DRAFT Course Title: AP Macroeconomics Grade Level(s) 11-12 Length of Course: Credit: Prerequisite: One semester or equivalent term 5 units B or better in
Prentice Hall Literature Common Core Edition Grade 10, 2012
 A Correlation of Prentice Hall Literature Common Core Edition, 2012 To the New Jersey Model Curriculum A Correlation of Prentice Hall Literature Common Core Edition, 2012 Introduction This document demonstrates
Highlighting and Annotation Tips Foundation Lesson
 English Highlighting and Annotation Tips Foundation Lesson About this Lesson Annotating a text can be a permanent record of the reader s intellectual conversation with a text. Annotation can help a reader
Radius STEM Readiness TM
 Curriculum Guide Radius STEM Readiness TM While today s teens are surrounded by technology, we face a stark and imminent shortage of graduates pursuing careers in Science, Technology, Engineering, and
Using Calculators for Students in Grades 9-12: Geometry. Re-published with permission from American Institutes for Research
 Using Calculators for Students in Grades 9-12: Geometry Re-published with permission from American Institutes for Research Using Calculators for Students in Grades 9-12: Geometry By: Center for Implementing
1 st Quarter (September, October, November) August/September Strand Topic Standard Notes Reading for Literature
 August/September Strand Topic Standard Notes Reading for Literature") 1 st Grade Curriculum Map Common Core Standards Language Arts 2013 2014 1 st Quarter (September, October, November) August/September Strand Topic Standard Notes Reading for Literature Key Ideas and Details
1 st Grade Curriculum Map Common Core Standards Language Arts 2013 2014 1 st Quarter (September, October, November) August/September Strand Topic Standard Notes Reading for Literature Key Ideas and Details
Math 098 Intermediate Algebra Spring 2018
 Math 098 Intermediate Algebra Spring 2018 Dept. of Mathematics Instructor's Name: Office Location: Office Hours: Office Phone: E-mail: MyMathLab Course ID: Course Description This course expands on the
What the National Curriculum requires in reading at Y5 and Y6
 What the National Curriculum requires in reading at Y5 and Y6 Word reading apply their growing knowledge of root words, prefixes and suffixes (morphology and etymology), as listed in Appendix 1 of the
UNIT ONE Tools of Algebra
 UNIT ONE Tools of Algebra Subject: Algebra 1 Grade: 9 th 10 th Standards and Benchmarks: 1 a, b,e; 3 a, b; 4 a, b; Overview My Lessons are following the first unit from Prentice Hall Algebra 1 1. Students
Update on Standards and Educator Evaluation
 Update on Standards and Educator Evaluation Briana Timmerman, Ph.D. Director Office of Instructional Practices and Evaluations Instructional Leaders Roundtable October 15, 2014 Instructional Practices
GCSE Mathematics B (Linear) Mark Scheme for November Component J567/04: Mathematics Paper 4 (Higher) General Certificate of Secondary Education
 Mark Scheme for November Component J567/04: Mathematics Paper 4 (Higher) General Certificate of Secondary Education") GCSE Mathematics B (Linear) Component J567/04: Mathematics Paper 4 (Higher) General Certificate of Secondary Education Mark Scheme for November 2014 Oxford Cambridge and RSA Examinations OCR (Oxford Cambridge
GCSE Mathematics B (Linear) Component J567/04: Mathematics Paper 4 (Higher) General Certificate of Secondary Education Mark Scheme for November 2014 Oxford Cambridge and RSA Examinations OCR (Oxford Cambridge
Characteristics of Functions
 Characteristics of Functions Unit: 01 Lesson: 01 Suggested Duration: 10 days Lesson Synopsis Students will collect and organize data using various representations. They will identify the characteristics
TabletClass Math Geometry Course Guidebook
 TabletClass Math Geometry Course Guidebook Includes Final Exam/Key, Course Grade Calculation Worksheet and Course Certificate Student Name Parent Name School Name Date Started Course Date Completed Course
Mathematics Program Assessment Plan
 Mathematics Program Assessment Plan Introduction This assessment plan is tentative and will continue to be refined as needed to best fit the requirements of the Board of Regent s and UAS Program Review
Degree Qualification Profiles Intellectual Skills
 Degree Qualification Profiles Intellectual Skills Intellectual Skills: These are cross-cutting skills that should transcend disciplinary boundaries. Students need all of these Intellectual Skills to acquire
Facing our Fears: Reading and Writing about Characters in Literary Text
 Facing our Fears: Reading and Writing about Characters in Literary Text by Barbara Goggans Students in 6th grade have been reading and analyzing characters in short stories such as "The Ravine," by Graham
Prentice Hall Literature: Timeless Voices, Timeless Themes, Platinum 2000 Correlated to Nebraska Reading/Writing Standards (Grade 10)
") Prentice Hall Literature: Timeless Voices, Timeless Themes, Platinum 2000 Nebraska Reading/Writing Standards (Grade 10) 12.1 Reading The standards for grade 1 presume that basic skills in reading have
Prentice Hall Literature: Timeless Voices, Timeless Themes, Platinum 2000 Nebraska Reading/Writing Standards (Grade 10) 12.1 Reading The standards for grade 1 presume that basic skills in reading have
ACADEMIC AFFAIRS GUIDELINES
 ACADEMIC AFFAIRS GUIDELINES Section 8: General Education Title: General Education Assessment Guidelines Number (Current Format) Number (Prior Format) Date Last Revised 8.7 XIV 09/2017 Reference: BOR Policy
Evidence for Reliability, Validity and Learning Effectiveness
 PEARSON EDUCATION Evidence for Reliability, Validity and Learning Effectiveness Introduction Pearson Knowledge Technologies has conducted a large number and wide variety of reliability and validity studies
Introducing the New Iowa Assessments Mathematics Levels 12 14
 Introducing the New Iowa Assessments Mathematics Levels 12 14 ITP Assessment Tools Math Interim Assessments: Grades 3 8 Administered online Constructed Response Supplements Reading, Language Arts, Mathematics
EQuIP Review Feedback
 EQuIP Review Feedback Lesson/Unit Name: On the Rainy River and The Red Convertible (Module 4, Unit 1) Content Area: English language arts Grade Level: 11 Dimension I Alignment to the Depth of the CCSS
First Grade Standards
 These are the standards for what is taught throughout the year in First Grade. It is the expectation that these skills will be reinforced after they have been taught. Mathematical Practice Standards Taught
Math Grade 3 Assessment Anchors and Eligible Content
 Math Grade 3 Assessment Anchors and Eligible Content www.pde.state.pa.us 2007 M3.A Numbers and Operations M3.A.1 Demonstrate an understanding of numbers, ways of representing numbers, relationships among
Oakland Unified School District English/ Language Arts Course Syllabus
 Oakland Unified School District English/ Language Arts Course Syllabus For Secondary Schools The attached course syllabus is a developmental and integrated approach to skill acquisition throughout the
Prentice Hall Literature: Timeless Voices, Timeless Themes Gold 2000 Correlated to Nebraska Reading/Writing Standards, (Grade 9)
") Nebraska Reading/Writing Standards, (Grade 9) 12.1 Reading The standards for grade 1 presume that basic skills in reading have been taught before grade 4 and that students are independent readers. For
Nebraska Reading/Writing Standards, (Grade 9) 12.1 Reading The standards for grade 1 presume that basic skills in reading have been taught before grade 4 and that students are independent readers. For
Achievement Level Descriptors for American Literature and Composition
 Achievement Level Descriptors for American Literature and Composition Georgia Department of Education September 2015 All Rights Reserved Achievement Levels and Achievement Level Descriptors With the implementation
Mathematics process categories
 Mathematics process categories All of the UK curricula define multiple categories of mathematical proficiency that require students to be able to use and apply mathematics, beyond simple recall of facts
Algebra 2- Semester 2 Review
 Name Block Date Algebra 2- Semester 2 Review Non-Calculator 5.4 1. Consider the function f x 1 x 2. a) Describe the transformation of the graph of y 1 x. b) Identify the asymptotes. c) What is the domain
TOPICS LEARNING OUTCOMES ACTIVITES ASSESSMENT Numbers and the number system
 Curriculum Overview Mathematics 1 st term 5º grade - 2010 TOPICS LEARNING OUTCOMES ACTIVITES ASSESSMENT Numbers and the number system Multiplies and divides decimals by 10 or 100. Multiplies and divide
Math 121 Fundamentals of Mathematics I
 I. Course Description: Math 121 Fundamentals of Mathematics I Math 121 is a general course in the fundamentals of mathematics. It includes a study of concepts of numbers and fundamental operations with
LLD MATH. Student Eligibility: Grades 6-8. Credit Value: Date Approved: 8/24/15
 PUBLIC SCHOOLS OF EDISON TOWNSHIP DIVISION OF CURRICULUM AND INSTRUCTION LLD MATH Length of Course: Elective/Required: School: Full Year Required Middle Schools Student Eligibility: Grades 6-8 Credit Value:
Cal s Dinner Card Deals
 Cal s Dinner Card Deals Overview: In this lesson students compare three linear functions in the context of Dinner Card Deals. Students are required to interpret a graph for each Dinner Card Deal to help
Timeline. Recommendations
 Introduction Advanced Placement Course Credit Alignment Recommendations In 2007, the State of Ohio Legislature passed legislation mandating the Board of Regents to recommend and the Chancellor to adopt
Grade 4. Common Core Adoption Process. (Unpacked Standards)
") Grade 4 Common Core Adoption Process (Unpacked Standards) Grade 4 Reading: Literature RL.4.1 Refer to details and examples in a text when explaining what the text says explicitly and when drawing inferences
Grade 4 Common Core Adoption Process (Unpacked Standards) Grade 4 Reading: Literature RL.4.1 Refer to details and examples in a text when explaining what the text says explicitly and when drawing inferences
On-the-Fly Customization of Automated Essay Scoring
 Research Report On-the-Fly Customization of Automated Essay Scoring Yigal Attali Research & Development December 2007 RR-07-42 On-the-Fly Customization of Automated Essay Scoring Yigal Attali ETS, Princeton,
Math 96: Intermediate Algebra in Context
 : Intermediate Algebra in Context Syllabus Spring Quarter 2016 Daily, 9:20 10:30am Instructor: Lauri Lindberg Office Hours@ tutoring: Tutoring Center (CAS-504) 8 9am & 1 2pm daily STEM (Math) Center (RAI-338)
Course Name: Elementary Calculus Course Number: Math 2103 Semester: Fall Phone:
 Course Name: Elementary Calculus Course Number: Math 2103 Semester: Fall 2011 Instructor s Name: Ricky Streight Hours Credit: 3 Phone: 405-945-6794 email: ricky.streight@okstate.edu 1. COURSE: Math 2103
Literature and the Language Arts Experiencing Literature
 Correlation of Literature and the Language Arts Experiencing Literature Grade 9 2 nd edition to the Nebraska Reading/Writing Standards EMC/Paradigm Publishing 875 Montreal Way St. Paul, Minnesota 55102
An Analysis of the Early Assessment Program (EAP) Assessment for English
 Assessment for English") An Analysis of the Early Assessment Program (EAP) Assessment for English Conducted by Achieve on behalf of the California Diploma Project (ADP) and Policy Analysis for California Education (PACE) October
An Analysis of the Early Assessment Program (EAP) Assessment for English Conducted by Achieve on behalf of the California Diploma Project (ADP) and Policy Analysis for California Education (PACE) October
BENCHMARK MA.8.A.6.1. Reporting Category
 Grade MA..A.. Reporting Category BENCHMARK MA..A.. Number and Operations Standard Supporting Idea Number and Operations Benchmark MA..A.. Use exponents and scientific notation to write large and small
Classroom Connections Examining the Intersection of the Standards for Mathematical Content and the Standards for Mathematical Practice
 Classroom Connections Examining the Intersection of the Standards for Mathematical Content and the Standards for Mathematical Practice Title: Considering Coordinate Geometry Common Core State Standards
Oakland Unified School District English/ Language Arts Course Syllabus
 Oakland Unified School District English/ Language Arts Course Syllabus For Secondary Schools The attached course syllabus is a developmental and integrated approach to skill acquisition throughout the
Alignment of Australian Curriculum Year Levels to the Scope and Sequence of Math-U-See Program
 Alignment of s to the Scope and Sequence of Math-U-See Program This table provides guidance to educators when aligning levels/resources to the Australian Curriculum (AC). The Math-U-See levels do not address
Rendezvous with Comet Halley Next Generation of Science Standards
 Next Generation of Science Standards 5th Grade 6 th Grade 7 th Grade 8 th Grade 5-PS1-3 Make observations and measurements to identify materials based on their properties. MS-PS1-4 Develop a model that
FOR TEACHERS ONLY. The University of the State of New York REGENTS HIGH SCHOOL EXAMINATION. ENGLISH LANGUAGE ARTS (Common Core)
") FOR TEACHERS ONLY The University of the State of New York REGENTS HIGH SCHOOL EXAMINATION CCE ENGLISH LANGUAGE ARTS (Common Core) Wednesday, June 14, 2017 9:15 a.m. to 12:15 p.m., only SCORING KEY AND
FOR TEACHERS ONLY The University of the State of New York REGENTS HIGH SCHOOL EXAMINATION CCE ENGLISH LANGUAGE ARTS (Common Core) Wednesday, June 14, 2017 9:15 a.m. to 12:15 p.m., only SCORING KEY AND
Introducing the New Iowa Assessments Language Arts Levels 15 17/18
 Introducing the New Iowa Assessments Language Arts Levels 15 17/18 ITP Assessment Tools Math Interim Assessments: Grades 3 8 Administered online Constructed Response Supplements Reading, Language Arts,
Diagnostic Test. Middle School Mathematics
 Diagnostic Test Middle School Mathematics Copyright 2010 XAMonline, Inc. All rights reserved. No part of the material protected by this copyright notice may be reproduced or utilized in any form or by
MTH 141 Calculus 1 Syllabus Spring 2017
 Instructor: Section/Meets Office Hrs: Textbook: Calculus: Single Variable, by Hughes-Hallet et al, 6th ed., Wiley. Also needed: access code to WileyPlus (included in new books) Calculator: Not required,
Mathematics Scoring Guide for Sample Test 2005
 Mathematics Scoring Guide for Sample Test 2005 Grade 4 Contents Strand and Performance Indicator Map with Answer Key...................... 2 Holistic Rubrics.......................................................
Predatory Reading, & Some Related Hints on Writing. I. Suggestions for Reading
 Predatory Reading, & Some Related Hints on Writing I. Suggestions for Reading Reading scholarly work requires a different set of skills than you might use when reading, say, a novel for pleasure. Most
INTERMEDIATE ALGEBRA PRODUCT GUIDE
 Welcome Thank you for choosing Intermediate Algebra. This adaptive digital curriculum provides students with instruction and practice in advanced algebraic concepts, including rational, radical, and logarithmic
CENTENNIAL SCHOOL DISTRICT
 CENTENNIAL SCHOOL DISTRICT MIDDLE SCHOOL PROGRAM OF STUDIES 2017-18 Klinger Middle School Log College Middle School 1 Table of Contents Middle School Program Overview 3 Core Course Descriptions 4 Grade
Intermediate Algebra
 Intermediate Algebra An Individualized Approach Robert D. Hackworth Robert H. Alwin Parent s Manual 1 2005 H&H Publishing Company, Inc. 1231 Kapp Drive Clearwater, FL 33765 (727) 442-7760 (800) 366-4079
Grade 6: Module 3A: Unit 2: Lesson 11 Planning for Writing: Introduction and Conclusion of a Literary Analysis Essay
 Grade 6: Module 3A: Unit 2: Lesson 11 Planning for Writing: Introduction and Conclusion of a Literary Analysis Essay This work is licensed under a Creative Commons Attribution-NonCommercial-ShareAlike
School of Innovative Technologies and Engineering
 School of Innovative Technologies and Engineering Department of Applied Mathematical Sciences Proficiency Course in MATLAB COURSE DOCUMENT VERSION 1.0 PCMv1.0 July 2012 University of Technology, Mauritius