RITA NDAGIRE KIZITO. Dissertation presented in partial fulfilment of the requirements. for the degree of the Doctor of Philosophy
|
|
|
- Cameron Jennings
- 6 years ago
- Views:
Transcription

1 REALISTIC MATHEMATICS EDUCATION (RME) AS AN INSTRUCTION DESIGN PERSPECTIVE FOR INTRODUCING THE RELATIONSHIP BETWEEN THE DERIVATIVE AND INTEGRAL VIA DISTANCE EDUCATION RITA NDAGIRE KIZITO Dissertation presented in partial fulfilment of the requirements for the degree of the Doctor of Philosophy in the Faculty of Education at the University of Stellenbosch Promotor: Professor D.C.J. Wessels Co-Promotor: Professor D.B. Holgate December 2012
2 DECLARATION I, the undersigned declare that the work contained in this dissertation is my own original work and that I have not previously in its entirety or in part submitted it at any university for a degree. Signature RKizito.Date Copyright 2012 Stellenbosch University ii
3 SUMMARY The rationale for this study emerged from a realization that conventional instructional design approaches for introducing Calculus concepts, based on the logical sequencing and structuring of the concepts, did not adequately attend to or address students ways of thinking. This was particularly important in a distance education environment where learners depend on instructional texts to make sense of what is being presented, often without support from tutors. The instructional design theory of Realistic Mathematics Education (RME) offered a promising approach for designing learning sequences based on actual investigations of the ways in which students think. This study s focus was on trialling the process of RME theory-based design using the Fundamental Theorem of Calculus as an example. Curve sketching was prominent in this exercise. Applying RME required developing a hypothetical learning trajectory (HLT) while attempting to adhere to methodological guidelines of design research. In this project, the instructional designer s conceptualization and interpretation of the derivative-integral construct has had the most immediate implications for the study. The line of inquiry has been largely didactic, in that it was framed by a need to establish ways of introducing the teaching of a mathematical concept following instructional design principles. Throughout the project, the instructional design space has been contested, broken down, rebuilt and, ultimately, enriched by the contributions of the expert teachers and the engagement of participating students. The series of design experiments have revealed knowledge about student reasoning in this learning domain in relation to four main areas of quantifying change, curve sketching, general mathematical reasoning and symbol use. The primary contribution of this research has been a deeper understanding of the extent to which RME can be used as an instruction design theory for planning and introducing a distance teaching Calculus unit. From the study, it is clear that successful adoption of the RME theory is influenced and facilitated by a number of factors, including: careful selection of the concepts and mathematical structures to be presented; a team of experts (mathematicians and mathematics subject didacticians) to research, test and develop the learning activities; opportunities for student interactions; and time and resources for effective RME adoption. More involved research is required to get to the stage of the evolution of a local instructional theory around introducing the derivative-integral relationship as expressed in the Fundamental Theorem of Calculus. iii
4 OPSOMMING Die rasionaal van hierdie studie het uit die besef ontstaan dat konvensionele onderrigontwerpbenaderings vir die bekendstelling van Calculus konsepte, gebaseer op die logiese ordening en strukturering van die konsepte, nie voldoende beantwoord aan die eise van hoe studente dink nie. Dit was van spesifieke belang in die geval van afstandonderwys waar hierdie studente sin moet maak van wat aangebied word, dikwels sonder die ondersteuning van tutors. Die onderrigontwerpteorie van Realistiese Wiskundeonderwys (RWO) bied belowende moontlikhede om leertrajekte te ontwerp wat gebaseer is op werklike ondersoeke van hoe studente dink. Hierdie studie se fokus was om die RWO-gebaseerde teoretiese ontwerp se proses wat die Fundamentele Stelling van Calculus as voorbeeld gebruik, uit te toets. Krommesketsing was prominent in hierdie oefening. Die toepassing van RWO het vereis dat 'n leertrajek ontwikkel moet word terwyl aan die metodologiese vereistes van die ontwikkelingsondersoekbenadering getrou gebly word. In hierdie projek het die onderrigontwerper se konseptualisering en interpretasie van die afgeleide-integraalkonstruk onmiddellike implikasies gehad vir die studie. Die lyn van ondersoek was grootliks didakties van aard. Desnieteenstaande was die instruksionele ontwerpruimte voortdurend beding, afgebreek, herbou en uiteindelik verryk deur die bydraes van die bedrewe onderwysers en die betrokkenheid van die deelnemende studente. Die reeks ontwerpeksperimente het kennis blootgelê van hoe studente in hierdie veld redeneer met betrekking tot die volgende vier hoof areas: kwantifisering van verandering, krommesketsing, algemene wiskundige beredenering en die gebruik van simbole. Die primêre bydrae van hierdie navorsing is die dieper verstaan van die mate waarin RWO gebruik kan word as 'n instruksionele ontwerpteorie vir die beplanning en bekendstelling van 'n Calculus eenheid in afstandsonderrig.dit is duidelik vanuit die studie dat suksesvolle aanneming van die RWO teorie afhanklik is van 'n aantal faktore: 'n noukeurige seleksie van die konsepte en wiskundige strukture wat aangebied moet word; 'n span van bedrewe wiskundiges en wiskunde vakdidaktici om die leeraktiwiteite na te vors, uit te toets en te ontwikkel; geleenthede vir studenteinteraksies, en tyd en bronne vir effektiewe RWO aanpassing. Verdere toegespitsde navorsing hierop is nodig om die fase te bereik van die ontluiking van 'n lokale onderrigteorie oor die bekendstelling van die afgeleide-integraal verwantskap soos uitgedruk in terme van die Fundamentele Stelling van Calculus. iv
5 ACKNOWLEDGEMENTS First, I would like to express my gratitude to Professor Dirk Wessels who has been instrumental in pushing me on, even when I thought of giving up. I am also grateful to Professor David Holgate for remaining unassuming and allowing me to try and retrace learning mathematics. I hope I have not disappointed both of you. Special thanks to my lovely son, Dr Jimmy Kizito, who though younger, has taught me the art of commitment and dedication. Special thanks to my other lovely son Arthur for continuing to be an inspiration for me to live life to the full. Richard Kintu (R2), you have helped me in various ways and I am grateful for your existence in my life at this particular time. Above all other, the Almighty, my Lord who continues to guide and bless whatever I do. v
6 TABLE OF CONTENTS DECLARATION... II SUMMARY... III OPSOMMING... IV ACKNOWLEDGEMENTS... V TABLE OF CONTENTS... VI LIST OF FIGURES... IX LIST OF TABLES... XI CHAPTER I... 1 THE NATURE AND PURPOSE OF THE STUDY Introduction Study Background The Research Problem Teaching the basic Calculus Concepts Realistic Mathematics Education (RME) The research line of argument The Study Context (Unisa) Distance Education and Open Learning Research Questions driving the course of the study The Research Design Methodology Developing the learning sequence Delineations and limitations Assumptions Validity issues Significance of the Study Organisation of the Dissertation CHAPTER II LITERATURE REVIEW Introduction Lessons from History: Evolution of the FTC Forerunners of the FTC Genesis and development of the FTC Summary A Survey of Instructional Texts Introducing the FTC James Stewart (1998) Ostebee and Zorn (2002) Hughes-Hallett et al., (1999) The South African MALATI initiative Summary The Teaching and Learning of the Derivative-Integral Relationship Concept development Conceptual learning challenges in derivative-integral studies Covariational reasoning Teaching the derivative-integral relationship Summary Discussion vi
7 CHAPTER III REALISTIC MATHEMATICS EDUCATION AS AN INSTRUCTIONAL DESIGN FRAMEWORK Introduction The RME Framework What is RME? Guided re-invention Emergent modelling Didactical phenomenology of accumulation Foregrounding Perspectives A constructivist slant Semiotics and symbolizing The analytic language Five tenets of RME Summary CHAPTER IV METHODOLOGY Introduction Exploring Mobile learning adoption First baseline study involving the HTC phone Second baseline study involving the Outstart Mobile learning platform Lessons from the baseline studies Design Research Methodology The HLT Overarching mathematical idea Emergent models and the HLT Learning tasks First Phase: Preparation Framing the design experiments Pre-instruction test Second Phase: The Design Experiments The research instruments First design experiment Second design experiment Third design experiment Third Phase: Data Analysis General approach Analysis including the retrospective analysis Trustworthiness, repeatability and generalizability of findings Summary CHAPTER V FINDINGS AND ANALYSIS Introduction Re-inventing the Derivative-integral connection in the FTC expression The first HLT Samples of learning activities for the first HLT Examples of student responses, first HLT Responses to the post-test (task 7) and evaluation (task 8) Analysis of the first HLT The second HLT vii
8 Samples of learning activities in the second HLT Examples of student responses, second HLT Analysis of student interviews Responses to the post-test (Task F) and evaluation task Analysis of the second HLT The Third Leaning Trajectory Samples of student learning activities in the third HLT Examples of student responses, third HLT Responses to the evaluation task Analysis of the third HLT Critical Comments from RME Didacticians Comments from the Freudenthal Institute Comments from a local South African educator A way forward Retrospective Analysis Revisiting the HLTs The final envisioned HLT Challenges of RME adoption Conclusion CHAPTER VI OUTCOMES AND CONCLUSIONS Introduction Research Question Systemizing the derivative-integral relationship Learning from the development of the FTC expression Teachings from a didactical analysis : Research Question Developing the HLT RME heuristics Symbolizing Research Question Discussion Limitations to the study Recommendations Recommendations for instruction design for distance education Recommendations for further research REFERENCES APPENDICES Appendix A: The Mobile Pretest Appendix B: First HLT Appendix C: Second HLT Appendix D:Third HLT Appendix E: Comments from RME experts Appendix F: The Interview Schedule Appendix G: The Last Trajectory Questions viii
9 LIST OF FIGURES Figure 1.1: Tangent problem... 7 Figure 1.2: Area problem... 7 Figure 2.1: Sum of rectangles as an approximation of the area of the region R Figure 2.2: Oresme s De configurationibus qualitatumone Figure 2 3: Path of Newton s point Figure 2.4: Leibniz differential quotient Figure 2.5: A graphical representation of the curve C Figure 2.6: The first draft learning sequence Figure 2.7: The area function g(x) Figure 2.8: Graph of object A and object B Figure 2.9: Bottle problem Figure 2.10: Cylinder, sphere and cone Figure 2.11: Tracing out the area function Figure 4.1: Model of the HTC phone used Figure 4.2: Representation of questions in the print and mobile phone versions Figure 5.1: Analytic process of each HLT Figure 5.2: Pre-Test for first HLT Figure 5.3: Task 2, first HLT Figure 5.4: Task 4(a), Question 1, first HLT Figure 5.5: Task 4(a), question 2, first HLT Figure 5.6: Question 2- I of task 5, first HLT Figure 5.7: Some Task 5 questions, first HLT Figure 5.8: Task 6, from speed to distance, first HLT Figure 5.9: Student Constructions, task 2a, first HLT Figure 5.10: Student Constructions, task 2b, first HLT Figure 5.11: Task B second HLT Figure 5.12: Preliminary activity-task C- HLT Figure 5.13: Task D activities- HLT Figure 5.14: Revision question 6(f) Figure 5.15: Task E, second HLT Figure 5.16: Student graphs for task B, second HLT Figure 5.17: Student 10 s response to Task B-HLT Figure 5.18: Student s sketches, Task C, second HLT Figure 5.19: Students 8, 12 & 10 s velocity sketches, task D, Q5 HLT Figure 5.20: Student 10 s response to Q11 (f)- HLT Figure 5.21: Learning activity, HLT Figure 5.22: Assignment 1, activity 1,HLT ix
10 Figure 5.23: Activity 2, HLT Figure 5.24: Questions for task involving h, activity 2, HLT Figure 5.25: Q6, assignment3, HLT Figure 5.26: Activity 3, first part, HLT 3 (taken from MALATI Group questions) Figure 5.28: Calculating the exact distance, activity 3, HLT Figure 5.29: Activity 3, linking function (1) and function (2) graphically, HLT Figure 5.30: Assignment 3, Q1, HLT Figure 5.31: Linking antiderivative, area function and definite integral, HLT Figure 5.33: Assignment 4, HLT Figure 5.34: Student 15 s response to activity 1, HLT Figure 5.35: Student 13 s response to activity 1, HLT Figure 5.36: Seedling growth graph, Student 14 & Student 15, HLT Figure 5.37: Students responses to activity 2, HLT Figure 5.38: Graphical representation, activity2, HLT Figure 5.39: Student 14 and Student 15 s graphs for assignment 3, Q1, HLT Figure 5.40: Student 15 s response to Q3, assignment 4, HLT Figure 5.41: Screenshot of interactive learning activity (Hoffkamp, 2010) Figure 5.42: Three containers filling with water Figure 5.43: Student 10 s responses to part of task C Figure 5.44: Student 15 s responses to activity 1, HLT Figure 5.45: Final envisioned HLT Figure 5.46: An applet for reasoning about the rate-of-change Figure 5.47: An applet for reasoning about the FTC x
11 LIST OF TABLES Table 2.1: Mental abilities and mental structures Table 2.2: Framework for Covariation Reasoning (Carlson, Larsen & Lesh, 2001) Table 2.3: FTC framework Table 3.1: Emergent model heuristic Table 3.2: Combined Nixon (2005) and Gravemeijer (1999) s models Table 4.1: Four Activity Levels Table 4.2: Design Matrix for learning activities 1 and Table 4.3: Design Matrix for learning activities 3 and Table 4.4: Summary of elements in teaching texts Table 4.5: First HLT tasks Table 4.6: Second HLT tasks Table 4.7: Third HLT tasks Table 5.1: Student responses to function questions Table 5.2: Student responses to derivative questions Table 5.3: Student responses to integral questions Table 5.4: Student responses to task 4(a) question Table 5.5 Student responses to task4 (a) Question Table 5.6: Task 5 responses Table 5.7: Student Responses to Q2-I Table 5.8: Task 6(b) Calculating the accumulating distance Table 5.9: Responses to 6(b), improving the estimation Table 5.10: Responses to integral question Table 5.11: Analyzed second HLT activities Table 5.12: Student derivative definitions, second HLT Table 5.13: Student interpretations of the difference quotient Table 5.14: Student integral definitions- HLT Table 5.15: Initial graphical interpretation, second HLT Table 5.16: Student 7 s reasoning on Task b - HLT Table 5.17: Student 11 s reasoning on Task b HLT Table 5.18: Student s responses to task C, HLT Table 5.19: Images of Mental Actions portrayed in covariariton reasoning Table 5.20: Student responses to Task D, Q 2(a) - HLT Table 5.21: Student responses to Task D. 2(b) - HLT Table 5.22: Student responses to Task D, Q 6(f) - HLT Table 5.23: Student derivative definitions - HLT Table 5.24: Student difference quotient/derivative definitions - HLT Table 5.25: Student definitions of the area function A(x) xi
12 Table 5.26: Differentiating the area function, HLT Table 5.27: Student responses to Task E, revision question 11- HLT Table 5.28: Excerpts of student interview responses Table 5.29: A function pair Table 5.30: Activities analyzed as part of the second HLT Table 5.31: Students' conception of the derivative-hlt Table 5.32: Students' interpretation of the difference quotient-hlt Table 5.33: Student integral definitions-hlt Table 5.34: Student initial graphical interpretations of motion-hlt Table 5.35: Student 13 and Student 15 s response to assignment 2, Q6, HLT Table 5.36: Scheme for rating students responses to assignment 4, HLT Table 5.37: Student 14 and Student 15 s responses to Q2, assignment4, HLT Table 5.38: Advancing students levels of knowledge of the derivative-integral link Table 5.39: Student initial notions of the derivative and integral Table 5.40: One student s graphical representation of activity Table 5.41: One student s response to the first activity Table 6.1: Approaches for presenting the FTC xii
13 CHAPTER I THE NATURE AND PURPOSE OF THE STUDY 1.1. Introduction This dissertation examines the developmental efforts required to adapt the instructional design perspective of Realistic Mathematics Education (RME) to the teaching and learning of Calculus through distance education. This is achieved through an exploration of the surfacing of forms of reasoning among fifteen pre-college and university students who participated in a Calculus distance design experiment. The methodology employed is design research (Gravemeijer, 1994; Edelson, 2002; Kelly & Lesh, 2000), where the primary goal is to understand and improve the process of learning. The dissertation builds on previous research based on RME as an instructional design theory. As part of this approach, students learn mathematical ideas by using their own reasoning to engage in mathematical tasks in a process known as guided re-invention (Bakker, 2004; Doorman, 2005; Freudenthal, 1973; Gravemeijer, 1994; Treffers, 1987; Rasmussen and Blumenfeld, 2007; Zandieh & Rasmussen, 2010). They can re-invent mathematics under the guidance of a teacher and instruction design (Bakker, 2004, p.6). The central aim of this study is to contribute to an understanding of how to support students efforts in making sense of mathematical concepts while studying at a distance. The derivative-integral relationship as expressed in the Fundamental Theorem of Calculus (FTC) provides an illuminating example for potential RME adoption. A fundamental part of this study has been a set of learning materials in which sequences for introducing the relationship between the two elementary Calculus concepts have been designed. The materials appear in a paper based format (see Appendix D) as well as in web-based formats available at connect.sun.ac.za/course/view.php?id=13 and at In this chapter, I discuss the goals of the study. I present the background, problem statement, research questions and the study context. This is followed by a discussion of why the chosen research questions are of interest, and why seeking answers to these research questions is a small but valuable contribution to the field of instruction for introducing basic mathematical concepts through distance education. 1
14 this expression can be written as :., where is an antiderivative of, that is, then Part II of the FTC Suppose is a continuous function on an interval and 386). It is the part of the Fundamental Theorem of Calculus that illustrates that integration is inverse to differentiation. then differentiate the result, we get back to the original function (1998, p. and integrate first we if that say equations these Stewart, to According is, for. This can be re-written as: that Stellenbosch University Study Background For the past two decades, a number of studies seeking to find ways of supporting undergraduate Calculus instruction have been conducted internationally (Bookman & Friedman, 1994; Roddick, 2003; Schwingendorf, 1999), and locally in South Africa (Engelbrecht & Harding, 2001; 2005a). Among the problems cited from undergraduate mathematics research, a consistent problem is that of students inability to gain understanding of the basic Calculus concepts and how they are related (Orton 1983a; Fernini-Mundy & Graham 1994; Doorman, 2005). Some of the investigations conducted recounted difficulties associated with students understanding of the FTC, (Thompson, 1994; Saldanha & Thompson, 1998; Thompson & Silverman, 2008; Estrada-Medina, 2004). This is the theorem that connects the two Calculus concepts-the derivative and the integral. It is important to stress that I am referring to single variable real-valued functions. The theorem can be stated symbolically in two parts as follows: Part I of the FTC: Suppose is a continuous real-valued function on an interval [ ] then the function defined by, is an antiderivative of 2
15 if we take a function, first differentiate it, and then integrate the result, we arrive back at the original function, but in the form (Stewart, 1998, p. 388). The first part of the theorem, sometimes referred to as the first Fundamental Theorem of Calculus, illustrates how integration can be inverted by differentiation. The second part of the theorem provides an efficient method for computing the definite integral of a function from one of its many antiderivatives. Calculus plays an important role as a service course and a gateway to other areas of undergraduate learning such as Engineering, Economics, Biotechnology and Commerce (Bressoud 1992; Moore 2005; Roddick, 2003). For most universities, the introductory Calculus module forms part of a contingent of the basic mathematical modules within these applied sciences. Student registrations for the introductory Calculus modules are usually high. For example, at the University of South Africa (Unisa), there were 1318 students in 2008, 1052 in 2009 and 1000 students in 2010 registered for the introductory Calculus course. The drawback is that most of the students registering for this introductory Calculus module were not mathematicians. Consequently, these students needed additional instructional support in order to successfully navigate their way into courses requiring more advanced mathematical thinking. From a didactical point of view, the FTC seemed an appropriate object for a research investigation because it had the potential of offering students a way of creating a structured understanding of the basic Calculus concepts, through an understanding of the derivative-integral relationship. The conjecture was that engaging students in learning activities where real processes in the physical world such as water flowing into a container or an object moving would provide opportunities for exploring student reasoning involving the basic mathematical concepts. These analyses could afterwards be linked to the solving of spatial problems dealing with increases in length, area, volume (accumulation or integration), and problems dealing with speed, slopes, tangents (rates of change or differentiation). Such applications are used in Applied Mathematics, Physics, Engineering, Finance and the Biological Sciences. Self-study materials built around the mentioned ideas were potential sources for nonmathematicians developing an intuitive understanding of the basic Calculus concepts. A number of studies exploring student understanding of the FTC contain descriptions of student interpretations of the FTC as a formal mathematical expression, and the type of reasoning required for mastering this concept. One of the difficulties cited in 3
16 research is students failure to construct and coordinate dynamic images of the constituent measures of an accumulating quantity and link them to its rate-of-change and accumulation (Thompson, 1994). According to Thompson, students often miss one of the intellectual hallmarks of the development of Calculus - the realization that the accumulation of a quantity and the rate-of-change of its accumulation are tightly related (Thompson 1994, p.8). Thompson (1994) distinguished covariation as one of the basic ways of reasoning students required to master the FTC. Covariational reasoning refers to cognitive activities involved in coordinating two varying quantities while attending to the ways they change in relation to each other (Carlson, Jacobs, Coe, Larsen & Hsu, 2002, p.4). Research indicates that student acquisition of covariation leads to a better understanding of the FTC (Carlson, Jacobs & Larsen, 2001; Carlson, Persson & Smith, 2003; Estrada-Medina, 2004). Carlson, Persson and Smith s (2003) study helped a group of students gain understanding of the FTC by exposing them to a set of learning tasks using covariation as a design principle. Estrada-Medina and Sánchez- Arenas (2006) extended the covariation principle into the design of technology-enhanced dynamic situations to promote the understanding of the relationship between the basic Calculus concepts. Their experiment had promising results showing that simulated dynamic situations were capable of enhancing students ability to make connections between the accumulation of a quantity and its rate of change. Smith (2008) utilized the covariation framework to construct instructional sequences, followed by an observation of one student s responses to the set problems, and an elaboration of what an understanding of the FTC entailed. Her study demonstrated the usefulness of the framework when developing and analyzing student reasoning abilities essential for understanding the FTC. Using a different framework, Pantozzi (2009) offered detailed descriptions of how students built meanings of the FTC based on their co-ordinations of different representations (graphical, numerical and verbal) when responding to FTC related problems. Montiel (2005), on the other hand, stressed that student mastery of the FTC and its applications was based on student mathematical fluency. Mathematical fluency was defined in terms of efficiency (development of appropriate schema and strategies for solving problems); accuracy (correct usage and interpretations of mathematical symbols); and flexibility (recognizing when a selected strategy was not working and selecting an alternate strategy). Understanding the FTC involves the recognition that the two processes (integration and differentiation) are able to invert each other s effect when acting on a particular 4
17 function. This dynamic relationship is represented using equations. According to Kinard and Kozulin (2008), equations, together with the number line, the table, the curve in the - coordinate plane and the language of mathematics, are symbolic devices which have over the years, evolved into mathematical psychological tools as responses to cultural needs. Kinard and Kozulin (2008) regard mathematics as having its own culture with norms and a language uniquely different from day-to-day ways of doing things. In their analysis of mathematics learning, they assert that the " problem with current mathematics instruction is that the symbolic devices are perceived by students as pieces of information or content rather than tools or instruments to be used to organize and construct mathematical knowledge and understanding (Kinard & Kozulin, 2008, p. 3). In view of these research findings, the development of a series of learning activities aimed at supporting students development of increasingly sophisticated forms of covariational reasoning appeared to be a research project worth exploring. It was envisaged that starting with activities from which the everyday concepts of accumulation and rate-of-change were interrogated, a worthwhile didactical and research task involving the development of a learning sequence about the rate-ofchange and accumulation of a quantity had the potential of becoming the springboard from which an understanding of the integral-derivative conceptual relationship could be built. One major drawback of the studies quoted was that they did not sufficiently address how students could be assisted in using their own informal strategies to link their intuitive thinking about accumulation and rate-of-change to an understanding of the two basic Calculus concepts. Studies designed to illuminate the kinds of insights oriented at students development of imagery and forms of expression to support their later insight into important ideas in Calculus (Thompson 1994, p. 243) are scarce. The need to craft learning environments in which Calculus students transform their informal thinking into more formal ways of mathematical reasoning has always been on the mathematics education research agenda (Tall & Vinner, 1981; Doorman, 2005). One of the responses to this challenge has been the adoption of modern instructional design practices informed by social constructivist learning theories such as the Realistic Mathematics Education (RME). As part of the RME framework, students work collectively with peers and tutors to re-discover mathematical ideas for themselves (Gravemeijer, 1999; Zandieh & Rasmussen, 2007). Although studies describing the RME adoption process at undergraduate level exist, these occur in more advanced courses involving differential equations and linear algebra (Rasmussen & King, 2000; 5
18 Rasmussen & Blumenfeld, 2007). This research usually occurs in face-to-face, not distance learning environments. This study was an attempt to design contextual problems and use students strategies to solving problems as sources from which an understanding of the FTC could be extended. Projects such as this dissertation are useful for informing instructional design principles, and for providing insights into student reasoning while engaging with learning activities. The study highlights aspects that need to be addressed and the challenges designers and distance educators are likely to encounter when adopting RME as an instructional design theory for introducing Calculus concepts The Research Problem Teaching the basic Calculus Concepts Traditionally, when introducing the basic Calculus concepts to students, teachers use symbols (graphs, tables and algebraic notations) that have been constructed by mathematicians to represent and describe the dynamics of systems undergoing change. According to Lidstone (1992, p. 1), a system of concepts and methods or a symbolic technology is used for quantitatively representing dynamic situations and for providing a means to describe the nature of how situations change. Within this system, where functions are the main objects of study, variables represent the varying quantities that make up the functional expressions, and graphs are inscriptions of the mathematical objects formed. For the mathematician, the teaching expert or the instructional designer, the graphs and literal expressions carry particular mathematical meanings. For example, the difference in the functional values relate to the amount of change in a quantity, while the rate-of-change refers to the ratio of change of one quantity to a simultaneous change in another. It is common practice in traditional introductory Calculus texts to start the discussion about the basic Calculus concepts with a graph from which two central problems of Calculus are addressed. The first central problem is usually about understanding what is meant by the (instantaneous) rate-of-change of with respect to at which is interpreted as the slope of the tangent to the curve at, referred to as the tangent problem (Figure 1.1). The second central problem, considered as the area problem, is about finding the total area of the region lying under the curve from to. In this case is bounded by the graph of a continuous function, where, the vertical lines and and the - axis (Figure 1.2), (Golden, 2006; Stewart, 1998). 6

 and Lakatos (1976) suggest that in order to overcome this inadequacy, teaching ought to start by")
 assert that programming holds the key to conceptual learning, while Tall, Smith & Piez (2008) claim that computer based")
 perspective for teaching mathematics allege that using an already-made symbol system as the starting point")
19 Figure 1.1: Tangent problem Figure 1.2: Area problem To the majority of students, mathematical knowledge is isolated from personalized forms of experiences and reasoning, making mathematical learning a hurdle. There is a gap between a student s intuitive knowledge and the formal world of Calculus (Tall 1991; Tall & Meija-Ramos 2004). In chapter 2 of this dissertation, I mention how Freudenthal (1991) and Lakatos (1976) suggest that in order to overcome this inadequacy, teaching ought to start by acknowledging and linking with student ways of knowing. Recent research points to recommendations of using computer tools for modelling Calculus learning activities. For example, Dubinsky and McDonald (2001) assert that programming holds the key to conceptual learning, while Tall, Smith & Piez (2008) claim that computer based dynamic visualization tools have the ability to enhance Calculus concept formation. Proponents of the Realistic Mathematics Education (RME) perspective for teaching mathematics allege that using an already-made symbol system as the starting point for developing learning sequences aimed at introducing mathematical concepts is problematic. Students often fail to see the intended mathematical concepts from these symbolizations (Gravemeijer & Doorman, 1999; Doorman, 2005). They are unable to 7
20 interpret the symbolic representations in a manner similar to the experts because the symbols refer to objects that students still need to construct (Bakker, 2004, p. 4). I elaborate more on this issue in chapter 3 of this dissertation. The following question was basically the driving force for me as a researcher/instructional designer behind the study: Is it possible to bridge the gap between a student s intuitive knowledge and formal Calculus by introducing a learning sequence designed with the aim of helping students to develop or re-invent the symbols themselves? Could this be successfully achieved at a distance? The instructional design theory of Realistic Mathematics Education (RME) provided a possible solution mechanism Realistic Mathematics Education (RME) Freudenthal (1991) alluded to the possibility of bridging this informal-formal learning gap or making the introduction of Calculus concepts easier when he suggested preceding the introduction of Calculus by a specific learning process, before algorithmization. It is an approach (in principle by graphic representation) initially merely qualitative but later on quantitatively refined (if possible). It aims at understanding and interpreting ideas such as the steepness of a graph and areas covered by the moving ordinate segment, may be even curvature, in contexts where the drawing of the curve mathematizes a given situation or occurrence in primordial reality (Freudenthal, 1991, p.55). This approach is engrained in the instructional design theory of Realistic Mathematics Education (RME) on which this dissertation is based. Freudenthal s (1991) underpinning view of mathematics as a human activity connected to reality makes it useful for fostering the study of Calculus with understanding. The approach capitalises on mathematizing as a central learning activity together with guided re-invention and emergent modelling as central processes within the learning experience (Gravemeijer, 1994; Bakker, 2004; Zulkardi, 2002). Guided reinvention involves reconstructing a natural way of developing a mathematical concept from a given problem situation Emergent models are models that initially represent problem situations but later on develop into models of abstract mathematical objects and relations (Bakker, Doorman & Drijvers, 2003). The choice of RME as an underlying theory for this study relates to its potential to address issues of instructional design (Bakker, 2004). Traditional approaches of instruction design with generic prescriptive sequences for achieving instructional goals 8
21 (Gagne, 1996; Merrill, 2002; Reigeluth & Moore, 1999) have not been satisfactorily compatible with mathematics education. They lack an empirical base to support instruction design assumptions (Laurillard, 1993; Wilson, 1995). Curriculum developers (myself included), are left with very few instructional design models based on actual accounts of student engagement with the learning tasks from which instructional sequences can be refined (Simon, Saldanha, McClintock, Karagotz Akar, Watanabe & Zembrat, 2007). Using RME as an instructional design perspective could alleviate this problem, as RME is embedded in mathematics education research. The benefits brought to the study by RME are, first of all, inherent in the RME philosophy and view of mathematics as a human activity. The advancement of the RME theory is based on a continual focus, adaptation and reflection on actual student engagement with mathematical tasks, not only on researcher assumptions (Van den Heuvel-Panhuizen, 1996). The second benefit has to do with the design research methodology of collecting data. This methodology combines the development of instructional means and how these means support student reasoning (Bakker, 2004). Actual accounts of student engagements with learning tasks form the data corpus. A more detailed elaboration of this research methodology is presented elsewhere. As a researcher for this project, I had to reflect on, and use student contributions to inform each subsequent design activity. In the process of analyzing the data, I developed an understanding of the ways in which students reasoned and how this could be enhanced to bring about the desired learning. The process and the outcomes of design research were transformed into exemplars for future instructional design. The act of didactising (organizing and structuring instruction) is beneficial to the teaching of mathematics because of these results. While horizontal didactising results in new instructional courses and sequences, vertical didactising results in new design principles, strategies, or processes (Yackel, Stephan, Rasmussen & Underwood, 2003.p 101). The third benefit arises because RME addresses challenges unique to mathematics education practice. The challenges include difficulties students face while learning. They involve areas such as incomplete conceptual development, a lack of sufficient problem-solving practices, and the occurrence of a cognitive gap between students intuitive knowledge structures and the seemingly abstract structures of mathematical knowledge. This study is an addition to the growing number of RME-based projects at undergraduate level (Gravemeijer & Doorman, 1999; Rasmussen & King, 2000). It is also a reformative approach to instructional design that places the learning of 9
22 mathematics with understanding of specific students, and in specific classrooms, at the center of instructional innovation (Cortina, 2006, p. 40). In dedicated distance education institutions such as the University of South Africa (Unisa) where instruction design has a profound influence on the way university lecturers teach mathematics effectively, and on what students end up learning, it made sense to integrate RME into an instruction design framework to improve Calculus instruction The research line of argument The key to designing instruction effectively depends on the ability to understand and take full advantage of how students develop mathematical concepts (Simon et al., 2007). Within the context of introducing the derivative-integral relationship, the aspect of learning being investigated relates to linking student s informal strategies to a process at the beginning of the development of an understanding of the basic Calculus concepts, but before the formalization of each concept separately. This investigation sought to establish how this connection could be developed instructionally. It was an attempt to identify possible triggers that could motivate the learner to meaningfully engage with the derivative and integral concepts. The challenge was to achieve this in a distance-learning environment where the learners did not have the normal support of a physical tutor to guide the instruction. Since it was not possible to physically observe students performing learning tasks or watch them participate in group discussions, the data collected was mainly based on student written responses to learning tasks. The module was designed to be offered prior to a formal exposition of the Fundamental Theorem of Calculus (FTC) dealt with in a typical first Calculus undergraduate course. The study s focus was to show the inverse property of the integral-derivative relationship. The strategy adopted can be compared metaphorically to what goes on when one has to complete a jigsaw puzzle. The big idea of the resultant picture is presented before the actual process of piecing the puzzle together. In light of the preceding discussion, the argument for this project was that exposing students to a learning sequence using guided re-invention with student constructions as an instruction design principle would enable students to develop the reasoning about the relationship between a quantity s accumulation and rate-of-change required to build an initial foundational understanding of the FTC. 10
23 1.4. The Study Context (Unisa) Distance Education and Open Learning The context of the current research is a distance teaching higher education institution - the University of South Africa (Unisa). Unisa is a comprehensive university with a yearly registration in the region of students, predominantly from South Africa but increasingly from the rest of Africa and the world. As a response to the demands of the 21 st century, print-based forms of distance education delivery are being augmented or replaced with technology-enhanced learning-pedagogies based wholly or partially on networked computers having access to web resources (text, multimedia and software). There are three challenges facing Unisa that have a bearing to this study. First, Unisa has a diverse student population with the majority being products of a weak and fragmented basic education, and who require remedial instruction. Second, all learning transactions occur at a distance using printed materials with minimal tutor-student interactions, usually in the form of a few tutorials, informal face-to-face sessions and the occasional telephone conversation with lecturers. Third, the bulk of Unisa students have no access to networked computers (Brown & Mokgele, 2007). Technology is continually influencing Calculus instruction. Many forms of web-based dynamic environments are being used to enhance student understanding of Calculus concepts. Technology-enhanced environments can afford opportunities for learning mathematics in a way that was not possible before. Computer algebra systems, such as Mathematica, Maple, Derive, MathCad, MatLab (Crowe & Zand, 2001), can now allow students to learn Calculus in an interactive way, enabling them to manipulate and reason with mathematical objects on the screen. Unfortunately, most African institutions have not managed to catch up with the acceleration and proliferation of technologies because of issues of access and affordability. The mobile phone is well positioned to provide a solution to this dilemma. Motlik (2008), who has compared mobile phone technology diffusion in Asia and Africa to that in North America, suggests that it would be erroneous for instructors in the developing regions to adopt web-based learning. The majority of students in these areas already have access to mobile phones, and the devices are easy to use and affordable. The power of mobile learning devices is that they can allow student access to electronic learning materials from anywhere and anytime (Vavoula & Sharples, 2002; Leung & Chan, 2003; Kinshuk & Sutinen, 2004). As a small proof of concept exercise, the mobile phone was used to support pre-course diagnostic testing in order to establish learners prior knowledge at the beginning of the learning unit. In addition, the web- 11
24 based version of the learning unit was developed in such a way that it was accessible from a mobile phone Research Questions driving the course of the study The aim of this research project was to examine the developmental efforts required to adapt the instructional design perspective of RME to a unit introducing the relationship between the basic Calculus concepts (the derivative and integral) at a distance. The study aimed to respond to the following research question: How, and to what extent, can the RME theory be used as an instructional design perspective in the process of designing and developing a unit introducing the relationship between the two basic Calculus concepts (the derivative and the integral) at a distance? In considering how RME could be used to inform the instructional design process, I also investigated how a group of students reasoned about the derivative-integral relationship as expressed in the FTC. More specifically, the study was designed to answer the following questions: What does it mean to understand the derivative-integral relationship expressed in the Fundamental Theorem of Calculus at undergraduate level? What does the literature say about this understanding? What are the epistemological obstacles and recurring conceptual barriers? How have they been resolved in the past? How can this understanding be specified in such a way that it can orient instructional decision making? How can an introduction to this understanding be supported using the RME theoretical perspective at a distance? What type of activities should be designed to promote the desired kind of reasoning required to gain an understanding of the relationship between the derivative and the integral? How does a group of students studying at a distance reason about the derivativeintegral relationship? What are the advantages and disadvantages of adopting RME as an instructional design perspective for teaching Calculus at a distance? The drive to conduct research on how to support students efforts to make sense of the relationship between the derivative and the integral is shaped by three influences. First, understanding this relationship is problematic to most students. Second, a mechanism whereby students are guided to use their own constructions to develop an 12
25 understanding of mathematical concepts could be useful in bringing about meaningful learning. RME is a viable option, since it is an instructional design theory in which students learn mathematical ideas by using their own reasoning to engage in mathematical tasks (Bakker, 2004, Doorman, 2005; Freudenthal, 1973; Gravemeijer, 1994; Treffers 1987). Third, on the whole, there is a shortage of empirically supported and data-driven instructional design models to inform the creation and refinement of instructional sequences (Simon et al., 2007). Most instructional design models used are not based on actual accounts of student engagement with the learning tasks. The anticipation was that this study would add to efforts designed to develop an understanding of the processes by which learners learn through their own activity and engagement with learning tasks (Simon et al., 2007, p. 55). The undertaking for this project involved devising a mechanism in which students could experience the development of the FTC equation as if they were re-inventing it themselves. The intention was to get to a stage where students would begin to internalize both the integral and the derivative as mathematical processing tools, where the integral was visualized as mathematical object representing accumulation, while the derivative represented a rate-of-change. Results from this research indicate that successful implementation of this undertaking by means of distance education required better provision for tutor-student and student-student interaction The Research Design Methodology The methodology used in this project can be categorized as design research. Design research consists of a family of methodological approaches in which instructional design and research are interdependent (Cobb & Gravemeijer, 2008, p. 68). This orientation is consistent with the new approaches to research in mathematics education whose trend is towards using qualitative interpretative design research to address instructional problems related to teaching and learning mathematics (Bakker 2004; Cortina, 2006; Gravemeijer & Bakker, 2006; Gravemeijer 1994). These design research projects are characterised as iterative and theory based attempts to simultaneously understand and improve educational processes (Gravemeijer & Bakker, 2006, p.1). The product of these types of research is usually a theory-driven and empirically-based instruction theory. Design research usually consists of cycles of three phases: 13
26 Preparation and design Design experiment(s) Retrospective analysis. In the preparatory and design phase, the instructional goals are clarified, the hypothetical learning trajectory (HLT) is delineated and the theoretical context of the design outlined. The purpose of the HLT is to frame a possible path a learner could take to master the reasoning and understanding required to comprehend the concepts involved. In developing the HLT, the researcher is able to predict and refine a course map along which students mathematical reasoning evolves in the context of the learning activities (Bakker, 2004). A series of design experiments in which the HLT is tested and refined are conducted in the experimental phase. The aim of these experiments is to improve the learning process under scrutiny and the means by which it is supported. Finally, a retrospective analysis is carried out to establish if the intended research goal has been achieved. The four questions framed in section 1.5 were used to guide the data collection and analysis. In order to investigate the first question, brief historical and didactical analyses related to FTC teaching and learning were conducted through a literature review of mathematics education research. An empirical inquiry involving the development of a HLT supported by the literature review was conducted and inputs from RME design experts were used to investigate the second question: How can an introduction to this understanding be supported using the RME theoretical perspective at a distance? The analysis of student responses to the tasks provided the answers to the third question: How did a group of students reason about the derivative-integral relationship? Adaptations of Toulmin s (1969) model of argumentation where one makes a claim and then looks for evidence to support the claim were used to analyze student responses in order to characterize their forms of reasoning. The approach to the analyses had elements of Smith and Osborn s (2007) approach to qualitative data analysis termed Interpretive Phenomenological Analysis (IPA). This is an analysis where the researcher attempts to explore in detail how participants are making of their personal and social world (Smith & Osborn, 2007, p.53). Answers to the fourth question concerning the merit in adopting RME as an instructional design perspective for teaching Calculus at a distance were drawn from an analysis of data collected from the first three questions. This project focused on investigating the learning of three cohorts of individual students as they participated in a distance-learning module, introducing the derivative-integral 14
27 relationship. The first cohort was made up of six students, the second of another six students and the last cohort consisted of three students. All participating students were volunteers. I interacted with two of the cohorts (first and third) consisting of Unisa distance students. I analyzed contributions of the six Ugandan high school students forming the second cohort. A teacher assisted with overseeing student activities and interviews. The documentation of the learning accounts produced in this project is mainly based on student written responses to tasks, supported with a few interview records. Details of the methodology appear in Chapter IV. The qualitative data obtained from the three cycles of design was analyzed individually and then finally in the retrospective analysis. The written accounts of students responses provided an indication of the emergence of ideas among students as they participated in the distance design experiments. Although it might not seem practical to allocate almost 10 hours of instructional activity just to come to an understanding of the derivative-integral relationship, this type of in-depth work involving a small number of students proved useful in supporting the development of a learning activity design framework. The final framework for supporting the instruction design for introducing the FTC consists of five main learning activities: 1) Predicting through a comparison of two varying quantities; 2) Analysing the different aspects of a varying quantity; 3) Explaining the notion of average rate-of-change and the idea of an instantaneous rateof-change; 4) Characterizing the accumulation function from given illustrations and/or examples; 5) Recognising the reciprocity of the derivative-integral relationship. Details appear in Chapter VI Developing the learning sequence The development of a learning sequence of tasks and activities that make up a conjectural learning trajectory or HLT (Simon, 1995) has been at the heart of this investigation. In developing the HLT, the researcher is able to predict and refine a course map along which students mathematical reasoning evolves in the context of the learning activities (Bakker, 2004). For this study, the trajectory was developed according to RME design heuristics of guided reinvention and emergent modelling. In order to contextualize the adaptation of the learning sequence into the RME frame of instructional design, I needed to identify the starting points of the HLT, the anticipated effect on the learners using the trajectory, and, more importantly, models for levels of cognitive development on which to map the students mathematical reasoning progress. This was achieved by briefly looking at the historical development of the FTC, the teaching approaches used in selected textbooks to present the theorem, and challenges students faced as they were introduced to the FTC. These issues are 15
28 explored in Chapter II in the literature review and in Chapter III which provides a discussion of the theoretical framework. Additional frames of reference were required to describe the research problem and findings in a language commensurate with mathematical education research. These frames of reference were used to provide descriptions of initial student s understandings of the derivative and integral concepts, and marked changes in their mathematical reasoning as they responded to tasks. The first reference frame is Tall and Vinner s (1981) distinction between concept image and concept definition. While concept definitions are usually presented in precise mathematical language, the concept image is more encompassing, defined as the total cognitive structure that is associated with the concept which includes all the mental pictures and associated properties and processes (p. 152). Subjecting students to tasks that could tap into a glimpse of their concept images held the potential to expose where they were at variance with the formal representations and where they required support. Another reference frame was extracted from Nixon s (2005) synthesis and development of levels of learning abstract algebra. The reference frame was particularly useful when combined with Gravemeijer s (1999) emergent model task design heuristic. While Gravemeijer s levels (informal, pre-formal and formal) refer to the levels of student engagement, Nixon s levels address mathematical thought structures and processes. The aim was to have the combination of both models make available a clear and grounded model for developing the HLT and describing students levels of mathematical reasoning. This combined model is introduced in Chapter II and refined in Chapter IV. The third reference frame attempted to use the ideas of cognitive functions and psychological tools or symbolic devices. This is borrowed from Kinard and Kozulin s (2008) Rigorous Mathematical Thinking (RMT) theory for conceptual formation. A cognitive function is a specific and deliberate thinking action that a student executes with awareness and intention (Kinard & Kozulin, 2008, p. 9). Each cognitive function has its own conceptual and action component that allows it to operate individually, or with other functions towards conceptual development. The authors give an example of comparing as a cognitive function. The conceptual part of comparing involves finding similarities and differences between objects, while the mental action is the actual feat of identifying features common or different in the objects. Kinard and Kozulin, (2008) identify five cognitive functions required for understanding variables and functional relationships. These include preserving constancy, comparing, analyzing, forming 16
29 relationships and labelling (p. 10). Traces of these functions are visible in the revised HLT in Chapter IV. The notion that cognitive development is effected through psychological tools was drawn from Vygotsky s (1978) social cultural theory. Over the years, society has developed a number of symbolic devices (such as signs, symbols, tables, writing and graphs) to organize and communicate ideas from different disciplinary areas. True learning occurs when individuals appropriate and internalize these symbolic mediators to form inner psychological tools (Kinard & Kozulin, 2008). Since mathematical reasoning requires substantial symbolic interpretations, it is crucial that students appropriate and internalize mathematical symbolic tools (equations, the number line, the table, the x-y coordinate plane and the language of mathematics) into inner psychological tools. Once this is accomplished, students can create internal mental images of these devices and use them as calculating or reasoning tools for solving mathematical problems. For example, the table is a symbolic device widely used as a cognitive tool for connecting data input and data elaboration (Kinard & Kozulin, 2008, p.97). There has been an attempt to encompass conceptual understanding construction requiring the use of both psychological tools and symbolic devices Delineations and limitations In order to make the project manageable, the study has concentrated on developing one learning sequence designed to support only one aspect of learning the fundamental Calculus concepts (the relationship between a function s accumulation and its rate-of-change). Although social dimensions structures affect students learning, the results reported in this study are based only on an analysis of accounts of individual student engagements with the learning tasks. There is no claim that the results of this study will generalize beyond the confines of the project Assumptions There were three main assumptions: Students participating in the study had some intuitive knowledge about situations involving change and they were able to express it in their own individual ways. Students knowledge about the representation of this relationship graphically and numerically was incomplete and open to further elaboration. Each student s performance was affected by his or her interpretations of the problems as they are represented with different parameters. 17
30 Validity issues (a) Internal validity. During the retrospective analysis phases, counterexamples of the conjectures generated from the two different sources (student work and interviews) were compared as a way of improving internal validity in cases where this data was available. The successive testing of conjectures in the different design experiment cycles was another mechanism for improving internal validity. (b) External validity. An effort to improve the generalizability of the results has been made by presenting the results (the design framework and the HLT) in such a way that other practitioners could re-deploy or use them in their own contexts Significance of the Study The significance of this study is three-fold. The first two aspects are related to the four research questions, whereas the third aspect addresses a methodological position. First, exploring the way in which RME can be used to inform the design and development of a set of mathematical tasks adapted for distance learning could make a contribution to the field of instruction design. This study could possibly add to the list of projects designed to find ways of incorporating students informal knowledge into the instructional design process. In that regard, it had the potential to add a small but valuable contribution providing insights into similar efforts designed to develop an understanding of the processes by which learners learn through their own activity and engage with learning tasks (Simon et al., 2007, p. 55). My plans for future work involve sharing some of the aspects of the instruction design process with other teachers working in distance learning environments. The distance learning design framework could be used as a model for provision of Calculus instruction for pre-college students. Typical areas of application of such didactic intervention include instances such as a re-introduction to the teaching of basic Calculus concepts at the beginning of a formal course or as a mechanism for consolidating and refining their understanding of Calculus concepts. Second, investigating the ways in which individual students reason around the derivative-integral relationship could provide a platform from which insights into the blockages and inhibitions that might prevent other students from understanding the FTC later on could be developed. The analysis of students written experiences and thinking as they worked with a set of worded problems and graphs could serve as inferences for how other students could be assisted in making sense of the relationship between a function s rate-of-change and its accumulation. 18
31 Finally, the project was designed as a possible example of an attempt to use the design research approach in curriculum development Organisation of the Dissertation The dissertation is organized into six chapters. Chapter I is the introduction to the dissertation. In Chapter II, a literature review on how an understanding of the relationship between the accumulation and rate-of-change of a function is developed. The aim was to situate the study within prior relevant research using a brief historical phenomenology of the development of the FTC, and to elaborate on the theoretical lenses employed in the analysis. In the review, I focused on analyzing and highlighting issues in previous research that are relevant to this study A description of the RME theory that has guided the research together with a didactical phenomenology on the teaching of the FTC are presented in Chapter III. The methodology used for generating and analyzing data is explained in more detail in Chapter IV. This chapter also includes an account of how the distance learning tasks were developed and tested with participants. The dissertation results and analyses are presented in Chapter V. In Chapter VI, a summary of the design experiment, an analysis and a discussion of the dissertation findings are put forward The next chapter is a review of relevant literature. 19
32 CHAPTER II 2.1. Introduction LITERATURE REVIEW Mathematics is built on abstract ideas. Mathematicians see beauty and images of reality embodied in these abstract ideas. Non-mathematicians are usually interested in the utility of mathematics. In conventional teaching, mathematical concepts are introduced by choosing important concepts and determining embodiments through which to teach them (Bell & Brookes, 1986, p. 24). Freudenthal (1991) was opposed to this approach and instead, proposed that a more meaningful didactical objective was that of assisting students re-constitute mental objects (concepts or constructs) in a guided re-invention process. By re-embedding mathematical ideas in the context again (Bell & Brookes, 1986, p. 24), the learning of mathematics would remain a human activity. This way, mathematics would be available to groups of students who would otherwise find abstract mathematics inaccessible. At the surface level, the derivative and integral do not seem to be related at all. The processes of determining each of these mathematical abstractions are different. Finding the derivative entails finding the limit of a difference quotient: while finding the integral is a more involved process. Determining the Riemann integral requires selecting an interval, formulating a sum and then taking the limit of a sum, as shown in Stewart (1998, p. 361) where: Presented geometrically, the derivative is the slope of the tangent to the curve whereas the integral is the area under between and. The integral has a rather static characterization whereas the derivative, which is a rateof-change, has a more dynamic quantity. No one would ever guess that these two were connected. The FTC connects these two mathematical notions economically and elegantly. How then, do we make this derivative-integral connection conceptually transparent to students? In this chapter, I explore the possibility of supporting beginning university students understanding of the derivative-integral relationship in contexts where curve sketching, interpretation and analysis mathematizes given situations or occurrences 20
33 (Freudenthal, 1983, p.55). This is consistent with the process of adapting the instructional design theory of Realistic Mathematics Education (RME) to the teaching of basic Calculus concepts. Central to RME is the activity-based interpretation of mathematics in which students reorganise learning content at a lower level to generate understanding at a higher level. According to (Freudenthal, 1973, 1991), mathematics is best learnt by mathematizing, (organizing from a mathematical perspective). Mathematizing is a cognitive process involving the search for meaningful patterns in mathematical tasks so as to construct mathematical structures, and, in the process, make sense of given information. Indeed, Mathematising involves order (Biccard, 2010, p. 142). During the process of mathematizing, students are encouraged to use their own ideas and strategies to solve mathematical problems in a process of guided reinvention. Guided reinvention requires that the instructional starting points are located in contexts experientially realistic to students. The term realistic refers to problem situations students can imagine (Van den Heuvel-Panhuizen, 1996). These situations originate from daily occurrences or from purely mathematical environments. The objective of RME research is to determine how to support the process of engaging students in meaningful mathematical problem solving using students contributions to reach certain end goals (Bakker, 2004, p.5). Learning occurs as students are guided through a series of instructional sequences based on the RME heuristic of emergent models. These models are students ways of organising the mathematical activity. Students models of the mathematical activity later develop into models for reasoning about mathematical relationships (Rasmussen & Kwon, 2007). Identifying appropriate problem situations and instructional starting points requires an understanding of the underlying structures or phenomena from which mathematical concepts arise. In RME driven research, this is normally through phenomenological analyses. A phenomenology of a mathematical concept is the analysis of that concept in relationship to the phenomena it organizes (Bakker, 2004, p. 7).Two types of phenomenological analyses inform RME research-historical and didactical. A historical phenomenology searches history for phenomena organized by the mathematical concepts.this feeds into a didactical phenomenology which draws from the organization of phenomena using mathematical structures airising from a teaching and learning perspective. In a didactical phenomenology, one seeks for descriptions of noumena (mathematical thought objects) in relation to the phenomena they organize (Freudenthal, 1983, Bakker, 2004). 21
34 For this project, a historical and didactical scrutiny combined with textbook analyses and observations of student learning provided sources of ideas for developing a HLT. In the remainder of this chapter, I examine the historical development of the Fundamental Theorem of Calculus (FTC) and survey selected textbooks for orientation regarding how the FTC is structured and taught. Finally, I review related derivativeintegral studies to get a sense of the didactical challenges encountered and how they are addressed. In the literature review, I concentrate on identifying contributions useful in specifying what is involved in developing a mature understanding of the derivativeintegral relationship, and how this process can be supported Lessons from History: Evolution of the FTC Designing mathematics instruction to facilitate the emergence of an understanding of the derivative-integral relationship using students own constructions requires making sense of the mathematical objects involved. The student has to go through phases of conceptualization in order to mentally construct images which can then be used for symbolizing and making sense of the situation. The main challenge for this study has been to analyze and to interpret students constructions in order to develop rationales for making instructional design decisions within an RME instructional design framework. There is a wide range of views about how Calculus should be taught. Tall (1993, p. 1) has categorized the approaches as follows: Informal Calculus - based on informal ideas of rate-of-change and the rules of differentiation with integration as the inverse process, with calculating areas volume, etc, as applications of integration. Formal analysis - based on formal ideas of completeness, ε δ definitions of limits, continuity, differentiation, Riemann integration, and formal deductions of theorems such as the mean value theorem and the fundamental theorem of Calculus. Infinitesimal ideas based on non-standard analysis. Computer approaches using one or more of the graphical, numeric and, symbolic manipulation facilities with or without programming. Intuitive dynamic approaches (Tall, 1993; Tall, Smith & Piez, 2008). 22
35 The FTC is normally part of a Calculus syllabus which includes the study of limits, derivatives, integrals and infinite series. Introductory Calculus is offered as a precollege course in some countries, and as an undergraduate course in others. Most Calculus courses and textbooks begin with differential Calculus followed by integral Calculus. Even though the formulation of the FTC varies in each approach, a historical review of how the relationship expressed in the FTC evolved over time provides a didactical lens into how best the mathematical concepts associated with the derivativeintegral relationship are taught. Conducting a brief historical analysis of the FTC allows us to see parallels between the development of the theorem and individual concept formation. The aim is not to emulate history, but to make conjectures about learning barriers students are likely to face. History can demonstrate the processes of mathematical discovery, reveal the conceptual networks underpinning mathematical definitions and assumptions, and shed light on student learning difficulties (Sabbagh, 2007, Bressoud, 2010, Farmaki & Paschos, 2007). History gives a sense of the value and usefulness of the study s concept or phenomenon of the theorem (Van Maanen, 1997). However, one needs to be careful when drawing parallels between two different sets of mathematical practices the evolution of mathematical knowledge and mathematical cognitive development. While the former refers to knowledge produced by mathematicians and is shaped by epistemological concerns, the latter is focused on the cognitive development of the learner, and is regulated by didactical and psychological influences. Nonetheless, well-orchestrated analyses of parallelism do exist. For example, in her doctoral thesis, Nixon (2005) was able to formulate a general integrated pattern for learning and teaching algebra from an investigation of the parallelism between the historical development of abstract algebra and the teaching and development of concepts in abstract algebra. Her thesis was firmly grounded in analytical framework consisting of an examination of related developments of mathematics, and comparisons with descriptions of thinking levels by renowned scholars such as...piaget, Freudenthal, van Hiele, Land, Nixon and Vinner (p. 7). The historical brief presented here aims to highlight possible starting points or ways of supporting the teaching of an introduction to the derivative-integral relationship. In terms of RME, a historical perspective can provide the source of problem situations from which an understanding of the concepts can be developed (Bakker, 2004). 23
36 Forerunners of the FTC One of the reasons Calculus is considered to be a hallmark of the development of mathematics is because it contains generalized and algorithmic techniques for solving particular scientific problems (Kleiner, 2001). Modern Calculus allows one to use and apply differentiation and integration techniques to different phenomena (velocity, electric flux, slopes of curves, areas, volumes etc). A number of mathematicians, (mostly around the 17 th, 18 th and 19 th century) made contributions that led to the development of Calculus. In this inquiry, the focus is on the work of Newton and Leibniz, with a brief throwback to their predecessors, and a forward thrust to critical events influencing the evolution of the FTC. This can be considered as a brief historical phenomenology on concepts and the teaching and learning of the concepts. The following questions are interrogated in this brief historical examination of the FTC development: What types of mathematical problems led to the evolution of the FTC? What processes led to the generalization and algorithmization of the FTC in terms of the integral-derivative relationship? How is this FTC relationship understood and interpreted in modern day Calculus? From an RME instruction design perspective, the responses to these questions help shape the starting points, the structure and general flow of the design sequences from which students could be guided to re-discover the mathematical concepts themselves. In the following sections, contributions from a few selected mathematicians are discussed. The aim is to provide a basis for moulding the learning sequence introducing the FTC derivative-integral relationship. (a) Initial Problems. Writings about the history of Calculus begin with the work of Greek mathematicians especially Archimedes (Boyer, 1959; Wren & Garrett, 1933). The most significant problems were those dealing with finding areas (quadratures) and volumes, determining tangents of curves and working out extreme values. The reason historians draw links between Calculus and Archimedes ( BC) is because he used a method with ideas similar to those used in Calculus a method of involving successive approximations, better known as the method of exhaustion. He used this when determining the value of. Starting with a circle of diameter 1, he constructed a series of inscribed and circumscribed n-sided polygons and, by calculating the lengths of their perimeters, was able to come up with an approximation of. He conjectured that the perimeter of the circle lay between the perimeter of the circumscribed polygon and that of the inscribed polygon. Their difference provided an estimation of the decrease of the error in the value of π as the number of polygon sides 24
37 increased. was a measure of the accuracy of the estimate. He improved his estimates by doubling the number of sides until a point of exhaustion when he had inscribed and circumscribed polygons of 96 sides. From this, he was able to make an approximate calculation placing the value of π between and (Wren & Garrett, 1933). Archimedes method of mechanical theorems consisted of a system of balancing what he called elements of geometric figures against each other (Boyer, 1959). He used it to find areas of geometrical shapes and volumes of solids, and for computing relationships among them. He is said to have developed a technique very close to integration when he determined the area of a parabola segment using a series of inscribed triangles. By this process he was able to express the value of the parabolic area in the form where was the area of the original inscribed triangle (Wren & Garrett, 1933, p.271). He then used the method of exhaustion to determine the actual value. For example, by applying the method of exhaustion to two-dimensional (plane curves) and three-dimensional structures (spheres and cones), Archimedes was able to prove that the volume of a cone was of that of a cylinder with similar height and base dimensions. Likewise, the volume of a pyramid was that of a prism of the same height and same base. Essentially, he used his knowledge about the areas and volumes of regularly shaped objects to obtain estimates of the areas and volumes of irregularly shaped objects. Using a similar type of reasoning, Cavalieri in Boyer (1959), partitioned each geometric figure into an infinite number of indivisible elements, which could be used to determine areas and volumes. For example, a surface could be constituted from an infinite number of equally spaced parallel lines, while a solid was made up of an infinite number of equally spaced parallel planes. Cavalieri then used the notion of correspondence to determine the areas (or volumes) of different structures. Beginning with a structure whose volume or area was known, he set up corresponding indivisible elements in both structures. The areas (or volumes) of the structures concerned were in the same ratio as that of the corresponding indivisible elements. Later on, Fermat invented more sophisticated techniques for determining the quadratures for parabolas and hyperbolas (Boyer, 1959; Kleiner, 2001). In current integral Calculus, a method analogous to the one performed by Archimedes and Cavalieri (in Boyer, 1959) is used to determine the area under a curve. 25

 (see figure 2.1).")
38 Figure 2.1: Sum of rectangles as an approximation of the area of the region R In this case, an approximation of the area, of the region, bounded by the graph of, two vertical lines drawn at and the -axis is determined by dividing the region into vertical strips (rectangles) of equal width. The sum of the areas of the rectangles is an approximation of the area of the region. Better approximations are obtained by increasing the number of vertical strips (rectangles) (see figure 2.1). This idea is later extended to determine the exact area (integral) using limits where this is possible. (b) Typical Problems. A summary of the typical problems mathematicians were confronting as Calculus developed is captured by Kleiner (2001). Around the 17 th century, Newton and Leibniz developed a Calculus applicable to geometrical or physical problems, mostly dealing with curves. Their algebraic (symbolic) system of a Calculus of variables related by selected equations, was generalized and could be applied to a variety of scientific problems. According to Kleiner (2001), the early part of the 18 th century saw some progress with the works of Bernoulli and L Hospital, but the focus remained geometric - concentrating on curves (tangents, areas, volumes, lengths of arcs). A fundamental advancement appeared in the mid-18 th century with the introduction of the function concept by Euler. The function became the Calculus hub. As stated by Kleiner (2001), Euler made the assertion that the derivative (differential quotient) and the integral were not merely abstractions of the notions of tangent or instantaneous velocity on the one hand, and of area or volume on the other - they were the basic concepts of Calculus, to be investigated in their own right (p.149). Still, following the Newtonian and Leibniz era, 18 th century mathematicians were interested in the utility and application of the Calculus concepts in problems stemming from areas such as Physics and Astronomy. Kleiner (2001) adds that in the 19 th century, mathematicians such as Cauchy, Bolzano, and Weierstrass sought to institutionalize 26
39 and provide rigor and justifications for the foundations of Calculus. The problems they dealt with were, therefore, descriptive, abstract and analytical in nature. Kleiner (2001) characterizes the Calculus as being geometric in the 17 th -century, algebraic in the 18 th - century, and as arithmetized in the 19 th century. He builds an analogue of this depiction with the three stages of developing a mathematical theory-the naïve (intuitive), the formal and the critical. It is interesting to note that these stages somewhat parallel Nixon s (2005) cognitive levels for learning advanced algebra (perceptual, conceptual and abstract), and Gravemeijer s (1999) heuristic models for designing learning activities (informal, preformal and formal), introduced in Chapter I of this thesis. This parallelism issue is taken up again when the trajectory is being designed in Chapter IV. (c) The FTC challenge for this study. The FTC is a unique theorem connecting the derivative and the integral. Although the FTC appears in different formulations and proofs, the most commonly used form is introduced as part of integral Calculus. This is the computational form (usually referred to as Part II in American textbooks). Normally, the expression presented links the calculation of the area between a curve and the - axis (definite integration), with the evaluation of a function whose derivative is the curve presented. It is usually expressed as follows: If is continuous on [ ], and is an antiderivative of on [ ] then In typical introductory courses, students are introduced to the FTC primarily as a method of demonstrating how antiderivatives are used to evaluate definite integrals. Often, students learn how to use the integral to produce functions or numbers representing the area under the curve, with very little reference to the underlying Calculus connections involved in the statements presented. Is it possible to reintroduce the FTC in such a way that students are able to form associations between finding the area under a curve (definite integration), determining the instantaneous rate-of-change (differentiation), and assembling functions from a given rate-of-change (antidifferentiation)? This study has been an attempt to help students develop these links and, ultimately, deduce that differentiation and integration are inverse operations. The main focus was on designing an introductory learning sequence that would later lead to an understanding of Part I of the Fundamental Theorem which is often stated as follows: 27
40 Let be continuous on an interval, and let be a point in. If is defined by then at each point x in the interval. The main challenge in this study was an instructional design one. The aim was to develop a trajectory in which learners acquired a sense of the connection between the area, the slope, the integral and the derivative through problem solving. Coming from a non-mathematical background with a bias towards Physics, my interest in Calculus is primarily in the extent to which Calculus tools can be used to model reality. For that reason, the problems selected for this project were simple, real-life problems. The instructional design intention was to uncover the processes through which students would cognitively connect a function and its derivative equal to, expressed as. In section 2.3 of this chapter, selected textbook examples of how other practitioners (lecturers/teachers) of Calculus have approached the presentation of the FTC are examined. I now briefly look at the evolution of the FTC Genesis and development of the FTC The evolution of the FTC into the format commonly presented in elementary Calculus texts involved several stages. Having established the types of problems being investigated (namely those of quadrature and tangents), a mathematical language of notations was required before the processes of generalization and algorithmization could be established. This was achieved through the conception of graphical representations and symbolization, greatly enhanced by the invention of the function and functional notation. Graphical conception precedes generalization and algorithmization. Symbolization was a key event before the consolidation of the FTC as we know it today. (a) Graphical representations in historical FTC. Around the 14 th Century, Nicole Oresme (c.1360) introduced the idea of using geometric figures (models) to represent the quantity of a given quality such as velocity. Other qualities included temperature, size and even charity. Oresme is recorded in Clagget (1959), as being first at establishing the fact that the area shown in the intensity versus extension model could represent the distance covered by a moving object. This is an idea that looks very much like the area under a velocity-time curve we use today. Oresme associated a moving point with two measures: (a) its latitude representing an instant of time (the subject or extension); and (b) its longitude or intensity, representing its velocity at the 28
41 time. A horizontal line was the latitude and a set of vertical line segments made up the longitude. The shape of the model (graph) could be used to give an expression of the ratio of the quality measured against an interval of space or time. Figure 2.2 is a drawing from the 15 th century copy of Oresme s De configurationibus qualitatumone (Clagett, 1959). Figure 2.2: Oresme s De configurationibus qualitatumone Using geometrical methods, Oresme was able to put forward the suggestion that the distance covered by an object starting from rest and moving with constant acceleration was the same as what the object in question would have covered, if it were to move, (within the same time interval), with a uniform velocity equal to half of its final velocity (Boyer, 1959). According to Doorman (2005), mathematicians are likely to dismiss Oresme s reasoning leading to this statement as being too intuitive, lacking a rigorous proof. The argument is that inferences about the integral (area under the curve) as distance travelled cannot be made without reference to the instantaneous velocity as a differential quotient. However, it is a normal historical occurrence for an intuitive understanding of concepts to precede formal descriptions and proofs. The question for this project is whether it is possible to bring about an intuitive understanding of conceptual relationships before the formal definitions and proofs are introduced. In a study designed to improve students understanding of Calculus concepts, Farmaki, Klaudatos and Paschos (2004) exploited the genetic historical ideas 1 related to the development of mathematical concepts (the function and the integral) and their graphic representation. They integrated these genetic historical ideas into the design of learning tasks dealing with uniform-motion problems. Students were introduced to models of solving uniform-motion problems using Euclidean geometry (Oresme s method).they investigated real situations on to which the mathematical models presented could be projected through geometric transformations. Problems normally requiring algebraic or functional solutions could be solved using Euclidean geometry. 1 Genetic historical ideas are ideas linked to the historical origins (genesis) of the mathematical concepts. The term genetic is borrowed from Jean Piaget s (1977) genetic epistemology- the study of the genesis of knowledge. 29
42 The aim was to assist students cement the idea that the distance function could be represented by the area under a velocity-time graph. From a geometrical - graphical context which presents the motion scenario, students are asked to shift to the algebraic context, and the algebraic formulas of the velocity and time position (Farmaki et al., 2004, p. 508). Part of the second learning task (motion of moving objects) in this project is designed along similar lines. Within the context of uniform motion or rate-of-change, students can work towards gaining an insight into the derivative-integral relationship by building models in which the relationship between the two concepts are initially represented visually. From uniform motion, students have to advance to cases where the rate-ofchange is variable. The introduction of symbolism offered a mechanism for dealing with notions of variability. Prior to the introduction to the symbolism, it is vital to consider the FTC beginnings. (b) The FTC originators. The accounts reported here are taken mainly from (Boyer, 1959; Kleiner, 2001; Edwards 1979; Wren & Garrett, 1933). The fundamental theorem of Calculus defines a relationship between differentiation and integration. The first part shows that the integration operation can invert differentiation. The second part provides a simple way of computing the definite integral of a function from any of its antiderivatives. Isaac Barrow ( ) is purported to have been one of the first mathematicians to recognize that integration and differentiation were inverse operations. Barrow s examination of what could be termed the Fundamental Theorem relationship appears in his Geometrical Lectures (Boyer, 1959). His work included techniques for constructing tangents to curves and finding areas bounded by curves. According to Bressoud (2010), Barrow demonstrated that if one started with a curve, and constructed a second curve so that its ordinate was proportional to the accumulated area under the first curve, then the slope of the second curve would be equal to the ordinate of the first. Barrows geometric argumentation is very difficult to follow. His technique has been criticized for being too geometric with no attention to analytical procedure or problem solving Prag (1993) credits James Gregory ( ) with observing the FTC relationship in certain instances. From Prag s (1993) account, one could construe that Gregory s work contains the proof that the tangent method is the inverse of the method of quadratures. However, in Boyer (1959), it is Isaac Newton ( ) and Gottfried Leibniz ( ) who are recognized as the originators of the FTC. There was a controversy concerning whom to credit with the first appearance of the FTC in its pre-rigorous 30
43 formation. What is important is that Newton s and Leibniz accomplishments resulted in the explicit and unambiguous recognition that differentiation and integration are inverse operations. Using different contexts and instances, Newton and Leibniz were able to extract the concepts of the derivative and integral, entrench them into an algebraicalgorithmic mechanism which could be applied to solve scientific problems. In the next section, summaries of their contributions are briefly explored. (c) Sir Isaac Newton s contributions ( ). Newton needed techniques to accurately determine the motion of a body at a point along its path. He imagined a quantity (a point, line or plane) undergoing continuous change and then created a Calculus of variables and their relations. Newton's basic concept was the fluxion denoted by (the instantaneous rate-of-change) of the flowing quantity or fluent. The motion of a point on Newton's curve had a geometrical magnitude with horizontal and vertical component velocities and and could be represented with an equation such as (see figure 2.3). What the early mathematicians lacked was a notation and formalism of today (Holgate, personal communication, 12 January, 2012). Figure 2 3: Path of Newton s point Since the direction of motion of a point on the curve is along the tangent to the curve, it follows that the slope of the tangent line to the curve at a point ( ) is or which is the derivative. Newton proceeded to find a method, which he used to obtain the slope of the tangent to any algebraic curve. This was based on the assumption that the instantaneous velocities and at the point ( ) moving along the curve would remain constant throughout an infinitely small time interval (an infinitesimal period of time). The infinitesimal increments in and were and respectively (from or ). Newton named and moments, where a 'moment' of a fluent was the amount by which the fluent increased in an infinitesimal time period. Therefore, ( ) became a point on the curve infinitesimally 31
44 close to ( ) (Kleiner, 2001, p.9). By substituting ( ) into the original equation, simplifying, dividing by and neglecting all terms multiplied by the second or higher power of, (infinitely less than the remaining terms), Newton was able to obtain a general equation relating the coordinates and of the generating point of the curve and their fluxions and ). After finding the slope and calculating or from, Newton investigated whether it would be possible to find in terms of given an equation expressing the relationship between and the ratio. This is the process we now call antidifferentiation. Newton was the first to use the results of differentiation systematically in order to obtain antiderivatives, or to evaluate integrals (Kleiner, 2001). He developed a process in which one could see the connection between the quadrature of a curve and its ordinate. Later on, he was able to apply power-series methods to problems of integration where finding an integral directly was not possible. In Newton s terms, integration meant finding a (power) series expansion of the integrand, and interchanging the sum and integral. The power of Newton's technique stems from the fact that he started off his reasoning with a real mathematical problem. By analyzing a dynamic situation involving motion, he was able to quantify the variables involved, entrench the motion and time in a geometric space within a coordinate system, and develop a (symbolic) language to describe the situation. Finally, he proceeded to find and apply mathematical techniques to solve the problem. (d) Leibniz contribution ( ). Leibniz had a picture of a curve consisting of variables ( ) assembled from a sequence of very close values. His ideas on Calculus are developed from a study of algebraic patterns of sums and differences. The 'differential' was central to his developments. To Leibniz, a curve was a polygon with infinitely many sides, each of infinitesimal length. Each Leibniz curve had: a sequence of differences, associated with the abscissa of the curve. a sequence of differences associated with the ordinates of the curve. an infinite number of polygon sides each denoted by (Kleiner, 2001). 32
45 The coordinates of each point on each curve were ( ).The difference between two successive values of was the differential of denoted by while that of was. The three differences formed the Leibniz's characteristic triangle with infinitesimal sides conforming to the relation: (figure 2.4). The slope of the tangent to the curve at the point ( ) was -an actual quotient of differentials, which Leibniz named the differential quotient. Figure 2.4: Leibniz differential quotient Leibniz' choice of notation, especially the differentials (infinitesimals) provided a way of working out solutions quickly. For example, the tangent at a point ( ) to the conic could be found by replacing and with and respectively. Since (, ) was a point infinitely close' to ( ),. By simplifying, and discarding and which were negligible when compared with and, one would obtain the result:. Dividing by 2.dx and solving for gave the result:. Nowadays we are able to work with functions and rules to differentiate easily. Leibniz worked out a solution without any knowledge of functions, as we know them today. Leibniz thought of the problem of area as a summation of infinitesimal differences leading him to the connection between area and the tangent and their properties. He realized that with any sequence and an accompanying sequence of differences,, the sum of the consecutive differences was equal to the difference between the first and last sum of the original sequence: (the relationship between difference and sums of sequences). From this realization, he was able to deduce that summing of sequences 33
46 and obtaining their differences were mutually inverse operations (Doorman & van Maanen, 2008). To Leibniz we owe the invention of an appropriate and accessible, universal, symbolic language capable of reducing all rational discourse to routine calculation notation (Kleiner, 2001, p.148). His notation for the derivative and the integral sign dominate Calculus texts. Leibniz' Calculus representation format prevailed over Newton's, largely because of his well-chosen notation which offers truths without any effort of the imagination (Boyer, 1959, p. 208)....the Calculus of Leibniz brings within the range of an ordinary student problems that once required the ingenuity of an Archimedes or a Newton (Edwards, 1979, p.232). For Leibniz, the task of integration was related to finding an explicit antiderivative (or primitive). Leibniz understood the integral as the limit of a sum but in a very heuristic and intuitive sense (Bressoud, 1992, p.297). His methods of determining sums and differences could be used when building the link between the tangent (rate-of-change) and area (accumulation). (e) Combining Newton and Leibniz ideas. The central idea for this project is to bring about an intuitive understanding that differentiation and integration are inverse operations on a very large set of functions, (at least those functions a nonmathematician is likely to encounter). The aim is to use a preliminary understanding of the FTC as the basis for this understanding. It would seem that Newton s and Leibniz approaches started from different underlying ideas but ended up with similar mathematical reasoning strands. Newton started off his reasoning with an analysis of the motion of physical quantities. Leibniz began his with a mathematical slant based on sums and differences. Following these, both of them used geometrical forms (the curve) for representing their ideas and extending their calculations and reasoning. Each one had to invent a symbolic language for expressing the relationship developed. Incidentally, neither Newton s nor Leibniz initial starting points had direct links to problems dealing with tangents or quadratures. In order to analyze the movement of the points generating the curve without having to detract them from their motion, Newton froze their movement for an infinitesimal time period. Newton based his synthesis on what was happening to a changing quantity (the fluent), having the fluxion as its rate-of-change. However, he still required another symbolic device, the moment of the fluent, (an infinitely small change the fluent underwent in infinitely small time period), for describing what was going on and performing the required calculations. All terms containing were later discarded in the calculations. In Newton s calculations, the instantaneous velocity of a moving object 34
47 became the term remaining, at that instant when the ratio of the infinitesimal variations of distance and time disappeared. The FTC relationship in the Newton s approach is easy to perceive, as integration is the act of determining the fluent quantities for specified fluxions. The central concept in Leibniz development of the Calculus was the differential, (an infinitely small difference between two consecutive values in a sequence). Leibniz explanations and calculations were based on manipulations of these infinitely small quantities. The FTC relationship is not that perceptible in Leibniz approach. While integration refers to summation, associating differentiation with finding a difference takes a while to decipher. Making the observation that summing sequences and taking their differences are inverse operations, and then analogously linking this observation to the finding of quadratures and tangents as inverse operations requires deep insight into numerical patterns in sums and differences (Doorman, 2005). Nonetheless, Leibniz notation made Calculus accessible by making symbol manipulations uncomplicated. Newton s and Leibniz methods converged when both mathematicians started reasoning about and calculating the derivative and the integral geometrically. They both needed to create an additional mathematical entity- an infinitely small quantity, with very small values but never zero, in order to carry out their calculations. Leibniz referred to this entity as the differential, while Newton called it the moment. In this context, we will use Leibniz, notation and think of and as representing infinitesimal changes in the magnitudes of and respectively. The manipulation and use of the infinitesimals was criticized, particularly by Berkley (Edwards, 1979). These additional mathematical entities, which were required to bring about the desired mathematical goals and structure Calculus, could not be easily quantified or applied consistently mathematically. The differentials and coincided with their respective changes in the magnitudes and, only when these changes were infinitely small. Moreover, they could be neglected, or disposed of when appropriate. How could entities appearing at the beginning of a description (calculation) suddenly disappear? It is no wonder Berkeley referred to them as the ghosts of the departed quantities (Kline, 1972). Leibniz offered the explanation that infinite and infinitely small quantities could be used as a tool, in the same way as algebraists satisfactorily used imaginary roots (Kline 1972, p. 509). The question at task, at this point was whether one could test the possibility of guiding students in a process where they would make use of symbolic devices (similar to these infinitesimals) which, they could later use as reasoning tools. If so, at which point would 35
48 one introduce them in the learning sequence? Kinard and Kozulin, (2008) claim that once appropriated and internalized, symbolic devices become psychological tools students can use for solving mathematical problems. Before considering how to inculcate the idea of symbolic devices into the instructional design process, the development of the symbolization of the FTC is briefly examined. (f) Symbolizing Calculus and FTC. Before Rene Descartes ( ), questions about curves were examined using the cumbersome geometric methods. Descartes is credited for introducing coordinate geometry. This led to the advancement of analytic geometry, which paved the way for the development of the Calculus and at a later stage, analysis (Edwards, 1979). Up to this point in history, there were geometric techniques for finding areas and volumes. Solutions to uniform motion problems could also be solved geometrically. Still, the more general and algorithmic methods that are applied to a variety of problems in Calculus today did not exist. The FTC emerged as the Calculus evolved as a system, with defined sets of procedures for solving specific mathematical problems. Descartes introduced a mechanism for analyzing curves mathematically, making the application of algebra to geometry systematic. In his publication La Geometrie (1637), he describes a method for finding tangents to algebraic curves (Suzuki, 2005). Descartes contribution to the symbolization of Calculus relates to his introduction of the notion of variables and constants into geometry. He imagined a curve being generated by a moving point. Using two lines perpendicular to each other as a frame of reference, he was able to represent the curve with equations involving two variables. The equations (expressions of the relation between the variables) depended on the distances of the points on the curve from the two lines of reference. It was this notion of expressing curves by algebraic equations that made the transition from geometry to analysis possible, paving a way for Calculus (Wren & Garret, 1933, p.273). During the same period, Fermat devised ways of findings tangents to polynomial curves. Boyer (1959) and Kleiner (2001), in their accounts acknowledge Fermat s contributions to Analytic Geometry and Calculus. In a period earlier, the French mathematician François Viéte ( ) had developed an algebraic scheme in which he used the consonants of the Latin alphabet to stand for known quantities, while the vowels represented the unknowns. For the first time, algebraic equations and expressions containing known quantities and arbitrary coefficients could be represented symbolically (Yousckevitch, 1976). This algebraic scheme was refined and was later used in Calculus. At this stage, the growth of the Calculus was being driven by a need to find solutions to problems dealing with the covariation of the magnitudes 36
.")
 and the integral also became the basic concepts of Calculus, to be investigated in their own right (Kleiner, 2001, p. 149).")
49 of related quantities. The problems could be portrayed graphically, so that finding an area was linked to accumulation problems, while determining tangency correlated with the rate-of-change. A major conceptual leap occurred around the mid-18 th century with the establishment of the function as a pivoting point in Calculus by Euler (Kleiner, 2001). Euler shifted Calculus from an investigation of curves to an analysis of functions. The function eventually developed into an analytic expression symbolizing the relation between variables. With Euler, the derivative (differential quotient) and the integral also became the basic concepts of Calculus, to be investigated in their own right (Kleiner, 2001, p. 149). The algebraic expressions and their graphs had now become mathematical objects. Notably, a number of scholars contributed to the groundwork of the preliminary stages required for defining the function concept as a relation between sets of numbers rather than quantities, and for analytically representing functions with formulae (Yousckevitch, 1976). Exceptional scholars and mathematicians contributed to the process leading to the mathematical symbolism of the FTC. This process continues to inform other areas of mathematics. Using the Cartesian plane, it is now possible to describe and analyze a curve. For example, if is an arbitrary point on the curve (figure 2.5), the point can provide a description of. Assuming that the coordinates and vary in a manner satisfying an equation of the form where is a function, the geometric properties of the curve can be mirrored in the analytic properties of. Information about the properties of can be used to describe how the curve behaves. Figure 2.5: A graphical representation of the curve C To say that our instruction design practice should follow a progression similar to that used by the early mathematicians is formidable and perhaps, unrealistic. But at least 37
50 from the history of the symbolization process, there is some clarity regarding a starting point. Instead of beginning an instructional sequence by exposing students to alreadybuilt definitions of both the derivative and the integral, and the relationship between them, one should aim at creating an environment where the required reasoning concerning an understanding of their calculation relationship is invoked. Pat Thompson (1994, p.9) alludes to this type of reasoning in his statement on Calculus development. initial development of ideas of the Calculus was being done by mathematicians who had a strong pre-understanding that even though they were focusing explicitly on tangents to curves or areas bounded by curves, they were in fact looking for general solutions to any problem of accumulation or change that could be expressed analytically. Designing a process where students are introduced to the derivative-integral relationship in a manner invoking this type of reasoning is the challenge for this study. How does one design activities that allow students to start from the real world of kinematics, (or from their own understanding of these concepts) to a point where they are able to mentally extract and work with the required mathematical relational abstractions? In the case of Calculus, it is at the point where there is a leap from approximation to the precise definitions and formulation. As a non-mathematician with some Physics background, I also struggle with this abstraction process. Does one introduce the symbolism, followed by the mathematical content and then the reasoning? Or is it possible to bring guidance so that the symbolism is introduced as the mathematical content and the required reasoning co-evolve? These are the questions this study seeks to address. Before producing a summary of this brief historical synthesis, a consolidation of the FTC into the format usually presented in introductory Calculus sessions is examined. (g) Consolidation of the FTC. Although Newton and Leibniz understood and could present differentiation and integration as inverse processes, neither of them provided a rigorous acceptable proof for this proposed theorem. It is Augustine Louis Cauchy ( ) who provided a rigorous proof for the theorem using the theory of limits in 1823 (Kleiner, 2001, p.163). The beginning of the 19 th century saw a shift from a Calculus of methods and applications to areas such as Physics, to the development of a rigorous Calculus as part of an independent Pure Mathematics University discipline of study. The Cours d analyse containing Cauchy s careful analysis of the basic concepts underlying Calculus (Kleiner, 2001, p.161) is a compilation of notes Cauchy developed to teach students at the Ecole Polytechnique in Paris. In it, he presented the major ideas in Calculus - the derivative, integral, continuity, convergence 38
51 and divergence of sequences and series defined in terms of the limit. According to (Boyer, 1959), other mathematicians had used the limit concept before Cauchy, without a formal definition. With Cauchy, the derivative was a limit and the integral was a limit sum. Cauchy describes the limit as a value (a number) which a variable approaches as follows: When the successive values attributed to a variable approach indefinitely a fixed value, eventually differing from it by as little as one wishes, that fixed value is called the limit of all the others (Kitcher, 1983, p. 247). From a foundational perspective, Cauchy s definition of the limit concept was still regarded as incomplete. It was later replaced by Weierstrass (epsilon-delta) static definition of the limit in terms of inequalities used in the formal Calculus definitions today (Kleiner, 2001, p. 163). The definition reads as follows: If is defined on an open interval containing, and is a real number, then the statement means that for every, there exists such that for any where. This means that the function has a limit at an input if is very near to whenever is near. In developing this version, Weierstrass was responding to the ambiguity of some of the foundational Calculus definitions. For instance, Weierstrass was of the opinion that Cauchy s limit definition did not distinguish between continuity at a point and uniform continuity on an interval. His definition subsumes the idea of uniform convergence which makes room for the properties of functions such as continuity and Riemann integrability to transfer to the limit as well. Still, Cauchy, in Kleiner, (2001) is credited for formalizing the Calculus and delineating the limit as the primary concept differentiating Calculus from other branches of mathematics. From a teaching and instructional design point of view, the derivative concept is relatively easy to understand. Historically, the derivative was used by Fermat as a tangent, reused by Newton and Leibniz as the fluxion and differential, and was afterwards, rigorously defined by Cauchy. The integral concept has always been problematic. Even Cauchy struggled with this concept and only succeeded by building his understanding of the integral on the extensive work on integral approximations that were developed by Newton, Euler, Lagrange and others (Bressoud, 1992, p. 297). Armed with a very deep understanding of the nature of the real number system, the functional properties of the continuum of real numbers and variable behaviour, Cauchy was able to provide a clear definition of the integral of a continuous function essentially as we give it today - as a limit of sums, (see equation below). 39
52 He then continued to prove that the integral of such a function existed, enabling him to present a proof of the fundamental theorem. The Riemann Sum with its arbitrary partition of the function and an arbitrary point of each interval was introduced much later in 1854 by Riemann from a generalization of Cauchy s work. The Riemann integral concept was perfected afterwards. Another more advanced notion-the Lebesgue integral, is used in advanced mathematical analysis. (Kleiner, 2001). If one uses an 18 th century (Euler or Bernoulli) view of the integral as an antiderivative, then seeing differentiation as the inverse of integration can potentially become just an interpretation of the definitions of two algebraic operations (differentiation and integration), with very little significance. Viewing the integral as an area has wider applicability. The notion of determining an area of a geometric region can be generalized to representations in real, physical spaces (volumes, electric flux, etc), as well as pure mathematical abstract spaces. However, from a teaching and learning perspective, this conceptualization is sometimes difficult to master Summary The preceding brief historical sketch provided an understanding of the struggle, attempts made, the type of reasoning, and the questioning required to come to an understanding of the relationship between the derivative and the integral. A historical examination was a source of clues of how a formal model of the FTC evolved from informal propositions, and how we could use similar mathematical symbolic tools and devices to create model transformations which are required for a conceptual understanding of the FTC integral-derivative relationship. From history, we are able to make instructional choices regarding the types of learning tasks and the sequence in which they are presented. We can also form a sense of what should be problematized if the required learning is to occur. Archimedes used geometric facts about the areas and volumes of regularly shaped objects to find estimates of the areas and volumes of irregularly shaped objects. The process he used is very similar to that of finding limits of summations. Oresme looked for descriptions and the values of changing quantities so that he could compare them. He was able to link uniformly changing qualities such as velocity with graph-like constructions, which he then used for reasoning about these quantities. Driven by a need to find solutions to problems dealing with the covariation of the magnitudes of related changing quantities, mathematicians started portraying these representations 40
53 graphically, linking area with accumulation and tangency with rates of change. We then see a period where these two sets of problems were analyzed, initially using geometrical methods, algebraic methods, and then a combination of both. Newton and Leibniz recognized that one could determine the solutions to the two sets of problems (relating to accumulation and rates of change) using a unified algebraicalgorithmic theorem-the FTC. This invention had wide applicability and could be used to solve general scientific problems. Cognitively, these two scientists conjured a mathematical reasoning process where they made use of symbolic devices (graphs, algebraic equations and mathematical artefacts (infinitesimals)) as reasoning tools. Using geometric-algebraic representations, a symbolic language defining and describing the FTC theorem emerged, consolidating into the abstracted and formalized versions at a later stage. At this point in history, the development and analysis of the derivative-integral relationship was occurring in a geometric context. The invention of co-ordinate graphs meant that the two Calculus problems could be handled with the curve as the focal, mathematical object of this analysis. The derivative and the integral became interpreted as geometric constructions: the derivative as a tangent to the curve, while the integral was the area underneath the curve. From a learning point of view, it is difficult to connect these two geometric structures inversely. An area conveys a static figure, whereas the idea of a slope puts across changes in magnitudes (a form of dynamism). The advent of the functional concept fundamentally changed the derivative-integral relationship conceptualization. As a result, it became possible to describe differentiation and integration as processes applied to functions producing other functions, and to reason solely with mathematical symbols. It is now stated that a function is differentiated to produce another function, (its derivative), or integrated resulting in an integral function. If the original function is represented graphically, then it should be possible to construct from a process of differentiation, and then recover the original function. Provided the selected classes of functions permit these interpretations, one should be able to show that differentiation and integration are inverse processes. The role of limit processes plays a vital role in building an initial understanding of the derivative-integral relationship. How does one introduce the limit concept without cognitively overburdening the student? Can one find numerical approximations of 41
54 derivatives and integrals to any required degrees of accuracy digitally, without using limits? Is it still a Calculus if there is no reference to limits? History contains a dialectic progression of the development of the meaning of the relationship between a quantity s accumulation (accruing entities) and the rate of this accumulation, of graphical and algebraic methods for describing the changing variables, to reasoning about slope and area, and then about differentiation and integration. The FTC relationship emerged from an intuitive investigation of changing quantities, then variables, to an investigation of curves, and then an analysis of functions. Later on, the resulting operations (differentiation and integration) became mathematical objects of study in their own right. This progression map has influenced the design and development of the HLT for teaching the derivative integral relationship in the FTC in this study. Historically, the limit concept was introduced as a mathematical dynamic thought process to explain and justify the existence of derivative and integral concepts and as a result, the FTC. The rigorous cognitive activity required to master the limit concept is left to the area of formal mathematics. In the learning sequences presented, I referred to the limit concept only briefly. Instead of beginning an elementary Calculus course with a discussion of limits, it made sense to have a starting point involving approximations of accumulated changes in quantities. Motion studies were typical access points for beginning Calculus instruction. This is because they allowed for an exhibition of the dynamism of the rate-of-change as the speed or velocity of the object, as well as the more static accumulating quantity in the form of distance. Historical accounts contain sufficient examples of interpretations and descriptions that could be used to foster the type of reasoning required to relate the derivative and integral. Models of constant motion were easy to start with, as this type of motion could be geometrically represented with familiar shapes such as rectangles and triangles. An approach worth emulating is one involving the rate of change over an interval as a property of various functions in a pre-calculus course prior to introducing the limit concept (Bar-On & Avital. 1986). Using a computer program students were allowed to experiment with and compute algebraic and numerical forms of each function, its rate of change function over an interval, and the rate of change at any given point. Figure 2.6 is an initial draft learning sequence. The draft learning sequence involves approximations, modeling (graphical and numerical representation) followed by a mathematical examination of a snapshot of what is going on at specific points within the quantity. The initial idea was to start the learning sequence by exposing students to 42

.")
55 an investigation of a familiar changing quantity (such as a moving object or a flowing liquid) - in order to start the process of creating an awareness of a quantity s rate of change and accumulation. The anticipation was that this would create an opportunity for students to construct their own models of the situation, while allowing space for the introduction to symbolic reasoning devices such as graphs and tables. If possible, snapshots of each constituent part of the moving quantity would be analyzed to in order to introduce students to mathematical expressions of this relationship. An analysis of the student verbal and written expressions would then allow for opportunities to expose students to different forms of representations (graphical, numeric and algebraic). Ultimately, allowing the students to go through a process of calculating the integral and the derivative, would enable them to begin the development of an understanding of the derivative-integral relationship. This learning sequence was revisited after a review of the literature, and an analysis of responses from students participating in the modified distance design experiments. For this study, searching for problem situations linking the rate-of-change and accumulation seemed plausible. A first thought was to search for problems involving a single moving object or liquid flowing into a container. The challenge was looking for those problems from which the ideas generated could later be extended to formal mathematics. Figure 2.6: The first draft learning sequence 43
56 The next section considers how the FTC is taught in selected Calculus textbooks and a local South African transformative initiative A Survey of Instructional Texts Introducing the FTC The brief historical analysis of the evolution of the FTC in section 2.2 above did not address instructional design issues of structure and sequencing. The following section examines how other Calculus teachers and instructors have structured and sequenced learning activities introducing the FTC. The choice of the textbooks made was based on the prescribed and reference texts used in introductory Calculus courses at the University of South Africa. The learning texts examined are taken from three American textbooks and one South African initiative designed to re-conceptualize the teaching and learning of introductory Calculus. The textbooks and learning materials examined include: Calculus: Concepts and Contexts (1998,) by James Stewart, Calculus: from Graphical, Numerical, and Symbolic Points of View, Vol 2, 2 nd edition. (2002), by Arnold Ostebee and Paul Zorn, Applied Calculus for Business, Life,and Social Sciences(1999), by Deborah Hughes-Hallett et al.. The South African MALATI (Mathematics learning and teaching initiative), 1999: Introductory Calculus (Modules 1, 2 &3) by Piet Human, Kenneth Adonis, Kate Hudson, Jacob Makama, Dumisani Mdlalose, Marlene Sasman, Godfrey Sethole and Mavukhuthu Shembe James Stewart (1998). In his introduction to [Calculus: Concepts and Contexts], Stewart states that his goal for this textbook is to make sure the students achieve conceptual understanding, while maintaining the practices of traditional Calculus. The traditional or standard approach to Calculus uses limits. Stewart uses a number of real data, combined with projects, some of which involve extensive use of technology. He introduces functions and modelling, general methods of solving mathematical problems, limits and their computation before embarking upon the derivative, the differential rules and derivative applications, and then the integral sections. The proofs in his textbook are limited, although he includes an FTC proof using the Mean Value theorem. In his preview, Stewart (1998) sets the scene by introducing Calculus as a dynamic study of change and motion, dealing with quantities approaching other quantities involving the limit concept. He distinguishes the two Calculus strands in terms of 44
57 problems central to their development, with the area problem being central in Integral Calculus, while the tangent problem is the central idea in Differential Calculus. Stewart (1998) uses the area problem and distance problem to trigger off the teaching of the FTC. He introduces the integral as a limit and remarks, in attempting to find the area under a curve or the distance travelled by a car, we end up with a special type of limit (p. 350). Stewart s book has thirteen chapters. On the whole, Stewart s view of the FTC is that of an operation relating the integral to the derivative, with an emphasis on how this idea greatly simplifies solving associated problems. He introduces the notion of the antiderivative briefly in the early chapters while presenting the derivative, before dealing with integral Calculus at some length in his chapter 5 (Stewart, 1998, p ). For the area problem, Stewart (1998, p. 355) uses rectangles to estimate the area under a parabolic curve in section 5.1. The area A underneath the curve is defined as the limit of the sums of approximating rectangles. He first gives the reader an indication of where the actual graphical area lies, in terms of its lower and upper bounds. Afterwards, by dividing the region in question into n strips of equal width, ( ) he shows that the sums of the approximating rectangles approach a certain limit, regardless of whether one uses right-end or left -end points of the approximating rectangles. He generalizes this claim to obtain a general expression for an area of a region, lying under the graph of a continuous function in an interval [ ]. The height of the rectangle is the value of at any number in each subinterval [ ] where are called sample points. The area of is given as: He introduces the sigma notation so that the area expression becomes: Stewart then uses the distance problem to obtain a similar result. He starts with a tabular (numerical) display of odometer readings of a travelling car. He uses the formula [ ] to calculate the distance travelled by the car. Using the odometer readings at equally spaced time sub-intervals, he is able to find an estimate of the total distance travelled by the car by adding up the values for each of the sub-intervals. He works out an expression for the total distance, of an object moving with a velocity within a time interval [ ], so 45
58 that Dividing the interval [ ] into equally-spaced subintervals, he is able to show that the total distance, is the sum of the distances covered by the moving object in each of the subintervals. Arguing that this estimate becomes better as the number of the subintervals increases; Stewart develops a general expression for the total distance covered by the object. At any time, the value of the velocity is, therefore, the distance travelled by the object in each time subinterval or [ ], which becomes The estimated total distance travelled by the object is. The exact total distance, the object covers becomes: The distance the object covers is represented as the area under the velocity-time curve. In section 5.2, Stewart (1998 p. 361) defines the definite integral as the limit of a Riemann sum, for a continuous function on an interval [ ], the definite integral of from to is: Stewart is careful to refer to the term as a number. In Section 5.3, Stewart introduces the FTC as a simple and powerful method for evaluating the integral provided the antiderivative of is known beforehand. He introduces the function as the indefinite integral, distinguishing it from which is a number. The second part of the FTC is written as referred to as the Evaluation Theorem. Stewart introduces the Total Change Theorem as. This statement is an indication that the integral of the rate-of-change is the total change (Stewart, 1998, 46
 presents the FTC with a graphical (visual) proof. For a continuous function on [ ], a new function is defined where.")
 For, the difference between the two areas at and is approximated as equal to the area of the rectangle with height and width.")
59 p. 377). This expression is later used when developing an understanding of the relationship between a quantity s rate-of-change and accumulation. In section 5.4 of his textbook, Stewart (1998) presents the FTC with a graphical (visual) proof. For a continuous function on [ ], a new function is defined where. The integral depends only on and is a fixed number if is fixed, or a variable function if varies. is visualized as the area (or accumulation) so far (Stewart, 1998, p. 385), (figure 2.7). Figure 2.7: The area function g(x) For, the difference between the two areas at and is approximated as equal to the area of the rectangle with height and width. Algebraically,, so and therefore - the first part of the FTC. For a continuous function on [ ], the function defined by is an antiderivative of or for, also written as: (p.286). Integral methods are dealt with in the preceding sections of the textbook of chapter 5 followed by numerous exercises. Generally, Stewart s approach to the conceptual teaching of Calculus starts with a description of the mathematical terrain (the language), then the geometrical problem, 47
60 followed by the use of real data (where required), and then by a consolidation of the concepts with the mathematical content. The applications are dealt with at the end of the learning sequence. This is how most mathematical instructional texts are written Ostebee and Zorn (2002). Ostebee and Zorn (2002) also use an approach with a conceptual focus for introducing the basic Calculus concepts. Like Stewart, they start with a graphical definition leading into algebraic expressions. They also include some proofs supported with exercises for assisting students to practice analytical and synthesizing skills. Conforming to a sequence used in most textbooks, they deal with derivatives before the integrals. Their Calculus work is spread over two volumes of work spanning thirteen chapters. The FTC is presented in the integral Chapter 5 which appears in both volumes. Ostebee and Zorn (2002) describe their approach to introducing the FTC as progressing from geometric intuition to a limit-based analytic definition (p. xii). Ostebee and Zorn (2002) introduce the definite integral geometrically as a signed area. This is the normal area bounded above by the graph of below by the -axis, left by the vertical line and right by the vertical line. The authors use pictorial examples to introduce the area function. Starting with illustrative cases that involve areas of recognizable areas and simple functions (rectangles, triangles, circles), the authors demonstrate practical methods for calculating integrals. This is followed by a presentation of integral properties associated with the area definition. They link the idea of the integral to that of an average expression for the average value of a function defined on an interval [ ] producing the equation: This argument is extended to the case of a moving object where the distance is the signed area. If the object moves at a constant speed over the time interval, then the: In section 5.2, Ostebee and Zorn introduce the area function: for any input, of a function having as any point of its domain. is the signed area 48
61 defined by from to. Using an example where, the writers demonstrate that is the antiderivative of the function. The area function of the linear function is calculated by using the common formula of the area of a triangle, resulting in an area function (the antiderivative of. The s of two extra examples presented use different values of a. It is noted that the resultant area function is the same, although the constants are different. In these examples an elementary area formula is used to find an explicit algebraic expression for the area function (p. 318). The authors introduce one last example for a function, which has no simple geometric formula. Instead, they use estimations of the paired and values to construct a graph of the area function on a unit square grid. The resulting area function graph for is that of the function which is the antiderivative of. To close the section, a list of additional properties of is provided. According to Ostebee and Zorn (2002), the construction of the area function from an original function, and a base point, warrants the conclusion that For any well behaved function and any base point, is an antiderivative of (p.322). This is the informal version of the FTC statement they introduce below before introducing the formal statement. Let be a continuous function defined in an open interval containing. Then function with rule is defined for every in and. Graphically, the FTC shows that the rate-of-change of the area function is the height of the original function (p.322). At this juncture, Ostebee and Zorn (2002) point out that theoretically, the FTC is fundamental because it connects the derivative and the integral (as rough inverses of each other). To these authors, the FTC also offers a practical springboard from which methods for calculating certain integrals emanate. The computational version of the FTC is introduced as follows (p. 315): Let be continuous function on [ ] and let be any antiderivative of, then. A reformatted version reads: Let be a defined on [ ] with a continuous derivative, then (p.327). 49
62 Expressed verbally, this statement means that for a defined interval, integrating (the rate function) will give you the accumulation in, an idea that is revisited often in this study. A proof of the FTC, developed along arguments similar to those used by Stewart (section of this study), follows in the remaining part of this section. In section 5.4, Ostebee and Zorn present substitution as one of the methods for determining antiderivatives. In section 5.5, additional techniques (formulae, tables and software) for finding antiderivatives are presented. Reference to Riemann Sums and the definition of the integral formally as a limit of approximating sums, are dealt with at the end of the Chapter, in section 5.6. Ostebee and Zorn (2002) view the limit as a critical notion that decodes the intuitive geometric ideas (slope of a tangent line in the case of derivatives, and the area under a curve for integrals), into precise mathematical language. The limit - links approximations to exact values (p.348). Unlike Stewart, Ostebee and Zorn s FTC development process does not go through an initial examination of Riemann sums. Instead, their pivotal point for introducing the integral and the FTC is the area function. Graphical, numerical and algebraic explorations of the area function connect to the integral and then to the antiderivative. We see here an approach which starts off by the naming of the concept in question (the definite integral) as a signed area, and then developing a sequence to build an understanding of this concept with examples as needed. The student is immediately thrown into the formal mathematical language, after which an instructional sequence is built to make the mathematical propositions and expressions understandable Hughes-Hallett et al., (1999) A consortium of mathematical educators was tasked to write this book on applied Calculus. In tune with its title Applied Calculus, in its introduction, Calculus is discussed in terms of its ability to shed light on questions in a number of learning areas such as the Physical Sciences, Engineering, Social and Biological Sciences. According to the authors, Calculus is able to reduce complicated problems into simple rules and procedures (p. viii). In fact, sometimes teachers over-concentrate on the rules and procedures during the course of teaching, leaving very little space for conceptual understanding. This textbook was developed to address student development of both Calculus concepts and procedures. In the text, students have to engage with a variety of problems, shaped around Deborah Hughes-Hallet s-rule of Four categorization of instructional problems-geometrical, numerical, analytical and verbal. The approach the 50
63 authors use is based on the development of accumulated change from a number of applications, not just the distance travelled. The idea that the total change of a quantity can be worked out from knowledge of its rate-of-change is carried through the text. Chapter 1 introduces Functions and change, Chapter 2 is about the rate-of-change, and Chapter 3, (the focus of this discussion) is about accumulation and change. Chapters 4-6 deal with calculations and applications of the derivative and integral. Chapter 7 introduces functions of several variables and Chapter 8 is about differential equations. The beginning of Chapter 3 starts with reference to the discussion in Chapter 2 about determining the rate-of-change of a function, leading to the derivative. Readers are informed that chapter 3 deals with the inverse process, that is, obtaining information about the original function from its rate-of-change. The question being interrogated in section 3.1 is: If we know the rate-of-change of a given function, can we recover the original function? In this section, readers are shown how to approximate total change given a rate-of-change. Knowledge about the rate-of-change is used to calculate the accumulated change. The first sets of examples use data concerning velocity as a rate-of-change. In the first example, the object moves with constant velocity and the total distance moved is determined from the equation: or. In the second example, the journey is split into different legs so that the total distance is worked out by determining the distance for each leg, and adding up the total distance. Both these examples are visualized graphically. A table containing several versus is then introduced. Estimates of the total change are determined by obtaining the product for each time interval. Each product is represented as an area of a rectangle graphically. Lower and upper estimates are determined. These sum estimates are represented as the sums of the areas of rectangles drawn between the graph of the velocity of the object as a function of time and the -axis. The authors show that the value of the total change lies in between the lower and upper sums of the calculated values. In order to make the approximations more accurate, an algebraic sum is constructed using arithmetic notation. With this notation, = number of - subintervals in an interval [ ] each of length. Care is taken to illustrate graphically that as n gets larger, the approximation improves and the area covering the shaded rectangles approaches the area under the curve. At a certain point, when is extremely large, the 51
64 sum of the areas of the rectangles is exactly equal to the area under the curve. This process is introduced as taking a limit. Using sigma notation, the left hand limit is given as while the right hand limit is. According to the authors, the limit is reached when: (the definite integral). The approximation of the total change is made exact using the limit concept. Section 3.3 of the textbook is the interpretation of the definite integral as an area when is positive. Illustrations are used to show that the area sum assumes a negative value if lies below the -axis. Another interpretation of the definite integral is discussed. If is the velocity of an object at time, then is the. The area under a graph can be used to define the average value of a function.if is the velocity function for an object, and is the position function,. The total change in position is represented as.this generalized statement is used to explain why the integral of the rate-of-change of any quantity gives the total change in that quantity. An interpretation of the definite integral as the limit of a sum is given in section 3.4. Section 3.5 contains the formal presentation of the FTC. To compute the total change, one has to break into subintervals at. Taking and then the length of each subinterval becomes. For the first subinterval, the rate-of-change therefore change in. For the second sub-interval the total change between and, and so on. The total change According to the authors, the approximation becomes better as gets larger. Once the limit is taken, the sum becomes the integral. The total change between and is 52
65 The total change on between and is normally given as. Combining the two equations we have the FTC result: If is continuous for then which, when stated informally, suggests that the definite integral of a rate-of-change is the total change. Restated differently, if we know a function whose derivative is a function then the definite integral of is This suggests that the total change can be determined if is known. In a theoretical section at the end of the Chapter; the authors present a different point of view. Beginning with the definite integral expression, they attach conditions where is fixed and the upper limit is. The integral value is a new function of, called, where and and The reader is asked to visualize for positive value of. Denoting as the area under a curve, the authors use the same line of argument used by Stewart in section of this study, except where Stewart has, they use. They then set out to determine.. Using and, they work out the difference:, which is approximately equal to the area of the rectangle with height and width. The difference is:, and therefore If one takes a limit to make the approximation exact, then we have the expression: or. This is referred to as the second FTC. If is a continuous function on [ ], and is any number on that interval, then has the derivative (Hughes-Hallett et al., 1999, p.206). The section ends with a summary of the properties of the definite integral. 53
66 These authors illustrate that, to some extent, calculating the derivative and calculating the definite integral are inverse processes. They start off by posing a mathematical question (if it is possible to recover a function, given its rate-of-change). They then use a learning sequence as a response to this question. An analysis of real data of a moving object is used to start the discussion. This leads to a need for finding approximations and then later on, for taking limits, to make the approximations precise. This process leads to the development of the definite integral, which is in turn used to calculate the area under a given curve. The FTC is presented formally followed by the theoretical proof. In all the three textbooks quoted here, continuous functions are regarded as functions with no breaks or jumps. Hughes-Hallett et al., (1999) mention that if a function is continuous, then its properties within a small interval can be extended to its limit as well The South African MALATI initiative. In the late nineties ( ) the Education Initiative of the Open Society Foundation for South Africa commissioned the MALATI (Mathematics learning and teaching initiative). The project team was tasked with developing and testing alternate approaches to teaching and learning mathematics in schools. One of the assignments involved the re-conceptualization of introductory Calculus teaching at the pre-college grades (10-12) 2 in the schools. The project involved mathematics educators at the Universities of the Western Cape, Stellenbosch and Cape Town. The learning materials developed were tested in 15 schools. Seven of the project schools were from the Western Cape and the remaining eight were from the Northern Province. Students were observed using the materials in the schools and participating teachers were supported with workshops, visits and discussions. Data from the research were used to improve the learning materials. In this dissertation, I have quoted from four sources emanating from this project: The MALATI Group 1999 reference which is a summary of the project, together with three sets of learning materials; Human et al.,1999a; Human et al., 1999b and Human et al., 1999c. The MALATI educators cited poor student performance when using traditional approaches to teaching Calculus as one of their reasons for seeking alternative teaching approaches. They also felt a need to inculcate contemporary insights and newer technologies into the learning and teaching of school Calculus. From a South 2 The South Africa School System has 12 grades of schooling, with grade 12 being the last grade before college/university entry. 54
67 African perspective, three issues affecting school Calculus teaching needed to be addressed: functions were still being taught as isolated sections; students had practically no exposure to exponential or logarithmic functions (functions useful for modelling real life situations); the differential Calculus introduced in schools was largely technical with limited applicability. The MALATI team developed an approach to introductory Calculus which they characterized as an emerging approach. This approach has the following qualities: A focus on understanding the derivative-integral relationship. Learning activities developed have a strong focus on understanding the two fundamental problem types (finding the rate-of-change of a function and determining the function, given its rate), and their intimate relationship. The function/rate-of-change is contextualised from the outset and the activities set involve a range of types of functions (linear, non-linear exponential, polynomial, hyperbolic and periodic), and are drawn from different real life contexts. Activities include opportunities for practicing with using symbolic devices such as graphs, tables, etc. Graphs are not essential for all problems. Numerical methods are the primary modes for computation and limits are introduced at a later stage. Special attention was given to ensure that student understand crucial sub-constructs, such as the term average (effective) change, and the difference between the average rate-ofchange over an interval and the rate-of-change at a point (MALATI Group, 1999, pp.5-13) Notion of the variable as a changing quantity. In this approach, the notion of the variable as a changing quantity is used to introduce the basic Calculus concepts. The dependent variable changes when the independent variable changes. From this standpoint,...differential Calculus is the mathematical tool for analysing and describing such a variable rate-of-change, while integral Calculus is the tool for accumulating known changes in order to determine the total change (sum of changes) over an interval (MALATI Group, 1999, p.7). The development of the Calculus is based on an interrogation of problems involving the determination of the rate-of-change, or the total change of a quantity over an interval. Questions are phrased graphically (geometrically) or in numerical algebraic terms. Adjustment of the role of the limit process. The MALATI team argue that the role of limit processes in modern day Calculus needs to be adjusted. They claim that current technology can be used to determine numerical approximations speedily and accurately. In their approach, limit processes are shifted from their central 55
68 position as the principal instrumentation of classical Calculus (MALATI Group, 1999, p.5). Instead, they see limit processes as playing an important role in the facilitation of the understanding of phenomena modelled by Calculus (MALATI Group, 1999, p.6). Their aim corresponds quite well with the aim of this study in terms of learning Calculus to provide learners with a conceptual background which empowers them to make rational sense of elementary differential Calculus (MALATI Group, 1999, p.7). The learning sequences developed are supposed to be implemented over a period of seven years. Their aim is to allow learners to examine the central ideas of Calculus informally before the formal introduction (Human et al., 1999a). In grades 6-9, the function concept is introduced using real life experiences. This section includes activities re-developed to illustrate the idea of the Fundamental Theorem of Calculus using discrete mathematics. An example is activity 6 in module 1 which reads: Imagine being offered a job with the starting salary of R per annum. Your employer says to you that he will guarantee a cost of living increase of 10% per annum for the next 8 years. Your annual increase could be more than 10% if you work is good (Human et al., 1999a, p.14).this problem deals with the aspects of rate-of-change and accumulation realistically. In grades 10-11, a more sophisticated notion of the function concept is cultivated. Students explore, analyse and interpret functional relationships represented in various formats (algebraic, numeric, verbal and graphical). Students also spend time studying and attaching meaning to graphical constructs such as the slope and the area under curve. There are several motion (speed- time) problems investigated such as the records of Mr Brown s speedometer reading in activity 1, Module 2. The difference between Human et al. s (1999b) presentation and the more traditional text is that here, questions are framed to elicit responses from the students. Students are not just shown and told to imitate the expert. For example, to calculate the distance, the instructions to the students are; estimate as well as you can, what distance they have must covered from 8:30 to 10: 30 (Human et al., 1999b, p.3). The fundamental Calculus concepts are explored intuitively before the formal introduction using the limit concept. In grade 12, students are introduced to the processes of determining the rate-ofchange for a given function (Differential Calculus), and finding a function given its rateof-change (Integral Calculus). The contrast and relation between finding rates of change of a given function and estimating values for a function with a given rate-of- 56
69 change is used as what later could become a conceptual introduction to the FTC (MALATI Group,1999, p.16). In the thirteen activities (see Appendix C), presented in this section (Human et al., 1999c), the students are taken through a process of laying the groundwork for Calculus learning. It begins with a clarification of the way the term average is used (activity 1) followed by an examination of the rate-of-change. This involves an investigation of the relation between rate-of-change and the dependent variable (activity 2), different kinds of rates-of-change (activity 3), the gradient as a form of a rate-of-change (activity 5) and exploration of gradients of different functions (activity 8). Formulae are introduced in the context of motion (activity 4). Here the notion of average speed over an interval is investigated, paving the way for why the size of the interval (denoted by ) is reduced. This view is consolidated with activity 6 where the value of a gradient at a point is derived from making the interval as small as possible. The derivative notations and and other manipulations are introduced in activity 8. In activities 6-7, the derivative and limit concepts are developed. Activities 9, 10 and 13 are mostly about understanding graphical manipulations. This includes the effect of gradients on the shape of the graph, the utilization of the tangent line to determine the gradients of curves at specific points, and the identification of maximum or minimum values of the functions from the turning points on the curves. Activity 12 deals with differentiation from first principles. In terms of this study, activity 11 is crucial in terms of the development and understanding of the FTC. This is where students learn to use information from the graphs to determine the derivative, and use information about the properties of the graph such as gradient, to sketch or predict the shape of the graph (Human et al., 1999c, p.47). Since the text is primarily designed to introduce Differential Calculus, not much is said about the integral as the area under the curve. The learning text is designed to precede formal Calculus instruction. The authors hope that after exposure to the introductory Calculus modules, learners will understand and see the need for the progression to formal differential and integration using limits (MALATI Group, 1999, p.16.) The MALATI Group singles out three aspects in the learning and teaching of Calculus using a conceptual foundation, a contextual foundation and a skills foundation (1999, p.12). Their approach builds from student understanding of functions and functional relationships embedded in real life problems. In the last sequence leading into an introduction of the Calculus, there is an exploration of the rate-of-change, followed by an immersion into a symbolic mathematical language, leading to an introduction of the 57
70 Calculus concepts. What distinguishes the MALATI learning text is the way it is written. It is written with a tone encouraging the students to put forward their own thoughts. In the learning tasks, students are steered into a process of formulating solutions to mathematical problems for themselves. Textbook syntax is largely illustrative and demonstrative, written in the show and tell characteristic of instructive language. However, while students need room for individual constructions, they also need support in developing complex ways of mathematical reasoning. How then, do we develop learning sequences where there is a balanced mixture of both formats? How can we make students reinvent what we want them to reinvent? (Gravemeijer, 2004, p.1) Summary The learning texts reviewed show that authors have different ways of presenting and interpreting the FTC. Even though the FTC links the derivative and the integral, the approach to introducing this theorem is largely dependent on an interpretation of the definite integral. As a result, the relationship between the derivative and the integral presented in an introduction to the FTC varies. Stewart starts his FTC learning sequence with the geometric task of determining the area A, underneath the curve. He goes on to define this as the limit of the sums of approximating rectangles. Stewart then uses the distance problem to obtain a similar result, after which he defines the definite integral as the limit of a Riemann sum. He refers to the second part of the FTC as the evaluation theorem. The connection between the derivative and the integral appears in what Stewart calls the Total Change Theorem. This states that the integral of the rate-of-change is equal to the total change. Stewart s depiction of the FTC is that of a tool for evaluating definite integrals provided the antiderivaives are known. Stewart uses area as a starting point for his learning sequence. Ostebee and Zorn s (2002) depiction of the FTC is built around a conception of the area function. Most of their illustrations are graphical (pictorial) and revolve around constructions of the area function. Graphical, numerical and algebraic explorations of the area function connect to the integral and then to the antiderivative. To Ostebee and Zorn, the FTC connects the derivative and the integral. The area function is an antiderivative of. Interpreted graphically, the rate-of-change of the area function is the height of the original function. Hughes-Hallett et al., (1999) illustrate that to some extent, calculating the derivative and the definite integral are inverse processes. Their development of a learning 58
71 sequence leading to an understanding the FTC is in response to the mathematical task of determining a function, given its rate-of-change. Their learning sequence is ingeniously developed to accommodate real quantitative data, followed by a need for finding approximations and taking limits. In the end, the definite integral is used to calculate the area under a given curve. These authors also manage to link methods for determining a function, given its rate-of-change to the notions of accumulation and change. The MALATI group s approach is initially built on student exploration of functions and functional relationships lodged in real life problems. Finding the derivative and determining the integral are mathematical processes. The contrast and relation between finding rates of change of a given function and estimating values for a function with a given rate-of-change, is used as a conceptual introduction to the FTC (MALATI Group, 1999, p.16 ). The way in which the FTC is introduced will be influenced by how an understanding of the definite integral is construed. For this study, the aim is to associate the definite integral with the notion of accumulation and the derivative with a rate-of-change. An interpretation of the definite integral as an area (closely linked to a limit of sums) would make sense in this context. The difficulty in mathematical learning usually occurs at the point where one has to move from intuitive reasoning to formal mathematical reasoning. King (2009) suggests using dynamic numerical thought processes. He suggests assigning the letter to an arbitrary real number, and then to think of it-when you want it to change values- as moving along a real line, taking different values as it occupies different positions (King, 2009, p.298). Functional notation is introduced when one considers that each variable x has another variable y associated with it, according to the rule. For this project, instructional design elements borrowed from these authors were incorporated into the designed learning sequence. These include Hughes-Hallett et al. s (1999) main line of reasoning of recovering a function, given its rate-of-change; Ostebee and Zorn s (2002) idea of the area function; and Stewart s use of the Evaluation Theorem leading into the Total Change Theorem. Most of the activities used are re-worked versions of the MALATI group instructional materials from Human et al., (1999a, 1999b & 1999c). The emphasis in the instructional design approach used is what the student does as opposed to what the teacher says. Gravemeijer (2004) suggests shifting away from a method of teaching by telling to one in which students have opportunities to construct or reinvent mathematical ideas. Conventional instructional design strategies are based on task analysis. With task analysis, a 59
72 learning sequence is developed in terms of what the expert believes should occur to bring about the desired learning. There is very little space for accommodating learner inputs or perspectives. The argument being put forward is that what is required is a form of instructional design that supports student efforts in developing their individual ways of reasoning into more advanced ways of mathematical reasoning (Gravemeijer, 2004). This is what this research project is aspiring towards and attempting to achieve. In the next section, I examine what research says about what an understanding of the derivative-integral relationship involves, and how this understanding could be attained The Teaching and Learning of the Derivative-Integral Relationship What does an understanding of the derivative-integral relationship entail? How can the development of this understanding be supported? Teaching any concept demands that one describes the structure, form and nature of this concept (Woo, 2007). A didactical exploration provides a lens into this understanding. This section is a depiction of what it would mean for a student to come to an understanding of the derivative-integral relationship. In the first section, I discuss concept development. This is followed by a review of studies addressing conceptual learning challenges related to understanding the derivative-integral relationship. The third section is an exploration of covariation reasoning. A small-scale didactical phenomenology of the connection between accumulation and rate-of-change and the derivative-integral relationship closes this section Concept development The conventional approaches that are used to teach Calculus concepts usually run along a familiar sequence. Lessons begin with definitions, followed by differentiation and integration techniques and applications. It is common to give rules, and allow students to memorize them for later application. In most mathematics courses, mathematics is presented as a finished product. The teacher starts by stating the general and then moving to more specific ideas to emphasize or demonstrate a point. Freudenthal (1973) argues that mathematical concept development transpires in the opposite direction in the minds of individuals, beginning with the specific and moving on to the general. Lakatos (1976) supports this argument, claiming that commencing learning with the finished product camouflages the process by which the materials were discovered. Such teaching methods do not link up to the students ways of knowing. As a result, students continually exhibit conceptual learning deficiencies when learning mathematical concepts, including the derivative-integral relationship. 60
73 Calculus educators and researchers Ed Dubinsky (2000) and David Tall (2000) also support the notion of beginning teaching from student vantage points. According to Ed Dubinsky, mathematical concepts emanate from human experience (Dubinsky, 2000, p.212). These elementary concepts (such as number sense) tend to be connected more directly with human experience while more sophisticated ideas and concepts tend to be further away from human experiences. The development of a concept involves both processes of meaning making and formalism. Meaning making relates to interpretations of any phenomena accessed by our five senses, familiar experiences, connections, calculations and mental images. Formalism is a process whereby a set of symbols are put together according to a certain syntax or organisation, intended to represent mathematical objects and operations (Dubinsky, 2000, p. 226). In Dubinsky s exposition, making sense of a mathematical situation requires that one understands both the situation and its formal expression, while maintaining a connection between the two. Dubinsky believes that allowing students to give instructions to the computer to produce mathematical objects allows them to think about what the computer is doing to evaluate a mathematical process or assignment. This, in turn, helps the student understand and maintain awareness of the connection between the formal expression and the process it embodies (Dubinsky, 2000, p.231). His theory actions-processes-objects-schema (APOS), begins with actions interiorized as processes, encapsulated as objects, and then finally manipulated mentally to form a mental schema. This theory postulates that learning involves making certain mental actions in order to understand and apply mathematical concepts. Dubinsky and McDonald (2001) have used the APOS theory and a computer programming language (ISETL) to introduce basic Calculus concepts, including an introduction to the Fundamental theorem. Students were required to write a program instructing the computer to input: values of an independent variable; the corresponding value of a function; the corresponding value of an integral; and a corresponding value of a derivative. By tabulating sets of these values, students developed a sense of the derivative-integral relationship. Tall (2002, ) offers another way of bringing human experience closer to the mathematical expressions. Instead of beginning a Calculus course with the limit concept, he suggests making the understanding of the FTC clear by using an embodied approach. This is an approach which builds on human perceptual experiences in order to provide a foundation or a natural way of leading to the formal approach. According to Gray and Tall (2001), concept acquisition begins with the formation of a mental construct (perception), followed by actions and reflections. More 61
74 abstract constructs emerge through reflection and discourse. In his earlier work, Tall (2002; 2004; 2009) had illustrated how the dynamism of computer graphics was used to embody Calculus procedures. He used the computer to magnify and zoom in onto graphs to help students develop an intuitive understanding of the limit concept. Zooming in made a very small, highly magnified portion of the graph look straight. This process led to the determination of the derivative at a point. In a parallel but different activity, the area under a minuscule, magnified portion of the curve appeared flatter taking on the form of a rectangle. This meant that determining the area under the curve was simplified as it depended only on finding the area of a rectangle, which was, multiplying the height and distance of the rectangle. Tall (2004, 2007, 2008) refers to a theoretical framework that presents three ways in which mathematical thinking develops. These three worlds of mathematics include: a conceptual-embodied world (based on perception of, and reflection on properties of objects) the proceptual-symbolic world that grows out of the embodied world through action (such as counting), and symbolization into thinkable precepts (with symbols functioning as both as processes and concepts) such as number the axiomatic-formal world (based on formal definitions and proof) Tall contends that for each individual, the development of mathematical thinking is based on three set-befores (mental abilities which all human share). These include (i) recognition, leading to conceptual embodiment; (ii) repetition, resulting in procedural symbolism; and (iii) language, which leads to axiomatic-formalism. In Tall s (2003a, 2007, & 2008) framework, cognitive development is built on met-befores (mental structures that develop through successive experiences). Some of these aspects strengthen learning while others conflict with new knowledge. Conflicts between old and new knowledge cause confusion that could result in rote learning. This often occurs at the boundary between different worlds, such as the embodiment and symbolic worlds. An understanding of met-befores is necessary for one to design appropriate learning strategies. The first part of this project was spent analyzing metbefores of participating students. A string running through Dubinsky and Tall s notion of concept development is the formation of a mathematical thought object at the end of the concept formation process. Sfard (1991) presents an operational-structural or process-object theory where a structural conception (object) of a mathematical entity is developed based on a process-oriented conception. In other words, during concept formation, the process is 62
75 reified into a mathematical object. Sfard (2001) puts emphasis on the role of discourse in the learning of mathematics. In one study, Thompson and Silverman (2008) found that students had problems understanding the accumulation function concept. They attributed the difficulty arising from the mental construction of the accumulation function to the fact that this mathematical conceptualization process of the function involved the coordination of a number of images: an image of the function as a process in which assumes different values depending on the value of. an image of varying and varying according to the structure of the relationship between and (normally referred to as covariational understanding of the relationship between and (Carlson et al., 2002; Thompson, 1994). an image of the bounded area accumulating as and vary and how the values change in tandem with each other, the accumulation and its quantification-what makes up the chunk. an image of the accumulation function defined in as the total accumulated area for each value of. an image of the accumulation function consists of three values,, and varying simultaneously, (taken from Thompson & Silverman, 2008) An additional difficulty was the requirement for students to master notational representations such as the Riemann sum. Using this notation, one is told that for a quantity accumulating in a partition of an interval in multiplicative discrete bits of where and. In the end, students often ended up exhibiting..pseudo-conceptual behaviour where their words and notations referred to other words, to notations, or to iconic images, and pseudo-analytic behaviour which is a result of applying pseudo-conceptual thinking in the course of their reasoning (Thompson & Silverman, 2008, p.120). The complexity of the number of images the student is required to form, coupled with the notation the student had to master, makes conceptual understanding of the derivative- 63
76 integral relationship in the FTC problematic. Table 2.1 has some of the mental structures and related mental abilities that students struggle with as they develop a conceptual understanding of the derivative- integral relationship. Table 2.1: Mental abilities and mental structures Mental Structures Mental Abilities 1. Time as the input variable Distinguishing between dependent and independent variables 2. Quotient: two quantities (including their Proportional reasoning; symbolization of quotient measures or variables) changing proportionately, an image of a ratio of two varying quantities. 3. Dynamic functional relationships Describing real world function behaviour, seeing the function as a process and an object 4. Limit concept Visualizing the limit concept intuitively 5. Rate-of-change Visualizing and coordinating the rate-of-change (average and instantaneous) of one variable with respect to another constantly changing variable; seeing a continuously changing rate over the entire functional domain. 6. Accumulation Developing an understanding of accumulation and the accumulation function. Ability to mentally construct multiplicatively constituted accruals of the accumulating quantity, together with their relation to the accumulating quantity. 7. Graphical representations- Representing verbal expressions graphically; seeing the accumulation-rate-of-change relationship. area on the rate-of-change versus time graph as space swept by the accumulating function; Identifying the aspects of the model linking to aspects in the real phenomenon. Understanding the mediator role the area of the graph plays in linking accumulation (phenomenon) and the integral (concept the phenomenon represents). The problems with teaching the derivative-integral relationship that are recurrent have to do with a failure to link to the students way of knowing or transfer of understandings and reasoning to students learning frameworks; difficulty in creating learning environments which can entice students, by their own volition, to struggle with and find solutions for themselves; finding effective and efficient ways of moving from intuitive, human experiences to symbolizing, and embracing mathematical reasoning and understanding. An error both instructional designers and tutors make is to assume the way concepts are presented is how they are interpreted by students. Students form their own conceptual frameworks. Often, students provide satisfactory concept definitions but are unable to apply these concepts to solve problems. This may be due to students having formed concept images different from those the instructors expect. A concept image is "the total cognitive structure that is associated with the concept, which includes all the 64
77 mental pictures and associated properties and processes" (Tall & Vinner, 1981, p. 152). At times, students cognitive structures contain elements linked partially or illogically formed in the student s mind. For concept development, students need concrete experiences from which they are able to create their own perceptions, go through individual abstractions and make generalizations about the derivative-integral relationship, with guidance (Vinner, 1991). Students should be able to move with ease between the real (embodied), graphical, and symbolic representations (Tall, 1991). The next section summarizes some of the recurring conceptual learning challenges appearing in the literature Conceptual learning challenges in derivative-integral studies When filtered from a didactical point of view, learning challenges students face may prevent them from forming the required understanding of the derivative-integral relationship. The recurring ones include: a) a failure by learners to make sense of the mathematical language; b) problems with the formalisation of the limit concept; (c) difficulties with graphical representation of the concepts; and (d) dealing with the conceptual learning challenges. These challenges are explored in the remaining sections. (a) Failure to make sense of the mathematical language. Orton s (1983a; 1983b) work has been at the forefront of research about student s understanding of both the derivative and the integral. His studies focused on identifying student learning difficulties and suggesting ways of improving Calculus instruction. Orton subjected 110 students to a series of well-prepared Calculus related tasks on limits, area and integration (1983a), and the rate-of-change, differentiation and its applications (1983b). Using a clinical interviewing method, students were asked about their interpretations of the limit, derivative and integral and the meaning of symbols such as and, and the use of graphs for representing the derivative and the integral. One of the results was that students had difficulty explaining symbols. For example, although students could explain the meaning of and individually, they could not make sense of and the relationship between and (Orton, 1986). According to Tall (1993), the Leibniz notation, although indispensable, can sometimes cause problems. It is not clear if the quotient is a fraction or an indivisible unit. The meaning of the term is not consistent when used in differentiation and integration. Tall (1993) maintains that this causes conceptual problems and suggests that a consistent interpretation of the notation be provided when introducing these concepts. 65
78 Doorman (2005) purports that the problem has to do with the way the quotient is formalised. The quotient is introduced as a division of interval segments, after which there is a quick jump to a functional symbol representation such as Students have to shift from a representation of change in the form of the intervals and to a representation of the same change as a variable. Thompson (1994) and Saldanha and Thompson (1998) attribute the problems associated with the difference quotient to a problem of students not having mastered proportional reasoning. Students are unable to imagine two quantities (including their measures or variables) changing proportionately. Associated with these problems is the students weak concept of a variable. For example, students who understand as multiplied by, can sometimes fail to interpret as representing a quantity twice as large as (Pence, 1995). In a study examining student understanding of the rate-of-change, White and Mitchelmore (1996) exposed 40 students to a course using graphs of physical situations. Students were required to recognize the secant, tangent and derivative by way of modelling and symbol manipulation. The finding was that students treated variables as symbols to be manipulated rather than quantities to be related (p. 91). The concept of variable was limited to an expression of algebraic symbols with no contextual meaning. Confounding the same issue, Carlson (1998) reported that students had problems making sense of variables varying in relation to each other. In an earlier work, Freudenthal (1983) had identified students inability to understand variables as a teaching deficiency. During teaching, variables were presented as placeholders or letters to be manipulated. As a result, an understanding that the letters referred to something which varied was lost. (b) Problems with Formalisation of the limit concept. Another problem relates to the formalisation of the limit concept. An understanding of the limit concept is fundamental to explaining differential and integral Calculus but it is one of the concepts students find hard to understand. Students have problems visualizing integration as the limit of a sum (Orton, 1983a, p. 7), and associating the limit of a sequence to the area under a graph. They struggle with visualizing the rotating secant or understanding the tangent as the limit of a set of secants (1983b, p. 237). Moreover, a number of elementary courses introducing basic Calculus principles (the derivative and integral) begin with an explanation of the limit concept. Doorman (2005) asserts that this type. of didactical implementation often proceeds too quickly or too far...such that, the relation with intuition is not paid much attention, and symbols are 66
79 introduced with implicit conventions that are clear to the experts but not to the students (p.19). Lauten, Graham and Ferrini-Mundy (1994) conducted two one-hour clinical interviews with each of five Calculus students. Their study examined students understandings and concept images of functions and limits and relations between the two. One of their findings was that the students concept image of the limit had little or no connection to the formal concept definition. Some researchers have pointed to the sources of these difficulties. The first difficulty was that there are so many ways of approximating limits with each one using its own methodology and notation, making it a difficult concept to teach (Cornu, 1991; Williams, 1991). The second difficulty relates to its interpretation. Often there is a gap between what the teacher tries to convey and how this is interpreted by the student. The term limit conveys a static absolute object, yet it is described as tending to or approaching a certain value. This creates an impression that the entity described never reaches an actual destination. The descriptions of infinite processes project the idea of never coming to a conclusion. Some of students mis-interpretations of the limit concept are summarised by Tall from (Cornu, 1991; Schwarzenberger & Tall, 1978; Orton, 1983a and Sierpinska, 1987) as follows: the process of a variable getting arbitrarily small is often interpreted as an arbitrarily small variable quantity, implicitly suggesting infinitesimal concepts even when these are not explicitly taught. Likewise, the idea of N getting arbitrarily large, implicitly suggests conceptions of infinite numbers. Students often have difficulties over whether the limit can actually be reached. There is confusion over the passage from finite to infinite, in understanding what happens at infinity (Tall.1993, p. 2). One would assume that recent technology-enhanced visualisation techniques would resolve this problem but this is not the case. In a study exploring how Calculus students images of the limit of a sequence influence their definitions of a limit of a sequence, Roh (2008) made use of visualizing techniques. Twenty-one students participated in a survey and interviews on task-based assignments. Students had to carry out a hands-on activity using small vertical strips which they physically used to explore curve characteristics such as asymptotes, cluster points, true limit points from specially designed tasks. Even after this exposure, students still regarded the infinite process as the limit rather than the reverse-seeing the limit as the result of the infinite process. Most of the students persisted in using the common day-to-day interpretation 67
80 of the term rather than the mathematical definition. In some cases, students confused the limit with the value of a function of a sequence or approximation. An important factor worth noting is that the limit has no contextual relevance. It is simply a means to an end (Holgate, personal communication, October 14, 2010). The challenge is to design learning sequences where this fact is emphasized. (c) Difficulties with Graphical Representations of the derivative-integral relationship. Another key factor affecting an understanding of the derivative-integral relationship is its graphical representation. A few studies in which this aspect has been explored follows. Christou, Papageorgiou and Zachariades (2002) studied student difficulty levels of identifying functions in different representations. Thirty eight (38) students were given a questionnaire containing different graphs of functions and asked to provide interpretations of what was going on. The results were analyzed using multivariate analysis. The study revealed that the majority of students had an inadequate understanding in relation to models, language, and mathematical reasoning. Graphical representations tended to be more problematic than the algebraic manipulations. From their analysis, Christou, Papageorgiou and Zachariades (2002) were able to identify different levels of understanding for the graphic and symbolic representations of mathematical functions. Their framework of representations used Biggs and Collis (1982) System of Observed Learning Outcomes (SOLO) taxonomy of pre-structural taxonomy of pre-structural, unistructural, multistructural and relational models with categories differentiated in terms of student responses as follows. Prestructural: a student is not engaging in the task at hand and often focuses on irrelevant aspects of the situation. Unistructural: a student pursues one aspect of a function Multistructural: a student can recognize /discriminate between symbolic and graphic representations. Relational: a student is able to focus on more than one aspect, make connections between symbolic and graphic representations, and integrate the concept of functions with its multiple representations into a meaningful structure (p. 4) Students exhibiting a relational mode of the function did not have any difficulty extending their reasoning about functions to an abstract level. Those adopting uni- or multi-structural views had difficulty distinguishing between algebraically defined functions and equations. These distinctions are useful in the analysis of the results. 68
81 In another study, Çetin (2009), investigated if Calculus students were able to determine the graphs of derivatives of the functions related to problems they encountered in dayto-day experiences. A hundred and forty students who had already completed their first Calculus course were given a test on functions and their derivatives. The problems were taken from three contexts-motion, flowing water and a tap pouring fluid into containers of varying shapes. Students were asked to match each function with its derivative. The answers appeared in a variety of formats (graphic, symbolic and numeric). Results showed that students were able to link a function and its derivative when both functions and their derivatives were linear, but failed to do so when the function-derivative relationship was not linear. The main challenge was assisting students to construct powerful concept images and to allow them to reflect on their mathematical thinking (Çetin, 2009, p.242). Nemirovsky and Rubin (1992) investigated students abilities and difficulties in articulating the relationship between a function and its derivative graphically. Students were given an opportunity to construct functions experimentally in three types of contexts (motion, air flow and numerical integration), in order to produce computer generated curves of the functions and function derivatives. To investigate motion, a motion detector attached to a small car generated velocity-time graphs. For the air flow, students controlled the variation of air flow, comparing it with the volume accumulating in a bag below. For numerical integration, special software was developed to track the progress of a function generated by the accumulating numerical values of another function. Students individually worked on 15 problems which were followed by teaching interviews. From an analysis of results, Nemirovsky and Rubin (1992) conjectured that students were able to respond to problems dealing with a function and its derivative by assuming partial resemblances between them (p.32). Students either focused on global similarities of the shapes of the two graphs (if they were increasing or decreasing), or focused on only one of the two- the original function or its derivative. Students had problems analyzing the relationship between the two. Three cues influencing resemblances were identified: Syntactic-based on graphical features. Semantic-based on student real world experiences of the function and derivative behaviour. Linguistic-where the interpretation of sentences could be misleading. An example given is the statement, the more the flow rate, the more the volume. Students tended to presume that the opposite was true, the less flow rate, the less the 69

 had been framed differently by McDermott, Rosenquist, and van Zee (1987) as difficulties students had in making connections between concepts and")
82 volume even though a decrease in flow rate does not always have to result in a reduced volume. An attempt was made to steer students into using a variation approach where the focus was on analyzing the local variation of a derivative in order to understand how its behaviour related to its original function. The authors tested this approach with one student with results showing partial success. The cues described by Nemirovsky and Rubin (1992) had been framed differently by McDermott, Rosenquist, and van Zee (1987) as difficulties students had in making connections between concepts and their graphical representations. These difficulties occurred when students were (i) connecting graphs to the real world (the actual phenomenon) and (ii) using graphs for conceptual reasoning. Doorman (2005) used the same categorizations to point out that sometimes graphs do not fulfil their expected didactical role. When students are asked to represent real situations graphically, they often end up using iconic representations. A common error is to associate the global shape of the graph with the visual characteristics of the situation (e.g. when a physical hill is represented as the apex of a distance-time graph). Another common mistake is to link the characteristics of the situation to corresponding characteristics of the graph (for example, going up becomes a positive slope while coming down is a negative slope on the graph). Often in teaching, student choices are not questioned and their understanding remains at the visual level. Doorman (2005) presented a situation where an object A travelling with a uniform acceleration covered the same distance as an object B travelling with a constant velocity (see figure 2.8).. Figure 2.8: Graph of object A and object B From the definition of the average velocity given as, students are often tempted to use the graph to obtain a value of the average velocity :,, which, in fact, represents acceleration. In this situation, students are transferring symbolic notation to the graphical milieu with no thought of what the quantities represent. 70
83 Another confusion stems from the normal calculation of averages for numbers given as:, where represents values of a quantity. The equation works for the case involving constantly increasing velocity (uniform acceleration). It is difficult to convince students that this is a special case which cannot be generalized to all other instances. The South African MALATI group reverberate this confusion regarding calculation of averages when they state that, learners (and teachers) do not have the concept of the average value of a continuous function over an interval as something different from the average value of a set of numbers (MALATI, 1999, p. 8 ). Other graphically related conceptual reasoning setbacks have to do with the area under the curve. The reasoning required to develop an understanding of the integral as area under the curve involves an image consisting of infinitely many different velocities at infinitely different instants of time (Doorman, 2005, p.23). Students find the conceptualization of the small entities difficult. They also find it difficult to desegregate thinking about the area on its own and what it represents. In other words, students have problems perceiving that the type of area being calculated has a mediating role between the phenomena it represents (accumulation), and the mathematical relation (integral) being established. The graphs which are supposed to be didactical scaffolds designed to make the concepts clearer for the students sometimes end up not fulfilling this role because of the difficulties associated with student interpretations of the representations. Tentatively, it would seem that the solution lies in exposing students to engaging tasks in which they focus and isolate the important aspects in real phenomena, quantify these aspects and get an understanding of the relationships between the measures of these aspects. The relational measures would then have to be abstracted and transferred to the graphical environment where they are seen and treated as functional relationships described and analyzed using mathematical language. (d) Dealing with the conceptual learning challenges. Student conceptual problems sketched in this section involved the variable, the limit concept, notational presentation and interpretation of the quotient: and graphical representations. Clearly, there were problems related to the mathematical structure of the elements and the sequence and manner in which they are presented, (Orton1983a; 1983b; 1986; Tall, 1993; Doorman 2005).Didactically, I believe that introducing the limit at the beginning of the derivative-integral learning sequence is problematic (Tall, 1983; 71
84 Lauten, Graham and Ferrini-Mundy (1994) Doorman, 2005). The instructional design challenge was to find ways of assisting students with constructing images of the phenomenon and problems in question, abstracting the aspects that could be represented graphically, reasoning conceptually using mathematical language, and then coming up with a solution. It was important to keep in mind that the expert mathematician already had a well-defined schema of the required concept images and graphical representations which were not immediately transparent to the student. The instruction design needed to have slots for student inputs Covariational reasoning In order to study students insights into the FTC, Thompson (1994) subjected 19 prospective teaching graduate students to a carefully designed sequence of activities in a teaching experiment.the responses were analyzed and used to identify students difficulties with understanding the FTC. Thompson s aim was to generate descriptions of students images of mathematical activity, paying attention to their uses of notation and the construction of explanations. From his findings, students exhibited static graphical images of functions including the Riemann sum. They lacked the mental actions required to form dynamic images of accruals, accumulating accruals and comparing one accrual to one of its constituent quantities multiplicatively. His conclusion was that students difficulties with the theorem stemmed from impoverished concepts of rate-of-change and poorly-developed and poorly-coordinated images of functional covariation and multiplicatively-constructed quantities (Thompson, 1994, p.2). Thompson s desire for students to develop an acceptable conceptualization of the FTC did not materialize as expected. His conclusion was that, a great deal of image-building regarding accumulation, rate-of-change, and rate of accumulation must precede their coordination and synthesis into the Fundamental Theorem (Thompson, 1994, p.55). In Carlson (1998) and Carlson, Jacobs & Larsen (2001) research involving a framework of students' thinking about the FTC was developed and conducted. Even though this is an expert s view of how an understanding of the derivative-integral relationship should develop, it provides insights into the types of reasoning students must engage in order to come to fully understand this derivative-integral relationship. The framework is based on the concept of covariational reasoning. Covariational reasoning refers to cognitive activities involved in coordinating two varying quantities while attending to the ways they change in relation to each other (Carlson et al., 2002, p.4). This kind of reasoning is beneficial in facilitating aspects related to an understanding of the FTC in terms of the derivative -integral relationship. 72
85 Following Thompson s FTC study, Marylyn Carlson (in Carlson, Jacobs & Larsen, (2001) and Carlson, Larsen & Lesh, (2001)) conducted studies addressing some of the conceptual difficulties revealed in Thompson s study with undergraduate students. Most of these studies included a section devoted to students becoming proficient in covariation reasoning. For each of these studies, a framework describing mental actions each student required to exhibit covariation-reasoning abilities was provided. Carlson, Jacobs and Larsen and (2001, p. 1) contend that, describing these actions in the form of a framework provides a powerful tool with which to analyze covariational thinking to a finer degree than has been done in the past. It also provides structure and an empirically-based information platform for building curricular activities. (a) Learning Frameworks. The first framework for developing covariation reasoning consisted of five categories of mental actions in the context of representing and interpreting a graphical model of a dynamic function event (see table 2.2). Later on, the framework was modified to include six categories. Table 2.2: Framework for Covariation Reasoning (Carlson, Larsen & Lesh, 2001) Mental Actions MA1 MA2 MA3 MA4 MA5 MA6 Descriptions of Expected Images An image of two variables changing simultaneously A loosely coordinated image of how the variables are changing with respect to each other (e.g., increasing, decreasing); An image of an amount of change of one variable while considering changes in discrete amounts of the other variable; An image of rate/slope for continuous intervals of the function An image of continuously changing rate over the entire domain An image of increasing and decreasing rate over the entire domain. Carlson, (in Carlson, 1998; Carlson, Jacobs & Larsen, 2001; Carlson, Larsen & Lesh, 2001) conducted several studies to try out her framework. For example, in a study investigating the role of covariation in student understanding of the limit and accumulation, 24 students were taken through a course which had pre- and post-tests, five sets of activities and follow-up interviews (Carlson, Jacobs & Larsen, 2001). All the tasks were designed to promote students ability to attend to the covariant nature of dynamic functional relationships. Results showed that the majority of the students exhibited a consistent pattern of coordinating an image of the independent and dependent variables changing concurrently - demonstrating covariational reasoning abilities. However, students still struggled with an interpretation of the limit concept. One of the activities was transformed into a model-eliciting activity. A model-eliciting activity is one in which the student makes a construction based on the learning attained. Analyzing these constructions can reveal more insights into student thinking, 73
86 thereby contributing to better covariation reasoning. The activity chosen for remodelling was the bottle problem (Carlson, 1998; Carlson, Larsen & Lesh, 2001). This activity was transformed into a model-eliciting activity according to the six modeleliciting principles 3 (Lesh, Carlson & Larson, 2000), becoming the new Bottle Model- Eliciting activity. Both sets of instructions are shown in figure 2.9. There was some improvement in students covariational reasoning with two observations worth noting. First, students tended to treat time as the input variable, necessitating a clearer description of the role of time in covariational reasoning. Second, some students had an image of the rate-of-change as a single object they could move along the domain, instead of an image of a ratio of two varying quantities. A. Bottle problem instructions Imagine this bottle filling with water. Sketch a graph of the height as a function of the amount of water that is in the bottle. (Carlson, Larson & Lesh, 2001) B. Revised bottle model-eliciting problem instructions Dear Math Consultants, Dynamic Animations has just been commissioned to animate a scene in which a variety of bottles will be filled with fluid on screen. We need your help to make sure this scene appears realistic. We need a graph that shows the height of the fluid given the amount of fluid in the bottle (a height/volume graph). Below, we have provided a drawing of one of the bottles used in the scene. Please provide a graph for this bottle and a manual that tells us how to make our own graph for any bottle that may appear in this scene. (Carlson, Larsen & Lesh, 2001). Figure 2.9: Bottle problem Carlson s (1998) underlying belief was that an impoverished view of function and rateof-change (Carlson, 1998; Thompson, 1994) contributed to students struggles with the Fundamental Theorem. She examined how focusing on a particular situation (ability to attend to how one variable change affected the other) and interpreting functional information (extracting information about the variable s position and rate-of-change from the graph), were related to understanding functional change. From her synthesis, an accurate depiction of change was found to contain aspects dealing with amount (quantity), direction, shape and ways of changing (inflection point identification). The covariation framework was developed from an analysis of these results. 3 The six model eliciting principles suggest the learning tasks (problems) developed are (1) Realistic - linked to student experiences; (2) Motivate students to construct mathematical objects; (3) Promote self-evaluation; (4) Contain question(s) requiring students to reveal their thinking about the situation; (5) Provide opportunities for analyzing similar types of dynamic situations; (6) are presented in simple environments. 74
 designed a study to establish the type of activities that could promote covariational thinking as a basis for understanding the fundamental Calculus concepts.")
 of one variable with respect to another constantly changing variable (Estrada-Medina, 2004, p.3).")
87 A number of researchers have re-tested Carlson s (1998) framework with different outcomes and results. A few of these studies are mentioned in the next sections. Estrada-Medina (2004) designed a study to establish the type of activities that could promote covariational thinking as a basis for understanding the fundamental Calculus concepts. Forty-six students were asked to identify and interpret changes in one variable with respect to changes in another variable graphically. The tasks demanded visualization and coordination of rate-of-change (average or instantaneous) of one variable with respect to another constantly changing variable (Estrada-Medina, 2004, p.3). Video-recorded students interactions and written responses on learning tasks were the sources of analysis. Characteristics of how students reasoned when confronted with particular learning tasks were described from an analysis of the results. One of the activities for this study is shown in Figure The figures below show three containers of water each having a different shape: cylinder, sphere and cone. The three containers have the same capacity (10 litres) and the same height. Water enters at a constant rate, 1 litre/min. (Estrada-Medina, 2004, p.3) 1) Do you think that the radii are different or the same? 2) Do the three containers fill up within the same time period? 3) Does the level of water in the three containers rise at the same speed? 4) What happens with the radii of the cross section in each of the containers? 5) Draw a graph, which represents the height of the water with respect to the volume of the water flowing into each of the containers. 6) Draw a graph showing the radii of the cross section with respect to the volume of the water flowing into each of the three containers. Figure 2.10: Cylinder, sphere and cone From an analysis of the student responses, it was revealed that students focused on the shape, not capacity when attempting to explain why this happened. None of the students used algebraic formulae to find or refer to the volumes of each container, in their reasoning. As an illustration of the covariation framework use, consider the responses for Question 3: Does the level of water in the three containers rise at the same speed? There were three types of responses (Estrada-Medina, 2004, p.4). In one, there was a focus on the shape of containers with a response: because the shapes of the figures are different and there may be a part where the level rises faster or slower. 75
88 This was considered to be MA3 reasoning. In another form of MA3 reasoning, the comparison was accomplished by assigning a value to the volumes: if the cylinder has 2 cm, of water, the cone won t have the same amount A demonstration of MA4 had the student compare different rates: it is only in the cylinder where it is constant, in the sphere it is fast, slow then fast again, in the cone it is fast then slows down (Estrada-Medina, 2004, p.4). A number of students had MA3 reasoning while a few displayed MA4 reasoning. MA3 requires coordinating an image of an amount of change of one variable with changes in discrete amounts of the other variable. MA4 reasoning is built from an image of rate over an interval. When asked to construct graphs of the radii of the cross sections versus the volume of water flowing into each of the containers, those able to provide the correct answer exhibited MA5 reasoning with responses such as in the sphere the radius increases until its maximum point when the sphere is half full, after which the radius reduces at the same rate it rose (p.6). With MA5 reasoning, one has formed an image of a continuously changing rate over the entire domain. The majority of students had problems coordinating the increase of a variable (height of the water in the sphere) with the decrease or increase of its instantaneous rate-of-change. Estrada- Medina s (2004) view is that mastering covariational reasoning requires understanding that during a variable s net increase, its rate-of-change can either increase or decrease. A failure to adopt this kind of reasoning accounted for students ability to reason covariantly. (b) Covariation and the Fundamental Theorem of Calculus. Carlson, Smith and Persson (2003) extended the investigation to a study designed to examine conceptual underpinnings, reasoning abilities and notational issues related to learning the Fundamental Theorem. Another framework-this time called The Fundamental Theory of Calculus Framework (FTCF) with four dimensions of foundational reasoning abilities and understandings was used to develop materials and for experimenting with groups of students. A Pre-Calculus Concept Assessment instrument was administered to the students at the beginning. The learning sequences used focused on concept development, acquisition of notational understanding, facts and procedures, and the development of students mathematical practices and problem solving behaviours. Lessons were balanced with classroom discussions and group work. Twenty four Calculus students participated in this study and were tested on a number of activities. Calculus Early Transcendentals (Stewart 1998) was the reference text. The FTCF used had 4 dimensions of foundational reasoning abilities and understandings (see table 2.3). 76
89 Table 2.3: FTC framework Dimensions Part A: Foundational understandings (FU) and Foundational reasoning (FR) abilities Part B: Covariational reasoning with accumulating quantities. Part C: Notational aspects of accumulation Reasoning, Understanding & Mental Actions (FR1) Ability to view a function as an entity that accepts input and produces output. (FR2) Ability to coordinate the instantaneous rate-of-change of a function with continuous changes in the input variable (Level V covariational reasoning). (FU1) The average change of a function (on an interval) = the average rate-of-change (multiplied by) the amount of change in the independent variable. (FU2) Understanding that the quantity accumulating has a multiplicative structure. (FU3) Understanding that the multiplicative relationship that represents the accrual of change on an interval can be represented by area. (MA1) Coordinating the accumulation of discrete changes in a function s input variable with the accumulation of the average rate-ofchange of the function on fixed intervals of the function s domain. (MA2) Coordinating the accumulation of smaller and smaller intervals of a function s input variable with the accumulation of the average rate-of-change on each interval. (MA3) Coordinating the accumulation of a function s input variable with the accumulation of instantaneous rate-of-change of the function from some fixed starting value to some specified value. i) The antiderivative of f is F ii)f is the function that describes the rate-of-change of F. (i) The value of F(x)represents the accumulated area under the curve of f from a to x ii) The value of F(x) represents the total change in F from a to x Part D: The statements and relationships of the FTC (i) The accumulated area under the curve of f from a to b is equal to the total change in F from a to b (ii) The instantaneous rate-of-change of the accrual function at x is equal to the value of the rate-ofchange function at x. The framework was used to guide the designing of the learning tasks as well as to elicit information regarding students understanding of the Fundamental Theorem of Calculus. Quantitative and qualitative data analysis from the study suggests that the majority of students developed proficiency in using and understanding the notational aspects of the FTC. They were able to apply covariational reasoning to solving problems involving accumulation tasks. However, their understanding of the statements and relationships of the FTC tasks were weaker. The recommendation was that further studies in which special attention was given to the relationships expressed by the FTC, and the mental actions leading to this understanding, needed to be carried out. Smith (2008) refined the framework for introducing the Fundamental Theory. According to Smith, the original framework does not pay enough attention to Pat Thompson s (1994) ideas of the multiplicative structure of accumulation, and the 77
90 coordination of the quantities of that structure (p.14). Smith (2008) expanded the original framework to include detailed statements leading to a focused description of the accumulation quantities as multiplicatively constituted accruals. She also refined the activities to accommodate the changes in the framework. To test the impact of her changes, Smith (2008) conducted teaching experiments with three first semester Calculus students at a large South-western university in the United States. Pre- and post- interviews were conducted with each of the students. These were followed by five group sessions of working through activities to develop the reasoning abilities and mental actions associated with the revised framework. Her dissertation reports on a very detailed process of how the emergent conceptions of one student are supported as he completes the designed activities. Smith (2008) cites the usefulness of the framework in developing and characterizing the reasoning abilities identified as essential for understanding the FTC. Nonetheless, she expresses a need to refine the language (precision) used. She suggests including additional activities to help students understand the average rate-of-change on small intervals of accumulation. (c) Utility of the learning frameworks. Covariation reasoning and the FTCF. Covariational reasoning abilities have been identified as essential for understanding the FTC (Carlson et al., 2003, Smith, 2008). Frameworks (Covariation framework, FTCF) of how the Fundamental Theorem of Calculus should develop in the mind of a student exist. In the studies reviewed, students expressions and understandings of the derivative-integral relationship have been evaluated against these frameworks. The focus has varied, ranging from mental actions and understandings (Carlson, et al., 2003), images (Thompson, 1994), to mental constructions (Smith, 2008). There is also a rich array of learning tasks and activities that can be used to facilitate the required reasoning and understanding. In some cases, exposing students to learning using these frameworks resulted in successful learning. Students demonstrated knowledge of the notational aspects of the FTC, covariational reasoning abilities, and an ability to apply covariational reasoning to solving problems involving accumulation tasks (Carlson et al., 2003). However, it seems that student acquisition of an understanding of the relationships expressed by the FTC and the mental actions required to understand these relationships is still a challenge. Part of this challenge has to do with the complexity of the images one must mentally construct and coordinate to understand the 78
91 accumulation function (Thompson & Silverman, 2008). Once again, presenting the limit concept in a way that makes sense to students is still problematic. To a large extent, the teaching frameworks developed still reside in the expert s mind. Teaching mechanisms whereby these frameworks are made transparent to the students are essential if the required learning is to be facilitated. From the literature in this section, it is clear that a well-developed function concept, a clear understanding of rate-of-change, a conception of the multiplicative structure of accumulation, and the coordination of the quantities of that structure are vital for understanding the FTC (Thompson, 1994, Carlson et al., 2001, Smith, 2008). Students generally have difficulty identifying and coordinating dynamic quantitative relationships, starting from the idea of rate building up to the relationship between rate and accumulation. Even though frameworks with mental actions and the kinds of the understandings students require have been constructed, the act of getting students to internalize the projected structural components of these frameworks in order to develop the required understanding and reasoning is still a challenge Teaching the derivative-integral relationship Generally, introductory Calculus is introduced in the context of real numbers. Although these numbers do not move, the ideas relating to Calculus give allusions of moving numbers (King, 2009, p. 298). This helps us think of a variable representing a real number, with the assumption that takes on different values as it moves along the number line. If we now have another variable with its motion dependent on the motion of, we have a functional relationship between and denoted by. This function can be represented graphically as the curve, providing a visual, graphical depiction. This graphic depiction should make the description and analysis of the function behaviour easier. The Cartesian coordinate system presents a tool (device) for analyzing functions. The slope of the tangent line (derivative) measures the rate-of-change of the curve (how much changes as changes), while the area under the curve for a specific interval, is an indication of the accumulation of the function in that interval, say from to (integral). The behaviour of the function can be analyzed by focusing on the graphical elements and thinking about growth or accumulation. To observe what is happening to the integral in this situation, another function the area function is introduced. A vertical line is used to trace the growth of the area starting from some - value which we will call. As varies, the vertical line sweeps out an area under the 79


92 curve equal to. is the area function for the curve or under. The term is considered as a small (infinitesimal) increment along the -axis (see figure 2.11). Figure 2.11: Tracing out the area function Using suitable examples such as those involving accumulating quantities, it is possible to come to the realization that the rate at which the area function is being swept out is equal to the height of the original function or that: or. Both the derivative and integral concepts have many mathematical and physical interpretations. By quantifying aspects of real world situations, scientists study real world phenomenon using mathematical models. In mathematical modelling, mathematical notation and methods are used to express and to reason about relationships among quantities (Thompson, in press). Central to understanding the derivative-integral relationship is an understanding of the concepts of variable and function in Calculus. Two ways of thinking must be cultivated in order to develop a sophisticated understanding of the derivative-integral relationship. The first one involves imagining a quantity whose value varies (Thompson, in press, p. 24). The second involves holding in mind invariant relationships among quantities values as they vary in dynamic situations (Thompson, in press, p. 23). Whereas Carlson (in Carlson, 1998; Carlson et al., 2002; Carlson & Oehrtman, 2005; Carlson, Persson, & Smith, 2003), stresses the importance of covariational reasoning as a foundation for students understandings of function, Thompson (in press) models a new line of thinking combining quantitative reasoning and covariation. The first step in quantitative reasoning is mentally assigning a quantity a measure, which is able to assume different values at different moments, (in other words vary). Any varying quantity will naturally have another one varying in tandem with it, in that way introducing elements of co-variation. 80
93 The main difficulty in mathematical teaching lies in the fact that the representations and images the expert has (however coherent and convincing) are not necessarily interpreted in the same way by the students. Studying episodes of student engagement with learning tasks to get a sense of their reasoning was critical to understanding how to support their learning. (a) Student understanding of the derivative-integral relationship. The works of Thompson (1994), Saldanha and Thompson (1998), Thompson and Silverman (2008), and Estrada-Medina (2004) showed that students had difficulties identifying and coordinating dynamic quantitative relationships, starting from the idea of rate-ofchange, building up to the relationship between rate and accumulation. Students generally lacked the mental actions required to form dynamic and coordinated images of accruals, accumulating accruals. Students had difficulty comparing a quantity s accumulation measure with one of its constituent measures. This difficulty arises because the constituent measures accrue multiplicatively and not additionally. For most of us, accumulation intuitively conveys images of addition, not multiplication. To overcome this, Carlson, Larsen and Jacobs, (2001); Carlson, Larsen and Lesh (2001); Estrada-Medina (2005), and Smith (2008) all suggested exposing students to activities developed using a covariational reasoning framework. Students exposed to such frameworks developed the ability to apply covariational reasoning to solving problems involving accumulation tasks. However, they lacked the mental actions required to gain an understanding of the relationships expressed by the FTC. Orton (1983), Tall, (1993), and Doorman (2005) cited problems with the way in which the mathematical notation was introduced. A recurrent problem was the formalisation of the limit concept (Orton, 1983; Tall 1993; Doorman, 2005; Lauten, Graham, & Ferrini- Mundy, 1994; Cornu, 1991 and Williams, 1991). Introducing graphical representations was also problematic. When it was done, there was usually a disjuncture between what the teacher believed was being projected and what the students ended up understanding (Christou, Papageorgio & Zachariades, 2002; Çetin, 2009; Nemirovsky & Rubin, 1992; Doorman, 2005). As a result, students failed to make the required links between the physical phenomena (accumulation -rate-of-change) and their graphical representations (area-tangent) connections. From the literature reviewed, students had difficulties understanding accumulation. They battled with recognizing the constitutive elements of the accruals of an accumulating quantity (Thompson, 1994). Hence, they 81
94 struggled with interpreting the derivative-integral relationship in the FTC statement (Carlson et. al, 2003, Thompson & Silverman, 2008). (b) How to teach a learning unit introducing the Calculus concepts. In general, Calculus has an abundance of definitions, formulizations and notions that the student is required to master. Depending on the context of teaching, different conceptions of these two mathematical operations exist. The derivative of a function at could be conceived as: the limit of the ratio when tends toward. The first order coefficient of the expansion limited to order 1 of the function at a ; the slope of a highly magnified portion of the graph itself (for a locally straight graph) Integration could be conceived as the inverse operation of differentiation, a process for obtaining lengths, areas, volumes, a continuous linear form on a space of functions, or more generally, a process of measure (Artigue, 1991, p.175). In general, the most common approach to introducing Calculus concepts is one that emphasizes algebraic algorithmization. The result is that students end up reproducing learnt concepts devoid of meaning. Artigue (1991) reported on three studies in which knowledge obtained from research on students ways of learning and teaching was tested in teaching environments, in what she terms didactic engineering. In one of the approaches, D Halluin and Poisson (1988) introduced Calculus concepts without first exposing students to the limit idea. Their strategy involved mathematization of situations, leading into learning about the derivative-integral relationship. The computer was used to support cognitive functions. Associated with each function were three objects: a picture, a graph and a formula (PGF). In the process of finding solutions to a problem such as the construction of a road, students learnt about the converse nature of the differentiation-integral link. Tasks included using the data provided in tables to determine the slope from the difference tables and the area from the sums. The computer assisted in providing a platform for visualizing the slopes and area curves. The skills and concepts learnt were transferred to other contexts; speed (motion approach) and distribution of salaries (statistical approach to the integral). The algebraic operationalization came later, building on simple calculations of slopes and areas, using previously developed tools (Artigue, 1991, p.190).the approach used in this study is a simple version of D Halluin and Poisson s model (1988), without the sophistication of the technological tools. The starting point of the learning sequence is a simple problem involving two animals 82
95 running at different rates while accumulating distance in short time interval. Details of the design and development of the HLT are presented in the methodology Chapter IV. Artigue (1991) questioned if these approaches focusing on strengthening the intuitive beginning of Calculus concepts would not later become stumbling blocks to an understanding of formal concepts. I would tend to disagree. More than 30 years ago I was a university student subjected to Calculus courses devoid of any meaning. This is why I now have no recollection of what transpired because I was just reproducing algorithmic content. I believe that meaning-making should be part of the Calculus curriculum at some point before students begin the formal syllabus Summary My proposal was that building an understanding of the derivative-integral relationship begins with a discussion of a quantity s accumulation and rate-of-change. Students would then be given opportunities to solve problems involving these ideas, where they would use symbolic devices (graphs, algebraic equations and the limit) as reasoning tools. I envisioned that it was possible to lead students to a stage where they would develop the ability to use algorithms and symbolic methods to interpret the derivativeintegral relationship meaningfully. Two issues emanated from the didactical analysis in this section. First, teaching the derivative-integral relationship was a complex undertaking. There were a number of difficulties students faced while learning Calculus concepts. These were related to the mathematical syntax, conceptual understanding, and making sense of graphical representations. Understanding the derivative-integral relationship was complex because it involved understanding each concept separately, understating additional concepts such as the limit, and then coordinating an understanding of the relationship between the two. In the studies discussed, the basic Calculus concepts were treated separately and then unified in the FTC relationship. In this study, an attempt was made to evoke an understanding of the derivative-integral as a unified entity, through an investigation of accumulation. The second issue had to do with the jump from perceptual (intuitive) to symbolic (formal) thinking. In most of the studies presented, the teacher had a very clear structure of what needed to be communicated to the students to bring about the desired understanding and mathematical reasoning. A number of frameworks (Dubinsky, 2000; Tall 2004, 2007, & 2008; Thompson, 1994: Carlson et al., 2001) have been developed to map the paths students should take to come to an appropriate understanding of this relationship. However, the studies still lack simple, replicable 83
96 examples of how students can be assisted in developing the required understanding. This dissertation is an attempt to contribute to this undertaking in the form of an instruction design framework for introducing Calculus concepts through distance learning Discussion Conventional instructional design approaches do not offer clear mechanisms for supporting mathematics students in using their intuitive forms of reasoning as springboards to more formal, sophisticated ways of mathematical reasoning. RME seems to be able to offer a mechanism for developing and trialling prototypical instructional sequences designed to achieve this. This process is underpinned by local instructional theories. The activity of designing instructional activities is guided by a conjectured local instruction theory, which is developed in advance, refined and adjusted in the process (Gravemeijer, 2004, p 9). In this project, I did not develop a local instructional theory. Rather, I attempted to use the RME approach to develop a learning sequence introducing the relationship between the derivative and integral. History revealed that the development of the derivative -integral relationship evolved from intuitive notions based on geometric representations, to precise and formal definitions of function, limit, derivative and integral (Klisinska, 2009, p. 93). Leibniz had images of differentials accumulating to form the integral. According to Newton, one could reconstruct a fluent quantity from information about its fluxion. Riemann consolidated the idea of the integral as an area under a curve, among others, while Cauchy formalized all the important Calculus ideas. The development of notations or symbolizing was in response to solving geometrical problems of tangency and the area under the curve. Therefore, representations of these ideas played an important role in the formalization of the fundamental Calculus concepts. The algorithmization of the problem solving strategies followed later. The challenge now lies in congregating all these ideas into a meaningful structure and sequence which is easy to comprehend. As the survey of different texts has revealed, there are several ways of presenting and teaching the derivative-integral relationship. Bressoud s (2006) view is that we should consider a Fundamental Theory of Integral Calculus in order to connect the two different ways of interpreting integration as the main source of understanding the derivative-integral construct. The first interpretation has a view of the integral as a limit of a sum of products; the second treats the process of integration as the inverse of differentiation. According to Bressoud (2010), the FTC 84
97 evolved from a dynamical understanding of total change as an accumulation of small changes proportional to the instantaneous rate-of-change. Consequently, this is the point from which student understanding of the FTC should evolve. Once this is accomplished, the construct can be linked geometrically to the determination of an area, the limit of approximating sums, and then antidifferentiation. I gravitate towards adopting Thompson s (1994) idea of having the students visualize the tangents to curves and areas bounded by curves, as means of searching for general solutions to problems of accumulation or change that could later be expressed analytically. From a didactic perspective, the literature did not clearly reveal how the obstacles to learning brought about by mathematical symbolism, difficult concepts such as the limit, and the construction of curves could be eliminated. Didactically, it seemed that the derivative and integral could be regarded as tools for describing and organizing functional relationships between changing variables. Knowledge of the limit concept underpinned mastery of the derivative and integral concepts, and it was important to devise some way of introducing the limit concept without overburdening the students. My conjecture was that learning by examining the process of a quantity s accumulation and rate-of-change would compel students to constitute the mental objects required to develop an understanding of the derivative-integral relationship. The challenge for the participating students was to develop their own intuitive models representing the changing quantities involved. Mathematics is a language of both description and analysis (Sikk, 2004, p.143). Calculus is an important part of mathematics which offers opportunities for orienting students to this language, as well as its methods and techniques. Introducing the FTC is one of the ways in which this exposure can commence. The instruction design challenge for this research has been to develop a learning sequence connecting students initial intuitive models to a formal model of the FTC differentiation-integration relationship using the appropriate mathematical language and forms of reasoning. Assigning meaning to notations and making sense of representations are important in meaningful constructivist learning (Wessels, personal communication, August 12, 2011). This project sought to establish how feasible it was to design and develop a HLT (instructional sequence), introducing the required mathematical content and the anticipated mode(s) of reasoning, guided by the principles of RME. In the next Chapter 3, I present the RME framework. 85
98 CHAPTER III REALISTIC MATHEMATICS EDUCATION AS AN INSTRUCTIONAL DESIGN FRAMEWORK 3.1. Introduction As indicated in the previous chapter, the theoretical foundation for the instruction design for distance learning used in this study is based on the theory of Realistic Mathematics Education (RME). The expectation was that adapting the instructional design heuristics of RME as tools for creating a Calculus unit would help students to bridge the difficult transition from informal intuitive forms of reasoning to the more formal mathematical ways of reasoning. Using this theory, students are led through a process of guided re-invention as they learn to reason and engage with mathematical tasks. Freudenthal (1991) wanted to move away from presenting mathematics as a fixed system of rules. Instead, he proposed developing organised activities from which students could be steered towards re-discovering the formal mathematical rules and relations themselves. Freudenthal s (1991) belief was that in order for mathematics to be of any value, it had to be connected to the reality 4 of the cognizing subject or student. To Freudenthal, mathematics was not just the body of mathematical knowledge, but the activity of solving problems, looking for problems, and organizing a subject matter (Freudenthal, 1971, p.413). He labelled this activity of doing mathematics, mathematizing. The FTC is a powerful tool from which an understanding of the relationship between the basic Calculus concepts the derivative and the integral can be developed. The anticipation was that as students came to reason about the ways in which the key ideas of rate-of-change and accumulation are connected, they would be supported in developing an understanding of what the FTC represented. Through a process of progressive mathematization, students advance from one level to a higher level of understanding. Symbolic devices such as graphs, algorithms and definitions become useful tools when students build them through a process of suitably guided reinvention (Rasmussen & Kwon, 2007, p. 191). The aim of this project was to examine student progressive construction of the relationship between the two mathematical ideas by considering how they generate, 4 Reality refers to both real life contexts and mathematical situations that students experience or perceive as natural or real (Drijvers, 2002). 86
99 link, refine and utilize this association over the course of a learning unit. This examination is preceded by a didactical phenomenology, an analysis of the structural connections between a mathematical concept and the phenomenon from which it arises, from a teaching and learning perspective. This exploration provided responses to two key questions in this study: How can an introduction to an understanding of the derivative-integral relationship be supported using the RME theoretical perspective at a distance? What type of activities should be designed to promote the desired kind of reasoning? In the rest of the chapter, I provide a description of RME framework that informed the design of this study. This includes an elaboration of RME in terms of its three main heuristics: guided reinvention, emergent modelling, and didactical phenomenology. In the last section, I introduce other theoretical perspectives that have been considered in the study The RME Framework Instructional design for mathematics learning at a distance has always been a challenge as the teaching text has to be developed in such a way that the learner is motivated to start reading without prompts, cues or guidance from a tutor. Conventional Calculus instructional text is usually designed in a particular way. The beginning section is usually an introduction which introduces a rule or definition, followed by worked-out examples, and problems for the students to try out. Detailed explanations and remedial questions follow with answers. Current distance learning modules are planned using well-defined learning outcomes from which activities are developed. Assessment tasks are used to gauge whether the learning outcomes are achieved at the end of each learning unit. Although this could be appropriate for procedural learning, it is totally unsuited for conceptual learning where the student has to develop understanding and reasoning abilities. A number of frameworks have been used to outline how students construct meanings of mathematical objects. These include: Tall and Vinner s (1981) distinction between concept image and concept definition. 87
100 Cognitive frameworks developed to map out processes for mathematical concept formation including Dubinsky s (APOS) theory and Tall s (2007, 2008) three-world framework (conceptual-embodied, proceptual-symbolic and axiomatic-formal) within which mathematical thinking develops. Versions of the Covariation and the FTC frameworks trace a path students should take when developing an understanding of the FTC (Carlson et al., 2003, Thompson 1994, Smith, 2008). Aspects of these theories have informed the instructional design process in this project. However, these frameworks do not provide a very clear direction concerning the kind of philosophy that should be adopted when teaching mathematics at a distance. Adopting a purely formalistic approach for introducing Calculus concepts seemed inappropriate especially as the intention was to introduce mathematical concepts to nonmathematicians. Freudenthal s (1991) idea of starting learning mathematics in real life contexts made sense. He perceived mathematical educational processes as continuous, evolving from rich, complex structures of the world of everyday-life to the abstract structures of the world of symbols, and not the other way round (Gravemeijer & Terwel, 2000, p. 785). He maintained a belief foundational to RME the belief that mathematics is a human activity with the end goal being the formation of some mathematical reality (Freudenthal, 1991). The development process of the mathematical learning content and student understanding of the FTC in this study is consistent with such a belief What is RME? Realistic Mathematics Education (RME) is an instruction theory developed within and for mathematics education (Treffers, 1987; De Lange, 1987; Streefland, 1991, Gravemeijer, 1994; Van den Heuvel-Panhuizen, 1996). It offers a didactical philosophy on teaching, learning and designing instructional materials for mathematics. The theory is rooted in Freudenthal s (1991) view of mathematics [as] a human activity and not a well-organized deductive system (Gravemeijer, 1994, p. 46). An upheld standpoint in RME is that learning of mathematics should begin with real problem situations that students need to resolve. A central construct in RME is progressive mathematization. Mathematicians take subject matter from reality and organize it according to mathematical patterns in order to solve problems from reality (Gravemeijer, 1994). There is no mathematics without mathematizing (Freudenthal, 1973, p. 134). There are two types of mathematization: horizontal mathematization, which refers to modelling a problem situation into 88
101 mathematics and vice versa, and vertical mathematization, which refers to the process of reaching a higher level of mathematical abstraction (Drijvers, 2002, p. 192). The idea that moving from the world of life to the world of symbols was horizontal mathematization while operating within the world of symbols is vertical mathematization was emphasised by Freudenthal (1991). However, this idea originated from the work of Treffers (1987). Mathematizing (organizing from a mathematical perspective), involves a series of progressive analyses and interpretations from one level to another. This process of progressive mathematization provides a trajectory through which learning may occur. According to Gravemeijer (1994, p. 446), instructional activities should capitalize on mathematizing as the main learning principle. Mathematizing enables students to reinvent mathematics. If adapted properly, the realistic approach to mathematics education is suitable for conceptual development as students are engaged in deep processes of mathematizing the contextual problems (horizontally) and mathematizing solution procedures (vertically) (Fauzan, 2002, p.41). Treffers (1987) distinguishes the realistic approach from a mechanistic approach, which has neither horizontal nor vertical mathematization, a structuralistic approach, which puts emphasis on vertical mathematization, and an empiricist approach with a focus on horizontal mathematization only Guided re-invention This first principle states that students should be given the opportunity to experience the learning of mathematics in a process similar to the way mathematics was invented (Gravemeijer, 1994; Bakker, 2004). The instructional activities used should provide students with experientially real situations from which they are able to form or construct their own solution strategies. With guidance from the instructor, the students are led into a process of re-inventing formal practices through progressive mathematization themselves (Freudenthal, 1973). Another important construct in RME relates to context problems. Context problems provide students with starting points from which reinvention through progressive mathematization can occur. These contextual problems allow for individual student constructions of solutions, but also provide for a possible learning route through progressive mathematization (Gravemeijer & Doorman, 1999: Kwon, 2002). The selected problems are set in contexts allowing for horizontal mathematising. At the same time, there should be room for model-type contexts that permit vertical mathematizing for progression within the subject structure. 89
102 Conceptual learning requires an instruction design practice where the emphasis is on students constructing, not teachers instructing (Gravemeijer, van Galen & Keijzer, 2005). In this instructional design approach, there is a shift in attention from learning outcomes (knowledge, skills and competencies) to the mental activities of students. To make sure that the learning sequences developed are modelled such that they trace the learner s constructions or cognitive path and not the teachers, Simon s (1995) notion of a Hypothetical Learning Trajectory (HLT) is used. The HLT provides the teacher/instructional designer with a rationale for choosing a particular instructional design. Such a trajectory is made up of three components: (a) the learning goal or purpose that shapes direction of teaching and learning, (b) activities to be taken by students and the teacher, (c) a possible learning route or cognitive process, which is a a prediction of how the students thinking and understanding will evolve in the context of the learning activities (Simon, 1995, p. 136). The HLT is flexible and cannot be known in advance. Using thought experiments, the teacher designs an HLT on the basis of an interpretation and anticipation of where the students are (or ought to be), in terms of their actions and reasoning abilities and the desired learning goals. The teacher will keep on adjusting the HLT according to the students responses to it until the desired goals are attained. A decisive component of the learning sequence is its starting point. The RME instructional designer uses different techniques for identifying starting points which are experientially real to the students and allow for students differentiated ways of developing understanding. Three methods appear in the literature: thought experiments, studying the history of the mathematical issue at hand, or using informal solution strategies from students. When using thought experiments, the instructional designer thinks about ways s/he could have invented the mathematical issue at hand (Freudenthal, 1991). The designer then envisions how the learning might proceed. By analyzing evidence from the design experiments, one is able to establish whether the expectations imagined are affirmed or rejected. The practical feedback is drawn into subsequent thought experiments to inform the next round of design Emergent modelling The instructional design of the distance design experiments in this study is organized around the idea of emergent modelling (Gravemeijer, 1994, 2004: Bakker, 2004). A model may involve making drawings, diagrams, or tables, or it can involve developing informal notations or using conventional mathematical notations (Gravemeijer, 1999; Gravemeijer et al., 2005, p 3). RME models are developed to support progressive mathematization and to assist students in progressing from 90
103 informal to more formal mathematical activity (Kwon, 2002; Bakker, 2004; Doorman, 2005). The activity of modelling is a major principle in the RME framework. The modelling process commences with a problem from which students can model their own solutions. The problem is situated in a context sufficiently real to the students so that the problem solving process makes sense to them. Students are allowed to form their own informal strategies but are guided into a direction corresponding to the required solution strategies. The models start off as context-specific and should evolve into more abstract mathematical entities, from which formal mathematical reasoning can develop. The preliminary models are model-of student specific strategies derived from students encounter with the context problems. These models emerge from students activities combined with the mathematical reasoning targeted in the development of the relevant concepts. Student inscriptions, together with tutor-guided discussions of ideas generated from mathematical perspectives become models-of student-specific methods. Ultimately, models of informal mathematical activity should develop into models for more formal mathematical reasoning. Within an RME approach, the models are not regarded as entities external to the student. Models are cognitively generated from the meaning students make out of the given situations. There are aspects of the modelling idea that mirror those of Yerushalmy and Sternberg s (2004) didactic model, which they developed to support the construction of an understanding of the function concept. This model consisted of dynamic software built to model the function concept and the physical phenomena the functions represented. Students used the model to analyze a function in two ways: from a function to its change and from a change to appropriated functions (p. 185). Students using this model demonstrated an ability to figure out co-varying quantities, to represent constant and non-constant changes, and to make the link between the graph of accumulated quantity to the graph of change (Yerushalmy, & Sternberg, 2004, p. 191). This project lacks the funding to emulate Yerushalmy and Sternberg s (2004) model but some of the ideas used by these authors form part of the learning sequence. An important criterion for judging the usefulness of emergent modelling is the model s potential to support mathematizing in line with the student s thought processes (Gravemeijer, 1994, p.188). Normally, there are four activity levels (situational, referential, general and formal) (Gravemeijer, Cobb, Bowers & Whitenack, 2000). These have been modified to form an emergent model heuristic with situational, referential, general and formal activities (Gravemeijer, 1999) (Table 3.1). 91
104 Table 3.1: Emergent model heuristic Stage Model level Description of Levels Formal 4. Formal Formal activity involves students reasoning with conventional symbolizations, in ways that reflect emergence of a new mathematical reality, which no longer requires the support of prior models -activities. Pre-formal 3. General General activity involves models-for that facilitate a focus on interpretations and solutions independent of the original task setting. 2. Referential Referential activity involves models-of that refer implicitly or explicitly to the physical or mental activities to the original activity in setting described. Informal 1. Situational Activity involves students working towards mathematical goals in an experiential setting - interpretations and solutions depend on understanding of how to act in the setting While this model heuristic provides a yardstick for tracing student engagement, it was felt that the model lacked a dimension for gauging and examining the mathematical structures and cognitive processes forming the re-invention process. This dimension has been added using Nixon s (2005) framework of development for levels for learning abstract algebra. Nixon based her analysis on the historical development of algebra and a synthesis of mathematical contributions spanning decades of research, such as the work of Piaget and De Garcia. Her conclusive proposal was a spiral theory of learning algebra with three distinct levels (perceptual, conceptual and abstract). While this study does not assume Nixon s level of depth and mathematical rigor, the distinct demarcations have aptly been used to structure and build levels of progression in the tasks forming the HLT. Students begin at the perceptual level, progress through a conceptual level ending up at the abstract level of understanding. The models have been combined to form a framework from which learning tasks are designed and later analyzed (see table 3.2). Table 3.2: Combined Nixon (2005) and Gravemeijer (1999) s models Nixon s levels for advanced algebra Gravemeijer s emergent model levels Perceptual Level Involves isolated forms Informal Situation activity involves students working toward mathematical goals experientially Conceptual level Pre-formal Abstract level Concerns correspondences and transformations among forms Characterized by the evolution of structures of forms Formal Referential activity involves models of that refer (implicitly or explicitly) to physical and mental activity in the original task. General activity involves models-for that facilitate a focus on interpretations and solutions independent of the original task setting. Formal activity involves students reasoning n ways that reflect the emergence of a new activity and, consequently, no longer require support of prior models for activity. 92
105 The result is a framework allowing description and analysis of student progression from the informal (intuitive) modes of thinking to more formal mathematical ways of reasoning Didactical phenomenology of accumulation. A didactical phenomenology is an analysis of a phenomenon in terms of how it is learnt and taught. According to Gravemeijer (1994, 1999), the goal of a phenomenological investigation is to identify problem situations for which situation-specific approaches can be generalized. In conducting this phenomenology, the researcher tries to locate situations from which solution procedures leading to vertical mathematization are developed. Since mathematics usually evolves from solving problems, it makes sense to trace those contextual problems likely to lead to the desired learning. The phenomenon selected should be real and meaningful to the students but also allow for mathematical abstraction. The challenge is to find phenomena that beg to be organized (Freudenthal, 1983, p.32) by the concepts or constructs one intends to teach. In this section, I first review the pheneomenological analyses of Freudenthal (1993) and Bakker (2004) before proceeding to describe a condensed phenomenological analysis of accumulation as it relates to building an understanding of the FTC. In a paper focused on constructing a didactical phenomenology of the concept of force, Freudenthal (1993) put forward ideas related to teaching a concept outside of mathematics but close enough (in Physics). I selected this example because it accentuates the idea of learning of concepts in the sciences and mathematics being a human activity, and that didactically linking this activity to the reality of the student, and attempting to have the student experience a process of guided reinvention could have the potential of bringing about the desired form of learning. For mathematics, the activity is mathematizing. In order to introduce the concept of force, Freudenthal (1993) invented a counterpart term of mechanising, or in a more general way, subjectrestructuring (p. 72). In RME terms, one would then search for situations allowing for horizontal mechanising (linking reality to the world of symbols), and vertical mechanising (working in the world of symbols). In Freudenthal s (1993) terms, a number of science instructional texts were either structuralist (accommodating vertical mechanising), or empirist (allowing for horizontal mechanising). Very few texts allowed for both. Freudenthal (1993) went on to illustrate that even though some real life experiences interfered with scientific ideas, for learning, it was better to have learning processes started just there and the learner, under guidance, transform them into what we consider scientific (p. 86). 93
106 His phenomenology of force had three aspects: a static aspect, a measurement aspect, and a kinematic aspect. The advice given on beginning a learning sequence was always to start with something that was openly observable. In the case of the static aspect of force, this could involve exposing learners to muscular experiences such as pushing each other until the weaker one gave in, or a tug of war. These could then be extended to situations in which objects were stopped from falling using the hand. The muscular force could then be replaced by some innate object such as a table. Eventually, students would be exposed to complex systems involving static forces such as those containing objects hanging on chords or pulley wheels. The plan was to get students to begin reasoning intuitively about the idea of the invariance of force from personal experiences of force. A representation of forces using arrows (force vectors) would be delayed until an introduction to measurement was made. A phenomenology of measurement revealed three constitutive elements; a concept of equivalence to allow assigning the same measure to comparable objects, a method of compounding or adding (accumulating) measures; and a unit of measurement. Experiences involving weight were appropriate. It was important that students distinguish between weight and mass, develop an awareness of the proportionality of mass and weight, but also observe that weight did not only depend on mass. Students would be exposed to different types of measurements (scalar and vector).both geometrical and mechanical measurements were also important. If a spring balance was used, it was vital that the students gain insight into the fact that the thing measured by a spring balance was a force (Freudenthal, 1993, p. 78). Regarding the kinetic aspect, the idea being developed was that force expresses itself by changing the state of motion (Freudenthal, 1993, p. 80) of an object. More force meant more motion in the direction of the force which was the acceleration. An object at rest did not necessarily indicate an absence of force but could be considered a limit case of motion (Freudenthal, 1993, p. 80). For the kinematic aspect, it was possible to have students go through muscular experiences of force such as pushes, pulls, strains and brakes as starting points for the learning. These could be effected in different scenarios involving objects at rest, falling objects or objects moving in circular motion. It was important to introduce aspects of friction, inertia and relativity. From then on, it seemed feasible to introduce ideas related to vector manipulations of force and acceleration, and later on the equivalence relationship for force, mass and acceleration : F = ma. Freudenthal (1993) frequently looked back to history for information about patterns of thought around the development of an understanding of force. For instance, 94
107 Descartes description of force is what we currently call work. Force was a function of velocity to both Descartes and Leibniz. In his research on design research in statistics education, Bakker (2004) presented two didactical phenomenologies pertinent to his research, one for distribution and another for centre, spread and sampling. I only consider the one for distribution. Prior to this exercise, Bakker (2004) had conducted an extensive historical phenomenology of statistics. Uncertainty and variability were pinpointed as the two major phenomenon on which statistics was based. He noted that analysis of these two phenomena required the creation of data and analysis of patterns and trends using diagrams. He identified distribution as a key concept in the process of analysing data. It was an important organizing conceptual structure (Bakker, 2004, p.101) for learning statistics. This concept had other related aspects such as centre, spread, density and skewness. Bakker (2004) needed to develop a HLT in which students were assisted in developing a notion of distribution with an aggregate view of data. The tendency was for students to concentrate on individual aspects of data. The purpose of the learning unit was to have students model data informally and come to see measures of centre and spread as characteristics of a distribution Bakker (2004, p.102). Describing and predicting were important skills. Both Freudenthal (1993) and Bakker (2004) started off by identifying phenomenon that needed to be organised. In Freudenthal s case, the phenomenon in question was split up into three aspects which were also subjected to individual phenomenologies. For Bakker, the phenomena identified were organised by one concept with different aspects. In retrospect, both analyses contained structural elements (related to the phenomenon or the mathematical concept) in question. The issue of a measure came up in both instances. Each case included a reference to a learning goal and the mathematical skills that students needed to master in order to achieve that goal. History was a source of direction in both instances. In order to identify an appropriate phenomenon for this study, I needed a vivid description of the derivative-integral connection that included structural aspects and features of measure that could stimulate understanding of this connection at a basic level. I then needed to get a sense of how students were likely to interpret this connection, and how learning would occur. Finally, I needed to identify problem situations from which approaches for introducing the derivative-integral relationship could be developed. 95
108 The basic phenomenon studied in Calculus is change or variation. Working out lengths, areas and volumes using the method of exhaustion evolved into integral Calculus (see section, 2.2.1, part (a), this dissertation). Finding solutions to problems dealing with tangents and optimization led to differential Calculus. Eventually, this set the scene for the development of integration and differentiation as mathematical operations by Newton and Leibniz. It also led to the realization that the two operations had a somewhat reciprocal relationship (see section 2.2.2, this dissertation). Cauchy is credited by Kleiner (2001) for forming a stricter theoretical foundation of Calculus with the limit notion. From the time of Weiestrass, there have been inclusions of formal definitions and notions. Some of them have dissipated while others (such as the differentials), continue to exist where they have value (applications in Engineering and Physics). The notion of accumulation has been taken as an organizing structure for this study. The conjecture was that if accumulation was understood in a context where it visibly appeared and was analysed simultaneously with the rate at which the accumulation occurred, establishing an understanding of the relationship between the accumulation and rate-of-change will become clearer. This would then form a basis from which reasoning about the integral-derivative connection would develop. Possible starting points included a context involving a fixed amount of water flowing with a constant rate into containers of the same height but different shapes. Students are familiar with this context and the water quantity could be controlled to demonstrate the required changes. Following the introductory task of water pouring into different-sized containers of equal height, the notion of accumulation would then be problematized by a modified version of the model eliciting bottle problem (Carlson, Larsen & Lesh, 2001; Carlson, Jacobs & Larsen, 2001). In this problem, students are required to construct a graph of the height of the water as a function of the amount of water filling a bottle with a narrow neck. Cordero-Osorio (1991) accumulation of flow reasoning seemed a plausible basis for asking questions about the accumulation and rate-ofchange connection. Cordero-Osorio (1991) suggested that a basis from a Calculus didactic discourse could emerge. He analyzed the construct-product processes of differentiation and integration and how they become unified. His focus was on integration. He divided the representation of the phenomenon or system into two classes: continually changing quantities of systems or processes, and variable functions. According to Cordero- Osorio, each continuously changing quantity is able to change with respect to one or several parameters. Since there is a linear relationship between the parameter p and 96
109 the quantity Q, analysing the state of the parameter leads to an understanding of the state of the quantity. Recognition of the local state of a process or quantity is essential for determining its total state.this construal is applied both to geometrical and mechanical situations, as expressed by the 'taking of a differential element' (Cordero- Osorio, 1991, p.871). Working from a functional thinking point of view, differentiation and integration are defined with the concept of a limit. Cordero-Osorio (1991) discussed three types of functional relationships: (i) between a function and its derivative, (ii) between a function and its integral, (iii) a relationship whereby one is able to reproduce the original function, given that. Cordero-Osorio argued that the systems of changing quantities and functional variations are unified when their evolution is considered in terms of time. He used the expression to denote the accumulation of flow of the system, and to describe the evolution of a system in two directions: (a) through its variations, and (b) through the taking of the differential element and its integration (Cordero-Osorio, 1991, p.871). The RME instruction design goal then becomes to search for those contexts where the drawing of the curve mathematizes a given situation (1991. p. 55). For this study, a construction of the derivative-integral relationship was examined in relation to an accumulating quantity. The first part of quantitative covariation reasoning requires a conception of images of two quantities varying simultaneously. The second part of the reasoning is more complex. One would need to conceptualize an image of the multiplicative combination of the accruals fused into one unit, and sustain an image of this resultant unit within the dynamic situation (of variation) it is entrenched. An attempt was made to project this conceptualization onto a graphical representation of the accumulating quantity. The thinking was that the derivative would be thought of as a conceptual tool providing a way of algebraically keeping track of the quantity s variable rate-of-change. The integral would relate to a measure of the accumulated quantity. The HLT pieced together for this research aspired to support students development of increasingly sophisticated forms of covariational reasoning for an accumulating quantity. It made sense to take the notion of accumulation as an organizing structure for this study. The conjecture was that if accumulation was understood in a context where it visibly appeared simultaneously with a rate-of-change, then establishing an understanding of the relationship between the two would become clearer to students. This research project has been an attempt to get students to develop a notion of functional thinking in which the derivative and integral appear as related functions. The 97
110 functional thinking in this case has two aspects: an aspect of change (dynamic view of function), and an object view (object view of functions, as a whole) (Hoffkamp, 2010, p. 3. In other words, students would learn to model aspects of change and variation while inculcating the derivative-integral connection at an informal level, using the idea that the behaviour of one small unit within the varying quantity locally represented the behaviour of the entire quantity globally. The anticipation was that students would later view this connection as an object, assisted with modelling processes using suitable graphs. This impression resonates with Freudenthal s (1991) idea of a moving ordinate segment tracing out an area corresponding to an integral, and whose height links to a slope, or derivative. The FTC equation became the foundation from which learning tasks and questions probing and evoking students to reveal their conceptions of accumulation and the rate-of-change were designed. Graphical representations were used as models for explaining the derivative-integral construct. Information regarding initial students intuitive and informal ways of reasoning about the derivative-integral relationship was obtained from four sources. The first source was an examination of the research literature on the teaching of the derivative-integral concept (section 2.4).The second source consisted of two exploratory studies (distance design experiments) conducted with six Unisa students in 2008, another group of six students in The third source was from an interview with a lecturer involved with teaching Calculus. The fourth source was comments on the HLT by two RME experts from the Freudenthal Institute in the Netherlands. Together, these sources formed the basis from which insights into how the learning sequence was structured and where it would begin. Details of the findings are provided in the methodology Chapter IV, as part of the preparation and design of the learning sequence. The history of the development of the derivative-integral relationship in the FTC (section 2.2) provided a provisional, potentially revisable learning route along which progressive mathematization could occur (Gravemeijer, et al., 2005). From the historical review, it was established that the draft learning sequence would involve approximations, modelling (graphical, numerical representation) followed by a mathematical examination of a snapshot of what is going on at specific points within the quantity (see figure 2.6). The stages described were transitional and possible routes through which the intended mathematics could be reinvented. The historical accounts contained sufficient examples of contextual problems that had a range of 98
111 informal solution procedures, which could create opportunities for the reinvention process and progressive mathematization. These examples involved some type of motion (or a change in a given quantity) Foregrounding Perspectives Foregrounding perspectives are outlooks that have supplemented the RME instructional design framework in this project. These include the constructivist approach, semiotics and symbolizing, and Thompson and Saldanha s (1998) conceptual analysis language A constructivist slant The RME strategy is compatible with constructivist theories (see Cobb, 2004; Cobb & Yackel, 1996; Simon, 1995), which place the students at the centre of learning. Central to the constructivist idea is the notion that sees personal knowledge as built from each individual s organizing experience through mental operations that become dynamic structures for the investigation principle (Piaget, 1977). This view of learning harmonises distinctively with Dubinsky s (2000) APOS theory which requires the learner to act on and process mathematical objects mentally in order to develop conceptual understanding (see section 2.4.1, this dissertation). Additionally, the social constructivist classroom has the teacher helping students to co-construct mathematical knowledge as a learning community ( Cobb, Wood & Yackel, 1992). As a result, students become self-reliant learners, able to provide individual solutions, justify their answers, and negotiate meanings with other members within the classroom community. The teacher maintains the responsibility of selecting the mathematical content, the arguments, coordinating discussions and offering support and guidance. This project is underpinned by constructivism as ultimately, the goal of distance learning is to help students become self-reliant learners. Constructivism represents a specific vision of knowledge and the getting to know process. According to Lerman, (1989), p.211 it consists of two hypotheses: i. Knowledge is actively constructed by the cognizing subject, not passively received from the environment. ii. Coming to know is an adaptive process that organizes one s experiential world: it does not discover an independent, pre-existing world outside the mind of the knower. 99
112 The shortcoming for this project was that it was not possible to institute an inquirydriven classroom culture within a distance-learning environment. I am not sure that a single small project is able to shift didactical contract 5 between tutor and student to an extent that a culture of socio-mathematical norms as suggested by Cobb and Yackel (1996) is established. On the whole, adopting a constructivist stance has helped me become more critical when providing descriptions and explanations of students emergent thinking and ideas as they interact with the learning materials. I have tried not to take any student s report or action related to understanding for granted, but to look for the student s personal, self-constructed answers and expressions Semiotics and symbolizing Mathematical symbolizing relates to the development of representations and the meaning assigned to them in both the real (physical) and mathematical worlds. Students learning in an RME framework are expected to engage in processes of symbolization and meaning making as they develop an understanding of a mathematical construct. While mathematizing, students should progressively develop more sophisticated interpretation of the symbols they interact with. However, in most situations, such as the one in which the derivative-integral relationship is being introduced, a ready-made symbol system exists. Here, students participate in a type of symbolizing resembling instrumentation. They have to learn how to deal with an already-made symbol system in relation to conceptual development (Bakker, Doorman & Drijvers, 2003, p. 15). A mathematical symbol carries a meaning that evolves while in a dialectic relation with the knowledge of the user, the context, and the mathematical activity (Van Oers, 1998). To get a sense of what the symbol means, one has to practice using the symbol in a certain way. Meaning construction using symbols is a dynamic process. A carefully designed trajectory of symbol and meaning development is necessary to give students the opportunities to learn mathematics (Bakker, Doorman & Drijvers, 2003, p 15). Researchers employing the RME instruction design theory have found that semiotic and perception theories are useful for analyzing the relationship between symbolizing and development of meaning. In a number of these theories, a sign is made up of the signifier, (a material vehicle), and the signified, (a mental concept or reference). A signifier holds no real meaning on its own.however, the signifier points towards the actual concept or meaning (signified). The two are inseparable. 5 The didactical contract is an unspoken agreement between teacher and students about the rules of the teachinglearning game. Ordinarily, teachers pose questions to which they expect specific answers. Students work out answers expecting the teacher to evaluate them based on the correct ones (Brousseau, 1997). 100
113 Researchers dealing with mathematical instructional design (e.g., Yackel, Stephan, Rasmussen, & Underwood, 2003; Cobb, Gravemeijer, Yackel, McClain, & Whitenack, 1977) have all adopted de Saussure s (1986) symbiotic structure in their analytical frameworks. In this type of analysis, a sign is made up of a signifier/signified pair. As the mathematical concept develops, the sign (signifier/signified) is subsumed under a new signifier creating a chain-of-signification. This chain of signification provides a platform for analyzing the act of mathematizing. However, Bakker (2004) criticized the chain-of-signification theory claiming that it was too linear and simplistic for analyzing the reification process (p. 188). Instead, he suggested using Pierce s (in Bakker, 2004) semiotic framework. At first I was hesitant to use Pierce s semiotic framework as it was too complex. I reviewed Godino and Batanero (2003) semiotic-epistemological framework as an alternative. Godino and Batanero (2003) distinguish between two knowledge organizing principles, from which symbolizing and meaning making are interpreted. One is Freudenthal s (1987), (in Godino & Batenero, 2003) - in view of mathematics as a process seeking for the noumenon or organizing phenomena. The other is Wittgenstein s (in Godino & Batenero, 2003), philosophical view, which rebuts objectifying concepts and refers to habits and practices. Godino and Batanero s (2003) model consists of four primary objects for analyzing mathematical learning processes: ostensives, extensives, intensives and actuative entities. Ostensives are notational items (terms, expressions, symbols, tables, graphs). Extensives are occurrences inducing mathematical activities (problem-situations, phenomenological applications). Intensives are mathematical generalizations, (concepts, propositions, procedures, and theories). Actuative entities are actions performed by subjects while performing a mathematical task (describing, operating, arguing, and generalizing). A semiotic function is produced whenever an expression (manifestation) combines with content. The entity generated when this occurs is called a sign (from de Saussure's, 1986 semiotic descriptive language (in Godino & Batenero, 2003)). This semiotic function contains three elements: an expression plane (the initial object or sign); a content plane (the final object -the signified); and a correspondence rule for regulating the correlation between the expression and content planes, and for defining the type of content referred by the expression. The semiotic function sets up the link between a mathematical object and the system of practices from which the object originates. The relationships between these elements are the semiotic functions typifying each system s meaning. 101
114 Although Godino and Batanero s (2003) framework has distinct descriptions, it could not be used to adequately describe student productions, especially the graphs. It then made sense to use Pierce s semiotic framework. In Pierce s framework, a sign is linked to an object and the interpretant (a sign-mediated response). The inclusion of a third element and the fact that this framework is not linear makes it suitable for analyzing symbolizing, as it allows for multiple linkages between signs and interpretants (Bakker, 2004). I use Peirce s framework (from Bakker, 2004) to describe the symbolizing process in section The analytic language I have used Thompson s (1994) and Thompson and Saldanha s (1998) language to describe the processes of horizontal and vertical mathematization in terms of images (objects) Like Piaget,(1977), Thompson (1994) espouses the view that knowing is a dynamic process involving mental operations which form part of larger operational structures. He distinguishes between knowledge which has a structural aspect, and knowing which has an operational aspect. Thompson and Saldanha (1998) utilize a specific model when describing and analyzing students understanding. The model appears to be an extension of Glasersfeld s (1978) conceptual analysis framework for creating models of mathematical thinking and reasoning, with some differences. First, their analyses contain vivid descriptions of the mental operations required to come to an understanding of a particular concept. Second, their descriptions distinguish between coherent, well-developed and immature conceptions. The language I have used to describe some of aspects of the different analytical stages in this study reverberates with conceptual analyses. Later in the analysis, I scrutinize the participating students text using Toulmin s (1969) argumentation method of analysis. Paying close attention to students reasoning is a fundamental characteristic of RME inspired instructional design work. It helps shape and clarify thinking about realistic starting points for mathematical instruction. It also offers new ways of sequencing learning. Failing to do this results in surface teaching. As Polya (1965, p.104) points out, What the teacher says in the classroom is not unimportant, but what the student thinks is a thousand times more important. These foregrounding perspectives have been used to cement the RME framework, particularly in terms of the analysis of student responses. A constructivist stance places the student at the centre of the investigation, not the learning tasks. The semiotic theory provides a structure, while Thompson and Saldanha s (1998) model offers the 102
115 language for analyzing and describing student developmental understanding of the derivative-integral construct Five tenets of RME Apart from the three design heuristics, RME has five tenets from which the actual teaching occurs (Bakker, 2004; Gravemeijer, 1994; Treffers, 1987). These include: Exploration. A rich and meaningful context or phenomenon is explored to develop intuitive notions to form the basis for concept formation. Using models as symbols for progressive mathematization. The development from intuitive, informal and context-bound notions towards more formal mathematics is a gradual process of progressive mathematization. Models, schemata, diagrams and symbols support the process as long as they have the potential for generalizations and abstractions. Student constructions. Students own constructions are promoted as an essential part of the instruction. Interactivity. Students informal methods are used in a process of negotiation, intervention, co-operation and evaluation as essential parts of a constructive learning process. Intertwinement. The instructional sequence is developed with some consideration of how it impacts on other learning areas. As much as possible, I tried to include all five tenets. The focus of this study was on determining the extent to which the RME instructional design theory can be used to support teaching Calculus at a distance. Therefore, I have drawn extensively from the main RME heuristics in my analyses and the development of the learning sequence. While the RME theory functions as the instructional design backbone for the learning tasks, additional input is required for structuring the learning tasks, concept formation and their analysis. For this, I have drawn from foregrounding perspectives which include the historical analysis (section 2.2), a didactical phenomenology (section 3.2.4), as well as studies on semiotics, signs, and symbolizing. These notions are combined with RME heuristics to provide a framework for the design and implementation of the distance design experiments analyzed in this study. The next section is an exploration of some of these foregrounding perspectives Summary RME offers a mechanism for developing and trialling prototypical instructional sequences designed to support mathematics students in using their intuitive forms of 103
116 reasoning as springboards to more formal, sophisticated ways of mathematical reasoning. This process is underpinned by local instructional theories. The activity of designing instructional activities is guided by a conjectured local instruction theory, which is developed in advance, and which is refined and adjusted in the process (Gravemeijer, 2004, p 9). In this project, I did not develop a local instructional theory. Rather, I attempted to use the RME approach to develop a learning sequence introducing the relationship between the derivative and integral. The underlying principle of RME is a view of mathematics as a human activity. Concepts, structures and mathematical ideas are all regarded as human inventions (Freudenhal, 1973). Three heuristics capture this principle in RME-informed instructional design: Guided reinvention which outlines the route through which students can develop the proposed learning. Emergent modelling which involves learning tasks from which students can make the transitions from developing models-of their informal activity to developing models-for more sophisticated forms of mathematical reasoning. Didactical phenomenology which is an analysis of physical phenomena, together with the related mathematical concepts or structures and how they are learnt and taught. (Gravemeijer, 1999; Stephan & Rasmussen, 2002; Bakker, 2004, Rasmussen & Marrongelle, 2006; Marrongelle, 2002; Zandieh & Rasmussen, 2010) Adapting the RME instruction design theory requires the design and development of instructional sequences that stimulate students to organize mathematical learning content at a lower level in order to construct understanding at a higher level. Students engage with contextual problems, unpack them and find the mathematical objects and relations required to assemble suitable mathematical models (sketches, formulae, graphs or tables) in a process of appropriate guided reinvention. This process has two facets - horizontal mathematizing or the formation of student generated models of the problems, and vertical mathematizing, where the models produced are refined and restructured to create the desired mathematical outcome. The products of this process are models or student mental activities and visible activities with symbolic devices such as graphs and equations. These models emerge as students interact with activities designed to elicit the required type of reasoning. Ideally, these activities should be supported by classroom interactions where each 104
117 student develops the reasoning skills enabling him/her to relate the mathematical outcome to the original contextual problem. Ultimately, each student should be in a position to reflect on whether the final result addresses the initial problem, and justify his/her choice of mathematical strategy. The intention is to have students develop new mathematical realities in a process where they gradually develop the conceptual tools and understanding at more formal levels. Guided re-invention calls for identifying starting points that are experientially real to students and relate to their informal ways of thinking. Sources of these ideas have roots in the historical origins of the mathematical concepts together with student informal solution strategies. I have found that another source of ideas is the experienced teachers. At the beginning of the design process, I put together a set of activities I thought would motivate students to reason about aspects of the derivative-integral relationship in increasingly sophisticated ways. These were rather crude but necessary steps for getting started with the instruction design process. I envisioned that a context problem involving the accumulation and rate-of-change of a quantity would be a good starting point for the learning sequence. The intention of the first activity was to immerse students into an experience and a discussion of what accumulation and rate-of-change were, and how they are (or could be) measured mathematically using a problem dealing with motion as a starting point. A big part of the second activity would involve mathematizing through curve sketching. I was looking for contexts from which modelsof the situations could be developed. The hope was that models-of (situations) would later be transformed into models-for formal mathematics (Bakker, 2004). Studies exploring the viability of adapting the RME instructional framework for teaching and learning of Calculus concepts at levels beyond elementary and secondary level are on the increase. Working examples include Rasmussen and King s (2000) work on introducing differential equations, Rasmussen and Blumenfeld s ( 2007) analysis of student reasoning with analytic expressions as they reinvent solutions to systems of two differential equations, and an examination of the role of defining as a mathematical activity when students progress from informal to formal ways of reasoning (Zandieh & Rasmussen, 2010). These studies point to promising ways of promoting the conceptual reasoning about the derivative-integral relationship that this project aspires to foster. As it has turned out, my expectations and interpretation of the learning content as an instructional designer were markedly different from those of the RME experts and from those of an experienced Calculus teacher. My line of inquiry was largely didactic while 105
118 the expert views were those of mathematicians. However, throughout the course of the project, the instructional design space has been contested, broken down, rebuilt and ultimately, enriched by the contributions of the expert teachers and the engagement of participating students. I believe this is how instructional design should occur. The challenge for this study was finding ways of interpreting student development of an understanding of the derivative-integral construct in order to develop a rationale for its teaching at a distance. Details of the design experiments used are presented in the methodological Chapter IV. 106
119 CHAPTER IV METHODOLOGY 4.1. Introduction Over the past twenty years, mathematics education research has shifted from an emphasis on investigations of individual cognitive development to one that acknowledges that learning is both an individual and social process (Cobb, 2000; Wawro, 2011). As a result, a number of recent projects investigate inquiry-based classrooms in which students participate in classroom discussions, explain their thinking as they work individually and collectively to solve mathematical problems (Rasmussen & Kwon, 2007; Rasmussen, Kwon & Marrongelle, 2008). The problem is that in predominantly print-based distance learning environments, student contributions and constructions are difficult to capture and analyse as the technological mediations required for their facilitation are difficult and expensive to facilitate. Augmenting print-based learning with mobile phones as supporting technologies is a viable learning environment alternative, as the mobile phone presents the characteristics required to support the essential learning transactions. In South African distance education where the majority of students cannot afford access to webbased learning using networked computers, the use of a mobile learning strategy seemed a viable and rational alternative Exploring Mobile learning adoption I use the term mobile learning to refer to handheld pocketsize technologies that can be put in your pocket at the point where you are doing your learning. At the turn of the new millennium, the adoption of mobile learning was constrained by slow networks, limited services and hesitancy by organizations to invest in devices whose shelf life was too short. Reasons for the delay in adoption included limited and non-standardized broadband distribution capacity (Wagner, 2005), device attributes such as screen size, battery life and security which hinder learning, limited resources and lack of organizational acceptance (Brown, Metcalf & Christian, 2008). Mobile phone penetration and adoption was not really matched by a parallel uptake of mobile learning, despite predictions of a possible mobile learning revolution (Wagner, 2005). Limitations to mobile learning uptake are slowly diminishing as the demonstrations of the potential and actual roles of mobile technologies increase. The mobile phone is emerging as an affordable communication tool as well as a tool for enhancing student 107
120 achievement and teacher learning (Attewell & Savill-Smith, 2003). According to Traxler (2007), mobile devices are creating a new mobile conception of society in which we are beginning to look at new ways of creating and accessing knowledge, performance, art forms, and even new economic activities (p.4).. Current research shows that mobile phones can be used as supportive learning tools to augment and enhance paper-based learning (Al-Zoubi, Jeschke & Pfeiffer, 2010; Chao & Chen, 2009; Chen, Teng & Lee, 2010;). Mobile learning devices allow students access to electronic learning materials from anywhere and anytime (Vavoula & Sharples, 2002; Leung & Chan, 2003: Kinshuk & Sutinen, 2004). In fact, the intersection of online learning and mobile computing, called mobile learning, holds the promise of offering frequent, integral access to applications that support learning anywhere, anytime (Tatar, Roschelle, Vahey & Penuel, 2003, p.30) Baya'a and Daher s (2009) examination of the conditions influencing students' learning of mathematics on the mobile phone revealed that the phone characteristics, mathematical topics being considered, the learning setting, the teaching objective and teacher involvement affected the students' learning in the mobile phone environment. Participating in the mobile phone activities helped the students become more independent, allowing them to link the mathematics to real life and adopt an investigative approach to mathematics learning. For mathematics learning, the mobile phone can be put to a number of educational uses. For example, Yerushalmy and Ben-Zaken (2004) established, through their research, that the mobile phone was a versatile learning tool because of its mobility, availability and flexibility. They developed Java based mathematical applications which can be installed on most mobile phones and designed activities for elementary, middle and high school students. In South Africa, the Meraka Institute 6 (a research institute) has been at the forefront of the innovative use of mobile/cell phone technology to support the teaching and learning of Mathematics. Their mobile tutoring system, Doctor Maths, runs on a platform called MXit. MXit is a very popular instant-messaging service that is accessible through cell phone with over three million school-age subscribers. Volunteers from the University of Pretoria Engineering department offer real time mathematical support to high school students using the MXit chat facility on their cell phones at reduced rates. From an initial enrolment of just 20 students, the service has grown to support over 1000 students to date (Van Rooyen, 2010). 6 The Meraka Institute is one of the research units of the South African Centre for Science and Innovation Research (CSIR). They conduct research involving the use of Information and communication technology (ICT ) in advancing human capital development 108
121 Another project by Mathee and Liebenberg (2007) involves a mobile learning solution for teaching mathematics combining education with tutoring in a mobile learning environment called MOBI. They have skilfully integrated radio, chat and a tutoring service in one applet to support mathematics learning. The learning content covers the South African grade 10 to 12 entire mathematics syllabuses. The activities include diagnostic assessment and tutorials using streamed videos to demonstrate the required background knowledge and skills. Any learner having a Java enabled phone can access this content. The environment was developed in keeping with the educational and technological constraints of South Africa. Mostert (2010) from Stellenbosch University has developed mathematics learning content for teachers which is delivered on an open source learning management system -Moodle-with a mobile interface. Daher (2010) re-affirms the formation of collaborative communities of budding young mathematicians in a recent study. In his study, pre-service teachers collected data confirming that middle school student knowledge building could be fostered through learning mathematics in a mobile phone environment. For this study, it was important to identify how the mobile phone could be used to enhance the learner's experience in a way that the current distance learning provision was not. Two preliminary studies were carried out to gain insight into issues that students face when using mobile devices to support learning at a distance. I briefly summarize the findings for these two studies First baseline study involving the HTC phone In this project conducted in 2007, I worked with two Bachelor of Science student volunteers on two Calculus tasks using HTC handheld devices (P3400). The phones were loaned for the duration of the project by Leaf Mobile (a cell phone distributor). Over a 4-week period, the students went through two Calculus written learning tasks developed using Microsoft Word. The tasks were sent as messages on to their mobile phones (see figure 4.1 for the model of the HTC phone used in the study). 109

122 Figure 4.1: Model of the HTC phone used In this project, I sought the students views on how best the HTC phone could be integrated into the print-based learning environment so as to promote the use of the mobile technologies in shaping personalized learning experiences. At that time, the HTC phone seemed to have the features required to support the learning experience. It was portable, had a sufficiently small screen, and could use already existing Microsoft software. The operation costs were affordable as well. For example, data transfer costs or web connecting charges averaged at 56 cents per minute; a 3-minute video was 70 cents to download; printing the assignments was R1.50 each page and faxing each page cost R4.00. From this short pilot exercise, students found the HTC phone easy to use and were able to communicate with the tutor and ask for and receive feedback quickly. They were also able to keep records of the learning transactions. The students preferred Adobe Acrobat PDF files and flash presentations quoting that their quality was better than the Microsoft files. The ability to download and save pictures and texts was cited as an advantage. Students also appreciated the ease with which they were able to access the internet sources. These two students did not own personal computers. Nonetheless, the adoption of the HTC phone had a few setbacks. Reading on the small screen was problematic. Some of the audio and video files did not run properly on the phones. Another major drawback was the fact that mathematical equations visible in the normal word document could not be seen in the mobile word version. Although the answers to the tasks could be sent as messages students preferred sending the responses by fax. It was difficult for the students to write mathematical equations or draw diagrams in their response documents. Tutor-learner 110

123 communications was possible but would have to be properly managed in cases where student numbers were big. After the project, it was clear that a lot more effort was needed to design content meant for the phone. One alternative was to pre-load mathematical applications onto the phones for ease of access by the students. Students suggested that the following elements be included in the design: Self -assessment quizzes or multiple choice questions Pre-prepared assignment forms which could be completed and sent to the tutor by or fax, Adobe PDF files which could be downloaded and printed Second baseline study involving the Outstart Mobile learning platform In another study, 30 volunteer students participated in a test designed to check simple conceptual and procedural knowledge involving the two basic Calculus concepts (the derivative and integral) using a commercial mobile platform- Hot Lava-available at available at The aim of the project was to determine how print-based activities could be augmented with the mobile phone as a learning support tool. The test consisted of 10 questions designed to gauge the student understanding of functions, their interpretation of graphs and their understanding of the terms the derivative and the integral (see Appendix A). Figure 4.2 contains representations of two question items (1 and 4) as they appeared in the normal text version and the mobile phone version. Figure 4.2: Representation of questions in the print and mobile phone versions The Hot Lava platform had the advantage of integrating an authoring system with a mobile delivery and tracking system. This combination of software elements provided a fast and efficient way of designing, creating, editing, deploying and tracking content. An advantage of Hot Lava was the ability to deliver content on an assortment of mobile 111
124 phones. The other main advantage was the ability to track student registration and participation. On individual screens, the instructor could track students as they attempted each question, the order in which they went through the questions and the number of attempts at each question before a final answer was submitted. One could also track the time spent on each test. I combined Cerulli, Pedemonte and Robotti s (2005) perspective of didactic functionalities and the RME approach to instructional design to create a model for designing and evaluating the pre-assessment activities. Cerulli et al., (2005) regard didactical functionalities as those properties of a given technological artifact and its modalities of employment, which may favor or enhance the teaching and learning processes according to a specific education goal. Surprisingly, students were not so keen to use their mobile phones for learning. Only nine students (30%) of the group preferred to take the test on the mobile phone. The majority of students felt that they were more comfortable working with mathematics on paper. However, all of the students participating in the mobile phone delivered test indicated that they enjoyed it. There were no notable differences in terms of overall student performance on tasks. There were a few differences in terms of the number of questions completed the turnaround time for receiving the answers, and the availability or non-availability of a system for tracking student responses. Details of the results of this baseline study and its theoretical underpinning are reported in (Kizito, 2012). Even with the small sample size, one can infer from the results that the important didactic feature of the technological tool (the mobile phone) was mainly the speed and ease of tracking and analyzing student responses. This was possible if the mobile phone was used in conjunction with a supporting platform such as Hot Lava. As a support tool in the RME instructional design adoption project, the phone could be used to quickly determine and track student responses to learning tasks. However, a limitation was the students difficulty in handling questions that required manipulating symbols and equations. At the time of the implementation of the project, the smartphone interfaces were still not able to handle mathematical expressions adequately for learning purposes. Another drawback was the cost of developing and maintaining this project in a developing world context. The cost for the initial testing was US$1,000 for the 30 students excluding registration charges and student charges for linking onto the internet. A lot more needs to be done if we are to effectively use mobile phones to improve learning, particularly mathematics learning. 112
125 For RME- supported learning at a distance, tablet computing devices have the affordances of dynamic image and data manipulation, of the form that could be used for student construction of models. Devices such as the ipad or cheaper hybrids can allow for collaboration among students and tutor at those learning discussion points where student reasoning forms can be analyzed and tutor guidance can be offered. Learning Applications designed specifically for RME inspired activities are still in short supply Lessons from the baseline studies Technically, the mobile phone had the potential to support the learning transactions identified; namely, finding out what the students prior knowledge was, capturing student constructions and contributions and increasing learner - tutor interaction. Pedagogically, it seemed possible (though difficult) to develop a learning design framework capable of supporting the guided reinvention principle suggested in the RME approach. Engelbrecht and Harding s (2005b) proposal of a guided construction model of learning providing structured ways of collaboration and solving problems (p. 254) was a model that could be considered for this project. Engelbrecht and Harding (2005b) also offer suggestions of effective design of web-based courses in their discussion of attributes and implications of teaching mathematics on the internet. Engelbrecht and Harding s (2005b) suggestions include; engaging the learner, paying attention to learner interactivity (with the content, the tutor and peers), focusing on outcomes rather than content, not mirroring traditional transmission approaches, acknowledging student contributions and the social nature of learning. They are in favor of including the usual types of assessment (quizzes, multiple choice questions), as well as formats such as learning journals in which learners can express themselves meaningfully. The authors also mention links to dynamic resources. Their design suggestions can be extended to the mobile phone. Practically, I needed to identify a design strategy that was easy to implement and affordable. In the end I opted to developing a web version of the introductory Calculus module as an Open Education Resource (OER) on the Open University (UK) lab-space platform. It made sense, as there was no cost attached to the development and maintenance of this online module. Moreover, students could access the online resource easily. The other advantage was that the same resource could be reworked for delivery on the mobile phone. 113
126 A text- based version of the module, which had been used in the early stages of the research as the initial learning trajectory was revised. The text-based version of the module was built around learning activities based on simple Calculus related problems. Later on, this text based version was re-formatted for delivery on both the web and the mobile phone. The conversion for deployment of the module onto the University of Stellenbosch mobile web-server was done with the help of a web-technician. In the rest of the chapter, I detail the methods of data collection and analysis used in this study. An outline of the theoretical and practical aspects of the methodology, together with a description of techniques guiding the research is put forward. The chapter is broken down into four sections. The first section is an introduction to the design experiment methodology. The second section is a description of the three design experiments. The third section is a sketch of the HLT comprising the learning tasks that were developed, tested, revised and adjusted during the course of the study. The chapter closes with a discussion of the data analysis procedures employed Design Research Methodology The methodology adopted in this study is termed design experiment methodology. It is a methodology in which instructional design and research are interdependent (Cobb & Gravemeijer, 2008, p, 68). This methodology belongs to a family of methodological approaches categorized as design research. Using the design research approach, researchers seek to understand and improve the process of learning and teaching in particular domains (Gravemeijer, 1994; Edelson, 2002; Kelly & Lesh, 2000). Also, within this research orientation, design is treated as strategy for refining and developing theories (Bakker, 2004, p. 37). Design research is different from comparative empirical research in terms of its objectives. While the goal of empirical research is to evaluate theories and materials, the goal of design research is to develop instructional materials and theories. The success of the products of design research is determined by criteria such as usefulness, shareability and reusability (Lesh, 2002). Previously, design experiments were used to test and refine education designs informed by relevant theories (Brown, 1992; Collins, 1992). In current design experiments, research teams develop and try out specific types of learning in contexts where they can be systematically supported and studied (Cobb, Confrey, disessa, Lehrer & Schauble, 2003). One of the two expected outcomes of a design experiment is a domain-specific, instructional theory; the other one is a curriculum (learning trajectories) (Cobb et al., 2003; Bakker, 2004). A domain-specific, instructional theory 114
127 contains a validated learning process, demonstrated means of supporting that process, and should lead to the development of one or several significant mathematical ideas. In design experiments, miniature versions of learning ecologies are tested and refined in successive series of teaching experiments. Learning ecologies are interacting systems of learning comprising of the learning tasks, desired dialogues, classroom participation norms, and tools and resources required to orchestrate anticipated learning (Cobb et al., 2003). The goal of a design experiment is to examine the process of learning and the way in which this process is organized and supported. The experiment used in a design research context is different from the standard randomized trial experiment where students are subjected to some form of treatment in a controlled setting. Randomized trial experiments depend on identification and manipulation of variables, and a study of the effects of the manipulations. In a design experiment, the focal context for the research is the design of the learning process and/or environment, supported with observed episodes of teaching. One of the components of a design experiment is the teaching experiment. The teaching experiment is a conceptual tool that researchers use in the organization of their activities. It is primarily an exploratory tool, derived from Piaget's clinical interview, and aimed at exploring students' mathematics (Steffe & Thompson, 2000, p. 273). Both teaching and design experiments allow researchers to build models of learning and of teaching interactions (Kelly, Baek, Lesh & Bannan-Ritland, 2008, p.6). Design research projects are usually constituted from cycles of design experiments (Bakker, Doorman & Drijvers, 2003; Cobb & Gravemeijer, 2008; Gravemeijer, 1994). Data is collected in each cycle and at the end of the entire project. The results of on-going analyses feed into the next round of design to improve the design in supporting student learning. In the present research, the data collected were not at a level of sophistication required to produce a local instructional theory. This can only be achieved if the instructional sequences developed are tested with a wider range of students and teachers in a variety of settings. The sequences should also be subject to scrutiny by a varied number of researchers, educators and mathematics specialists to warrant instructional theory status. This study is one of the preliminary steps in that process. The focus for this research has been on making a judgment as to whether RME could be used as an instruction design perspective to introduce the basic Calculus concept relationship at a distance. To accomplish this, I examined how student understanding 115
128 of the derivative-integral connection emerged as they engaged in a module introducing the Fundamental Theorem of Calculus. As part of this process, I wanted the students to adopt a covariation ways of reasoning. I needed to carry out design experiments. Typical design experiments consist of three phases: preparation, design experimentation to support learning and a retrospective analysis of data generated. During the preparation phase, the instructional goals are clarified and the instructional starting points identified. The process of delineating the HLT begins at this stage. Conjectures about the learning process, and how this process aligns with the instructional objectives and the means of supporting those objectives are formulated. The planned experiment is also located within a broader theoretical context. The purpose of the experiment is neither to test the HLT nor to demonstrate that the HLT works. The experiment is conducted in order to test, revise, and improve the conjectures built-in in the design. At the end, a retrospective analysis is conducted. retrospective analyses seek to place the learning and the means by which it is supported in a broader theoretical context by framing it as a paradigmatic case of a more encompassing phenomenon (Cobb & Gravemeijer, 2008, p. 83). Before discussing the three design experiment phases, a description of how the HLT used in the study was developed is presented The HLT A fundamental part of this study has been the development of a set of learning materials containing sequences for introducing the relationship between the elementary Calculus concepts. These sequences were modelled along a hypothetical learning trajectory (HLT) (Cobb, 2000; Gravemeijer, 1994; Simon, 1995). The HLT houses conjectures about student learning processes and how they are supported (Gravemeijer, 2000). The HLT also provides the researcher with a mechanism for refining a course map along which students mathematical reasoning evolves in the context of the learning activities (Bakker 2004). The HLT is the backbone of the design experiment. It guides the instruction design, provides a focal point during the teaching, observations and interviewing, and serves as a benchmark for conducting the analysis. A domain-specific, instructional theory evolves from the interaction between the developing HLT and empirical observations. The HLT is a dynamic entity, which shifts with the cycles of design. The main components of the HLT include an overarching idea, a starting point, a mathematical activity and means of supporting its advancement. Insights of how the initial instructional design elements of content, structure and sequencing are developed 116
129 come from the underlying instructional design theory. In my case, the emergent modelling and guided re-invention heuristics influenced the design of the HLT. Guided reinvention was inherent in the way the questions were formulated while the emergent modelling shaped the task design. In the next section, I introduce the overarching mathematical idea for this design experiment. I also elaborate on the starting point, mathematical activity and means of supporting its advancement in the section on emergent modelling Overarching mathematical idea The overarching idea shapes the instruction design and helps one in making design decisions about the design experiment. The designer uses it to support a shift in student reasoning. In this project, the overarching idea has been that of accumulation, applied to two quantities changing in tandem with each other. Differentiation and integration are seen as different aspects of the same impression of a relationship between changing quantities within a graphical milieu. The idea is motivated by Freudenthal s (1991) suggestion of introducing Calculus concepts in contexts where the drawing of the curve mathematizes a given situation or occurrence in primordial reality (Freudenthal, 1991, p.55). A similar line of reasoning is displayed by Newton and Leibniz (section 2.2.2, this dissertation), as they worked out a way of calculating the area under a curve which is the basis of the Fundamental Theorem. It is straightforward to calculate this area if the shape under the curve is a straight line, as one just finds the area of a rectangle (base x height). It becomes more difficult to determine the area of the shape under a curved line, covering a certain distance as it moves from left to right. Solving this basic problem has wide applications to situations involving relationships between changing quantities. One way of finding this area is by determining the height of the curve at each point, constructing a thin rectangle around that point, and then adding up all the thin rectangles together to find the total area. This takes a while, as there is an infinite number of points on the curve. The limit concept, which condenses an infinite series of quantities, is a useful tool to use in this case. The problem is that using the limit is a difficult concept for non-mathematicians and the majority of students to master. Newton and Leibniz s way of thinking involved first seeing the whole entity and then afterwards zooming in to focus on the details of the component processes, while keeping an image of the entity in mind. Imagining a curve going on infinitely, and figuring out the shape the curve mapped out as it proceeded in an unbounded region (removing the restriction of numbers) helped them focus on what was crucial. This was 117
130 the relationship between the curve and the area it traced. This relationship is called a function in mathematics. We differentiate a function to analyze its characteristics using the curve. For example, we can examine how the curve is behaving between any two points a and b. The shape of the slope of the curve gives us an indication of how fast the curve rises, falls or remains constant. Making a and b move closer such that they coincide is a way of finding out how fast the curve is moving at any one point (the derivative). This is the same as taking a snapshot (a momentarily frozen image) of a moving car to see how fast it is moving. The ingenuity in Newton and Leibniz s invention was in seeing that differentiation could be inverted. One could start with a snapshot or single point and work backwards to build a description of the entire curve. On differentiating the curve backwards (reverse differentiating), they ended up with a new function that was an expression of the area under the curve (integration). Using this process to find the area under the curve becomes a lot simpler. To integrate (or find the area under) having no boundaries, you would reversedifferentiate this function to get a new function:. This is a function representing an unbounded area under the curve. If you were specifically looking for an exact area between and, for instance, then that specific area would be. The anticipation was that if the overarching idea of accumulation was put across to the students in a way which involved functions, then they would be able to see the derivative and integral as useful Calculus tools, and not just as expressions for manipulating numbers Emergent models and the HLT. Emergent models come to light as students use their own informal ways to interpret and organize a mathematical activity. The activity in question can be a mental activity or an activity involving student manipulation of a mathematical object such as a graph, equation or constructed applet (Gravemeijer, 1999; Zandieh & Rasmussen, 2007). The tool or model use helps the student attain more advanced mathematical ways of reasoning. The challenge is in identifying problems that can accommodate a model of/model for pair of organizing activities. In the model of, phase, students create their own specific solutions to a problem whereas in the model for phase, the activities help them advance to more formal ways of reasoning. The HLT creates a learning path of subsequent learning activities for transitioning from a model of to a model for phase 118
131 (Gravemeijer, Bowers, & Stephan, 2003). For students, models and modelling serve the function of creating a new mathematical reality (Rasmussen & Blumenfeld, 2007, p.199). For this exercise, that reality was the space occupied by the FTC equation, together with its representations of variables and functional relationships occupied. As an example, in the case of the first part of the fundamental theorem of Calculus:, the modelling process necessitated that students gain experience with two processes simultaneously, that of using as an expression for finding a particular rate-of-change, and the manifestation of as an accumulation function. The starting point for this design experiment was a situation in which students were exposed to a rate-of-change and an accumulation as a function-pair before engaging with each one of them separately. Students were given an exercise about a zebra running at constant speed and a cheetah that starts chasing the zebra a few seconds later. The query was whether the cheetah was able to catch up with the zebra. Doorman (2005) had used the same question in a modelling motion teaching experiment for younger students. The thesis Doorman (2005) proposed and explored was that graphical symbolization and an understanding of motion could co-evolve (p. 67). The context and goals for this design experiment was slightly different. I was looking to see if students could recognize notions of speed, accumulation of distance and a relation between the two. In subsequent sequence of activities, students were introduced to the separate processes of the function pair, first differentiation and then the integration. In the end, an attempt was made to introduce a last phase of learning and reasoning in which the two processes were combined in the FTC. The main organizing activity was student construction and analysis of graphical representations of the changes in the functional variables presented in the problem sets. An underlying objective was to have the students adopt covariation reasoning in their quest to interpret the FTC representation. The main conjecture was that exposure to this type of reasoning would lead to development of a better understanding of the derivative-integral relationship. Normally, the model of/model for transition is built from four activity levels: A situational activity where students engage with tasks experientially real to them. A referential activity containing the models-of portions from the original task 119
132 A general activity consisting of the models-for activities in which students construe self-sufficient solutions which are independent of the original task A formal activity that involves reasoning with conventional symbolism not dependant on prior models (Gravemeijer, 2004; Rasmussen & Blumenfeld, 2007). An overview of the four activity levels as they were conceptualized in the last design experiment of this study is presented in table 4.1. Table 4.1: Four Activity Levels Activity level Envisaged student action Situational activity Referential activity General activity Formal activity Students model the motion of a zebra (moving with uniform speed) being chased by the cheetah (accelerating to a steady speed) to determine if the cheetah catches the zebra in a very short time interval. Students construct/use graphs to trace the motion of each of the animals to indicate how each animal is moving and to calculate the distance covered by each of the animals in the given time period. The student s organizing activity of curve sketching of velocity-time graphs used to determine the distance covered by these animals serves as a model of the physical and mental activity in the motion problem (rate-of-change and accumulation). Students employ the organizing activity of curve sketching in contexts where the relationship between function (1) accumulated distance and function (2) speed serves as a model for dealing with rate-of-change (differentiation) and accumulation (integration, without referring to the original zebra-cheetah problem. Students use conventional notation to represent and reason about the integral-derivative relationship appearing in the FTC in ways that reflect covariation reasoning and an understanding of the reciprocal nature of this relationship. These four layers of activity (situational, referential, general and formal) were also used in the analysis of student reasoning. In the following sections, the three phases of the design experiment research cycle are discussed Learning tasks In this project, I attempted to put together a learner centred pedagogic framework in which the learner had opportunities for sense making and knowledge building using the printed text coupled with the mobile phone. These main elements were organized into a web-based open education, for convenience and ease of development and maintenance. The main instructional design elements included: mathematical problems or cognitive tasks that would encourage students to become thinkers rather than passive absorbers of information assessment tasks to establish student initial competencies and gauge student ways of reasoning during the unit. A number of them 120
133 were borrowed from other texts, for example, task 4(c) in the first HLT is taken from Geometer s Sketchpad. Taking the derivative - integral relationship as the overarching learning task that needed to be organized demanded a re-conceptualization of this task (or sets of related learning tasks) in terms of projected students natural learning patterns and needs. These were aligned with the learning unit s goals and underlying teaching and learning philosophy (RME). In RME, one tries to convey to learners the idea that through learning, they are constructing their personal knowledge for which they themselves are responsible (Gravemeijer 1999). As an instructional designer, it meant that I had to shift in my design focus. The third unit was designed around four learning activities. Each learning activity had sets of mathematical problems.as far as possible, I sought a way of guiding students into a process where they could use their own solution strategies to incorporate mathematical concepts and techniques to engage with the given mathematical tasks, without the help of an immediate tutor. Although the deign task proved daunting, the learning and contribution to instructional design has been invaluable. The exposure highlights the challenges and limitations instructional designers face as they develop instructional sequences in learning areas in which they are not necessarily the experts. The entire course unit is available as a Microsoft word and a PDF and word document workbook, which can be downloaded. The activities are structured as follows: Learning activity 1: What is Calculus all about? Learning activity 2: The rate-of-change function (derivative); Learning activity 3: The accumulation function (integral); Learning activity 4: How are these two functions related? In designing each activity, I used a design matrix based on my assumptions of what the learning outcomes were for each activity and what I expected the student to be doing in each lesson unit (see table 4.2 and table 4.3). Each activity had some feedback regarding the task, video clips and assignments with practice problems. Links to other websites to support learning have been included. In each activity the learner is encouraged to share their knowledge construction process with the tutor and/or peers using the mobile phone. 121
134 Table 4.2: Design Matrix for learning activities 1 and 2 Learning activity 1: What is Calculus all about? Learning outcomes Reading /watching Individual tasks Collaborative tasks Assessment The learning assets Students should get to a Introductory text Learning activity 1 Water being poured into a jug. view of Calculus in terms of a function pair. Two related functions or two sides of a coin. Sharing your answers with a tutor/colleague Online and mobile version How does one link to the mobile environment? Feedback Online Text Professor Strang introductory video Assignment I PDF file Summary Online Text Learning activity 2: The derivative Learning outcomes Reading/watching Individual tasks Collaborative tasks Assessment The learning assets Students describe the covariation between the Learning activity 2 The slides for the video produced independent variable and the rate-of-change of the dependent variable. Re-invent the derivative Video on limits Share your answers with a colleague Online and mobile version & Video on limits How does one link to the mobile environment? while simultaneously Feedback Online Text develops the concept of Strang video covariation. Assignment II PDF file Summary Online Text 122
135 Table 4.3: Design Matrix for learning activities 3 and 4 Learning activity 3: The integral Learning outcomes Reading /watching Individual tasks Collaborative tasks Assessment The learning assets Students should develop the Introductory text Learning activity 3 concept of integration by attempting to recover the original function. Re-discover the meaning of Share your answers with a colleague Online and mobile version How does one link to the mobile environment? integration by first working Feedback Online text numerically before working Strang video analytically. Assignment III PDF file Summary Online text Learning activity 4: How are these two functions related? Learning outcomes Reading /watching Individual tasks Collaborative tasks Assessment The learning assets Students should see that differentiation is the inverse of integration. Introductory text Learning activity 4 Instructional video The slides for the video produced Feedback Share your answers with a colleague Assignment IV Online and mobile version How does one link to the mobile environment? OL Text PDF file Summary Online text 123
136 The thinking behind making the web version the core of the design process is based on a desire to develop learning content in a digital format that can later be delivered onto different platforms. In this case the print and mobile device platforms. This thinking resonates with Engelbrecht and Harding s (2004) vision of a seamless online medium for doing mathematics interactively (p. 7). The authors imagined a portal in which mathematical symbol representations, computer algebra systems, whiteboard facilities and communication support capabilities were integrated and buttressed. This project is a far cry from the technological sophistication required to assemble such a portal. Still, both the print and mobile versions have been designed so as to allow the student to select their own routes within the learning environment. At the time of the development, there was a problem in viewing the video file formats and the flash animations. Both the final text and mobile versions have URL (Uniform Resource Locator) links to the video segments and animations that the student can access. The intention was to create an environment in which the student had some degree of choice in how to navigate the learning space First Phase: Preparation Framing the design experiments In order to frame the design experiment and mark out an organizing activity and the expected forms of reasoning that would drive the research; I looked to literature for inspiration. The first source of inspiration was the history of FTC development (section 2.2), for insights into how the derivative-integral relationship evolved. A second source was from views about how the FTC is currently taught (section 2.3), for guidance about content, structure and sequencing. A third source was from mainly mathematical education studies that revealed didactical challenges encountered and how they are addressed (section 2.4). A number of these studies contained textures of themes from the cognitive psychology of mathematics learning (Piaget, (1977); Vygotsky, (1978); Sfard, (1991)), in the context of Calculus teaching and learning (Dubinsky,(2000); Tall, (2004); Thompson, (1994)). The last source was RME- related studies, from which I am still in the process of obtaining the know-how of designing and developing RMEinspired learning tasks (Chapter III, this dissertation). From history, two lessons stood out. The first was that understanding of mathematics is driven by a need to find solutions to problems. These could be real physical problems or abstract mathematical problems. The second relates to a technique in reasoning used by Archimedes and later generations of mathematicians. Starting with the familiar 124
137 and then extending the logic to the unfamiliar. This outlook is embodied in the RME heuristic of guided reinvention. The unified algebraic-algorithmic theorem - the FTC - is a result of mathematicians quests for resolving the problems of tangency and the area under a curve. These two sets of problems were analyzed, initially using geometrical methods, algebraic methods, and then a combination of both. Didactically, the challenge is to present the problems to students in a way that allows perception of the symbolic devices (graphs and algebraic equations) as reasoning tools. It is also important that they understand that mathematicians use a particular symbolic language to communicate their arguments. I have tried, but I am not completely sure that I have managed to convey these messages to students in these series of design experiment. In terms of presentation and interpretation of the FTC, different Calculus teachers and authors of Calculus teaching texts put emphasis on the different aspects of the FTC, even though the foundational elements (definite integral, area under the curve, area function, rate-of-change, the limit, total change) remained the same. Table 4.4 is a summary of the focal teaching elements, supportive teaching elements and/or actions, and the teaching /learning goals from the reviewed Calculus texts. Table 4.4: Summary of elements in teaching texts Author(s) Focal teaching element Supportive teaching elements and/or actions James Stewart (1998) Ostebee & Zorn (2002 Hughes-Hallett et al., (1999) The MALATI group the definite integral as an area, area A, underneath the curve. area function A f the definite integral as a means of to calculating the area under a given curve linked to notions of accumulation and change. student exploration of functions and functional relationships lodged in real life problems. limit of the sums of approximating rectangles graphical illustrations of an antiderivative of f finding approximations and taking limits estimating the value of a function using information about its rate-of-change Teaching/learning goal in the end students would develop an understanding that the integral of the rate-of-change is equal to the total change.. an awareness that a graphical interpretation of the rate-of-change of the area function is the height of the original function. the ability to determine a function, given its rate-of-change. a conceptual introduction to the FTC 125
138 An understanding of how the definite integral is construed is a pivotal element in learning about the FTC. For this study, the aim was to connect the definite integral with the notion of accumulation and the derivative with a rate-of-change. The idea of developing a sequence where the derivative-integral is depicted as a unified entity through an investigation of accumulation came from an analysis of didactics and cognitive psychology of FTC teaching (section 2.4, this dissertation). Students find understanding Calculus difficult because they fail to see the interrelatedness of the mathematical entities involved. The graphical curve is a powerful tool for teaching Calculus because it offers a visual, integrated picture of functional relationships and dependencies. Even though frameworks for teaching the FTC exist, they still appear as maps of the instructor s way of thinking. This is one challenge that is difficult to address in a distance teaching environment. How does one ensure that students develop the desired understanding and ways of reasoning? The RME instructional design perspective was selected for this study because it seemed to have prospects for addressing a recurring mathematical didactical problem, that of assisting students to make the jump from perceptual (intuitive) to symbolic (formal) thinking. Chapter VI presents an account of the extent to which this has been achieved. In the preparation phase, I used the literature review as a yardstick for collecting activities that could be used in the HLT. An important criterion for including an activity was the extent to which it could support an understanding of the reciprocal relationship between differentiation and integration. The first HLT was very rudimentary but improved after two cycles of refinement. That process is gradual Pre-instruction test The aim of the Pre-instruction test was to determine, as quickly as possible, students prior knowledge of the subject at the beginning of an introductory distance Calculus course. Prior research done at undergraduate level consistently reveals that students start Calculus courses with a limited view and understanding of the functional concept (Tall, 1996; Ferrini-Mundy & Lauten, 1993). In addition, students often exhibit cognitive difficulties when interpreting the functional concept using algebraic and graphical representations (Schnepp & Nemirvosky, 2001). The aim of the test was to ascertain if the students who enrolled in the Calculus course at Unisa had an understanding of the two basic Calculus concepts the derivative and the integral and to subsequently build on that knowledge to inform future instructional design decisions. The test was available in print form, in a web-based format and a mobile phone format. The mobile phone format appears in Appendix A. The print and web versions appear as part of the set of activities in Appendices B, C and D. 126
139 4.5. Second Phase: The Design Experiments This study is based on reports coming from three sets of single-subject distance design experiments that addressed elementary Calculus concepts. The word distance is added to emphasize the type of learning set-up. These are design experiments where the focus was on documenting individual student s progress while interacting with a mathematical task sequence (Simon et al., 2007). This approach is a better fit than the normal classroom design experiments involving entire classrooms or small groups of students. A deliberate research design choice of focusing on only the individual learning was made because of a lack of a technology infrastructure to support social participation. A perspective where learning embraces both processes of individual construction and social involvement with mathematical processes (Cobb, 2000, Cobb & Yackel, 1996) was desirable but could not be effectively adopted at this stage. The element of student engagement evolving into classroom practices using a dynamic outlook to learning (Rasmussen &, Blumenfeld, 2007) is missing in this study. The design experiments investigated pre-college and college student thinking as they participated in a distance-learning module introducing the Fundamental Theorem of Calculus. A primary goal of the course was for students to develop a conceptual understanding of the derivative-integral relationship in Calculus. A second goal was for students to develop a covariational way of reasoning about functional relationships. The course focused on the development of an understanding of the reciprocal nature of differentiation and integration as mathematical processes, in a context where students could expand their ways of thinking and communicating mathematically. There were three main cycles of design experiments: Cycle 1: The first design experiment with the first cohort of 6 students, predominantly with paper tasks with a few deliberately planned mobile phone activities. Cycle 2: The second design experiment with the second cohort of 6 students, using the paper-based tasks augmented with very few mobile phone activities. Cycle 3: The third design experiment with the third cohort of 3 students, using refined paper - based tasks developed for both print and for delivery on a mobile learning platform. The students chose made a choice in terms of the option they preferred. 127
140 4.5.1 The research instruments The HLT. The main research instrument was the HLT. Data were collected mainly from student written responses to learning tasks. The tasks included pre- and posttests for assessing initial interpretation of the derivative and integral concepts and a later construal of the derivative-integral relationship, respectively. The bulk of the activities were the learning problems. Interviews. Three individual interviews (Appendix F) were conducted with some of the participating students, in which they were asked to explain their thinking in their written responses. The student interview data reported in this study comes from task-based interviews conducted with two groups of students participating in the second and third design experiments. These were semi structured interviews of approximately 15 minutes each. For the second design experiment, three participants were interviewed alone by an experienced teacher in her private office. She started off by giving a brief introduction to the print based learning tasks before asking each participant individual questions. I (as the researcher) conducted the set of interviews forming part of the third design experiment with the selected participants. I briefed the participants collectively about the learning tasks, allowed them time to work through the tasks and only conducted interviews a few days later, to probe and better understand their responses to the tasks. In standard design experiment environments, the teacher/ researcher video records the learning transactions as they occur in the classroom. Video recording was not an option as it was not feasible to record students as they studied in their individual locations. I could not afford such an undertaking. Therefore, the learning accounts produced in this project were based on student written responses to tasks and some records of interview responses. Records of mobile phone researcher-tutor transactions were not included in that analysis as the data was not complete First design experiment Six first year college students voluntarily participated in this first design experiment in August The students were notified about what the experiment would involve. They all had participated in a semester of formal Calculus teaching. The experiment addressed simple ideas related to the derivative and the integral. At this stage, the HLT was very crude and consisted mostly of different learning tasks related to introductory differentiation and integration (see Appendix B). The students were given activity booklets and asked to complete the tasks without any assistance from a tutor. All six 128
141 students returned the booklets in a period of one to two weeks. Each task was designed with an objective in mind. This first HLT had many disjointed elements. My expectation was that students would also treat the derivative and integral as separate entities. For this first design experiment, I was looking for four sets of descriptions. The first set was a characterization of the types of models students generally employed when they worked out solutions to problems. I wanted to establish whether the models presented had numeric, graphical, algebraic or verbal undertones, and which mode of presentation was dominant. In the second set of descriptions I was looking for general impressions or outlooks students revealed when responding to questions about functional relationships. I referred to Bigg and Collis (1982) framework to get a sense of what the students were focusing on. A student using a unistructural outlook could focus on one aspect of a function; in a multistructural focus, a student could differentiate between symbolic and graphic representations; with a relational outlook, a student could focus on multiple aspects, use different representations and integrate the concept of functions with its multiple representations into a meaningful structure (Biggs & Collis, 1982, p. 4; section 2.4.2, part (c)). Table 4.5: First HLT tasks Task no. Task name The task was designed: 1 Pre-test. Experiences with previous past papers 2 Reasoning with graphs 3 Keeping track of change 4 Introducing average and instantaneous rateof-change 5 From distance to speed 6 From speed to distance 7 Post- test Structured as the pre-test. To test students prior knowledge of the function concept, reasoning with graphs and definitions of the derivative and integral. To identify the areas students found most difficult To introduce Calculus in a way that would allow students to work out and reasons about change and functional relationships using graphs To consolidate student understanding of the relationship between graphical characteristics and properties of motion ( change). To allow students to make connections between algebraic, numeric and geometric calculations of the rate-of-change. To reduce the jump factor that is normally experienced by students as they move from the embodied world to the symbolic world. To build within the student the need to calculate the accumulated value of some quantity (in this case-distance) which is a product of rate and time and a time interval For the third set of descriptions, I wanted to establish if the students could link a variable quantity s rate-of-change to its accumulation, or recognize the effects of 129
142 differentiation and integration on a function. I combined Smith s (2008) Part A - Foundational understandings and reasoning abilities on the FTC framework (table 2.3), with Biggs and Collis framework for this description. Lastly, I used Carlson, Jacobs, Coe, Larson and Hsu (2002) mental action (MA) Covariation framework (p.357), (section 2.4.3, table 2-II), to pitch students form of reasoning to an MA reasoning level in terms of how they were able to coordinate the changes in one variable in relation to another (as it related to a rate-of-change). Smith s (2008) Part B: Covariational reasoning with accumulating quantities (section 2.4.3) was used to test MA reasoning when applied to an accumulating quantity. The frameworks provided criteria for analysis. The analysis of these results provided me with a snapshot of student reasoning at the end of the first design experiment. These results were fed into the next design experiment. This process parallels the cycles in design research of preparation, design, testing and revision -cycles for curriculum/hlt development (see Bakker, 2004, Gravemeijer & Bakker, 2006) Second design experiment The second design experiment was conducted in January The six participants were pre-college Ugandan students who were in their final year of high school. I chose Uganda because it is my place of birth and accessing the students was convenient. The data collected has been useful in terms of repeatability and generalizability of the research. This opportunity has allowed for the testing of the learning process and the products in a different setting. (The notions of repeatability and generalizability are dealt with in section of this chapter). All the students participating in the second experiment had been exposed to basic Calculus concepts. The tasks designed were not bound to a curriculum so any prospective Calculus student can try them out. Not all students had mobile phones so I focused on analyzing the written tasks only. The students were notified about what the experiment would involve. An experienced teacher coordinated the exercise. She made sure that the students participated fully without offering them any guidance. The data collected consisted of records of written assignments and three recorded interviews. During the interviews, the teacher did not support the learning but in each case, probed students reasoning in order to understand why they used particular approaches in finding solutions to problems. 130
143 Table 4.6: Second HLT tasks Task name The task was designed: A Pre-test to test student prior knowledge of the function concept, reasoning with graphs an definitions of the derivative and integral. B Reasoning with graphs to allow students to work out and reason about change and functional relationships using graphs C The water to find out how student reasoned with changing quantities. problem D The Derivative Function to help students develop a better understanding of the derivative as the connection between a function and its rate-of-change. E Area and the Fundamental Theorem of to help students calculate the accumulated value of some quantity, and as a result develop an understanding of the Fundamental Theorem of Calculus. Calculus F Post test Structured as the pre-test. The experimental aims were consistent with those of the first design experiment. The first aim was to explore students understanding of interconnections between finding an integral and the derivative. The second aim was still that of supporting students to develop covariation reasoning when dealing with functional relationships. Prior to this experiment, I had had an opportunity to receive inputs and modification of the learning tasks by a colleague from Freudenthal Institute (Michel Doorman). The learning tasks were reformulated and some of them were removed (see Appendix C). The tasks were organized as follows: In the second HLT, I tried to address some of students problem areas before an introduction to the rate-of-change, accumulation and then the FTC. I assumed that exposing students to activities in which they modelled and reasoned with changing quantities graphically would enhance their understanding of the FTC at a later stage. A new point of departure emerged from the results of the first experiment. The first experiment had included a task in which students were asked about previous examinations paper questions. This was removed, as it had no relevance any more. I had also included activities where the students had been asked to try out mobile learning activities on the website but those were also dropped out because of the time it took students to connect and download the applets from the websites. With the current improved bandwidth and connectivity in South Africa, this should no longer be a problem. The tone and the style of the presentation of learning tasks also evolved somewhat. The questions were designed to elicit more explanations and descriptions from the students, thereby conforming to the guided-reinvention heuristic of RME. Mathematically, the learning tasks involved some calculations and symbol use. 131
144 For analysis, I sought for the same four sets of descriptions I had used for the first design experiment. These included: models students generally employed when they worked out solutions to problems; general impressions or outlooks students revealed when responding to questions, together with indications of student mental action (MA) reasoning levels using the Carson et al., (2002) functional Covariation framework (p.357), and any evidence of students being able to link a variable quantity s rate-of-change an accumulation; and indications of covariational reasoning when thinking about a rate-of-change and an accumulating quantity. The analysis of these results provided me with a snapshot of student reasoning at the end of the second design experiment. Once again, the results were fed into the next design experiment, (the design cycle idea) Third design experiment A third set of three first year college students voluntarily participated in this last design experiment in July Again, the students were notified about what the experiment would involve. These six students had all attended a semester of introductory Calculus. The students were given the printed materials with an option to use the mobile version of the activities as well. On the whole, the students functioned independently, except for two of them who contacted me for clarification of task instructions through the mobile phone. I conducted and recorded interviews. A mathematics tutor went through the learning tasks and suggested ways of improving the tasks. The final set of tasks is included as Appendix D. Table 4.7 shows how the tasks were organized. Yet again, I used inputs from the second experiment to make modifications to the learning activities. I made further adjustments to make the HLT conform more to the RME heuristics of emergent modelling and guided re-invention. The guided-reinvention heuristic character was inherent from the way the learning tasks were designed to lead the students into re-inventing the derivative-integral relationship in the Fundamental Theorem of Calculus. The emergent modelling heuristic was more difficult to attain. I conjectured that if from the onset, the derivative and integral were represented as a function- pair, then student understanding of this relationship would become more apparent. 132
145 In the analysis of student reasoning for this last design experiment, I was searching for ways in which students reasoned with the graphical representations and accompanying equations as they re-invented the derivative-integral relationship, as it appeared in the FTC. I used Gravemeijer s emergent model with the four activity levels (situational, referential, general and formal), coupled with Nixon s (2005) framework of development for levels of learning abstract algebra as the basis for analysis (section part (c)). I was particularly interested in observing what went on in terms of student reasoning, as students shifted from the pre-formal to formal level (Gravemeijer s levels), or conceptual to formal (Nixon s levels). The aim was to keep track of the changes in the HLT, as well as changes in student learning as the HLT evolved. Each HLT had a testable conjecture. On the whole, embedding elements that support covariation reasoning was quite difficult. Table 4.7: Third HLT tasks Task no. Task name The task was designed: Pre-test To test student prior knowledge of the function concept, reasoning with graphs and definitions of the derivative and integral. Activity 1 Reasoning with graphs [Situational activity & Referential activity] To allow students to work out and reason about change and functional relationships using graphs [Students model the motion of a zebra being chased by the cheetah] [Students organizing activity of curve sketching of velocitytime graphs used to determine the distance covered by the two animals, serves as a model of the physical and mental activity Activity 2 Activity 3 Activity 4 The Rate-of-change Function- A moving ball hits the wall. Given distance find the velocity [General activity & Formal activities] The Accumulation Function -Recovering distance given the speed/velocity General activity & Formal activities] How are the two functions related? [Formal activity] in the motion problem]. To help students develop a better understanding of the derivative as a function s rate-of-change, in contexts where the rate-of-change is presented, numerically, graphically and algebraically. [Students use the organizing activity of curve sketching in a context where the relationship between distance accumulated and speed as a function-pair, serve as a model for working with the derivative integral relationship without referring to the original zebra-cheetah problem. To help students develop a better understanding of the accumulation function in contexts where the accumulated distance is recovered from, the velocity function. [Students use the organizing activity of curve sketching in a context where the relationship between distance accumulated and speed as a function-pair, serve as a model for working with the derivative integral relationship without referring to the original zebra-cheetah problem.. to help students develop an understanding of the derivativeintegral relationship as presented in the Fundamental Theorem of Calculus. [Students use conventional notation to represent and reason about the integral-derivative relationship appearing in the FTC in ways that reflect covariation reasoning and an understanding of the reciprocal nature of this relationship]. Post test Structures as the pre-test. 133

 model of argumentation combined with the constant comparison method,")
146 The next section is a discussion of the data analysis Third Phase: Data Analysis In this section, I describe the methods I used to analyze the data generated in the design experiments. I conducted this analysis with the two frames of guided reinvention and emergent modelling in mind. I present the analysis on two levels. First, I present an overview of a general approach in terms of the basic procedure used. Next, I describe the specific actions I took to analyze the data from the design experiment General approach The method I used to generate descriptions and explanations is consistent with elements from Toulmin s (1969) model of argumentation combined with the constant comparison method, which is a component of Glaser and Strauss (1967) grounded theory. According to Toulmin (1969), an argument consists of the data, the claim and the warrant. Figure 4.1 is an illustration of the basic components of the core of an argument. In an argument, a claim or conclusion is made based on the evidence or data to support that claim. The data contains the facts leading to the conclusions made. The warrant is an explanation used to spell out the role of the data. At times, the validity of the warrant is questioned. In that case, a backing is required to validate the core of the argument. Figure 4.3: Toulmin s model of argumentation The analysis focused on a sequence of tasks designed to promote student reinvention of the derivative integral relationship in the FTC. The aim was to pinpoint and analyze the data provided in order to make claims about students ways of reasoning. The focus was on examining student-generated inscriptions of mainly two types: the 134
147 graphical inscriptions and the solution inscriptions. The main thrust was on scrutinising students ways of creation, interpretation, and the use of graphs and mathematical symbols. The aim of the analysis was to establish if it was possible to design a path that students could use to successfully reinvent the derivative-integral relationship in a module offered via distance education. The results would be used to set grounds for further exploration and instructional design for distance learning. According to Inglis, Meija-Ramos and Simpson (2007), there are two forms of analyses, one concentrating on content and the other on structure. In this research project, issues of content and structure were analysed simultaneously. I followed a three-step procedure in the analysis similar to the one employed by Smith and Osborn (2007) in their interpretative phenomenological analysis (IPA). IPA is a qualitative form of inquiry with roots in phenomenology. It seeks to examine in detail a participants experience and perception of an event or occurrence in their life worlds. Although the approach is commonly used in the health sciences, I found it useful as a method for analysing student texts and its emphasis on sense-making by both participant and researcher (Smith & Osborn, 2007, p.54). First, I scrutinized data in order to select those tasks from which to generate descriptions of student conceptions and responses to tasks, and then wrote down a summary of my initial impressions. Second, I searched data for supporting or opposing evidence. I then refined, reconstructed, or rejected my initial impressions using the evidence obtained. I repeated this process with the aim of developing themes of student responses to tasks with reference to their graphical and solution inscriptions involving the derivative and the integral. Third, I documented any apparent shifts (or lack thereof), in student reasoning brought about by their engagement with the tasks. I tried as much as possible to focus on those attributes of student expressions that had a bearing on the tasks without over-interpretation. This method is extremely subjective and would have produced more consistent results if another researcher had gone over the analyses. The qualitative data obtained from the three analysis cycles of design went through the same process. The written analyses of the participating students responses together with some interview responses provided an indication of the guided emergence of ideas among the groups of students as they participated in the distance design experiments. There were two main types of analyses: on-going analyses to support participant learning, and a retrospective analysis conducted to place the results within a broader context. 135
148 Analysis including the retrospective analysis. The data corpus generated in the design experiment was taken from 18 documents of students written work and 6 individual student interviews. As indicated earlier, I used three levels of analysis: level I (data reduction); level II (construction of argument schemes) and level III (narrative construction of emergent student reasoning). The data corpus generated in the design experiment was taken from 18 documents of students written work and 6 individual student interviews. As indicated earlier, I used three levels of analysis: level I (data reduction); level II (construction of argument themes) and level III (narrative construction of emergent student reasoning). Level I (Data Reduction). On this level, I focused on capturing students interpretations and responses as they engaged in the activities of each HLT. The most important element at this stage was selecting those responses and inscriptions which would illustrate prominent ways of student reasoning. The aim was to reduce data to a set I could work with. For each group of students, I noted responses for each selected activity and provided initial descriptions of students ways of reasoning. Level II (Construction of response themes).at this level of analysis, I used the data generated in the first level to categorize students responses according to the themes and claims, across students responses for each of the HLTs. I was searching for any recurrent patterns that would lead to the formation of plausible argument themes related to students reasoning concerning the derivative and the integral. Level III (Narrative construction of the emergent student reasoning). The outcome of the themes from the second level of analysis was a descriptive narrative for each HLT. The three narratives were then combined to form a general narrative for the entire set of design experiments. The narratives consisted of ideas organised around common mathematical activities such as predicting, representing (creating and using graphs and using symbols), interpreting and algorithmizing (applying mathematical operations), and reasoning mathematically (making conjectures and providing justifications). I linked these ideas with the conjectures stated for each HLT so as to identify the initial locations and shifts (if any) in students reasoning patterns. Retrospective analysis. In the retrospective analysis, the envisioned HLT was re-assessed based on actual accounts of student learning in order to argue for, or against the usefulness of the HLT. At this stage, I looked for evidence 136
149 supporting or refuting the planned goal of assisting students in developing an understanding of the reciprocal character of the derivative-integral relationship. I also made assertions as to whether the HLT brought about the desired shifts in student reasoning, and whether students could have developed the forms of reasoning without the HLT. Lastly, I made deductions concerning whether the research exercise had contributed to the development of a domain specific theory. The constructive process in analysing both sets of data converged into the narrative of the analysis of the findings in Chapter V, and the discussions of the findings in Chapter VI Trustworthiness, repeatability and generalizability of findings. A number of methodological issues had to be addressed during the research project. These included internal and external reliability, and internal and external validity (Bakker, 2004). Cobb and Gravemeijer (2008) identify trustworthiness, repeatability, and generalizability as issues that need to be addressed. To attain reliability, the researcher attempts to diminish unsystematic bias while validity is achieved with a reduction of systematic bias (Smalling, 1994). The first issue deals with internal reliability or consistency of findings. The categorization of findings and level of argumentation was designed to increase consistency. Colleagues from the Freudenthal Institute and a math tutor went over the last HLT to improve this consistency. Their comments and recommendations appear in the findings Chapter V. This strengthened the internal reliability. The second issue has to do with external reliability or repeatability. For each HLT round, testable conjectures were formulated for later verification. The research process has been documented so as to allow for potential replication by other researchers later on. The third issue concerns the quality of data collected and the credibility of the reasoning employed. The fact that the construction of argumentation is based on theoretical premises of guided re-invention and emergent modelling which have been tested by other researchers increases the quality of internal validity. The use of successive HLTs and an additional data source to support the collection of written reports was also useful. The use of other sources such as student field notes or records of other forms of student artefacts could have raised the level of internal validity. The last issue concerns the generalizability of the findings. Although it is unlikely that the results produced in this research project will be replicated in exactly the same 137
150 context, the results have been framed in such a way that they can be useful for other contexts. Hopefully, the lessons learnt in terms of the process of HLT construction will be transferrable to other contexts with a range of participants in a range of settings. One main drawback in the research was the inability to develop an environment where students would interact with each other, and, through discussions, cultivate norms of practicing mathematics. Setting up such a learning community would have required the robust design of technology-enhanced learning environment Summary In this chapter, I have summarised the methods of data collection and the data analysis used in the study. The methodology adopted is design research, in which the processes of design and research are connected. In the present research, I was especially interested in how to design instructional sequences from which students would learn to reason about the derivative-integral connection in an RME-oriented learning environment. This meant that I needed to design and pilot activities that would support this type of learning. These activities were in the form of three hypothetical learning trajectories. The anticipated product was a refined HLT leading to particular learning goals. Shifting to a purely constructivist approach to teaching was a challenging task, as there are semblances of instructivist characteristics in the learning activities. Engelbrecht and Harding (2004) concur with having a mixture of constructivist and instructivist approaches when they advise that care should be taken to have a sound balance between teacher and learner-centred activities (p.254). Landsman (2008), a critic of RME, is also of the opinion that a balanced mathematics curriculum in which both abstraction and application play a central role is the key to successful learning design. More contextual research in which a balanced approach is trialled with more groups of students is needed for one to make conclusive decisions. This is one of the recommendations for further research. In the next chapter I present the analysis of the findings. 138
151 CHAPTER V FINDINGS AND ANALYSIS 5.1. Introduction Introductory Calculus instruction mainly introduces students to rules of differentiation and integration. A Calculus introduction may or may not include an introduction to the FTC theory and, in some cases, its proof. As the sample of analyzed texts demonstrate (section 2.3), the emphasis is usually on knowledge of the definitions and on efficient application of the rules. There are some texts where conceptual understanding is stressed. A case in point is Hughes-Hallet et al., (1999) and the South African MALATI initiative (1999). My intention was to design a trajectory along similar lines. In most introductory Calculus courses, differentiation is taught before integration. The two are brought together with the Fundamental Theorem of Calculus. The theorem allows for the evaluation of integrals more efficiently by finding the antiderivative of the integrand rather than by taking the limit of a Riemann sum. In this project, I was seeking for ways of developing a remedial module in which the two processes of differentiation and integration were introduced subtly, while an understanding of the relationship between them was being developed. Using RME-inspired instruction, I aimed at exploring ways of developing sequences in which students knowledge of both the derivative and the integral would be exploited and used to inform the design of a module introducing the derivative-integral relationship. Following a synthesis of literature and examining what the FTC entailed, I experimented with using the notion of accumulation as an overarching idea for an introductory Calculus unit focusing on the derivative-integral relationship. I wanted curve sketching to form an important part of the trajectory. I needed problem situations from which models-of situations would become models-for the FTC expression. The aim was to assist students to develop an intuitive understanding of the reciprocal (inverse) nature of the derivative and the integral using the context of an accumulating quantity such as the distance covered by a moving object. The conjecture was that if students made sense of the relationship between a quantity s accumulation and rateof-change, they would be able to transfer the same type of reasoning to the derivativeintegral relationship expressed in the FTC. The aim was to have students construal of the FTC supported initially with physical, mental, and then graphical interpretations. A challenge was determining the extent to which this could be done in a distance 139
152 learning environment predominantly with print, and limited technological support affordances such as access to the internet. This chapter on findings and analysis is an elaboration of the rationale for, and decisions taken before designing the final HLT which is presented in Chapter 6. It is an account of a design process resulting from drawing on conjectures that emerged from analyzing the three design experiments. The compilation includes some of the typical activities used. In each section, I outline the reasoning behind the selection of the activities. I also characterize the type of student thinking emerging as students responded to a selection of designed activities. All three HLTs were exploratory in nature and were meant to provide direction to the construction of the final HLT. Even then, the final and proposed version of the HLT would still have to undergo more rounds of refinement with more practicing tutors and students to reach the level of a local instructional theory. In the remainder of the chapter, I analyze the initial student responses to tasks in each HLT. Some of tasks were abandoned, others refined, while others were reinstated. The results from the analysis of each experiment informed the design of each subsequent trajectory. I start by describing the learning activities and analysing student responses to selected activities in the first trajectory. I then comment on activities that were processed or re-developed to inform the design of the second and third trajectories. Finally, I conduct an overall analysis of all three trajectories highlighting, critical shifts in student reasoning that were, (or needed to be) addressed to inform the design of the final and preferred l distance-hlt. Comments and suggestions by RME experts and a local Calculus teacher with some exposure to RME design have been analysed and integrated into the proposed final HLT. In order to provide a coherent picture of the extent to which RME was applied in the design process, the last section of the retrospective analysis includes a section (5.7.3) on the challenges I faced when trying to: Locate a starting point for the HLT Negotiate the model of/model for transitions Structure and sequence the contents of the module to support student achievement of the anticipated learning goals 140
153 5.2. Re-inventing the Derivative-integral connection in the FTC expression The development of an understanding of the derivative-integral connection was to occur through student exposure to exercises in which they would be able to develop the facility to later on recognise, define and make an intuitive sense of the first part of the fundamental theorem of Calculus: The graphical setting was chosen as the main representation format as it offered a platform from which the main mathematical concepts pertaining to student understanding of the derivative-integral relationship could be examined. This examination should be differentiated from deep examinations of what it means to understand Calculus concepts such as the one by Zandieh (1997). Using the context of an accumulating quantity, an instruction design process was required to briefly expose students to mathematical concepts which would begin their development towards an appropriate view of: the function and the meaning of ; the derivative and an interpretation of as a rate-of-change, the expression as an accumulation function linked to the definite integral; an intuitive understanding of the limit concept, and the interrelations between the given concepts. The project plan included a section designed to use the context of a changing quantity such as a moving object as a model from which the derivative as a rate-of-change would emerge. Students would need to first determine the ratio of the change in distance (displacement) to the change in time to obtain an average rate of change. The limiting process would then involve analyzing the average velocities over shorter intervals of time culminating in an instantaneous rate-of-change. Finally, students would have to form images of the consolidated limiting process occurring for every moment in time so that the final result was a function that has associated with each moment in time an instantaneous velocity (Zandieh, 1997, p. 101). The aim was to determine if it was possible to generate a learning sequence in which students would get to view the derivative function as a measure of the instantaneous rate-of-change of 141
154 the quantity in question. This understanding would then be linked to the development of an understanding of the integral concept. The other major section was designed to introduce the definite integral as a tool that could be used to calculate an accumulated quantity, represented as the area under a curve for a specified interval or duration. I was searching for a mechanism by which students would gain the perception that the definite integral could be used to obtain information about a function from its derivative. In the process, they would come to the realization that calculating derivatives and calculating integrals were, to some degree, invertible processes. The anticipation was that students would move beyond a symbolic computation of the FTC expression to an understanding of what the derivative and integral were, and for what they were useful. Exposure to some form of covariation reasoning, involving the description and coordination of changes in one variable quantity with changes in another, was critical to this understanding. I was attempting to introduce the derivative-integral link using some exposure to the three functional relationships suggested by Cordero-Osorio (1991) (section this dissertation), namely, a relationship between a function and its derivative a relationship between a function and its integral, a relationship from which one is able to reproduce the original function, given that Another aspiration was to find a way of designing a trajectory where a build-up to an understanding of the last relationship (whereby a student was able to reproduce the original function, given that ) would be used to show that the processes of differentiation and integration were invertible under certain conditions. The challenge was to structure and sequence instructional activities conforming to inquiry-oriented learning tasks typical of RME instructional design principles, (see section 3.2), suitable for a distance introductory Calculus course. Figuring out a way of balancing the instructional content to include a mixture of descriptions, explanations, connection of ideas and calculations and symbol use at an elementary level was a formidable task. Promoting a culture of sense-making using students own responses to learning tasks was a forbidding undertaking, particularly in a distance learning setting. An additional setback was the absence of a discursive learning environment allowing students to share their individual and others thinking about mathematical ideas presented. 142

155 Notwithstanding these limitations, an attempt was made to construct the beginnings of a trajectory leading to an understanding of the derivative-integral relationship. Before this could be accomplished, I had to examine how students worked with graphs, constructed meaning of the derivative-integral relationship as presented in typical Calculus texts, and made sense of the mathematical syntax (outlooks introduced in section 2.4.5, this dissertation). The three learning trajectories were designed as platforms for this exploration. In them, I was trying to establish how students made sense of the instructions they are given and how this information can be used in structuring learning sequences. My analysis of the design experiments which later unfolded into the final HLT is mapped in a process (see Figure 5.1). Figure 5.1: Analytic process of each HLT For each of the HLTs I present: samples of learning activity tasks instructions examples of student responses to the selected activities my interpretation of student responses and how they were used to inform the design of the trajectory in conjunction with the instructional agenda elaborated in chapter IV. I made an effort to find out how participating students responded to and made sense of the given instructional tasks. As in the IPA approach, there was no attempt to test a predetermined hypothesis, rather the aim was to explore, flexibly and in detail, an area of concern (Smith & Osborn, 2007, p. 55). All three HLT descriptions are organised in terms of the three levels of analyses introduced in chapter IV, (see section 4.6): namely data reduction; production of themes; and developing an HLT narrative. Drawing on the 143
156 data body generated in the design experiments, I describe instructional activities, analyze and characterize students responses that emerged as they engaged with activities, and I describe how my interpretations of the students responses and conceptual difficulties feedback into the design of subsequent instruction The first HLT This first HLT was exploratory in nature and was designed to get a sense of what needed to be included in the trajectory. The HLT consisted of 6 main learning tasks; a post test (task 7) and an evaluation (task 8) (see table 4.3 and Appendix B). The pre test was designed to describe student prior knowledge of the derivative and integral concepts. The first questions probed student experiences with previous past papers in order to identify the areas students found problematic. Thereafter, students tried out a task: (Reasoning with graphs), to allow them to work out and reason about change and functional relationships using graphs. This was followed by an activity:( Keeping track of change), designed to consolidate students understanding of the relationship between properties of motion and their graphical representations. The next task: (Introducing average and instantaneous rate-of-change), was designed to allow students to make connections between algebraic, numeric and geometric calculations of the rate-of-change. The last two tasks: From distance to speed and from speed to distance, were supposed to link the derivative and integral relationship. In the next sections, I describe the six main tasks and elaborate on the findings and analysis of student responses for each of the six tasks. The students participating in this HLT are named Student 1 up to Student Samples of learning activities for the first HLT (a) Task 1, pre-test. This initial Pre-Test was designed to test student s prior knowledge of the function, the derivative and the integral concepts, as well as their reasoning with graphs (see figure 5.2). The test was divided into three sections: questions about the function; questions about the derivative concept; and questions related to the integral concept. In the questions about the function concept, I wanted to establish students initial conception of functions. In the questions 1 to 2 about the derivative, I sought to get an understanding of how students defined the derivative, and if at all they used the difference quotient notion in this definition. I was checking if students interpretation of the derivative was the physical one as a rate-of-change or the geometrical one of a slope. 144
157 In question 5, I wanted to establish if the derivative definition presented involved the limit process. I wanted to determine if students pictured the difference quotient as a representation of the average rate-of-change of, and that determining the instantaneous rate-of-change of at involved a limiting process. The language used was designed to evoke an inquiry - based type of thinking by asking what happened when the interval became smaller (that is, as approached ). I sought to establish how the visualisation of this process would lead students to the definition of the derivative function. Students were also given two differentiation calculations (questions 6-7). The objective for setting the last questions was to get some understanding of how the students defined the integral, if they could perform a simple integral evaluation, and lastly, if they had formed any association between the distance travelled by an object (integral) with the area under a curve (questions 8-10). (b) Task 2, reasoning with graphs. Task 2 consisted of two activities aimed at introducing Calculus in a way that would allow the students to work out and reason about change and functional relationships using graphs. Task 2 was designed to be more conceptual than procedural. In the first activity, students were expected to construct graphical representations comparing the motion of a cheetah chasing a horse (later on changed to a zebra), to determine if they ever caught up. Here, I wanted to acquire a sense of the types of representations students generally employed when they worked out solutions to motion problems involving functional relationships. What were they focusing on? What type of reasoning needed to be modified, or retained? (See figure 5.3). (The pictures were added to make the story line more appealing to the students). N.B. I acknowledge that this question was confusing. Although I had intended to replace the horse with the zebra, the text in the questions still referred to the horse. In their responses, students made reference to two animals, the cheetah and the horse. I therefore refer to the horse and not the zebra for the first HLT. Admittedly, the wording of this question could have contributed to the confusion in the students responses. In a subsequent second task (task 2(b)), students were required to make predictions about the distance covered by a car. The word problem read as follows: Imagine that I am driving my car at 100km/h. I speed up smoothly to 120km/h, and it takes me one hour to do it. About how far did I go in this hour? 145
 Task 3, keeping track of change. The aim of this task was to consolidate students recognition of the relationship between rates of change and actual changes of quantities.")

158 I was trying to establish whether it was possible to assist student to associate the distance travelled with the area under the curve and calculate it as:½ x base x height. (c) Task 3, keeping track of change. The aim of this task was to consolidate students recognition of the relationship between rates of change and actual changes of quantities. (d) Task 4, introducing average and instantaneous rate-of-change. As part of this task, I designed three activities, each one aimed at cementing the development of an understanding of an average rate-of-change, followed by the instantaneous rate-ofchange. The aim was to engage students with ideas of rate-of-change qualitatively, numerically, and later on, algebraically. The instructions for the activity read are shown in figure 5.4. In this exercise, I wanted to establish if the students understood what the average rate of change of a function on an interval stood for, before introducing the instantaneous rate-of-change. In the second part of the exercises, I attempted to get the students to create images of the difference quotient (triangle) as a measure of average velocity, or a quotient of differences in the changes or variations of two quantities. I had thought that this would lead to initially, estimation, then a precise calculation of the instantaneous rate-of-change (see figure 5.5). Figure 5.2: Pre-Test for first HLT 146

,")
159 Stellenbosch University Figure 5.3: Figure 5.4: Task 2, first HLT Task 4(a), Question 1, first HLT 147
.")

160 Figure 5.5: Task 4(a), question 2, first HLT (e) Task 5, from distance to speed. Task 5 was primarily designed as a semibridging activity for students as they moved from the embodied world of physical objects to the symbolic world (Tall, 2003). The assumption was that students would use their knowledge of average and instantaneous velocity, acquired in previous activities, to consolidate their understanding of the derivative and differentiation. The intention was to use the familiar graphical representation of a moving object as a model from which a successive approximation process could be developed. The expectation was that by attempting to determine the speed/velocity from a graph, each student would begin to take note of the limiting process as vital to an understanding of the derivative and the differentiation process (see figure. 5.6) for one of the questions intentionally designed to invoke the desired kind of reasoning and the rest of the activities in figure 5.7. Figure 5.6: Question 2- I of task 5, first HLT 148
161 Figure 5.7: Some Task 5 questions, first HLT 149
162 (f) Task 6, from speed to distance. This last task consisted of two activities which were meant to introduce students to the integral concept through an investigation of an accumulating quantity. It started off with a brief historical sketch of the work of Galileo, and his use of a graph to determine the distance moved by an object. The second activity involved calculating the total distance covered by a car, given its speed. The task was intended to evoke within the student, a need to calculate the accumulated value of some quantity (in this case distance). A critical aspect of this reasoning included imagining the accumulating quantity as a multiplicative product of two quantities. As an example, distance could be represented as a product of rate-ofchange and a time interval, where the rate was changing. Ultimately, the goal was to pave way for developing in the students minds the ability to apply covariation reasoning to an accumulating quantity. At this initial stage of the HLT development, a simple strategy adopted was to have students associate an accumulating quantity with a function, along with its input variable. The plan was that at some later stage, students would learn to coordinate the accumulation of a function s input variable with the accumulation of the rate-of-change of the function, over some interval. The graph was central to supporting the required reasoning and the explanations. It was critical that students build an appropriate image of the slope of a curve denoting a rate-of-change, while the area under the curve was related to the accumulated function within a specified interval. Also, in this rather crude beginning of HLT construction, I wanted students to view a Riemann sum as a conceptual object, which could be used to visualize the integral. The last activity was designed to have three phases: calculating the accumulating distance; improving the estimate of this value using the Riemann sum; and visualizing the integral as the area under the curve (see figure 5.8). The second part of the question was designed to lead the students into thinking about how to improve this estimate (task 6(b)). The integral and Riemann sum were introduced in the subsequent section. One question was designed with the intention of encouraging students to think about the integral as a unit consisting of multiplicative components, (see integral question, figure 5.8). 150

163 Figure 5.8: Task 6, from speed to distance, first HLT Examples of student responses, first HLT (a) Task 1, pre-test. Initial students responses revealed that they understood simple functional notation. Students could recognise that both the functions f and g had similar input and output variables. Two students had different impressions of the function concept. Student 1 did not view u and x as variables, and Student 4 felt that the information provided was incomplete (table 5.1). This supports one of the learning challenges alluded to earlier (section 2.4.2, this dissertation), that students have difficulties working with the variables that make up the functional expressions. Table 5.1: Student responses to function questions Student 1 Student 2 Student 3 Student 4 Student 5 Student 6 Question 1 B-if x and u have different values then the functions have to differ. No response Question 2 A-true No response A C A A A-true A-true A -true A-true Students gave a variety of definitions of the derivative. These included graphical descriptions of the derivative as a slope and rate-of-change (Student 5), as the inverse of the integral (Student 6), and as a limit (Student 3). At this stage, the definitions provided by the students seem to project a computational notion of the derivative 151
164 (Zandieh, 1997, p. 96) in that the descriptions only refer to mathematical notation except Student 5 who mentioned a rate-of-change. Only Student 3 included the idea of a function. Question 3 Question 4 No response No response The quotient helps on finding the approximati on of the ( ) slope of. Function f at b subtract the function f-at a divided by the x values b-a Table 5.2: Student responses to derivative questions Student 1 Student 2 Student 3 Student 4 Student 5 Student 6 The No Is the limit No response Geometric Is the derivative is response of a al (as a inverse of a gradient function as slope of a integral of a line at a curve) and particular approaches physical point 0 (as a rateof-change) The quotient helps with finding the approximati on of the ( ) slope of No response Question 5 No response No response There will be no change as long as b is not removed but only brought closer to a. Quotient will be smaller because b-a decreases and f(b)-f(a) also decreases When b moves closer to a, the value of quotient (slope) becomes more positive and thus increases Question 6 B B E E B B Question 7 B - B - E D B - 12sin(3x) 12sin(3x) 12sin(3x) No response B - 12sin(3x) It was not clear if Student 1 s definition of the derivative as a gradient of a line at a particular point was restricted to straight lines or could be projected on to curves as well. When probed about their perception of the difference quotient, Students 4 and 5 seemed to be able to refer to the difference quotient as a ratio of two quantities and. Student 5 already had an image of the difference quotient as a structure that could be used for calculating the slope. S/he wrote: The quotient helps with finding the approximation of the ( ) slope of There was no description relating the quotient to a rate. In response to the question gauging how students could be assisted in developing an understanding of the derivative as the limit of a difference quotient using the graphic milieu, students had different responses. Student 3 had a view of the difference 152
165 quotient dependent on how the two points and were moved. According to Student 3 one was able to move the point along the graph or on a completely different path as illustrated in the response: There will be no change as long as is not removed but only brought closer to. Student 4 pictured a quotient getting smaller in size: Quotient will be smaller because decreases and also decreases. Question 8 Table 5.3: Student responses to integral questions Student 1 Student 2 Student 3 Student 4 Student 5 Student 6 An integral No of f(x)at the response interval a to b. If f is continuous on [a,b]and f(x)is any anti derivative of f(x),now the integration of f(x) from a to b is equal to f(b)minus f(a) and this is the Fundamenta l Theorem of Calculus, part 1 This is an indefinite integral of f(x)dx in mathematic al form that can be to different The definite integral graphs the area under a function f(x) over an interval [a,b] and computer the area using the anti derivative of the function /the definite integral of f(x) with respect to the x between a point [a,b] The integral of function f(x)between the limit bounds a and b. Question 9 D D E C E No response Question B15m/s B15m/s E A 5m/s E A5m/s 10a 10b E D E A 10m E D 120m Student 5 had a view of rotating secants that is usually presented in teaching texts, but with the value of each subsequent slope getting steeper. Student 3 and Student 4 were unable to perform the differentiation calculation, which was not very critical at this beginning stage. On the whole, all the students provided acceptable definitions of the integral except Student 3, who confused the definite and the indefinite integral. Student 1 and Student 2 could evaluate the integral problem while all the others could not. Responses indicate that the students greatest challenge was using the graph to obtain an estimate of the average velocity and total distance travelled by a moving object (see table 5.3). (b) Task, reasoning with graphs. For the first task involving the horse and the cheetah, Student 1 had two unfinished sketches, one for the horse and the other for the cheetah but did not proceed to draw the actual graphs. Students 1 and 4 did not have any graph or any response to this question. Student 2 s representation consisted of a line linking the cheetah and horse. In his/her model, s/he combined the motion 153
166 paths of the horse and cheetah into one straight line, placing the cheetah before the horse (figure 5.9a). Student 2 s response to the question: Can the cheetah catch the horse? read as follows: Yes, because always the cheetah has fast speed than the horse. Intuitively Student 2 assumed that the cheetah would catch the horse because it was faster. Student 3 also had a representation combining the motion paths of both animals into one graph with the motion starting from 0 to 0,45 km in a period of 17 seconds. Student 3 made some calculations before constructing the graph. It would seem that the student combined his/her reasoning and the calculation results to inform the graph construction process (figure 5.9b). Below is Student 3 s response to the question: Can the cheetah catch the horse? No, a cheetah can t catch a horse. A cheetah has a high speed but for a short distance and tires very easily. A horse have a little speed but for a long distance and has a lead of 200m. The cheetah will need around 300m to reach top speed. In response to the first task, Student 5 s representation consisted of two distance-time graphs for the cheetah and the horse (figure 5.9c). S/he is the only one who had separate graphs for each of the animals. The two curves were drawn from different starting points but became almost parallel later on, more or less indicating an assumption that the two animals were never going to meet. Student 5 response to the question: Can the cheetah catch the horse? confirms this assumption: No, the horse is in front leading and travelling at top speed for more than 6km. When the cheetah reaches its top speed, the horse is already running at its top speed. The cheetah then gets tired and its graph decreases while the horse s graph increases further. Student 6 drew the axes but did not construct any graph. As part of his/her answer the second task, Student 2 modelled a velocity-versus time graph with a straight line going from 100km/h to120 km/h, (figure 5. 10a) and calculated the value of s as equal to in km/h 2. Using a similar graph, Student 3 represented the information with a velocity-versus time graph with a straight line going from 100 km/h to 120 km/h (figure 5.10b) but did not proceed to obtain an answer to the question. Student 5 used knowledge of the rate-of-change to draw the first part of the car s motion where the speed was 100 km/h (figure 5.10c). Student 5 attempted to extend the same argument for the part where the car was accelerating to 120km/h in one hour. Student 6 had no responses to task 2b. 154

167 Figure 5.9: Student Constructions, task 2a, first HLT 155

168 Figure 5.10: Student Constructions, task 2b, first HLT 156
169 All six participating students used the motion graphs, either the distance versus time graph, (Student 5) or the velocity versus time graph (Student 2, Student 3), as anchors for reasoning about motion. They were aware that aspects of motion (distance, velocity, time), could be represented graphically. They were not very confident about how to coordinate and make sense of the representations of these aspects graphically. It seemed that students needed cues that would assist them in recognizing how, for each object, the distance was varying with time, how this variation became the velocity-time variation, and how the two were connected. The process of determining which and how the varying aspects of two changing quantities were related was difficult for the students to discern. Another factor requiring attention was the way the students drew the graphs. The students participating in this study had problems selecting appropriate scales, which in turn affected their ability to reason graphically. Representing drawings to scale was another challenge. In a distance learning environment where tutor-student interaction could be effected, these two teaching points would have been addressed by a tutor. The first one would have been an emphasis on the utility of the difference quotient as a conceptual tool for reasoning about the rate-of-change. The second one would have been assisting students with constructing graphs in order to try to guide their reasoning. (c) Task 3, keeping track of change. I abandoned the task because students did not understand what they were required to do. The task instructions were not clear. (d) Task 4, introducing average and instantaneous rate-of-change. As indicated earlier, this activity was designed to initiate in students an awareness of the constitution of the average the rate-of-change of a function on an interval, before introducing the idea of an instantaneous rate-of-change. The results indicate that the term average evoked different meanings to each of the students, as they all gave varied answers to the first question of determining the average speed during the first 10 minutes (see table 5.4). Student 5 who had an interpretation closest to a calculation of total distance/over time elapsed used a shorter time interval, giving an answer of a 2.4 km/min instead of 2.2km/min. Student 6 exhibited a conceptualization of averages consistent with what is reported in research. That is, students often confuse the concept of the average value of a continuous function over an interval with the average value of a set of numbers (Doorman, 2005; MALATI Group, 1999). This is also evident in Student 6 s first answer which was 157
170 Table 5.4: Student responses to task 4(a) question 1 Question 1a (average speed during the first 10 seconds) Student 1 Student 2 Student 3 Student 4 Student 5 Student 6 0,47 12,5km/min km/min Question 1b Because the velocity is too small (fraction) Mathematic ally, the speed is the distance travelled divided by the time of travel Certain The good estimate should be made within smaller intervals for the estimation to be accurate. Question 1c Question 1d No response Question 1e No response No response I am not sure No response. 158
171 Student 6 s response to question (c) What is the average speed during the time interval between and was Students managed to calculate the average speed correctly when the interval boundaries were clearly specified. Table 5.5 shows student responses to task 4(a) Q2, where an attempt was made to encourage students to generate images of the difference quotient (triangle) as a measure of average velocity. These attempts did not work out as planned. Students seemed to have a tendency of reproducing definitions they had acquired prior to participating in the experiment. Table 5.5 Student responses to task4 (a) Question 2 Student 1 Student 2 Student 3 Student 4 Student 5 Student 6 Question 2a No response 2,8km/min 3.03 km/min 3,175 km/min 3.2km/min 41,7m/s 5,0m/s 70,8m/s 53,3m/s ,3km/min 3,6km/min 3,2km/min 3,2km/min No response Question 2b Question 2c Question 2d No response Sketch in book No response = 2,2km/min Sketch in book The velocity at an instant is a constant one and there are no changes expected. For t =10 min, v avg =36.7m/s. The method I have used is the one used timelessly in the book Sketch in book Velocity at an instant is the one that v avg approaches in the limit as we shrink the time interval.v aug is the displaceme nt divide by the interval while v is the derivative of distance divided by derivative of time. 2.2km No response No response Not too confident, Not certain of calculations No response The average velocity is the displaceme nt (change in position) over the change in time and the velocity at a given time. No response No response No response 159
172 (e) Task 5, from distance to speed. Four of the six students answered the first set of questions even though the answers were different. They all seemed fairly conversant with the symbolic language used. However, all of them linked the characteristics of the graph to the assumed characteristics of the corresponding situation (Doorman, 2005). In other words, the graph was an image of the situation. To most of the students, going up was accelerating and coming down was decelerating. Table 5.6: Task 5 responses Student 1 Student 2 Student 3 Student 4 Student 5 Student 6 Question 1a No response No response Question 2b Question 2 At t=2.5 the object reaches its maximum and begins decreasing The object is accelerating between x=0 and x=2.5 and decelerating between x=2.5 and x=5 No response It stops and changes direction Yes By looking at the graph The rate-ofchange is at maximum I deduce from the graph when object is accelerating No response 2 No response The rateof-change is zero Yes, when the graph increase the object accelerates and when the graph decreases the object is decelerating We must find the derivative at point 2 Q 2a 15 1m/sec 1 No response Q 2b 15 1m/sec 1 No response Q 2c No No response No No response response response Question 3 No table in No No response book response response Question 4a B B B B B B Question 4b A A A A A A No response No response 4/2=2 No response 6/0.5=12 No response No No response response No No response response The students did not succeed in examining how the slope (or the difference quotient as a representation of the slope characteristics at a point), was changing. The questions did not contain clues to assist the students in determining if the slope was getting steeper, and whether a measure of the slope had a negative or positive value (see table 5.6). Efforts designed to try and steer the students into thinking and reasoning about obtaining better estimates of the average velocity by reducing the size of the interval were not very successful. A question designed to evoke the required type of reasoning (figure 5.7) was attempted and partially completed by Students 5, 3, and 1. Student 2 completed the entire table for this Question (see table 5.7). 160
173 Table 5.7: Student Responses to Q2-I Student 5 and Student 3 t 2 t 1 t s 2 s 1 s s/ t ,01 Student 5 and Student 3 had the same entries , , ,1 Student 1 t 2 t 1 t s 2 s 1 s s/ t ,01 Student 1 did not have any negatives , , ,1 Student 2 t 2 t 1 t s 2 s 1 s s/ t ,01 6, , ,1 6, , ,01 5, ,0101 1, ,1 5,89 6-0,11 1,1 At the end of the main tasks, Student 2, 6, 3, 5 and 1 all attempted the practice exercises given at the end of the activity. All the six students were comfortable with answering the definition and procedural questions but could not answer questions requiring conceptual interpretation such as: Lesson 2, Q4 which read: If the volume of a sphere is a function of its radius, what is the relationship between the rate-of-change of the volume and the rate-of-change of the radius? They all left this question unanswered. The responses also included statements such as the one given by Student 5: if the graph increases, the object accelerates and when the graph decreases, the object is decelerating. This student s reasoning suggests an inability to distinguish the aspects of the physical variation being represented by the graph. This student would have required further prompting had the situation allowed. In one of the activities, students were required to use a mobile graphing application-math4mobile. This activity was excluded from the analysis as none of the participating students managed to access this activity on their mobile phones. (f) Task 6 - From speed to distance. The first part of the question designed to introduce students to the integral concept using calculations was answered satisfactorily. However, none of the students were able to trace the path of the moving object when asked to do so (see table 5.8). 161
174 Question 1a Question 1b Table 5.8: Task 6(b) Calculating the accumulating distance Student 1 Student 2 Student 3 Student 4 Student 5 Student 6 No is 61.65km No response total response No response distance No response No response No response No response No response The second part of the question which sought to encourage students to think about how to improve this estimate (see figure 5.8), had better results. To some extent, some student responses indicated that this activity evoked the desired type of reasoning as Student 3 and Student 5 correctly noted that to improve the accuracy of the estimates, one needed smaller intervals. There were varied responses related to the number of intervals and the total distance covered in the first interval, indicating variations in the types of reasoning. Student responses are shown in table 5.9. Table 5.9: Responses to 6(b), improving the estimation Student 1 Student 2 Student 3 Student 4 Student 5 Student 6 Question 2a No response Smaller interval No response Question 2b Question 2c No response No response 0.07minutes 0.33km By measuring the velocity at a smaller interval We would have 60 time intervals Total distance travelled=(2 0.55km/h)1 hour 15 minutes No response By measuring the velocity at smaller intervals No response 5 intervals No response 5.14km No response No response The question was designed to encourage students to think about the integral as a unit consisting of multiplicative components and the relationships between them.however, it produced mixed results. Only Students 3 and 2 made attempts to describe some type of relationship, with Student 3 showing awareness of a multiplicative structure. Student 5, 1, and 6 attempted the exercises at the end with mixed levels of success. See table 5.10 for student responses. 162
175 Table 5.10: Responses to integral question Question 3a Student 1 Student 2 Student 3 Student 4 Student 5 Student 6 No No No No response response response response A=1/2b*h s=v*t v=b*h w=f*s Yes, they all have meter(m)as a unit for length, distance, height and displaceme nt Question 3b No response Area and volume have b*h work and distance common with distance(s) -The integral of area= w..l -the integral of distance = v.t -the integral of volume= Axh No response No response No response the integral of work= F.displacement Responses to the post-test (task 7) and evaluation (task 8). The results of the post-test did not reveal any marked improvement in the students thinking around the derivative and integral concepts. On the whole, the six students just replicated the answers they had from the pre-test. The students expressed a number of sentiments in the evaluation activity. There was an impression suggesting that the course involved more Physics than mathematics: I find the course confusing and it requires a lot of background in physics (Student 1). The science (physics) part is not part of my studies (Student 2). Student 2 also found the word problems tedious citing that these only create confusion. Attempts to integrate mobile learning activities were not successful because of two main reasons: Students did not have mobile phones as indicated by Student 3, I didn t operate one or If I got it I would be prepared to use it. The other hindrance was the functionality of the phone. Unfortunately, I couldn t use the mobile learning since my phone is GPRS unable, (Student 1). Overall, students felt that the activities helped them to understand the basic Calculus concepts better because it was a form of revision. The program was indeed beneficial 163
176 in a sense that I revised aspects of Calculus that I studied the previous year (Student 1). Some students appreciated the investigative nature of the activities as they helped them think. Student 3: It made me keep on thinking about the forthcoming work. Student 4: They were very relevant and helped to exercise the mind and thinking very hard. When asked about how well the activities could help in their preparation for formal Calculus courses, some students agreed as indicated by Student 2 s response, Too well. The content about integration and derivatives was found to be relevant because it is part of my studies (Student 2). Suggestions for improvement included giving more detailed notes and explanations: Student 1: I think lecturers should concentrate more on derivation and integration (trig functions) by giving more detailed notes to learners. Student 2: Maybe certain aspects must be explained before questions are asked. Engagement with the activities made students recognize their shortcomings. For example, Student 3 remarked, Your program was very challenging. I realized that I have a shortage in mathematics. They also indicated they required more support, The standard of the course is right; the only thing to do for us is to prepare a class for us once or twice a week (Student 3). When asked about areas of learning difficulty, students mentioned integration and differentiation of trigonometric functions, integration by parts, graphing and problem solving, implicit and explicit differentiation, integration of trigonometric sums, and determining the area bounded by the two graphs. All the difficult areas mentioned relate to techniques, not conceptual understanding, which is emblematic of the general procedural outlook to teaching and learning Calculus at this foundational level Analysis of the first HLT The data was reduced to deal with inferences characterizing student representations and describing student ways of responding to the tasks presented. In this first wave of analysis it was extremely difficult to characterize the participating students representations of mathematical solutions as numeric, graphical, algebraic or verbal, because none of these undertones clearly stood out. In this initial analysis, I was interested in how students went about dealing with a learning task, particularly the task involving the construction of a graph. On the whole, the picture that emerged was that of students having images of disjointed sets of mathematical symbols, mathematical definitions and intuitive forms of reasoning, not necessarily coherently congregated into unified structures. The students are not entirely to blame as the activities at this stage were also rather disjointed. 164
177 As to outlooks students revealed when responding to questions involving functional relationships, the reasoning with graphs cheetah-horse task 2 provided snapshots of students forms of reasoning. All six participating students seemed to be aware of the distance-velocity-time functional relationships in this task, as they could differentiate between symbolic and graphic representations. However, there were two major hurdles. The first one was to do with students inability to isolate and process the constitutive elements of the accumulating distance (see section 2.4.4). Students had difficulty recognizing those aspects about the motion that needed to be represented graphically. One student (Student 5) partially overcame the first hurdle by realizing that graphically, it made sense to start with two curves, one for each of the animal s motion (see figure 5.9c). The remainder of the students displayed a unistructural approach (section , this dissertation) as they tended to focus only on determining the final distance between the two animals in response to the question: Can the cheetah catch the horse? It would seem that their primary objective was to find the correct answer and not to analyze the motion of each animal and compare the velocities or/and distances covered in order to arrive at some answer. This would partially explain the single graphs presented by Student 2 and 3 for task 2 (see figure 5.9a & 5.9b). The single line graph can be associated with the representation of a missing element x, which is normally used in finding solutions to problems involving distances. There clearly needed to be some kind of orientation phase in the instructions given in which students would be able to isolate the aspects in the changing quantity that could be linked to variables. These variables would then later be represented graphically or symbolically The second hurdle involved frames of reference. Some students worked with a velocity-time frame while others chose the distance-time-frame of reference. The instructions lacked sufficient elements of guidance needed to direct students in using either reference frame in order to develop the required forms of reasoning. In future, one would have to design activities where it was easier for students to easily determine points of reference. It was heartening to observe that two students (Student 3 and 5) used their intuitive reasoning to justify their arguments. These students had the willingness to engage with the tasks. In an attempt to guide students into creating images of a quotient of differences in the changes or variations of two quantities, I tried to introduce the difference quotient triangle as a measure of the average rate-of change (velocity in this case). My conjecture was that students would use this image to develop an understanding of the 165
178 derivative if they were guided through a process requiring successive approximations of a derived quantity such as speed (Task 4 - Introducing average and instantaneous rate-of-change). The anticipation was that they would use also that same image to correctly respond to Task 5 - From distance to speed. In the same token, I wanted students to view a Riemann sum as an object with which they could visualize an integral emerging (Task 6 - From speed to distance). The participating students experienced two difficulties. First, they did not visualize the difference quotient as a reasoning tool representing two variables changing simultaneously. As a result, they did not see its value in developing a mature understanding of the derivative. Secondly, the Riemann sum, integral and area under a curve were introduced in a very fast and disjointed fashion. No student was able to develop a clear sense of what the process of integration involved after the exposure to this activity. It was difficult to discern any forms of MA reasoning as the learning tasks were not sufficiently designed to make the correlation between an accumulation of a function s input variable, and the accumulation of its rate-of-change explicit. Students still found the interpretation of area under the curve and what the curve represents, problematic. From an analytical point of view, I felt that I needed to refine the questions I was asking of the data in order to make sense of how the students perceived and responded to the learning tasks. The student responses were framed to highlight the following queries: What representations were the students focussing on in their responses (graphical, verbal, and symbolic)? How were students defining the given concepts? Were they using formal definitions or symbolic expressions? Were there any visible connections between the student representations? These observations were carried into and extended to the second design experiment The second HLT This section describes selected activities from the six tasks of the second design experiment (see table 5.11). The tasks were modified versions of the first HLT with exclusions and additions. The HLT consisted of the same Pre-test (Task A) and tasks structured to focus on three phases of conceptual development. These were: reasoning with graphs (Task B); rates of change with (Task C) - the water problem and the derivative function (Task D); accumulation of change and rate-of-change of 166
179 accumulation in (Task E) - Area and the Fundamental Theorem of Calculus. There was a post test (Task F) and an evaluation at the end of the tasks. Table 5.11: Analyzed second HLT activities Activities analyzed as part of the second HLT Task A: Q3 - Q5 Q8 and Q10 Task B Task C: Q4, Q5 & Q7 Task D: Q2, (a)-(c) Q6 (f) Task E: Q7 (a) Q8 (a) Q 11 Student initial interpretations of the derivative Student initial interpretations of the integral Reasoning with graphs Graphing involving water flow The derivative Area and the Fundamental Theorem of Calculus These activities were efforts to engage students in exploring both the derivative and integral concepts so as to enable them to make inferences about the underlying derivative-integral relationship. A summary of the activities appears in table 4.4 with details attached in Appendix C. Students participating in the first experiment had exhibited difficulties with the construction of graphs and making graphical interpretations. These considerations motivated the re-designing of some of the activities in the HLT. In planning the second experiment, I included an activity involving examples of water flowing into different containers in an effort to stimulate reasoning about changing quantities (Task C). I also added a brief introduction to the FTC and two questions around the FTC (Task E). The HLT was intended to culminate into an activity in which students would combine the separate developments of the derivative and integral to draw attention to the inverse nature of differentiation and integration intuitively. My hope was that this relationship would become vivid in the Fundamental Theorem of Calculus expression. The larger aim of the design experiment, however, was to highlight aspects of student conceptions and orientations that would help improve the design of the HLT. It is important to note that a missing element throughout the design experiment was the tutor-learner interaction. The descriptions of students responses to each mathematical activity, their uses of notation and the construction of explanations are based on my subjective interpretation of these acts. However, I believe that investigating and reporting on how students engage with learning tasks without the help of a tutor has a valid contribution to instruction design for distance learning. This is what normally happens when students learn in a South African distance-learning environment. They seldom interact with a tutor. 167
 Task A, pre-test.")
180 The next sections are elaborations of the findings and analysis of the selected activities. I refer to the students participating in the second design experiment as Student 7, Student 8, Student 9, Student 10, Student 11 and Student Samples of learning activities in the second HLT (a) Task A, pre-test. The same pre- test presented in the first HLT was used again (see section 5.3.1). (b) Task B, reasoning with graphs. From the first HLT, Task 2 was used as Task b (see figure 5.11). This time, hints were added for constructing the graph. The rationale behind this activity was a desire to stimulate students into modelling motion by comparing the motion of the two animals. The expectation was that students would think about what was happening in terms of velocity, distance and the time accruing as each of the animals moved. When going through the activity, I anticipated that each student would first deliberate on those quantities that were changing (distance, velocity, time), focus on those quantities that were required to construct graphical models for each of the animals, make assumptions about a starting point, and then construct the graphical model in order to make the analysis (a comparison of the two models), from which a response to the task would come forward. The hints were supposed to have given guidelines for constructing model frameworks while leaving room for each individual to develop their own strategy for solving the problem. Figure 5.11: Task B second HLT 168
 bottle problem (section 2.4.3). They went through a few preliminary activities before attempting this task. One of the preliminary tasks (figure 5.12), required some explanations Figure 5.")
181 (c) Task C The water problem. The motivation for this task was to bolster the reasoning with changing quantities in a context different from that of a moving object. Students tried out Carlson et al. s (2001) bottle problem (section 2.4.3). They went through a few preliminary activities before attempting this task. One of the preliminary tasks (figure 5.12), required some explanations Figure 5.12: Preliminary activity-task C- HLT 2 The aim was to have students think about the independent variable (volume) and dependent variable (height) in order to correlate the accumulating volume with the rate at which the water height was changing. In previous activities, students had been shown that the volume was related to the radius of the container (d) Task D, the derivative function. This task was meant to help students to develop a refined understanding of the derivative as the connection between a function and its rate-of-change. My aim was to get the students to deepen their notion of average rate in order to build an image of it as a difference quotient (triangle). I was hopeful that this image would then be used to represent an average rate-of-change for any function s increment over some interval. The anticipation was that this image of a function s average rate-of-change over a small interval would be useful when thinking about relationship between the rate-of-change and accumulation in the last activity. Using the familiar graphical example of a moving object as the context, the language of Calculus was now used for the descriptions and explanations. The expectation was that students would transfer the reasoning acquired from the previous concrete task settings (B) and (C), to inform their thinking about a function s rate-of-change over some interval. I used Q2 (a) and (b), Q3 and Q6 (f) to describe and analyze student responses (figure 5.13). This diagram contains a display of sample tasks from the second phase of design experiment. (Question 2 is a slightly modified version of task 5 in the first HLT). 169
182 Figure 5.13: Task D activities- HLT 2 Prior to reading some notes on determining the instantaneous rate-of-change, I had asked the students how they would go about determining the rate-of-change at the point. In the accompanying notes, I emphasized that a better estimate could be achieved if the average rate-of-change was calculated over a small interval and attempted to direct the discussion into a definition for the value of a derivative at point on a curve. Students were also asked to sketch a velocity graph from a position graph in Q5. After the activities, students went through some revision questions. One of the revision questions read as follows (figure 5.14). 170
183 Figure 5.14: Revision question 6(f) (e) Task E, area and the FTC. The last activity in the second HLT began with a brief introduction of the integral as an area under the curve. I used Galileo s falling body experiment as a pre-cursor to the type of reasoning required to understand the integral concept. This was followed by a very intuitive exposé to the Riemann sum involving the summation of set amounts of a quantity leading to a characterization of the definite integral. I used the formula to give an example of a quantity chunk. Then I made the students go through exercises of calculating the total distance covered by in fixed time period. I wanted students to transfer this image onto a graph by picturing a Riemann sum for a function as a sum of chunks of quantities of multiplied by small lengths x on an interval as a shaded area. I wanted the students to have an image of a Riemann sum as a function representing an estimation of a quantity accumulating in relation to changes in another. The statement I used to link the Riemann sum and the integral read: If the Riemann sum (sum of products) for a function on an interval [ ] gets arbitrarily close to a single number when the lengths are made small enough, then this number is called the integral of on [ ] and is denoted by :. 171
, the second involved a graphical illustration of how the derivative of an area function could be the original function (figure 5.")
184 Three activities are presented here (figure 5.15). The first activity was about the area function (figure 5.15a), the second involved a graphical illustration of how the derivative of an area function could be the original function (figure 5.15b), the third activity was designed to test student understanding of the FTC relationship (figure 5.15c). Figure 5.15: Task E, second HLT The design challenge in the HLT was finding how to connect the seemingly static image on the right hand side with the fluid dynamic image of a varying function on the left. My aim was to use this very crude interpretation as a stepping-stone from which students could develop an understanding of the symbolic representation of the Fundamental Theorem of Calculus. The next section is a summary of student responses to some activities. 172
185 Examples of student responses, second HLT (a) Student initial conceptions of the derivative and integral. In the preliminary assessment of student initial conceptions of the derivative, all the students gave acceptable although not complete definitions (see table 5.12). Student 10 used the literal meaning of the term: Derivative is something from which something else comes or originates i.e: it is derived from something. None of the students referred to the formal definition of the derivative as the limit of a difference quotient. They also did not associate the derivative with any graphical construction such as the slope, tangent or the gradient of a curve. None of the students used symbolic expressions to define the derivative except Student 11 who described the derivative as a differential coefficient of e.g.: with respect to. The majority of the students in this group associated the derivative with a mathematical procedure-differentiation (Student 7, & 12), which was linked to the function (Student 7, 8 & 12). Students 7, 10 & 12 referred to the derivative as the end result of a process. For example, Student 12 stated that: It s a function or constant obtained from differentiating a previous function one or more times. Only Student 8 related the derivative to some form of rule connecting two functions.s/he wrote: Is a task that gets an expression out if a function and makes that function an expression.the derivative will act as a connection between the two functions. Most of these students focused on describing the derivative as some tool or entity that was used in a mathematical context. Their descriptions were also connected to the function concept. Table 5.12: Student derivative definitions, second HLT Question 3 Student 7 Student 8 Student 9 Student 10 Student 11 Student 12 A derivative is a result got after differentiati ng a given function Is a task that gets an expression out if a function and makes that function an expression. The derivative will act as a connection between the two functions Derivative is a mathematic al equation or constant obtained after differentiati ng Derivative is something from which something else comes originates i.e: its derived from something The derivative is the differential coefficient of e.g.: y with respect to x. the one you get after differentiati on is the derivative. It s a function or constant obtained from differentiati ng a previous function one or more times. The descriptions of a difference quotient provided by the students generally indicated that their focus was on a description of the mathematical symbols themselves and not necessarily on what they represented, although one would require further probing to make this generalization (see table 5.13). This is what Thompson (1994) describes as 173
186 symbol-speak. Students often use these descriptions because of a lack of conceptual understanding or underlying knowledge about what the symbols or terms represent. An example is Student 7 s response: The quotient stands for the gradient of the curve between the points ( ) and ( ). Table 5.13: Student interpretations of the difference quotient Q4 Q5 Student 7 Student 8 Student 9 Student 10 Student 11 Student 12 The quotient The gradient The quotient The quotient It means the It finds the stands for the of the f(b)-f(a) means that gradient of gradient of gradient of tangent to over b-a there is a the curve the tangent to the curve the curve means the change in the found from 1 st the curve y=f(x) y=f(x) region y-co-ordinate principals at between a between the between the divided by the points a &b and b. points (a,f(a)) graph y=f(x) change in the an and (b,f(b)) and the line x co-ordinate approximate. which will value of its affect the gradient. f(b)-f(a)over b-a increases as b moves closer to a and therefore the gradient becomes steep The gradient of the curve increases ie:f(b)-f(a) over b-a increases f(b)-f(a) over b-a reduces in size when b moves closer to a that is the area covered by the region. y=f(x) The quotient gives the gradient of the line or chord as mentioned in number4 as b moves nearer to the gradient of the chord approaches the gradient of the curve at point (a,f(a) f(b)-f(a) over b-a becomes smaller and its value approaches an exact value When b moves closer to a the tangent is steeper hence an increase in the gradient Student 7 and Student 11 saw the quotient as the gradient. Student 8 and Student 12 mistook the quotient for the derivative when they mentioned the phrase gradient of the tangent to the curve, even though their definitions required further refinement. Student 9 was completely off-course, expressing the quotient as an area: The quotient over means the region between the graph and the line. By 174
187 starting his/her definition with the phrase it finds..., Student 12 had a depiction of the reasoning I was trying to promote during the first HLT, that of seeing the quotient as a tool which could be used to calculate a quantitative value: It finds the gradient of tangent to the curve between a and b. Only Student 10 s description had traces of ratio depicting changes in two given variables with a reference to the function concept: The quotient means that there is a change in the y-coordinate divided by the change in the x-coordinate which will affect the. Even though the students had seemingly not made any associations between the derivative and its graphical representation, their responses resembled incomplete formal definitions of the derivative. For example, Students 7, 8 and 12 s responses to what happens when b moves closer to a in the same scenario corresponded with images of a rotating secant whose gradient keeps on increasing that is commonly presented in Calculus texts. Student 11 s description had traces of some knowledge of the limit concept over becomes smaller and its value approaches an exact value. Student s 10 formal description was difficult to decipher: as b moves nearer to the gradient of the chord approaches the gradient of the curve at point ( ). Student 9 s area explanation was not related to the derivative concept. Table 5.14: Student integral definitions- HLT 2 Student 7 Student 8 Student 9 Student 10 Student 11 Student 12 Q8 Is the term that means the total area between the function f(x)and the x- axis within the limits b ( which is the upper limit)and a (which is the lower limit)on the x-axis The integral of the function f(x) from a to b with respect to x It means the integrate the function f(x) with respect to x and after substitute in the upper limit b and the lower limit a to the inter grated function. Considering y=f(x) if for example the area is divided into n parts of equal widths then the area of an element is f(x)dx the summation of the elements will be x=b in the limit of dy -0 F is a function of x and its curve so you are finding the area under the curve f(x)between the limits a and b It is integration of a function f(x) with respect to x between (limits )a and b. Student integral definitions were acceptable definitions of an integral expressed as an area (Student 7 and 11), or were defined with symbol-speak (Student 8, 9 and 12) (table 5.14). Student 10 produced a definition with nuances of a Riemann sum definition considering if for example the area is divided into n parts of equal widths then the area of an element is the summation of the elements will be in the limit of. 175
188 All six students had acceptable graphical interpretations of a curve involving motion (see table 5.15). Table 5.15: Initial graphical interpretation, second HLT Student 7 Student 8 Student 9 Student 10 Student 11 Student 12 Q10a A 5m/s B 15m/s B 15m/s B 15m/s B 15m/s B 15m/s B 50m C 90m C 90m C 90m C 90m C 90m From the responses given, all students seemed to possess the necessary starting knowledge (though not refined), to engage in the ensuing activities. They had notions of the derivative and integral that could be used to further develop the mathematical relationship between the two concepts in task B. (b) Task B, reasoning with graphs. The results show that although three of the students used the hints given to construct graphical models, their starting points for framing their responses were taken from their knowledge of equations from physics-as shown in samples of their responses (see figures 5.16a e). To these students, the questions were presented in a format they had experienced in Physics rather than Mathematics classes (see section 5.4.3). Their inclination was to use the familiar physics equations and formulae rather than reason with the graphs to solve the problem. Students tended to first revert to the use of algebraic formulas and equations to solve the problems. They then transferred the calculated quantities to inform the graph drawing exercises. Using the graphs as devices or reasoning tools for finding solutions did not occur smoothly. The added hints to the instruction assisted with making the students aware that they needed to construct two curves for- which they did. However, it seems that the hints led the students to focus only on determining the total distance covered by each animal, steering them away from discovering where the zebra was at the time the cheetah started moving. One student (Student 9) did not present any graph. 176


189 Figure 5.16: Student graphs for task B, second HLT 177
190 The students needed this information to make an assessment about the distance covered by both the zebra and the cheetah from that point, so as to form a judgment as to whether the cheetah caught the zebra. Students 7, 8, and 12 all reasoned that because the zebra covered a larger distance than the cheetah within the given time period, the cheetah did not catch the zebra. Calculations of the total distance covered by the cheetah was 685.3m (Student 7), m (Student 8 and Student 12), while the total distance covered by the zebra was m (Student 7), and m (Student 8 and Student 12). These calculations included the 200 m the zebra had already covered when the cheetah started moving. To Student 7, determining the total distance covered by each animal in the given intervals provided a measure of whether the cheetah caught the zebra. Student 7 based his reasoning on distance/time calculations (see table 5.16). Table 5.16: Student 7 s reasoning on Task b - HLT 2 Period Time Distance covered by cheetah Distance covered by zebra Cheetah accelerating to 100km/h 17s 235.5m m Cheetah covers the remaining 450 m 16.2s 450m m Zebra slows down to 50 km/h Zebra s motion while cheetah is asleep? 200 m Total distance m m S/he assumed that the zebra slowed down after the 17 seconds. Had Student 7 based his/her decision on the first 33.2s, s/he would have discovered that the zebra covered a shorter distance. Student 11 used a different type of reasoning (table 5.17). Student 11 based the resultant distance between the two animals as a means of determining if the cheetah caught up the zebra. Student 11 found the difference in distance between where the cheetah and zebra were in the 17s. After that, s/he worked out the distance between the two animals for hypothetical time values of 10s and 15s. Student 11 argued that since the distance between the two animals was decreasing, the cheetah caught up with the zebra. Student 11 remarked: 0.07 km is very small distance and since I have been using 199 km/h for the cheetah, yet it should have been over 100km/h that means it will have caught the zebra. Student 10 added the time it took the cheetah to get to 100km/h to the time the cheetah got tired in 450 m, to get a total time of 33.2s. 178
191 Table 5.17: Student 11 s reasoning on Task b HLT 2 Period Time Distance covered by cheetah Cheetah moving at or above 100km/h Zebra moving at 70 km/h Cheetah moving at or above 100km/h Zebra moving at 70 km/h Cheetah moving at or above 100km/h Zebra moving at 70 km/h Distance covered by zebra Distance between the two animals 17s km km km + 10s km km km +15 s km km 0.07km Using Physics equations, Student 10 derived expressions for the total distances covered by both the zebra and cheetah (see figure 5.17). Figure 5.17: Student 10 s response to Task B-HLT 2 Student 10 s reasoning was that at the point the cheetah caught the zebra, both animals had covered the same distance. Student 10 wrote: the time taken for the cheetah and zebra to be at the same distance from the starting point of the cheetah is less than the time taken for the cheetah to get tired. This means that the cheetah will 179
192 get the zebra just before it gets tired. On the surface, Student 10 s argument does not look convincing but it resonates with the argument that a determination and comparison of the distance covered by the cheetah and zebra could form the basis for judging whether the cheetah catches the zebra. Graphically, this is a point from the time the cheetah starts moving, where the area under the cheetah s curve is equal to the area under the zebra s curve, provided they are both still moving. This activity of analyzing the cheetah chasing the zebra forced students to think about the relationships between the changing quantities-velocity, distance and time deeply. Conception of these changing quantities graphically was problematic to the students. Their graphical model building process relied heavily on their perceived way for doing mathematics that is generally based on performing calculations. Re-directing this type of thinking is a difficult undertaking. Student responses to this activity brought to light the problems students face when trying to construct a graphical mathematical model. In this context, this required redescribing the given situation in terms of the assumptions related to the given speed functions of the two animals, and then working out the accumulating distances in the given time periods by coordinating the accruals of distance and accruals of time (Carlson et al., 2002; Thompson, 1994). The way the activity was presented did not emphasize the aspects and relationships of accumulation and rate-of-change. Instead, students had to struggle to construe the presented situation in those terms. This turned out to be a significant challenge for most students. A summary specifying the intention of the exercise and refocusing student learning to the aspects of rate-of-change and accumulation should preceded this activity, since the learning was at a distance. Even with the additional hints, the level of guidance was still not sufficient to stimulate the required type of student reasoning. In the next task, the two aspects of rate-of-change and accumulation were reintroduced in the context of flowing water. (c) Task C, the water problem. All six students presented sketches depicting the representations of water flowing into differently-shaped containers: a cylinder, a sphere and a cone. I only show Student 8 and Student 9 s sketches in figure 5.18, as all the rest were quite similar to Student 9 s representation. The six students explanations are shown in table


193 Figure 5.18: Student s sketches, Task C, second HLT Q5 cylinder Table 5.18: Student s responses to task C, HLT 2 Student 7 Student 8 Student 9 Student 10 Student 11 Student 12 It is a straight line The rate of increase of The volume of the The height with respect to the As the volume of water There is a constant rate because the radius of the volume with that of the water in the cylinder volume flowing into the flowing into the cylinder of increase of volume cylinder or the crosssection of the cylinder is rate proportional to the radius of the cylinder is since the shape is uniform height increases at constant is directly cylinder is as above because the increases proportionally with height due to the uniform cross sectional constant and therefore the height of the water constant. Since volume is the graph is like that radius all through the volume is dependent on in the cylinder (radii directly proportional to the because change in height the height of the liquid is uniform radius of the cylinder, that is directly proportional to container only. Therefore an throughout the means the as the height of the change in volume. increase in height of the liquid) water increases, the volume also liquid causes a change in increases at almost the same volume occupied by the rate therefore giving the graph liquid. those line passing through the origin 181
194 sphere cone Student 7 Student 8 Student 9 Student 10 Student 11 Student 12 At the beginning a small The rate of increase of No response change in height of the volume of water with the liquid causes a big change height decreases towards in the volume occupied by the half way mark and the liquid.at some point increases onwards up in the center of the sphere height increases it causes a small change in volume and a big change in height causes a small one in volume The height with respect to the volume flowing into the sphere is as above because the radius of the sphere varies, that is, it first increases, reaches maximum point then reduces. Since volume is directly proportional to the radius,as the height increases,the volume increases but slower than the height, but halfway, they are practically increasing at the same rate at which the volume is increasing is slower which gives me such a graph. The volume is increasing with each drop.at the beginning the height increases at almost the same rate with the volume as you get to the middle of the sphere the rate of increase in height is slow because the radius is big in the middle. towards the top the rate of increase in the height rises again because each drop occupies big volume due to its shape. Student 7 Student 8 Student 9 Student 10 Student 11 Student 12 The volume of the liquid The rate of the volume of The volume of the The height with respect to the The rate of increase in depends on the height at water with the height water in the cone is volume flowing into the cone as height is fast at the that points well as the increases exponentially directly proportional above because the radius of the beginning because the cross-section at that point to the height of the cone increases throughout. cone is narrow at the the graph is drawn the water in the cylinder Since volume is directly bottom so the volume is way to explain that the proportional to the radius then not very big halfway the volume of the cone does as height increases, volume also cone increase in volume not depend on the height increases but at a slower rate is bigger that increase in only but also on the crosssection due to the small radius but as height because the cone of the cone at that the level or height reaches is wide at the top so point. maximum the height and the each drop contributes volume are practically very little to increase in increasing at the same rate or height. volume might even be faster due to the maximum radius of the cone Its rate of shilling of volume into water is 100%will move upwards 182
195 A table showing the Mental Action (MA) levels (Table 2.2) is reintroduced here as a reference to an analysis of the findings (Carlson, Larsen & Lesh, 2001). Table 5.19: Images of Mental Actions portrayed in covariariton reasoning MA1 two variables changing simultaneously MA2 Shows loosely that the variables are changing with respect to each other (e.g., increasing, decreasing); MA3 an amount of change of one variable while considering changes in discrete amounts of the other variable; MA4 rate/slope for continuous intervals of the function MA5 continuously changing rate over the entire domain MA6 Increasing and decreasing rate over the entire domain. Taken from (Carlson, Larsen & Lesh, 2001). Although the five students graphical representations gave the appearance of evidence of student operating at the level of Mental Action 5 (MA5), (section 2.4.3), the explanations given were not consistent with this level of understanding. According to Carlson (2002), in (MA5) reasoning, the construction of an accurate curve is accompanied by a demonstration of an understanding of how the instantaneous rate of the quantity in question changes continuously over the entire domain. In the context of the bottle problem, this would mean evidence of a student s ability to coordinate the instantaneous rate-of-change of the height (in respect to volume) with changes in the volume (Carlson, 2002, p. 15). At this level of reasoning the student should be able to explain how and why the shapes of the curves (using shapes such as concave up, convex down, and the inflection points) link with a rate-of-change. A level 5 image is built up from a process containing elements of the lower level reasoning (MA1 MA4). With (MA1) reasoning, a student is able to match the height with changes in the volume. At the (MA2) level, this coordination includes a direction as well. The change in height increases or decreases with changes in the volume. A typical construction would be that of an increasing straight line (see figure 5.18) - Student 9 s construction. Representations of coordinations such as those referred to by Student 8 (figure 5.18) are said to be at the quantitative coordination level- (MA3). At this level, the student is able to connect and gauge the amount of the height of the flowing liquid with the amount of change of the volume. This occurs in addition to (MA1) and (MA2) reasoning. In their explanations, Students 7, 8 and 10 swapped the roles of the independent (volume) and dependent (height) variables. For example Student 7 states that: an increase in height of the liquid causes a change in volume. Student 8 s statement is as follows: The rate of increase of volume of water with the height 183
196 decreases Student 10 states: as the height of the water increases, the volume also increases. In all his explanations, Student 7 maintained this view while Student 10 switched back and forth from having the volume as either the independent or dependent variable. Student 8 s characterizations were ambiguous and difficult to interpret. Student 8, Student 10 and Student 11 s explanations can be pegged at the level Carlson et al., (2002) labelled the average rate level. These students demonstrated an awareness of the rate-of-change of the height as the volume changed. Student 10 responded: as the height of the water increases, the volume also increases at almost the same rate. Student 11: The rate of increase in height is fast at the beginning because the cone is narrow at the bottom so the volume is not very big. It is safe to conclude that none of the students explanations were at the MA5 reasoning level at this stage. The covariational reasoning abilities of these six students varied. One of the difficulties exposed was that of swapping the roles of the independent variable (volume) and the dependent variable (height) in the students explanations. Despite this shortcoming, most students seemed to have a sense of the general direction and amount of the change in the dependent variable with respect to the independent variable (MA2) and MA3 reasoning). They could also coordinate a general rate-of-change of height with changes in the volume. However, this coordination was not yet at a level that could pave the way for future abstraction to the development of an understanding of dynamic functional relationships concerning a flowing quantity. Students still required activities to help them develop images of smaller refinements of the average rate of change of a flowing quantity, in order to come to an understanding of an instantaneous rate-ofchange of the same quantity. The next activity endeavoured to steer the learning into that direction. (d) Task D, the derivative function. The responses to the first part of question 2(a) showed that some students had problems when shifting their reasoning from the real object to its representation (see table 5.20). For instance, Student 7 assigned a property of the graph to the object: The object moves with a positive gradient between to, the object has a gradient of zero at. I was surprised by the way the other five students reasoned with the rate-of-change interpretations. Like the participants in the first HLT, they all assumed that the rate-of-change was first 184
197 increasing and then decreasing, instead of the other way round. They, therefore, incorrectly deduced that the object accelerated before decelerating. Question 2a Table 5.20: Student responses to Task D, Q 2(a) - HLT 2 Student 7 Student 8 Student 9 Student 10 Student 11 Student 12 The object Between The rate-ofchange Increase (i)its Between moves with x=0 & of with increasing x=0 and a positive x=2.5 the the object is increase in (ii) its is x=2.5 its gradient rate-ofchange increasing displaceme stationary rate-of- between of steadily nt it is change is x=0 to object is between maximum increasing x=2.5 increasing. x=0 and (constant). At x = 2.5, the object -at x=2.5 x=2.5 the rate-ofchange has a the rate-ofchange The rate-of- is gradient of of change of constant zero at the object is the object is (0). x=2.5 constant zero at x= 2.5 Question 2b Student 7 Student 8 Student 9 Student 10 Student 11 Student 12 Yes, it is Yes from yes Between Yes from accelerating x=-1 to 2.5 x=0 and x=-1 to before it it is x=2.5, x=2.5 it gets to accelerating accelerating accelerates x=2.5 and from x=2.5, between and from decelerating to,6 it is x=2.5 and there on up after x=2.5 decelerating x=5, to x=6 it decelerating decelerating Only Student 10 realized the error and gave a correct answer to Q 2(b): It is accelerating between and and decelerating between and. None of the students referred to as an inflection point, the point where the rate-of-change changed from increasing to decreasing although they correctly assigned a zero value to it. I had asked the students how they would go about determining the rate-of-change at the point. The responses are shown in table Q3 Table 5.21: Student responses to Task D. 2(b) - HLT 2 Student 7 Student 8 Student 9 Student 10 Student 11 Student 12 We get the No gradient response function of f(x)by differentiating f(x)and then substituting in x=2 and the rate-of-change at x=2 is determined We can make a line from x=2 to the curve. At the point where the line meets the curve a tangent is drawn to it. The gradient of the tangent is obtained and that is the rate-ofchange of the function as in the diagram. We could use chord or secant of two points e.g. (2,8) -we could use tangent to that curve at x=2 -we could insert x=2 into the function s derivative More accurately you can use a point on the curve very close to the point x=2 and find the gradient of the Line joining the two points. To determine it exactly, you differentiate displacement to get velocity and substitute x with 2. We draw a line from x=2 to meet the curve.at that point we draw a tangent to curve its gradient is the rate-ofchange of the function (velocity) at that point 185
 at that point.")

198 Student 8 and Student 12 had mastered the graphical technique of finding a rate-ofchange. As an example, Student 12 s response was: We draw a line from to meet the curve. At that point, we draw a tangent to curve its gradient is the rate-ofchange of the function (velocity) at that point. Student 7, Student 10 and Student 11, on the other hand, felt that a differentiation process had to precede the determination of a rate-of-change. Student 7: We get the gradient function of by differentiating and then substituting in and the rate-of-change at. Student 10: we could insert into the function s derivative. Student 11: To determine it exactly, you differentiate displacement to get velocity and substitute with. In the accompanying notes, I emphasized that a better estimate could be achieved if the average rate-of-change was calculated over a small interval and attempted to direct the discussion into a definition for the value of a derivative at point on a curve. Students were asked to sketch a velocity graph from a position graph in Q5. As examples, Student 8 and Student 12 sketched similar graphs which did not appear to be consistent with the reasoning they had put forward in question 2(a). The shape of the first part was correct, the second part was not. The other students did not answer this part except Student 10 who produced an appropriate velocity-time graph (see figure 5.19). Figure 5.19: Students 8, 12 & 10 s velocity sketches, task D, Q5 HLT2 186
199 Three responses to the revision question in which the students were asked to determine a derivative from graphical information are shown in table All the three students were able to calculate the derivative just read off the value of type of calculation to determine. f (5) = f '(5)dx = 0.4 f (5) = 2x 5. None of them could directly from the graph. They felt a need to perform some Table 5.22: Student responses to Task D, Q 6(f) - HLT 2 Student 12 Student 9 Student 10 f '(5) = = 2 5 = 0.4 f '(5) = y x = = 2 y 5 I arrived at my answer by finding the change in y and y = mx + c dividing it by the change in x. 4 = c x = = 2 5 Taking points (5,4) and (0,2) 4 2 = c c = 2 y = 2 5 x + c 5y = 2x + 10 or y = 2 5 x + c f (5) = = 4 f '(5) = 2 5 In one of the revision activities, I asked the students to define the derivative concept again. I compared their original definitions with the current ones to see if there was any shifts in their descriptions (see table 5.23). Table 5.23: Student derivative definitions - HLT 2 Student 7 Student 8 Student 9 Student 10 Student 11 Student 12 Original definitions Current definitions A derivative is a result got after differentiat ing a given function Is a task that gets an expression out if a function and makes that function an expression.the derivative will act as a connection between the two functions Derivative is a mathematic al equation or constant obtained after differentiati ng Derivative is something from which something else comes originates that is ie: its derived from something The derivative is the differential coefficient of eg: y with respect to x. the one you get after differentiati on is the derivative. Its a function or constant obtained from differentiati ng a previous function one or more times. Student 7 Student 8 Student 9 Student 10 Student 11 Student 12 A Derivative Its A derivative is a something derivative is is a term mathematic from which the value that is got al equation something you get after obtained else comes after differentiat after or differentiati ing a differentiati originates on. function ng another function. Its a task that gets an expression out of a function and the found expression can stand as a function on its own, its also a connection between the two functions. It is an expression from differentiati ng a previous function one or more times and constant as a function on its own 187
 and the derivative (slope of the tangent line) (table 5.24).")
200 There were no observable shifts in the definitions before and after exposure to the Calculus activities. On their mobile phones, the students were tasked with differentiating between graphical representations of the difference quotient (slope) and the derivative (slope of the tangent line) (table 5.24). Table 5.24: Student difference quotient/derivative definitions - HLT 2 What does the slope such as PQ represent about this function? What does the slope of the tangent line to the graph at a point represent? (for instance at P?) What does the slope such as PQ represent about a function? What does the slope of the tangent line to the graph at appoint represent ( for instance at P?) Student 7 Student 8 Student 9 Student 10 Student 11 Student 12 Slope p q It represents No response It represents. It It represents represents a a positive the rate-ofchange represents the gradient secant of gradient of the the (positive) f(x)and also the function function derivative of between the rate-ofchange between p between the function points p and of and q points p and q y=f(x)from a q and it to b gives the gradient of the slope p It represents the rate-ofchange of y=f(x) at a specific point,p. It represents the positive rate-ofchange of the function at the point p. The slope of the tangent to the graph at p represents the gradient of the graph at a. q. It represents the rate-ofchange of the function at point p. The value of the derivative at that point It represents a positive rate-ofchange of f(x) at point p I expected them to distinguish between the average and instantaneous rate-ofchange in their definitions. Student 7, 8, 10 and 12 s definitions inferred that distinction to some extent. Student 11 s response is a common interpretation of the difference quotient: It represents the derivative of the function. Some students tend to think of the difference quotient as the derivative and employ it to think about how fast the function is changing with no reference to an amount of change in one quantity in relation to a change in another. 188
201 My attempts at guiding the students into developing images of smaller refinements of the average rate change in order to come to an understanding of an instantaneous rate-of-change in a familiar context of graphing motion did not quite succeed. I had hoped that strengthening the students grip of a graphical representation of the derivative would make the introduction to a symbolic representation of the derivativeintegral relationship easier. I needed to explore the integral component of the relationship with the students. (e) Task E, the area function. Student responses to the three activities involving the area function are shown in a) the area function ( table 5.25); b) of a graphical illustration showing that the derivative of an area function is the original function ( table 5.26); and c) student understanding of the FTC relationship (table 5.27). Table 5.25: Student definitions of the area function A(x) Student 7 Student 8 Student 9 Student 10 Student 11 Student 12 Question 7a A(x) means the total area covered by a curve f(t) within the interval [a,x] It is the function used to find the area under a curve from points a to x. The area of the curve from x=a to x=b is equal to the integration of the function of the curve f(t) with respect to t. substitute in the limits x=a and x=b after obtaining the integrated function It means that the area function is equal to the summation of the elements whose product is f(t) and equal widths of d(t) between the limits of a to x The area under the curve with a function f(t) between the limits a and x. It is used to find the approximat e area enclosed under the function f(t) between points a and x Student definitions of the area function were acceptable, with Student 10 s definition standing out. S/he seemed to be able to link the area function with its measure, a summation of elements whose product is and equal widths of between the limits of to. In a subsequent task, students were asked to show that the derivative of an area function was equal to the original function using a graphical inscription. See table 5.26 for their responses. The intention was to use students solutions as settings for a discussion about the Fundamental Theorem of Calculus. I followed their derivations with a normal textbook discussion similar to that of Ostebee & Zorn (2002) (section 2.3.2). 189
202 Most students applied the required mathematical formulae. For example, Student 10 tried to show that proceeding from left to right or vice versa produced the same result. Still, I was doubtful about the extent to which this exercise led students to see the derivative and the integral as rough inverses of each other. d [ dx A(x) ]= d x 2 2 = 2x dx 2 = x d [ dx A(x) ]= x = f (x) Table 5.26: Differentiating the area function, HLT 2 Student 9 Student 7 Student x d from the graph A( x)[area] = x. x so A( x) = [A(x)] = f (x) 2 2 dx A = 1 x 1 2 xbxh 2 = x but A(x) = 2 f (x)dx a = 1 x2.x.x = d [ A ( x )] = f ( x ) dx d x 2 2 dx f (x)dx d 2x (A(x)) = a 2 dx 2 = x d x = f ( x) = f (x) dx 2 d [ dx A(x) ]= f (x) 2 1 d 2x = f ( x) dx 2 x = f ( x) but f ( x) = x x = x Student 11 Student 10 Student 8 A(x) = 1 x2 x.x = A(x) = x.x 2 = from the graph x A = 1 f (x) = x A(x) = x2 2 xbxh 2 d [ dx A(x) x2 1 ]= 2. 2 = x = f (x) x d f (x)dx dx where f (x)dx = x.x = x2 2 x d x 2 dx = d x dx 6 x3 + c 0 d 1 dx 6 x3 = x3 1 = x2 2 but x2 2 = A(x) d [ dx A(x) ]= f (x) for A(x) = 1 x2.x.x = 2 2 d [ dx A(x) 2x2 1 ]= 2 = 2x 2 = x d [ dx A(x) ]= x and since f (x) = x d [ dx A(x) ]= f (x) Two follow-up questions were given at the end of the last activity. Of particular interest, was the activity involving a graphical interpretation and understanding of the FTC (figure 5.15c). I have included student responses to one of these questions (Q 11), (table 5.27). Responses to this question showed that students found the coordination of images involved in understanding an accumulating quantity difficult to master. The fact that I forgot to label the vertical axis to show students where the 0 mark was placed could have contributed to student misinterpretation of the question. Still, I was able make some inferences from the way students engaged with the question. As an example, for part (a), Student 7, Student 12 and Student 8 read off the values directly from the graph. They did not recognize that the curve represented a rate-of- 190
203 change. Student 9 seemed to have just guessed a value (600 litres) for the answer (see table 5.27). Table 5.27: Student responses to Task E, revision question 11- HLT 2 Student 9 Student 7 Student 12 Student 10 Student 8 Student 11 (a) How much water was in the tank at noon? 600l No water There was no water in the tank 1200l 0 litres No response x (b) What is the meaning of g(x) = f (t)dt? 0 Integrate the function f(t) with respect to dt and substitute in the integrals from 0 to x g(x) stands for the total area under the curve f(t) with the limits 0 and x g(x) is equal to the integral if f(t) between 0 and x with respect to t The summation of the amount of water in the tank at a given time t The function g(x) equals the integration of the function f(t) from values of 0 to x with respect to t. No response (c) What is the value g(9)? g(x) = f (t)dt g(9) = f (t)dt = [ f (t)] 0 g(9) = f (t)dt f (t)dt + 0 f (t)dt + f (t)dt g(9) = f (t)dt No response 0 = t c 0 = = 4.5 = f (t) 0 [ ] 9 0 = t 2 2 = = =600l (d) During what intervals of time was the water level decreasing? 10.30am 11am and midday Between 9 am and noon Between 9 am and noon Between noon 12:00 and 3 pm = f (t) 0 [ ] 9 0 = t 2 2 = = am to 12 non No response (e) At what time was the tank the fullest? 9 am 9 am and 6 am 6 pm At noon At 6 pm No response Student 10 appeared to have the correct reasoning even though his/her processing (calculation methods) could still be refined. Student 10 interpreted the value of the integral as a rate. i.e.. The amount of water at noon became ( ), (which is the correct graphical interpretation) (figure 5.20), and was processed uniquely. Student 10 multiplied each rate portion with the time interval to obtain the accumulated amount of water. S/he employed the appropriate reasoning. Student 10 s interpretation was consistent with the type of reasoning I was trying to promote. The definition s/he employed linked the accumulation function with some type of measure. It read: The summation of the amount of water in the tank at a given time t, but still required additional guidance to appropriate the correct substitution and calculation methods with the desired type of reasoning. In other words, Student 10 was on a path to developing the desired type of reasoning with incorrect substitutions. It is this stage, where instruction design strategies for linking a student s way of thinking with 191
 to calculate a value of. All the students seemed to be able to identify the intervals in which the water level was decreasing.")
 whose instruction read: Figure 5.")
204 appropriate reasoning and formal calculation are required. This stage is difficult to design for. For some reason, Student 9, Student 12 and Student 8 used a value of in their response to part (c). Student 10 applied the same reasoning s/he had used in part (a) to calculate a value of. All the students seemed to be able to identify the intervals in which the water level was decreasing. Only Student 10 could figure out the time when the tank was fullest. On the whole, student definitions for were largely definitions of expressions devoid of any real meaning. Figure 5.20 is Student 10 s response to the last part (f) whose instruction read: Figure 5.20: Student 10 s response to Q11 (f)- HLT 2 It would appear from the findings that the designed learning tasks were not evoking the kind of reasoning required for bringing about an understanding of the accumulation function. Each learning task had revealed specific student difficulties, but the tasks themselves were not forming a coherent trajectory. This would have to be addressed in the last HLT. The next section is a summary of findings from the semi- structured interviews Analysis of student interviews In order to probe students understanding, the experienced teacher/tutor conducted semi structured interviews with three students: Individual student responses were categorised as excerpts which were arranged according to the order in which the students were interviewed (see table 5.28). 192
205 Table 5.28: Excerpts of student interview responses Excerpt no Student Identification 1 Student 11 2 Student 10 3 Student 9 The interviews occurred in 4 parts, where each part was related to the various tasks appearing in the workbook. Task 1 was the speed versus time (zebra and cheetah task); Task 2 was the water problem; Task 3 was the derivative task, and Task 4 was on Area and the Fundamental Theorem of Calculus. For each excerpt, the line numbers were sequentially numbered from 1 upwards. The next sections are summaries of the findings. (a) Task 1, speed versus time. In this task, the students were supposed to compare the motion of each of the animals graphically.for the speed versus time Task 1 - involving the zebra and the cheetah, Student 11 focused on the distance covered by the two animals to provide an indication of whether the cheetah caught the zebra. His/Her reasoning was based on her seeing a direct correlation between speed and distance covered the - greater the speed, the greater the distance covered. Student 11 relied on his/her knowledge of the physics equation to construct the curves. The interview responses were consistent with what s/he had already indicated in the workbook. A difficulty s/he experienced was separating the actual phenomenon aspects from their graphical representational counterparts in her reasoning (see, line 8). Student 11 (excerpt 1). 1. Tutor: Could you tell me what the word speed means to you? 2 Student 11: Speed is the distance travelled in the given time. 3. Tutor: I would like for you to tell me how you arrived at your answer in this task. 4. Student 11: I think the cheetah will catch the zebra from what I have calculated after 42 sec. The cheetah would have travelled approximately km and the zebra km the distance between them is 0.07km but since I was using 100km/h for the speed of cheetah, so that means the cheetah would have caught the zebra since it would be travelling at a higher speed. 5. Tutor: Please give an explanation for your answer in 1b. 6. Student 11: The particular distance covered by the cheetah will be km. I got this answer from formula distance versus time from the second law of motion; the distance covered by the zebra is km using the formula distance =speed multiplied by time. 7. Tutor: What does the area under the speed versus time graph tell you about this function its 1 and 2? 8. Student 11: According to the graph, I know that the area divided by the speed multiplied by time shows the distance covered by a moving object and the given time by the given speed. 193
206 As excerpt 2 indicates, Student 10 used the information given to construct a curve for each of the animals. Student 10 s response to task 1 suggests an image of a unified distance/time = speed entity. However, the reason given for the cheetah catching the zebra is a bit flawed. Student 10 s view was that at the point the cheetah catches the zebra, both animals have the same speed, which to the student meant that at that point, the animals had covered the same distance in the same time interval (line 6). Student 10 s interpretation of the area under the velocity-distance time curve representing the distance was correct. Student 10 (excerpt 2). 3. Tutor: Explain how you arrived at your answer in question 1a and b? 4. Student 10: First of all we are given the distance between the cheetah and the zebra I drew a graph. I was able to see that the cheetah was sleeping when the zebra was moving so what happened was the cheetah catches the zebra because the time taken for the cheetah and it gets tired 5. Tutor: Please give an explanation for your answer in 1b? 6. Student 10: At the point where the cheetah catches the zebra, the time taken is the same and they are at the same distance from the starting point 7. Tutor: What is the area under the speed versus time graph tell you about this function its 1 and 2? 8. Student 10: The shaded area in the graph is actually means the distance covered by the cheetah and the other side covered by the zebra. In her response in excerpt 3, Student 9 admitted she could not work out a solution for question 1(b) of task A. Student 9 knew what the area under the v-t graph represented (line 8), but was unable to construct her own interpretation of the situation. Student 9 s definition of speed as a rate of distance points to a deficiency either in reasoning or language. Student 9 (excerpt 3). 1. Tutor: Could you tell me what the word speed means to you? 2. Student 9: The rate of distance covered by a moving body with time 3. Tutor: I would like for you to tell me how you arrived at your answer? 4. Student 9: Actually I didn t get an answer as I didn t understand. [ ] 7. Tutor: What does the area under the speed versus time graph tell you about this function its 1 and 2? 8. Student 9: the area under the speed versus time graph was supposed to represent the distance covered by the cheetah and the zebra respectively (b) Task 2, the water problem. This task had two situations requiring students to coordinate changes in the dependent variable (height) with changes in the independent variable (volume). In the first situation, they had to draw graphs of how the height in each of the different containers (cylinder, sphere, and cone) varied with the accumulating volume. In the second situation, they were required to draw a graph of 194
207 height versus volume for water flowing into a bottle with a spherical bottom and a cylindrical top. At first, Student 11 s response suggests that there is some degree of confusion when s/he refers to the cone as seemingly being filled up faster, while all the containers are being filled up at the same time (line 12-16). Later on, Student 11 makes the distinction between the independent and dependent variable rates of change by referring to first, the speed at which the containers are filling up, and then the water rising (line 18). Student 11 (excerpt 1) Task 2 the water problem Tutor: Which container fills up the fastest and why? 12. Student 11: I think the cone will seem to fill up faster because it s narrow `at the bottom but so it will simply fill up faster but they will all be filled up at the same time. 13. Tutor: Why do you say that? 14. Student 11: Because the rate-of-change of height for the cone will seem to be higher at first then for the other containers 15. Tutor: Why do you say the containers will fill up at the same time? 16. Student 11: I think the containers will fill up at the same time because they told us the capacity is the same [ ] 19, Tutor: Explain in your own words the graph you have drawn? Student 11: As for the cylinder, the volume of the water flowing into the cylinder increases, the height increases proportionally since the shape is uniform the graph is like that because the change in height is directly proportional to change in volume. For the sphere, the volume is increasing with each drop at the beginning the height increases at almost the same rate with the volume, as you get to the middle the rate increases in height is slow because the radius is big in the middle towards the top the rate of increase in height rises again because each drop occupies a big volume to its shape. For the cone, the rate of increase in height is fast at the beginning because the cone is narrow at the bottom so the volume is not increasing very fast halfway the cone increase in volume is bigger than the increase in height because the cone is wide at the top so each drop contributes very little to increase in height. 20. Tutor: Did you have any problems completing question 6? 21. Student 11: No It is clear from excerpt 1 (Task 2) that Student 11 could coordinate images of rate-ofchange of volume with those of a rate-of-change of height (line 19). This reasoning is consistent with (MA4) reasoning (where one is able to coordinate images of rates of change of the dependent and independent variables). This observation was not so apparent from the workbook. Student 10 made the distinction between the rate-of-change of volume and rate-ofchange of height. However, in Student 10 s argument, it is the rate-of-change of the dependent variable (height) influencing the rate-of-change of the independent variable (volume). Other than that, Student 10 maintains the same type of reasoning in the 195
208 workbook, which can be pegged at (MA4) as it involves a comparison of rates of change. Student 10 (excerpt 1) Task 2 the water problem [ ] 11. Tutor: Which container fills up faster and why? 12. Student 10: The containers are filling up at the same time because the water that was poured in the same time was adjacent to 1ltr per minute 13. Tutor: Why do you say that? 14. Student 10: The capacities of the containers are the same 15. Tutor: Which container will fill up the slowest? 16. Student 10: I think the sphere because at some point its radius in the window will increase [ ] 19. Tutor: Explain in your own words the graphs you have drawn? 20. Student 10: As for the cylinder the height with respect to the volume flowing into the cylinder is as above because the radius of the cylinder is constant, since volume is directly proportional to the radius of the cylinder that means the height of the water increases at almost the same rate, therefore, giving the graph a line passing through the origin. For the sphere, the height with respect to the volume flowing into the sphere is as above the radius of the sphere varies that is it first increases, reaches maximum then decreases, since volume is directly proportional to radius as the height increases the volume increases but slower, than the height but halfway they are all increasing at the same rate since radius is maximum. For the cones the change in height with respect to the volume flowing into the cone is as above because it s radius increases throughout, since volume is directly proportional to the radius then as the height increases, the volume also increases but at a slower rate due to the small radius but as the level or height reaches maximum, the height and volume are increasing at the same rate or volume might even be fast due to the maximum radius of the cone. 21. Tutor: Did you have any problems completing question 6? 22. Student 10: yes it s a little bit tricky I need to understand how the whole thing works Student 9 displayed (MA2) reasoning which remains at the level of recognizing that there is a direct correlation between the height and the volume, but does not go beyond that point (line 9, excerpt 3 Task 2). Student 9 s responses corresponded with the straight-line graphs s/he drew in the workbook. Student 9 (excerpt 1) Task 2 the water problem [ ] Tutor: Explain in your own words the graph you have drawn? 19. Student 9: The cylinder has a straight line graph passing through the origin, the graph is a height vs volume graph, the height being directly proportional to the volume. As the height increases, the volume in the container also increases. The cone it s a volume vs height graph; as the volume of the water increase, the height also increases so it s also a straight line graph. The volume of the water in the cone is directly proportional to the height of the cone. The sphere no graph 20. Tutor: Did you have any problems completing question 6? 21. Student 9: no I didn t it was actually my best exercise throughout the book. 196
209 (c) Task 3, the derivative function. Getting the students to think about the derivative in terms of the different quotient was fraught with instructional challenges. The aim of the first part of task 3 was to get the students to develop an image of a constant interest rate as a change in interest divided by a change in time, and then to transfer that information to draw an interest rate (constant) versus time graph. Student 11 seemed to have the correct interpretation, while Student 10 was unsure and Student 9 still maintained the direct proportion (MA2) reasoning (see excerpts 1,2 & 3) on the interest rate. Excerpts 1, 2 & 3 on the interest rate Tutor (Question1) - in your own words, explain how you took the interest rate versus interest and the interest versus time graph? Excerpt 1 ( Student 11) Excerpt 2 ( Student 10) Excerpt 3 ( Student 9) 23. Student 11: The interest versus time graph I drew a straight line I consider origin because the interest keeps on increasing with time. I have the interest rate constant as interest increases. 24. Student 10: I am not sure 22. Student 9: I will start with the interest versus time graph. The interest is directly proportional to time. Even though time passes the interest rate remains constants so I have a straight line graph. Despite exposure to different representations of the derivative, Student 11, 10, and 9, preserved the original definitions of the derivative they held before participating in this learning experience and did not seem to shift their reasoning (see excerpts 1, 2 & 3 ) on the derivative. Excerpts 1, 2 & 3 on the derivative Tutor: For Question 2b, could you explain in your own words what the term derivative means? Excerpt 1 ( Student 11) Excerpt 2 ( Student 10) Excerpt 3 ( Student 9) 27. Student 11: A derivative is the value you get after differentiation relative functions 28. Student 10: It s something you derive from something 26. Student 9: It is a function you find after differentiating a curve, or another function. Students conceptions of the derivative function appeared vague and unclear. Excerpts 1, 2 & 3 illustrated how the students were still uncertain about what the function and variable concepts signified. 197
210 Excerpts 1, 2 & 3 on the derivative function Tutor: What does the term derivative function mean? Excerpt 1 ( Student 11) Excerpt 2 ( Student 10) Excerpt 3 ( Student 9) 29. Student 11: It s a function that can be broken down into small variables. 30. Student 10: A derivative function is like a quantity whose value will depend on other values eg: x 28. Student 9: It is a variable that is obtained after differentiating certain equations. All three students found curve sketching and curve interpretation difficult to handle (see excerpts 1, 2 & 3) on what students found difficult. It appears curve sketching is an area which needs to be addressed more systematically. Excerpts 1, 2 & 3 on what students found difficult Tutor: Was there any task you found difficult to complete? Excerpt 1 ( Student 11) Excerpt 2 ( Student 10) Excerpt 3 ( Student 9) 31.. Student 11: Yes, the graphs because I failed to interpret the graphs 32. Student 10: Yes, question 5 the graphs on velocity and q6 that I was confused about. I needed some more information or details on specific topics 30. Student 9: Yes there was it was an exercise telling us to sketch a velocity vs time graph. (d) Task 4, area and the FTC. In this final task the tutor explored and probed student comprehension of the integral and interpretation of the first part of the Fundamental Theorem. Student 10 and Student 9 s responses relate to an area, while Student 11 s response conveyed an images of small entities (what Student 11 calls variables) being added up. All responses conveyed a process conception of the integral but the aspects and elements constituting this process are not very clear (see excerpts 1, 2, and 3 on task 4 the area function). Excerpts 1, 2 & 3 on Task 4, area and the FTC Tutor: Questions 1-6 are designed to introduce you to the concept of integral briefly explain in your own words what the term integral means? Excerpt 1 ( Student 11) Excerpt 2 ( Student 10) Excerpt 3 ( Student 9) 32. Student 11: Integral is what you get after the small variables in a function are added. 34. Student 10: An integral is generally the formation of area of a function 33 Student 9:It is the summation of the area of a curve 198
211 Students responses to the definition of an integral function exposed varied conceptions (see excerpts 1, 2 & 3, task 4 b). Student 11 gave the normal expression of an are under the curve, Student 10 had an image of an object filling up by adding up variables while Student 9 provided a symbol-speak description of a process of manipulating numbers. The students definitions for the integral were slightly different from those of the integrals function. Excerpts 1, 2 & 3 on Task 4b, the integral function Tutor: What is an integral function? Excerpt 1 ( Student 11) Excerpt 2 ( Student 10) Excerpt 3 ( Student 9) 36. Student 11: The area under the curve f(x) between the limits a and x 34. Student 10: A small element or variable that will fill up an area of a function and integrates what is the sufficient of the variable 35 Student 9:We have a function raised to a power and then divide it to the power it has been raised to The aim of the last part of the interview was to establish student interpretations of the first part of the Fundamental Theorem of Calculus, which points to a relation between the rate-of-change of the accumulation function and the original function. Students explanations of what the expression in equation 5.1 meant are given in excerpt 2 & 3 - Task 4. Student 10 s definition involved the summation of products of f (t) and dt. Student 9 s definition was a description of what one does to obtain the area function. Excerpts 1, 2 & 3 on Task 4 - area and the FTC integral function Tutor: Look at the graph from question 7 and explain in your own words what that expression means? x d The expression was f () t dt = f ( x) dx 0 Excerpt 1 ( Student 11) Excerpt 2 ( Student 10) Excerpt 3 ( Student 9) No response 38. Student 10: It means that the area function is equal to the summation of the small elements product is f(t) and equal widths of dt between the limits of a to x. 36. Student 9: The area of the curve from x=a to x=x is equal to the integration of the function of the curve f (t) with respect to t. substitute in the limits x=a and x=x after obtaining the integrated function. 199
212 Further probing revealed that Student 11 had developed an image of a process of differentiation which involved dissociating variables within a function, while integration entailed integrating. It appeared that Student 11 was on the way to building the required conceptual understanding of the derivative-integral relationship. Student 10 had no response to this last question while Student 9 was able to somehow deduce that differentiation and integration were inverses of each other (see excerpt 1, 2 &3 on task 4d). Student 11 (excerpt 1), task 4(d) -Area and the Fundamental Theorem of Calculus 37. x d d Tutor: Why do we say that f ( t) dt and [ A( x) ] f ( x)? dx = dx 0 [ ] 38. It s the opposite of integration so if I break down the function and then I am summing up the variables again like I am using the same function. 39. Tutor: Does this make sense to you? 40. Yes 41. Tutor: In your own words explain this? 42. Student 11: If x I have a function f(x)and I am supposed to disassociate it that means I am breaking it into small variables and if I am supposed to integrate it that means I am summing it up to get the same function I had at the beginning Student 10 (excerpt 2), task 4(d) -Area and the Fundamental Theorem of Calculus 39. x d d Tutor: Why do we say that f ( t) dt and [ A( x) ] f ( x)? dx = dx Student 10: no answer 41. Tutor: Does it make sense to you in your own words explain it? 42. Student 10: no answer. Student 9 (excerpt 3), task 4(d) -Area and the Fundamental Theorem of Calculus 39. x d d Tutor: Why do we say that f ( t) dt and [ A( x) ] f ( x)? dx =? dx Student 9: Differentiating is the opposite of integration and when we differentiate we are changing a function with respect to a variable integrate it that means I am summing it up to get the same function I had at the beginning. These excerpts are particularly interesting in that they distinguish between two student, namely Student 9 and Student 10. The more analytical Student 10 did not say much while Student 9 who had exhibited problems with reasoning using text appeared to have reasoning tendencies close to those in the planned trajectory. In the next section, I report on the post text and evaluation activity before analyzing the second HLT. 200
213 Responses to the post-test (Task F) and evaluation task The results from the post-test did not yield any useful insights as these groups of students duplicated their answers from the pre-test. In the next section, I present some of the views expressed from the evaluation. In response to whether the unit helped the students to understand Calculus better, Student 7 replied I got to understand Calculus a little better, Student 8 s reply was Definitely, and Student 10 said, Yes, it did very well. As to the usefulness of the unit for preparation for a formal Calculus course, each student had a different response. For instance, student 8 felt that this exercise extended learning: They were kind of reminding me of the things I don t usually read and they were even showing me things our teacher never taught us and Student 12: They were relevant and educational as well I did learn a few things and polished up on some old stuff too. Some students felt that they were exposed to new concepts like Student 11 who remarked: I have learnt some new concepts like the Riemann sums. Others appreciated the activities: Student 9: it s a new learning experience; the activities helped me to understand much better. Student 10: I think it s very good because these activities help you understand the depths of all these Calculus topics. The most beneficial activities to the students were the zebra and cheetah, and the water problem. Student 8: The zebra and cheetah piece, and also the water problems. I used my brain because you can t get such a thing from a textbook or exercise book. Student 12: The water part helped me opened up as well as the zebra-cheetah dilemma even though I am not sure about my answers. Student 11 valued the graphs: The graphs because we haven t done a lot of them leave alone maximum and minimum graphs. Student 10 appreciated the opportunities for reasoning: I think everything was beneficial but mostly the activity of b which needed reasoning which was interesting. Student 9 found differentiation easier to handle after the exposure: I found task d more beneficial because I used to have a problem with differentiating; it was my hardest topic but now I find it much easier to deal with. Student 11 did not see the value of the graphs: The graphing topic I just feel it was the least beneficial. Student 12 felt that dealing with the differentiation and integration of small functions was not beneficial as they had already done a lot of similar exercises: Finding derivatives about integral values of small functions like x 3 +4x 2 +x because we have done a lot of them, a lot. The students did not experience any particular problems when relating to the few mobile activities they had exposure to. Student 7: No there were no particular 201
214 problems, Student 9: It was quite easy and very interesting; there weren t any particular problems. Student 11: It was easy and definitely no problems. The only shortcoming seemed to be the delay in responding to student queries as expressed by Student 10: It would not be difficult. In fact, I adapted to it easily only that the timing, and Student 8: It is okay because I had to text and the problem is that the replies kind off delay. Student 12 pointed to an important value for using the cell phone for teaching: The mobile phone did come in handy. I could text my friends if I got stuck somewhere except for the fact that some things are better explained in person. The belief that concepts are better explained in a face-to-face environment was upheld as indicated in Student 7 s remark: I feel one gets to understand the concept better while in physical (having a teacher) but I don t mind the mobile learning. In general, students were ready to use mobile learning but pointed out to three hindrances. These included the presentation of graphs by Student 9: may be the graph being sent over phone, because some phones are not compatible for such graphs. Another concern was the cost of delivery from Student 10: I think math needs a lot of understanding which would require a lot of time on the phone and that becomes expensive. Student 12 pointed out the technological impediments related to the stability network problems and mobile phone ability to handle mathematical symbols: it was tough sometimes with network problems and then the integral and other signs which you can t get over the phone. Students had a number of recommendations for improving the unit. One of the student s recommendations was that the course be put online. Student 9: If we could use the internet much more often than the course would be much better. Student 10: I think another way of doing this apart from using a phone could be using a web cam only that it s very costly. With the online/mobile component, Student 8 felt it was important to keep track of what the students were doing. Student 8: I appreciate the online course because it is really nice and I would also recommend that you always keep track of your students maybe if someone did the work on the phone itself it would be much better. Student 11 felt the provision of textbooks was important: OK maybe it s not possible but providing some textbooks you can refer to for help. Student 12, on the other hand, was for less paper as he felt intimidated by the text. He was also of the opinion that the intention of the programme had not been clearly spelt out. Student 12 s comment : I d suggest less paper and more mobile next time. The pamphlets did look scary at first also decide if it s a teaching or evaluation programme or maybe both. The overall student experience of the course was positive as expressed in the following comments: Student 8: The program is very beneficial to us students whom 202
215 have problems in various topics and I really appreciate, I also urge you to continue. Student 9: I have had a very good learning experience, has been very interesting since I have got an opportunity to use my phone more often more so the program has made me a better mathematical student. Student 10: This has been a very nice experience and I feel privileged to have taken part of it. All I say thanks and I think it s a good project and with team work, co-operation and financial support of the programme it would be a great success. Student 11: My experience was good. I have learnt a lot so many thanks. Student 12: It was real nice taking part in this course I've probably benefited more from it and it d be okay to participate in another one if it s availed Analysis of the second HLT The analysis of student responses to the selected activities pointed towards marked difficulties students faced when constructing images of the derivative-integral relationship. The convergences of difficulties had to do with the underlying formation of an appropriate image of the function concept. The designed learning activities did not sufficiently convey the idea of a function as a unit capable of accepting variable inputs, with the objective of transforming them into outputs. It was therefore difficult for the students to build a coherent understanding of the relation between the inputs and the outputs of a function. The other main difficulty had to do with the creation of stable images of an average rate-of-change in which the covariation of two changing quantities could be constituted. This created stumbling blocks when students had to coordinate the process of changes in one variable with another. It was difficult for students to build for themselves systems for expressing the average rate-of-change leading into an understanding of the instantaneous rate-of-change. Generally, students had particular problems differentiating between the dependent and independent variables. A final source of difficulty was that of having students visualize an accumulating quantity as composed of a multiplicative structure, and letting them see that the accrual of the products of this multiplicative structure could be represented as an area under the curve. At a later stage, it would have been possible for students to coordinate the accumulation of a function s input variable with the accretion of instantaneous rate-ofchange of the function within a fixed time interval (starting from a fixed number to a specified number).the major hurdle remained that of giving students the opportunity to sufficiently operate in the world of physical objects, and then afterwards to transfer the observations and experiences gained into the world of mathematics. 203
216 Development of the mathematical notation together with their assigned meanings is no simple matter. This is where an input of the RME-that of co-developing concept and symbol meaning concurrently-should feature. The problem is that students are accustomed to accepting mathematical notations on a surface level without seeking to understand the underlying meanings. The problem cannot be solely addressed by reformatting the instructional design. Students also need to change their orientation towards learning mathematics in order to grapple with the key connections and patterns required to make sense of the Fundamental Theorem of Calculus. In the first and second HLT s, transition from one phase to another had not occurred smoothly. These observations were carried into the third trajectory The Third Leaning Trajectory This section describes the last HLT. This trajectory consisted of four learning activities which were also preceded by a pre-test and followed by a post test and evaluation activity. The activities are presented in Appendix D. Broadly speaking, these activities were revisions of the first and the second learning trajectories. A list of major learning tasks appears in Table 4.5. In terms of RME language, the main organizing activity was curve sketching, in a context where the distance accumulated and speed of a moving object were linked to the derivative and integral relationship. The zebra and cheetah motion (activity 1) served as both a situational and referential activity, necessitating students to determine the distance covered by the two animals. The anticipation was that this would potentially provide an initial model of a physical and mental format of the motion problem. The Rate-of-change Function (activity 2) of a moving ball hitting the wall and the accumulation function (activity 3) were general activities. These activities were meant to provide a platform for helping students to develop a better understanding of the derivative as a function s rate-of-change, and accumulation as a representation of the integral. The problems used were supposed to serve as sources from which models-for working with the derivative -integral relationship could be developed. The last-activity 4 was the formal activity in which students would use conventional notation to represent and reason about the integral-derivative relationship appearing in the FTC. The anticipation was that this would occur in a manner that reflected covariation reasoning and an understanding of the reciprocal nature of this derivative-integral relationship. Analysis of the second HLT had revealed that students had difficulties forming appropriate images of the function concept. In this last HLT, my aim was to try 204
217 and move students toward developing a view of Calculus in terms of the basic concepts the derivative and the integral-as a function-pair right from the outset (see table 5.21). This idea was borrowed from Professor Gilbert Strang s (2002) Highlight to Calculus videos available at the Massachusetts Institute of Technology (MIT) open source website: Calculus/highlights-of-Calculus-5-videos/. Three of Professor Strang s videos formed part of the learning sequence. These included the following titles: Big Picture of Calculus (37 minutes); Big Picture of derivatives (30 minutes); and Big Picture: Integrals (37 minutes). Professor Strang is a mathematics professor at MIT who introduces the derivative-integral relationship in a manner I found appropriate for enriching this introductory Calculus unit. I was particularly interested in the way he used graphs to introduce the two Calculus concepts. Strang (2002) presents Calculus as a mathematical entity that connects function-pairs. Function (2) is an indication of how quickly function (1) is changing. Table 5.29 shows examples of two function pairs; the first pair being distance travelled and speed, while the second pair joins the height of the graph and slope of the graph. Table 5.29: A function pair Function (1) Function (2) Distance travelled = s(t) Speed =v(t) Height of graph y(x) Slope of the graph = dy/dx The idea was to have students realize that once the first part of the pair (the derivative or rate-of-change) was determined through a process of differentiation, the original function could be recovered through an inverse process of integration in activity 1. Activity 2 was supposed to engage students in coming to describe the covariation between the independent variable and the rate-of-change of the dependent variable, while activity 3 sought to assist students in developing the concept of integration by attempting to recover the original function. In the last activity 4, students were meant to come to conceive differentiation as the inverse of integration. My reasoning was that presenting the derivative and integral functions as a functionpair would make the development of an operational conception of their relationship easier. By an operational conception of the derivative-integral, I refer to images of rateof-change, accumulation and rate of accumulation that would develop into the expression of the first part of the Fundamental Theorem (Thompson, 1994). Unfortunately, for this project, the three participating students were not able to access the videos as planned because of the additional cost for mobile internet access they 205
218 would have had to incur. I suggest of ways of addressing this challenge in the final chapter 6. In the rest of this section, I provide summaries of activities 1 through 4, highlighting my interpretation of students thinking that emerged as they progressed to the end. The section concludes with an analysis of the third HLT, followed by a retrospective analysis of the three HLTs. The data analyzed is from responses to selected activities from the four learning tasks. The three students were asked to try out the same unit through their mobile phones but they were not very keen on doing this because of the added connection costs. They preferred the paper-based version. In the remainder of this section, findings and discussions around student engagements with selected tasks (table 5.30) are analyzed. I refer to the three respondents as Student 13, Student 14 and Student 15. Table 5.30: Activities analyzed as part of the second HLT Pre-test: Q3 Q5, Q8 and Q10 Student initial interpretations of the derivative Student initial interpretations of the integral Activity 1 and assignment 1 Reasoning with graphs Activity 2: 2.4.1; and The Rate-of-change function assignment 2 Q6 Activity 3 The Accumulation function Activity 4 How are the two functions related Samples of student learning activities in the third HLT (a) Task 1, pre-test. The same pre-test presented in the first HLT was used again (see section 5.3.1). (b) Activity 1 and assignment 1, reasoning with graphs. Learning activity 1 was preceded by a short introduction to Calculus emphasizing the complementary ideas of differential an integral Calculus and mentioning their inverse relation. The aim was to stimulate students into thinking about the relationship before proceeding with the activities. The same cheetah and zebra story used in the first two trajectories was used but modified slightly to include hints and a model graph (see figure 5.21). Students were tasked with graphically modelling the motion of a zebra being chased by the cheetah. This task was considered to be a situational, as well as a referential activity (Gravemeijer, 1999). It was situational in that it offered students an opportunity to work towards the mathematical goal of determining if the cheetah caught the zebra experientially. It was referential because the solution required a model as part of the problem solving strategy. The intention was to have students compare the motions of the two animals and make judgments about which animal covered a longer distance. The conjecture was that this 206

219 would provoke students into thinking about rate (speed) and how this quantity was related to the distance covered in a specific time interval. Each student s organizing activity of curve sketching of the velocity-time graphs had the potential of serving as a model of the motion problem. Figure 5.21: Learning activity, HLT 3 Students interactions in the same problem in the other HLTs had shown that students struggled with demarcating an interval in which to compare the motion of the two animals. In the hints provided, I attempted to draw students attention to a common interval around which the motion concerned could be analyzed. By adding the hint, 207
220 I was not expecting precise answers but was looking towards obtaining representations of students forms of reasoning. It is important for you to note the distance covered by zebra by the time the cheetah reaches its top speed covered by the cheetah by the time it attains its top speed. In the summary for this section, I attempted to steer students towards thinking about measures of variation by pointing them towards Professor Strang s overview by pointing out that function 1 was the distance while function 2 was the speed, and that function 2 was an indication of how function 1 was changing. I then directed students to view the first of Professor Strang s video first video as an introduction to the two basic Calculus concepts. There were also a number of assignments. (c) Assignment 1, HLT3. The first assignment was my attempt to engage the students in beginning to systematically think about quantifying rate-of-change. In this assignment borrowed from the MALATI group (1999), students were to investigate the growth of seedlings in order to differentiate between linear growth and erratic growth.. Figure 5.22: Assignment 1, activity 1,HLT3 208
221 I hoped that this activity would encourage students to think about average measures with a view to extending the thinking to the behaviour of the function variables at particular instances within a given average measure. Besides, the activity provided an opportunity for students to learn about making assumptions and using these assumptions to make predictions on functional behaviour. The first sets of questions Q1-Q8 were straightforward (figure 5.22). (c) Activity 2, the rate-of-change function. The sets of tasks in this activity were designed to help students develop a better understanding of the derivative as a function s rate-of-change. Students participating in the second HLT had exhibited problems with creation of stable images of an average rate-of-change. The intention, for this activity, was to have students mentally create systems for expressing the average rate-of-change, which would later on serve as a stepping stone to an understanding of the instantaneous rate-of-change, accompanied by an intuitive introduction to the limit concept. The idea was to introduce the notion of an average rate-of-change of a quantity A with respect to another quantity B as equal to the total change in a measure of A divided by a corresponding change in a measure of B. At the beginning, students were asked to critique the following statement: A man drives 240 km in 2 hours. Therefore, it took him 1 hour to drive the first 120 km. This was a precursor to a discussion about the instantaneous rate-of-change and the use of Calculus, specifically differentiation to determine the rate-of-change at an instant. A discussion around what was meant by instantaneous rate-of-change ensued before the second activity. The intention was to engage the students in systematically quantifying an average rate-of-change before an introduction to the instantaneous rate-of-change, the derivative at a point, and then the derivative function. The actual activity was framed as question (figure 5.23).This activity also had accompanying hints, in which students were to complete a table indicating changes in distance covered and changes the elapsed time. Students were required to calculate the average speed given as in the interval defined by and. was the distance covered by the ball in the 4 seconds. The value of 5.23). stood for the distance the ball had covered up to a time, (question 2.4.2, figure 209

222 Students were also asked to specify, and complete the last row of the table (figure 5.23) with the values of the average speed for each interval. Figure 5.23: Activity 2, HLT 3 The aim of this set of questions was to assist student structure their investigation of the distance and time data so as to orient them to patterns of changes in the average speed as the interval around the point became smaller. The anticipation was that by examining these patterns, students would realize that the average speed approached a certain number as the interval surrounding seconds became smaller. It was important for students to observe that t could be arbitrarily close, but never equal, to. An instructional endpoint of the task was to have students transfer the reasoning resulting from their engagement with this activity to a process of examining how a curve was behaving between any two points. The anticipation was that later on, this examination would lead students to a realization that the shape of the slope of the curve was a signal of how fast the curve was changing. Selecting an interval [a, b] on a curve and moving a and b so that they coincided could provide an indication and approximate measure of how fast the curve was moving at any one point (section 4.3.1). The resultant entity was the derivative. The questions students had to respond to were: (b)which number does the average speed approach as approaches s? [Observe that can be arbitrarily close, but never equal, to ] (c) What is the ball s speed at sec? In the last part involving the quantification of rate-of-change, I presented the information using algebra by introducing as the time interval that elapsed just before 210


223 the ball hit the wall. I used this representation because the letter sometimes appears in Calculus teaching texts as part of the derivative definition with very little context. Students have difficulty working out the source of this representation. By substituting the term ( ) with the letter, I wanted to show that the average rate-of-change (speed) of the ball over the last h seconds before it hit the wall would be equal to: Thereafter, students had to carry out another investigation involving h by completing another table. They also had to respond to three pertinent questions in order for me to gauge their understanding (figure 5.24). I wanted them to imagine the value of the speed value approaching a limit. Figure 5.24: Questions for task involving h, activity 2, HLT3 In the summary to this section, the definitions of the average of rate-of-change, the derivative at a point and the derivative function were highlighted. The average rate-ofchange of for any function. over an interval [ ] was given as. It was pointed out that an alternate representation: would be used if the interval was given as [ ]. The derivative of a function at, written as was defined as:. The derivative function for a function was defined as:, the instantaneous rate-of-change of at in cases where the limit existed. Students were also directed to a very well presented 211
224 online resource introducing the derivative available at Kelly (2010) introduces the derivative as the tangent line to a slope where his animations of curve sketching could help students form an appropriate derivative image. (d) Assignment 2, HLT 3. In the second assignment, students had to work out standard derivative questions which they responded to appropriately except Question 6 (see figure 5.25). Figure 5.25: Q6, assignment3, HLT 3 (d) Activity 3, the accumulation function. The aim of the third activity was to introduce the accumulation function of the functional variables changing within a specific interval. As before, I referred to Galileo s falling body experiment in History. Galileo first hypothesized that the velocity (v) of a falling body was proportional to the falling time (t). I wanted to draw the student s attention to the fact that Galileo could not obtain the measure of a continuously changing velocity so he had to carry out experiments to test his hypothesis. However, it was Galileo s mathematical reasoning that had led him to test this hypothesis. I thought this introduction would inspire students to respond to the following question: Given an object whose rate-of-change (speed) is changing continuously - can we determine the total distance it has covered? Given the slope of a function, can we find its height? In other words, given function (2), can we uncover function (1)? 212
225 In the notes that followed, I began a discussion about finding the distance travelled by a car in a given time interval. The intention was to have students begin thinking about an accumulated distance as a quantity constituted from two other quantities multiplicatively. This multiplicative measure was the area under a function s curve. A small portion of a constituted measure was represented as a rectangle on the curve. The area in the interval being investigated would consist of the sum of these series of rectangles. For an object moving with constant velocity, the rectangles would be the same height and have equal width. The rectangles forming the area under the curve of an object moving with a changing velocity would have different heights, indicative of the pattern of changes in the velocity. At this point, the widths were kept equal for ease of comparison. Students were asked to complete the following task (figure 5.26): Figure 5.26: Activity 3, first part, HLT 3 (taken from MALATI Group questions) In the subsequent section, I attempted to show students that determining the area under the curve was connected to the process of integration. Students were required to complete the following task (figure 5.27): 213
226 Figure 5.27 Activity 3, second part, HLT 3 The notes in subsequent sections illustrated that the sums of the areas of the rectangles was an estimate of the distance covered. As briefly as possible, the idea that one could approximate the area using a Riemann Sum was introduced. This sum would approach an exact value (a limit of the sum). It was stressed that the evaluation of the definite integral as a limit of Riemann would be covered in a formal Calculus course. To calculate the exact distance I used a rather long-winded argument as shown in figure Figure 5.28: Calculating the exact distance, activity 3, HLT 3 I then reverted to the original problem, hoping that the students would now see that the exact distance was equal to the sum in the stepwise function (figure 5.29). 214
 and function (1) visually.")
: function (2): (figure 5.29).")
227 From the information that was the derivative of or, the area could be determined with the integral. Using the antiderivative the In the last section of the notes, I attempted to show the connection between function (2) and function (1) visually. I wanted students to compare a function-pair function (1) and function (2) graphically. I referred students to a function example whose derivative was easy to construct graphically with the following designations: function (1): function (2): (figure 5.29). I wanted students to see that the amounts of the rises between subsequent points on the and the areas of the trapezoids under were equal. This meant that the area under the derivative (function 2) was equal to the total rise in (function 1) on the same interval. The anticipation was that students would eventually discover that finding the area was differentiation in reverse. Figure 5.29: Activity 3, linking function (1) and function (2) graphically, HLT 3 (e) Some assignment Questions, HLT 3. In one of the questions in the assignments the students attempted at the end of the learning activities, students were asked to use data given to draw a velocity-time graph and estimate the total distance covered by the object (see figure 5.30). 215
228 Figure 5.30: Assignment 3, Q1, HLT 3 Developing an understanding of the definite integral as a difference between two antiderivatives where this difference was a measure of area was important. In the last question of assignment 3 (figure 5.31), students went through a task introducing the differences in the antiderivative values as the area under the curve. I expected students to write a statement specifying this relationship. Figure 5.31: Linking antiderivative, area function and definite integral, HLT 3 216
 Activity 4, how are these two functions related? This last activity was designed to bring all the elements of the module together.")
229 Once again, the students were referred to Professor Strang s video on an introduction to the integral using the idea of recovering function (2) from function (1). (f) Activity 4, how are these two functions related? This last activity was designed to bring all the elements of the module together. It was developed as a summary of the derivative-integral relationship expressed in the FTC (figure 5.32). Figure 5.32: The motion problem & the water problem, activity 4, HLT 3 For the distance education students, this presentation offered a means for clarifying ideas in the module. The presentation had two versions; one resided at the Open University lab space server but has very small fonts, while the other was at the Stellenbosch university server. An earlier version deposited at a commercial serverarticulate-could no longer be accessed as the access term had expired. Paper versions 217


230 of the power point slides were included for those unable to access the mobile version. These students would miss out on the narrations and oral explanations designed to make the FTC understanding better. In the slides, the two parts of the Fundamental Theorem were re-emphasized. However, the most critical slides in the presentation were those demonstrating two problems-the motion problem and the water problem. Students had an opportunity to see how problems involving the FTC could be approached. The visual presentation supported with the oral explanations was meant to enhance their understanding of the derivative-integral relationship. (g) Assignment 4 questions, HLT 3.The last and simple assignment questions were designed to provide information about students basic understanding of the FTC as explored in the learning sequence. These questions are displayed in figure 5.33 with ideal responses on the right hand side. Figure 5.33: Assignment 4, HLT 3 218
231 Assignment 4 aimed to assess students understanding and interpretation of the terms in the second part of the FTC expression and its relation to the area under the curve. Each part sought for a different aspect; (a) for an expression of the area as a definite integral, (b) for an expression of, the antiderivative of ; (c) for a computation of and a conjecture concerning an area as the difference between the antiderivatives at the interval boundary; and d) for the FTC statement. N.B. I did not expect the students to be able to calculate the actual value of the integral but had hoped that they would reason that the final volume was equal to the initial volume minus the accumulated volume, that is : t2 final = initial t1 v v f () t dt The next section contains examples of the student responses Examples of student responses, third HLT (a) Student preliminary conceptions of the derivative and integral. The first learning activity was preceded by the same pre-test used in the previous HLTs. The initial student conceptions were similar to those presented in the first and second HLTs. I present analyses of the definitions of the derivative, the integral and a visual cue to the difference quotient. Student 13 had a process conception related to working out a formula; Student 14 had an entity (graphical) image of the derivative. Student 15 produced a mathematical interpretation of the derivative as a measure of how a function changes as its inputs change (see table 5.31). Q3. In your own words, what is a derivative? Table 5.31: Students' conception of the derivative-hlt 3 Student 13 Student 14 Student 15 It is when you derive formula or an equation from other formula It is a slope of a curve that is used to calculate the rate-of-change, it is used as a core of Calculus and mathematics Is a measure of how functions changes as its inputs change In response to Q4, Student 14 s description of the difference quotient and depiction of what happens when b moves closer to a was consistent with a definition of the average rate-of-change of a function and its derivative. Student 13 s interpretation of the difference quotient as a distance was problematic, while Student 15 had no response to these items (see table 5.32). 219
232 Q4 Q5 what happens to when b f (b) f (a) b a moves closer to a Table 5.32: Students' interpretation of the difference quotient-hlt Student 13 Student 14 Student 15 The quotient above The average rate-ofchange No answer means that the of the function average distance f over the interval between the two (Artigue, 1991) points. When b moves closer to a the average between the two points changes The slope of the gradient f approaches the slope of the tangent line No answer In terms of integral definitions, Student 14 and Student 15 described the symbolic components of the given expressions. Student 13 s definition was not so clear (see table All three students had acceptable graphical interpretations involving motion from their answers to question 10 (see table 5.34.) From the responses given, all the students seemed to possess acceptable starting knowledge to engage in the ensuing activities. They had notions of the derivative and integral that could be used to further develop the mathematical relationship between the two concepts in the first learning activity. Table 5.33: Student integral definitions-hlt 3 Student 13 Student 14 Student 15 Q8 I will say it means that the opposite of the derivative which is integration is a symbol of representing integration rules. Is the integration of f at x between x=b and x=a the difference between x=b and x=a This is the integral of f(x) between the points x=a, and b=x Table 5.34: Student initial graphical interpretations of motion-hlt 3 (a) Interpret from the graph what the average velocity might be: A 5 m/s B 15 m/s C 25m/s D 120 m/s E I don t know (b) Interpret from the graph what the total distance covered by the car in 6 s is: A 10 m B 50 m C 90 m D 120 m E I don t know Student 13 Student 14 Student 15 Question 10a B= 15m/s B= 15m/s D 15m/s Question 10b D= 120m D= 120m D =120m 220
233 (b) Activity 1 and assignment 1, reasoning with graphs. Student 15 s first instinct to solve the problem was to use algebra (see figure 5.34). Student 15 assumed that both animals travelled with constant velocity, with the cheetah travelling at 100 m/s and the zebra at 50 m/s. In his reasoning, Student 15 assumed that the two velocities were equivalent and equated the proportions of distance/speed. His calculations yielded a value of 400m to which he could not assign any real meaning. He abandoned this form of reasoning and resorted to reasoning intuitively. He reasoned that because the zebra s speed was slow, its accumulated distance was also low, stating that So when the cheetah is travelling at the speed of 100m/s for a distance of 200m, and the zebra at 50m/s for a distance of 6000m, it is as if the zebra is at a constant, therefore, the cheetah will catch the zebra. He gave this as the reason for the cheetah catching the zebra. At a later stage, Student 15 drew a graph resembling the graphical model provided in the hints but did not accompany this with any form of explanation (figure 5.34). Figure 5.34: Student 15 s response to activity 1, HLT 3 221
 is increasing and")
234 Figure 5.35 Student 13 s response to activity 1, HLT 3 Student 13 drew a straight line graph each for each separate animal (figure 5.35). This type of graph is indicative of reasoning where the student imagines one quantity increasing in tandem with another but cannot extend the thinking about what aspect (variable ) is increasing and how. Student 13 s explanation: By looking at the graphs, we can see that even though cheetah can go about 100m/s for a while, it will not catch the zebra cause the zebra firstly it is 700m far away from cheetah. To reach its speed, the zebra will be long gone cause it maintains its speed for a while now. Student 14 did not attempt this question. This would have been an opportune moment to stress what was important and to redirect the learning. At this point, I would have taken Student 13 or Student 15 s responses as launch pads for discussions around quantifying variation. Hopefully, it would have led to a discussion about a rate-of-change and accumulation and what these two measures constituted. In distance education, this is the juncture at which the RME approach becomes problematic, especially if there is no opportunity for learner tutor interaction or student discussions. Mobile phone discussion are possible but must be very tightly structured. (c) Student responses to assignment 1, HLT 3. Student 14 and Student 15 provided acceptable responses and were able to recognize that seedlings had a 222
235 constantly changing growth rate. Student 13 did not follow the reasoning. Typical responses are shown in table Table 5.35: Student responses to Assignment 1, activity 1, HLT 3 Student 13 Student 14 Student 15 Question 1 3mm 3mm increase as it 3mm grows by the same amount each day Question 2 No response Different amount of growth everyday Seedling B grew by different amounts daily Question 3 No response A has the same growth amount whilst b grows different amounts The growth of seedling a is linear whereas for seedling b is a different Question 4 Day 7 7 days as the difference of seedling a is 3 day 7=(number of days -1) difference +day 1 in height = (7-1)*3+3=21 Question 5 No response Between day 8 and 6,26 and 19 respectively amount each day Day 7 (7*3)=21mmi multiply 3 because its the daily growth No response (26-19)=7 Question 6 33mm 33mm in height 33mm Question 7 No response 45 If you meant B the height was 41mm Student 14 Student 15 Q8 Explain how the age and the height of seedling B are related. Can you provide a formula to determine the height of the seedling at any time during the two week period? Q9 Explain how the age and the height of seedling A are related. Can you provide a formula to determine the height of the seedling at any time during the two week period? This seeds does not grow every day it undergoes Fibonacci method of series because it contains both negative and positive signs in the differences of growing A(x)=d(x-1)+a:a=first height; d = difference between the heights and x = number of days. ANS: The height of seedling B changes after two days; the formula that I generated to determine the height of the seedling at any time during the two week period is: ½(seedling height).age ½.(age) = seedling height ANS: The height of Seedling A is three times the age of seedling. 3(day number) = height of seedling (mm). All three students were given access to the mobile learning version and asked to complete the questions once more. Student 13 gave up but Student 14 and Student 15 tried most of the questions. This time around, they applied more thought and produced more detailed answers. I paid particular attention to Q8 and Q9 where they were asked to explain how the age and height of each seedling was related. 223
236 and that for seedling A as 3 ( Stellenbosch University Both Student 14 and Student 15 applied their minds to get an answer but quite differently. Student 14 claimed that the relation between age and height for seedling B was a Fibonacci series and for seedling A was. S/he searched for any symbolic notation resembling the type of question given and reproduced it (a common strategy when one does not fully comprehend what is going on). Student 15 derived a formula for the height / age relationship for seedling B as the height of the seedling at any time during the two week period as 224

237 Professor Strang s video to strengthen their understanding of the derivative concept before tackling learning activity 3 (d) Activity 2, the rate-of-change function. Only Student 15 responded to the question calling for the critique of the gentleman driving 240 km in 2 hours. His response through a text message was: If the man drives 240 km in 2 hours, it can be true to make a conjecture like this, and say it took him 1 hour to 120km but provided that the car was moving at a constant speed. A discussion around this point would have guided students into realizing that to make the assumption that the man took an hour to cover that first 120 km was not entirely correct as there was not enough detail regarding his whereabouts in smaller time intervals (minutes or seconds). What could be ascertained was that he completed the entire journey in 2 hours. Additional s were sent to both Student 14 and Student 13 but they still did not respond. The three students completed their tables in response to question (figure 5.23) as follows (see figure 5.37). Figure 5.37: Students responses to activity 2, HLT 3 Student 14 and Student 15 provided similar answers to part (b) [ ] and [ ]. Student 13 had a different answer of (b) [ ] and (c),. Student 13 used the value of, where was to get a speed value. It appeared that Student 13 was reverting to the knowledge s/he had instead of making inferences from the table. In an accompanying sketch, I attempted to show that the same information could be represented graphically (see figure 5.38). 225
, (figure 5.")
238 Figure 5.38: Graphical representation, activity2, HLT 3 I wanted students to build images of the fundamental conceptual tools of the difference quotient standing in for an average rate-of-change. I wanted them to carry the image of a triangle. I also wanted students to develop an intuitive sense of what the limit represented. In response to part (c), (figure 5.24), Student 13 was going to let or and Student 15 was going to make h turn to zero (limit). Both respondents accepted that the average speed of the object before 4 seconds would not be greater than. It was the responses to the last part (d): What is the actual speed of the ball after sec that gave a clear indication that the two students had not fully comprehended the limit concept, or how I had attempted to present it. Student 13 s answer was, which indicated that s/he had not come to terms with the fact that the formula was a formula for calculating a distance. Student 15 s answer of undefined suggested that s/he was not using the graph as a referencing model for analyzing the motion of the object. The table accompanying this activity involving h by was satisfactorily completed by both Student 13 and Student 15. (e) Assignment 2, Question 6, HLT 3. This question (see figure 5.25), was available in a print format and could also be viewed on smart phones. In the first printbased version of the Calculus unit, Student 13 and Student 15 s calculations corresponded to the terms in the question directly above Q5, in which they had been asked find the points on a curve (see table 5.35). In future, I will have to make sure that the two questions are clearly separated to avoid this error. Student 14 did not provide any response. 226
239 Table 5.35: Student 13 and Student 15 s response to assignment 2, Q6, HLT 3 Student 13 Student 14 Student 15 Question 6 F(5) =479 substitute 5 into the equation then simplify and f (5)=240 derive the equation then substitute 5 into the derived equation. F(5)=479 substitute 5 in the equation in place of x y=x4-6x2+4 f (x)=440 derive the equation and represent x day 5 from the derived equation In the mobile learning version, Student 15 answered Q5 differently, giving the coordinates for the points on the curve where the tangent is horizontal as and. Student 15 used Maple software to generate an answer of. Like the participants in previous HLTs, s/he failed to read data provided directly from the graph. Student 14 said s/he was unable to continue forward from this point. (f) Activity 3, the accumulation function. Student 15 had two responses to Activity 2, first part, HLT 3 (taken from MALATI Group questions) (see figure 5.26). The initial response was very short and stated: yes, the distance travelled will equal speed (m/s) multiplied by the total time spend. After the mobile learning version, Student 15 responded to this question using a text message which read: I would put vertical strips in the graph such that they form the trapeziums, and the strips must be equal in length, and calculate the area of each trapezium, hence sum up the areas of the trapezium to determine the distance travelled. I was not quite sure why student 15 was using the more complicated shapes (trapeziums) as opposed to the simpler rectangular shapes to determine the areas under consideration. Student 15 gave a response to the answer as 12m. Student 14 did not write down an answer even though his/her workbook had calculations. Student 13 did not respond to this question. Students were unable to complete the second part of activity 3 (figure 5.27). (g) Student responses to some assignment questions, HLT 3. Both Student 14 and Student 15 constructed the correct graphs for the print based and the mobile phone versions (figure 5.39). Student 14 s first estimation for the distance was obtained by multiplying.this suggested reasoning based on the formula, and a failure to use the graph to obtain the correct answers. 227
240 Figure 5.39: Student 14 and Student 15 s graphs for assignment 3, Q1, HLT 3 Student 15 obtained his first estimation of the distance using the following reasoning:. Thereafter, he then continued with the calculation. small box 0,2m/s x 0,25 = 0,04m x N = 0,04m x 84 = 34m of boxes Student 15 had used an image of a box to trace the area under the curve but just fell short of spreading the boxes on the curve to develop a measure of an accumulated area. None of students noticed that the area traced by the curve resembled a triangle. They would then have obtained an estimated area of. Student 15 s answer after exposure to the mobile learning version was 250 m. It appeared that both students still had difficulties interpreting information from the graph. This did not prevent them from correctly completing tasks involving only calculations (h) Student responses to some Activity 4, how are these two functions related? In his/her statements in response to the first assignment 4 question, Student 14 recognized that both and were antiderivatives of, and noted that the differences and were equal. However, Student 14 thought that the conjecture statement related to a number, not to a mathematical relationship. Student 15 arrived at the same conclusion. It would appear that both students were searching for a correct answer and, therefore, found it difficult to ponder and reason about the given expressions. They were not used to responding to investigative types of questions in a mathematical learning environment. Students written responses were graded according to how well they correlated to the model responses. The comparison was done qualitatively using a rough scheme with three levels (table 5.36). 228
241 Table 5.36: Scheme for rating students responses to assignment 4, HLT 3 Very well correlated Response contains all the main idea expressed in the ideal response Correlated to some extent Response contains some of the main idea expressed in the ideal response Not correlated at all Response does not contain any of the main idea expressed in the ideal response Unclear response Cannot make sense of the response For the responses from the first assignment (print version), Student 15 s responses were coded as correlated to some extent (see table 5.37). Student 15 started off with an integral expression but had the same antiderivative expression: as an answer to both parts (a) and (b). For part (c) Student 15 calculated only one value, not the difference. Even for s/he made calculation inaccuracies (see answer below) = = = = For part (d), instead of a statement, s/he wrote:. After the exposure, Student 15 s changed his/her response to part (d) so that it became from to. Student 14 s responses from the print version were all very well correlated with the ideal responses except the calculation of the difference, which erroneously came to. Student 14 revised his/her responses after the mobile session. S/he mistakenly determined the derivative instead of the antiderivative for part (c). The answer given for the integral function was now.this led to an incorrect computation of the difference, which became. Student 14 s responses appeared not correlated to the ideal responses. In conclusion, it appeared that a lot of emphasis on symbol use was required for the students to develop an understanding of the FTC expression. Question 2 involved computations only. Table (5.37) displays Student 14 and Student 15 s responses for the print and mobile versions. 229
242 Table 5.37: Student 14 and Student 15 s responses to Q2, assignment4, HLT 3 Print version Mobile version Ideal answer Student 14 s Answer 3 x dx 4 x = + c 4 4 x + c 4 Student 15 s answer 4 x + c 4 Student 14 s answer Student 15 s answer = x^4/ 4 +c 3 [ X ] 3 x = = x x dx = + c 20 4 = xdx = x c 4 = = x = 3(4) 0 3(0) (3 4 1) 20 = = = [x^4/4] x = x = (4) = substitute [1,3] = 3^4/4-1^4/4 = 20 = 16/3 = x = from 1 to = [( x) ] from 0 to 4 Student 15 started off with well correlated responses in the print version and changed the approach after the mobile version. S/he computed the derivative for part 2(b) instead of the antiderivative. Student 14, on the other hand had responses which were somewhat correlated to the ideal responses for the print version. Student 14 s responses after the mobile version correlated very well with the ideal responses. Student 14 s use of Maple software to answer questions might have helped with the improvement. It goes to show that students lines of reasoning used by the students are not static and can shift either way. Student 14 s reasoning was initially uncoordinated but became consolidated. Student 15 s reasoning seemed well coordinated but went off track somewhere along the trajectory. These are points, in the learning process, where the tutor could have asked the students to elaborate more on their responses had there been an efficient platform for tutor-learner interaction. Both Student 15 and Student 14 s responses to question 3 correlated very well with the ideal response. Student 15 s first response was particularly insightful as s/he made the correct substitution as shown in figure x x 2 2 ( ) 2 0 g x = tdt = t = x gx ( ) = x hence gx ( ) = 2x g '(1) = 2(1) = 2 Figure 5.40: Student 15 s response to Q3, assignment 4, HLT 3 It would seem that Student 15 had mastered the Calculus techniques but had problems assigning meaning to these techniques. Both students did not attempt the last question. 230
243 Responses to the evaluation task In the evaluation, students indicated that they benefited from the activities. Student 15 s comment was that the activities energized his/her mind. However, the students felt that the hints added distracted from the learning. Following this remark, I have reduced the number of hints in the last trajectory. I did not include the post-test because previously, the students had just replicated their responses in the pre-test to the post test Analysis of the third HLT The activities in this last HLT were meant to have students develop a sense of a differentiation and integration relationship rooted in a link between measures of a quantity s rate-of-change and accumulation. The focus was on having the students use curve sketching as a means of investigating the relationship between the derivative and accumulation functions. Activity 1 engaged students in comparing the motions of two animals through a process of constructing graphical models of their motion. The conjecture was that the organizing activity of curve sketching of the velocity-time graphs of the two animals would serve as a situational and referential point from which the formal modelling of the rate-of-change and accumulation would evolve. Activity 2 was designed to help students quantify the measure of a rate-of-change through an understanding of the derivative function. The intention for activity 3 was to have students associate the measure of an accumulated quantity with an area under a function s curve. Student s experiences of these activities would then serve as a springboard for facilitating an understanding of the derivative-integral relationship as expressed in the Fundamental Calculus Theorem in the last activity 4. Evidence from student engagements with the activities indicates that using curve sketching as a platform for the emergences of an intuitive understanding of the invertability relationship between differentiation and integration is not without problems. This evidence shades light into student s thinking and the difficulties they experienced around four main areas: 1) Quantifying change, 2) curve sketching, 3) general mathematical reasoning, and 4) symbol usage. These are areas that would need to be addressed going forward. With respect to quantifying change, students experienced considerable challenges assigning measures to variation. Even with hints, students had difficulties imagining what it was that was changing in specific situations so that they could assign a measure to it. This, in turn, affected their ability to correlate changes in more than one variable at a time. In the end, this obstacle affected the students capability of 231
244 imagining the covariation of two changing quantities and how this covariation could be constituted. Students difficulty with regard to curve sketching can be associated to an inability to organize the relevant information into categories that could be used for analysis. Students had difficulties identifying starting points for drawing the curves. They lacked vivid images of how the changing quantities (or variables) could be organized. Drawing of tables would have assisted in this undertaking. However, in cases where students were provided with tables, they exhibited difficulties with making inferences from these tables. They also had problems coordinating all the pieces into coherent structures (section 5.4.3). As a result, students found curve sketching demanding. It was also difficult to get the students to use the graphs as referencing models and starting points for problem solving. In terms of general mathematical reasoning, the evidence suggests that students had a tendency to attend to the surface characteristics of the numerical information provided, searching for correct answers and not necessarily for deeper meanings. In most instances, students rushed to complete the assignments and paid very little attention to completing the learning activities provided in the workbook. However, part of this has to do with the instructional design. The text needed to have prompts and clear indicators of what students were required to complete,as there were no physical tutors to cue and prompt students in a distance learning environment. With regard to symbol use, engaging students in a process where symbolization and meaning making co-evolved (section 2.5.3) was quite difficult. Attempts to have the students focus on regular shapes such as the triangle to represent the slope and later on a strip or a rectangle to represent area did not materialize as planned. The students had a tendency to fall back on previously acquired Calculus techniques. The problem was that they seemed to apply the Calculus techniques at surface level with insufficient understanding of the underlying connotations. I would argue that developing some sense of the reasoning behind the techniques would help students apply the rules better. It is the development of the required type of reasoning in a distance learning environment that is challenging. Before moving on to the retrospective analysis, RME experts from the Freudenthal Institute and a local South African lecturer commented on the last HLT. The next section is a summary of their comments. 232
245 5.6. Critical Comments from RME Didacticians Comments from the Freudenthal Institute The comments from two RME experts about the last HLT addressed the quality of the activities in general, and some of the transition steps. Their observations and comments are shown in Appendix E. Their main observation was that the first part (about the derivative) was less balanced than the second part. Some work needed to be done to the first part to make it accessible as remedial content. They also referred to two main transition points that required re-development: the step from intuitive reasoning to difference quotient and differential quotient (with the limit and the role of ), and the step towards the techniques for differentiation (Kindt & Doorman, 2011). The main observation from the two RME experts was that these steps were difficult and quickly summarized, and that they would appear as very difficult for students that were to see this topic for the first time (Kindt & Doorman, 2011). These comments resonated with student experiences of the HLT (section 5.5.7). Students had actually found it difficult to navigate through the first part of the trajectory. Some of the other queries dealt with the fairness of asking questions involving calculations of the derivative and integral to students who perhaps were seeing the notation the first time. Others dealt with the realistic nature of the problems paused. For instance, in one of the questions, I had indicated that a car was driving at an average speed of 120 km/hr which realistically was too high to be an average driving speed. As part of a remedial teaching Calculus unit, their recommendation was to develop a sequence with a graphical/intuitive approach together with quick steps for developing concepts and skills. They advocated alternating fill-in questions with matchingactivities, for example, match velocity graphs with distance travelled graphs (and some missing components that students have to draw themselves); match bottles/water jugs with height graphs (and some missing ) etc (Kindt & Doorman, 2011). They also had suggestions about the kind of activities that could be added. For instance, one proposal was to include a task in the pre-test whereby, given a distance travelled graph, students were required to interpret from the graph the average velocity and the velocity at a certain moment. On their recommendation, I have re-developed the final envisioned HLT integrating their suggestions as well as activities from Swan s (1982) book The Language of Functions and Graphs. 233
246 Comments from a local South African educator I interviewed a local Calculus instructor familiar with the RME framework, (Dr Radley Mahlobo) from the Vaal University of Technology, in order to find out his views on the third l HLT. I asked him about his overall view of the activities and how he would present the FTC. His first comment was that the HLT contained too many explanations of the derivative and the integral that it seemed I was providing information and not really allowing the students to discover the concepts for themselves as RME dictates. 1. Researcher: I want to find out exactly what you thought about the activities, I mean your whole views of the activities. 2. Lecturer: to my understanding RME is the type of activity in which the students use their experience to gain an understanding of a mathematical concept. I looked particularly at your activities and wanted to find out exactly what the objectives were. One question came to my mind was, if you wanted to start with any activity on differentiation, and the relationship between differentiation and integration, the objective would be to understand how you can come out with an activity in which their experience will be used developing the arguments and conception of the relationship between the derivative and integration. I could not pick it up from the activities you give them because the activities were given to them, one of the things that came up is that you explain what differentiation means and explain what integration means. It is their real life experience that is going to make them understand what they are, not your explanations. When asked about a possible starting point, he suggested starting with the area problem to introduce the derivative concept: 3. Researcher: In your opinion, what would be the starting point? 4. Lecturer: If you want to illustrate differentiation, you would want to start from their life experiences. It is possible to ask students simple questions like: If you are given a fence in a particular area in a particular length for instance in meters, then we want to cover a rectangular vegetable garden and tell students to use lengths of 12 m to indicate how they would sort this out What could be the dimensions of the fence after you have covered the place with what you want to use?. someone tells us that the length 4 m and the width 2 m, in which case the area would be 8 m 2, or somebody says the dimensions are 3 m by 3 m, in this case then the vegetable garden size will then be 9 m 2, the students would become aware that different ways of identifying dimensions will lead to different sizes. Now you tell students to verify the area dimensions if the dimensions are represented by x horizontally and y vertically. If you tell them to come up with equations to describe these, then they will end up with an equation that describes an area against the x variable which is a mathematical result. If they took all the dimensions and plotted them, they would get a parabola. Well, that s where the Calculus part will come in when it comes to the point of maximizing the area, they would realize that the one with 3 by 3 is going to have the best set up; and if you say, identify the equation and find the critical area, they will realize that the critical amount you get will correspond to an exact value and will always give the maximum they will learn that when the derivative is zero, it directs them to the very thing they are looking for without them going to approximating or finding a value with an error, which means that they are now able to see that the use of derivative is important. 234
247 The lecturer was not convinced about developing a unit introducing the derivative and integral straight away: 5. Researcher: You have talked about the derivative on its own, is it possible to link it to the integral in that case with examples you have chosen 6 Lecturer: The point I am trying to illustrate is you need to be cautious about the difficulty of the problem, and in some cases it may not be a good idea to start to link differentiation and integration straight away. It may be something that could follow differentiation. Later on, he continued a discussion about introducing the FTC following the steps that appear in most conventional textbooks that is first introducing the derivative, then the integral and presenting the FTC expression using the area problem. On the whole, the lecturer was not convinced that the RME approach was the best approach to use to introduce the relationship between the derivative and the integral. As a seasoned Calculus educator, the lecturer provided advice that I felt was worthwhile carrying on forward into the project. He suggested that students needed a thorough understanding of the derivative concept and the derivative function before developing an understanding of the derivative - integral relationship. This is advice that I have carried forward into the development of the envisioned HLT. Both the comments from the RME experts and a local Calculus teacher have been integrated into the design of the envisioned HLT A way forward In recent work, Hoffkamp (2010) has developed web-based interactive visualizations (applets) to promote an understanding of Calculus concepts. Her underlying approach is based on functional thinking, a fundamental idea used in the Meraner Reform movement for improving the quality of teaching Science and Mathematics in 1905 Germany. In functional thinking, the focus is on examining variations and the functional dependencies of different aspects of change. Functional thinking embraces a static view of functions (as point wise relations); an aspect of change (a dynamic view of a function), and an object view (functions as objects, as a whole) (Hoffkamp, 2010, p. 3). For purposes of learning Calculus, change is observed in situations and their representation forms such as graphs. In her implementation of a qualitative-structural approach to teaching Calculus using the computer, Hoffkamp (2010) designed interactive activities based on design principles emphasizing the dynamic and object view of functions (p. 4). Students were able to uncover characteristics of functions, and construct their own terms connected to Calculus concepts such as the slope and area under a curve using a dynamic view of functions. One of her activities is shown in figure
 web-based learning activities was not possible to implement at the time this project was conceptualized, the HLT introducing the")
248 Figure 5.41: Screenshot of interactive learning activity (Hoffkamp, 2010). Even though the level of dynamism illustrated in Hoffkamp s (2010) web-based learning activities was not possible to implement at the time this project was conceptualized, the HLT introducing the derivative-integral link has been designed from a functional thinking point of view. In the retrospective analysis that follows, I combined the ongoing analyses into one integrated commentary Retrospective Analysis A retrospective analysis was conducted on the entire data set collected in each of the design experiments. This type of analysis follows after the planning and experimentation phases. In order to distinguish design experiments from the standard experimental research, Cobb and Gravemeijer (2008) point out that the main outcome of a design experiment is usually a local instructional theory outlining how a particular process of student learning in a specific domain unfolds and the means by which it is supported (Cobb & Gravemeijer, 2008). They stress that the main objective of a design experiment is not to demonstrate or assess that a HLT works. Rather, the purpose is to improve the envisioned trajectory developed while preparing for the experiment by testing and revising conjectures about both the prospective learning process and the specific means of supporting it (p. 73). As indicated earlier, in this project, I have not developed a local instructional theory. Instead, I have come up with a framework for an instructional design strategy that could be useful to others intending to support students engaging in introductory Calculus units offered at a distance. 236
249 In the remainder of this section, I briefly discuss the outcomes of each HLT in terms of the intended goal of the design experiments. The analyses focus on two main areas. The first one is on those aspects of student reasoning related to student development of an understanding of the FTC expression, and how they could be supported. Here I also provide an account of the instructional challenges involved. The second area focuses on a contribution to the instruction design process, in terms of the structure and sequencing of the learning activities. In the last section, I share the emergent framework for an envisioned HLT. The retrospective analysis was guided by three main questions forming an interpretive framework. Have the students developed mathematical forms of reasoning about the FTC relationship? If so, how was this attained? If not, what were the instructional challenges? Has this design experiment revealed knowledge about student reasoning in this learning domain? Have the analysis results of the design experiment improved the design of the HLT? If so, how? Revisiting the HLTs A historical survey and a didactical analysis had pointed to some ideas about possible starting points for the HLT. The tangent and the area problems were central elements of the learning sequence. The limit concept was a challenge. Literature had also revealed that students generally had difficulty with generating ideas involving functional relationships and interpreting from graphs. Over the course of analysing the three HLTs, my aim was to find out the possible levels of advancement that a typical student would go through as s/he progressed from informal reasoning to a formal interpretation of the FTC expression. In order to generate a framework of the levels used in the analysis, I looked back at (section 2.4, this dissertation). Table 5.39 outlines a rough framework used to trace a possible path of student levels of advancement when building an understanding of derivative-integral functional relationship in the FTC expression. Table 5.38 is as a result of the analysis of contributions of authors who have developed frameworks supporting learning of the FTC. The HLT should be differentiated from learning progressions which are sophisticated ways of thinking about a topic that follow one another as children learn about and investigate a certain topic (Battista, 2010, p.508). The HLT is an average path or a 237
250 simplification of the actual paths students could take in the learning process. The HLT outlines critical points in the learning process and has three main components, a learning goal, learning activities, and the learning process. Actual student trajectories consist of to and fro movements between levels until a projected learning goal is achieved (Battista, 2010). The most accurate way of generating learning advancement or learning progression (LP) levels is by administering individual interviews to students whose responses are then coded by experts according to an LP framework (Battista, 2010, p. 544). Other ways include analysing student multiple choice questions and analysing their generated responses. This project defines a process that precedes the development of the LP. I look for evidence of students forms of reasoning and map them against the suggested framework in order to refine and improve the HLT. The major source of data was students written responses as these are the main sources of data with students learning at a distance. The emergent trajectory unfolded along four major phases, which were named differently in each HLT. For ease of reference, the retrospective analysis is described along these four phases. Phase I was an orientation where students were required to analyse a statement comparing the variation of changes in two changing quantities. The first activity involved the motion of two animals. The idea was that students would construct a graphical model comparing the rate-of-change of each animal, together with its accumulated distance as a precursor to an introduction to the derivative and integral concepts. This activity was refined and revised in the final HLT. Phase II involved the quantification of the rate-of-change and its measure. Phase III consisted of the quantification of the accumulation function and, Phase IV was about combining the two concepts to sketch the derivative-integral relationship. 238
251 Tall s worlds of developing mathematical thinking conceptual-embodied proceptual-symbolic world that grows out of the embodied world through action the axiomatic-formal world (based on formal definitions and proof). Stages Non-computable Reasoning Computable Reasoning 1 Informal A student compares change/variation in a situation in vague ways A student distinguishes between dependent and independent variables 2 Preformal A student compares changes/variations physically and graphically, systematically and can: match aspects in a physical situation to corresponding aspects in a graphical representation create, interpret and analyse information from graphs Understand the mediator role of the graph plays in linking real phenomenon and mathematical concepts (derivative& Integral) 3 Formal A student quantifies rate of change and accumulation and can: coordinate the instantaneous rate-of-change of a function with continuous changes in the input variable (Level V covariational reasoning) Visualize the limit concept intuitively symbolize the derivative and the integral A student can Describe functional behaviour, See the function as a process and an object Understand dynamic functional relationships reason covariantly A student can: mentally construct a rate-of-change mentally construct multiplicatively constituted accruals of the accumulating quantity, together with their relation to the accumulating quantity. form an image of the accumulation function consisting of x three variables : x, f ( x ) and f ( t) dt varying simultaneously. A student can: A student knows that: i) The value of F (x) represents the total Compare a varying function s rate of change and accumulation change in F from a to x. using their properties ii) The instantaneous rate-of-change of the accrual See the area on the rate-of-change versus time graph as a space function at x is equal to the value of the rate-ofswept by the accumulating function change function at x x d dx f (t)dt = f (x) a Table 5.38: Advancing students levels of knowledge of the derivative-integral link a 239
252 Critical points of the cognitive landscape arising from each HLT are introduced in the next section. (a) The pre test All three HLTs included a pre-test and some initial activities. The pre-assessment task proved useful in gauging what the students knew about the derivative and integral concepts at the beginning of the trajectory. On the whole, students exhibited notions of the derivative and integral that either relied heavily on algorithmic definitions or symbol-talk, or had appropriate notions of both concepts sufficient for them to develop an understanding of the relationship between them. (See table 5.39). Student notions of the Derivative Data Derivative is a mathematical equation or constant obtained after differentiating (from Student 7 s and Student 9 s responses) Claim Reliance on algorithmic processes and definitions symbol task The derivative is a measure of how a function changes as its inputs change (Student 15 s response) -more sophisticated notions of the derivative Student notions of the Integral Data This is the integral of f(x) between the points x=a, and b=x (Student 8 s response) Claim Reliance on algorithmic processes and definitions symbol task (b) Considering y=f(x) if for example the area is divided into n parts of equal widths then the area of an element is f(x)dx the summation of the elements will be x=b in the limit of dy 0 (Student 10 s response) Table 5.39: The first HLT -more sophisticated notions of the integral Student initial notions of the derivative and integral I needed more information about a starting point so I used the first HLT as a source for identifying aspects on students reasoning I could build on. The initial task (Reasoning with graphs) or the Phase I task, required students to analyse a statement and construct a graphical model of the motion of two animals in order to make a realistic decision (in order to determine if the cheetah caught the zebra) (section 5.3). The remaining tasks were developed to guide students towards the projected goal of understanding the FTC expression, starting with making students aware of how to quantify change: (Keeping track of change). Thereafter, the intention was to introduce them to rate-of-change: (Introducing average and instantaneous rate-of-change), (Phase II) and then to the derivative-integral relationship in the 240

253 last two tasks: From distance to speed and from speed to distance (Phases III and IV). Students responses for the second task in the HLT revealed that they tended to concentrate on computational/operational aspects rather than on the conceptual aspects of the learning tasks. They seemed more interested in extracting the numerical values rather than in identifying the variables involved, how they linked to the changing quantities, and how they could be used to define the given functions. The six students participating in the first HLT did not seem to view the information provided as measures of some kind of change in a variable quantity. In terms of the graphical construction, students could not systematically differentiate and compare or coordinate the aspects involved (time, distance, and velocity) physically and graphically (see table 5.40). Data Claim Students were unable to systematically match corresponding aspects from the given situation to corresponding graphical representations Table 5.40: One student s graphical representation of activity 1 A typical student s graphical representation consisted only of one curve, giving an indication that in their reasoning, students had not separated the motion of the two animals. They were not able to compare changes/variations, systematically and could not match corresponding aspects from the given situation to corresponding graphical representation. The students needed guidance in terms of what to focus on. They also needed reference points for the graphical construction. It proved difficult to introduce the two Calculus concepts (derivative and integral) as tools which could be used to solve the referential problem. As a result, it was demanding to move students into Phase II, III and IV, the quantification and the closing phases. From an instruction design point of view, my attempts to introduce the notion of the difference quotient as a simple geometric (shape), and the notion of the area under the 241
254 curve as a sum of accumulating rectangles, were not successful. At this stage, the learning activities were rather disjointed. I needed a theme to connect the activities into a coherent trajectory. In this first phase, I tried as much as possible to include mobile activities but students did not engage with most of them. Two initial challenges resulted from this first design experiment: a) a need to support changes in the way students viewed Calculus; b) streamlining the activities so that they formed an actual trajectory. One major drawback was the lack of opportunities for discussions. (c) The second HLT The instructional goals and the starting point were slightly better delineated for the second HLT. This group of students had a tutor interacting with them. Even though s/he did not interfere with their responses, there is marked difference in that with this second HLT the responses had more detail. The sequence of the learning activities was now more in line with the suggested phases. Following the pre-test, was (Phase I): Reasoning with graphs (task B); (Phase II): Rates of change with (task C -the water problem and the derivative function (task D); (Phase II & IV): Accumulation of change and rate-of-change of accumulation in (Task E) - Area and the Fundamental Theorem of Calculus. The initial referential activity was somewhat modified and included hints guiding the students to draw two curves. There was a visible shift in the students constructions as most their constructions now had two curves, (one curve for each of the animals). One could now claim that the students were able to match aspects in a physical situation to corresponding aspects in a graphical representation (see table 5.41). Still, students had difficulties comparing each animal s rate-of-change and accumulated distance, in order to make deductions as to whether the cheetah caught the zebra. The transition from the referential activity to the general activity in (phase II) was problematic. It is difficult to make decisions and evaluations about each individual s HLT, and later use this information to develop a standard (or hypothetical) trajectory that is used by the majority of students. However, this approach to instructional design is still better than the traditional approaches to instructional design that we currently use, where design decisions are based on the interpretation of the tutor mostly, with very little input of how students react to the designed learning materials. 242
, which was then combined with the responses")
255 Data Claim Students were able to match some of the aspects in a physical situation to corresponding aspects in a graphical representation Table 5.41: One student s response to the first activity In the next section, I describe Student 10 s reasoning and response to a part task C, (the water problem), which was then combined with the responses of other students to make a final contribution to improving the HLT. This illustration is an example of how other deductions concerning student reasoning were made. In this task students were required to imagine water flowing into three containers (a cylinder, sphere & cone), and represent this information graphically with explanations, (figure 5.42). Figure 5.42: Three containers filling with water The objective was to have students experience the process of analysing two changing quantities, so as to develop covariation reasoning abilities before embarking on the process of quantifying the rate-of-change and accumulation formally. My conjecture was that if students distinguished between the independent variable (volume) and the dependent variable (height) in the water problem, they would be able to recognise the volume-height functional variation relationship and its representation. Eventually, they would be able to transfer this type of reasoning to the relationship between an accumulating function and its rate of change. 243
 reasoned that the relationship between the volume flowing into the cylinder and its height was linear because the radius of the cylinder was constant.")
256 Figure 5.43: Student 10 s responses to part of task C On this item, student 10 (figure 5.43) reasoned that the relationship between the volume flowing into the cylinder and its height was linear because the radius of the cylinder was constant. His/her assumption was that the radius of the cylinder influenced the volume which depended on the height. Since volume is directly proportional to the radius of the cylinder, that means the as the height of the water increases, the volume also increases at almost the same rate therefore giving the graph those line passing through the origin. The common assumption is to have the height as the dependent variable and the volume as the independent variable. On the second item, Student 10 tried to extend the direct proportionality relationship between the volume and the radius to the sphere situation but was unable to systematically coordinate and represent the variations in the two variables: Since volume is directly proportional to the radius, as the height increases,the volume increases but slower than the height, but halfway, they are practically increasing at the same rate at which the volume is increasing is slower, which gives me such a graph. Student 10 maintained the direct proportionality relationship between the height, the radius and the volume for the cone while attempting to explain the effect of the changes in the radius on the varying heights and volumes. Since volume is directly proportional to the radius, then as height increases, volume also increases but at a slower rate due to the small radius, but as the level or height reaches maximum, the height and the volume are practically increasing at the same rate or volume might even be faster due to the maximum radius of the cone. Students 10 s inability to distinguish between the independent and dependent variables affected his/her coordination of 244
257 variable changes, and ultimately the dynamic functional relationships. This, in turn, would affect his/her adeptness to reason covariantly. The other students had very similar shortcomings. On the whole, students still experienced problems with forming dynamic reciprocal images of the derivative-integral relationship. In trying to attend to the details of each phase, the continuity in the trajectory was getting lost. It was also clear from the responses at this stage that students had not formed appropriate images of the function concept. Moving on to the final Phases (III & IV), the learning activities were still not evoking students to form images of the difference quotient as an average rateof-change as a foundation to an introduction to the instantaneous rate-of-change (derivative). The activities were leading students towards visualizing an accumulating quantity as multiplicative constituted and that these constituents could be represented as the area under the curve. I needed to refine the learning activities and generate a simple coherent structure. The transitions from one phase to another were table. The reciprocal nature of the derivative-integral relationship was not adequately addressed. A lack of a mechanism for facilitating student-instructor transactions was affecting student development of the relevant concepts. In a standard design experiment, the teacher would have introduced discussions around the quantification of both the rate-of-change and accumulation to make the concepts clearer. Any web-based tool such as the one based on Tall s (2003) embodied approach (section 2.4.1) allowing students to visualize the rate-of-change and accumulation would have been useful at this stage. One positive outcome was Student 10 s remark on the usefulness of the activities: I think it s very good because these activities help you understand the depths of all these Calculus topics. Three shortcomings needed to be addressed in order to refine the trajectory; a) streamlining the activities; b) addressing the transition points between the learning advancement levels; c) introducing the reciprocal nature of the derivative-integral relationship. For these reasons, another sequence of activities was tested out in the third HLT. (d) The third HLT Given the results from the previous HLTs, I was still not very clear about how to represent the knowledge structure pertaining to the derivative-integral relationship in a way that would be helpful for instruction. I decided to adopt, in the third HLT, a strategy in which the derivative-integral relationship was introduced at the beginning of the trajectory and then unpacked using the sequences in Phases I to IV. Details of the final 245
258 trajectory are presented in section 4.3. To compensate for a lack of discussion points (tutor-student interaction points), notes were added at the beginning of the trajectory and hints were interspersed in the activities. Video clips were added to the online version to support students understanding. In the remainder of this section, I highlight three of Student 15 s critical moments of learning as he advanced through the designed trajectory. Student 15 began the learning exercise with quite a mature interpretation of the derivative as a measure of how a function changes as its inputs change and a normal definition of the integral (see table 5.23). His/her definition of the derivative could have served as a point from which discussions around distinguishing between independent and dependent variables in a functional relationship could have easily emanated. At the onset, Student 15 displayed an appropriate form of reasoning as observed from his response when asked to critique the question: A man drives 240 km in 2 hours. Therefore, it took him 1 hour to drive the first 120 km. S/he was able to discern that the statement would be true provided that the car was moving at a constant speed. Figure 5.44: Student 15 s responses to activity 1, HLT 3 In the exercise requiring him/her to organize, interpret and present information in a graphical format, (the cheetah- zebra question, section 5.5.2), his/her strategy involved first organizing the information algebraically before proceeding to presenting the information graphically (figure 5.44 above). S/he succeeded in the representation process but had difficulty with the interpretation. In another question where s/he was required to interpret from a graph (figure 5.44), s/he had a sense of what needed to be done, even though s/he chose a rather complex procedure I would put vertical strips in the graph such that they form the 246
259 trapeziums, and the strips must be equal in length, and calculate the area of each trapezium, hence sum up the areas of the trapezium to determine the distance travelled. Throughout the learning exercise, Student 15 continued to demonstrate that s/he knew the mathematical notations and rules. For example, s/he could determine the accumulation function g(x) (figure 5.54) even though at times s/he made syntactical errors (see table 5.32). His/her main challenge concerned conceptual understanding. This was true for the remainder of the participants. Most of them could reproduce the symbolic notations and 'grammatical rules' by which these symbols may be manipulated without understanding the underlying concepts to which they referred (Swan, 1985, p.6). My conclusion from this last HLT was that the initial end goals of having the students come to a more sophisticated understanding of the derivative-integral relationship using a single HLT was quite ambitious. At the end of the trajectory, students could not satisfactorily use the FTC relationship to solve related Calculus problems. They were unable to operate with the expression as an object. The process of developing this understanding would require the refinement of the subtrajectories for each of the four Phases I - IV before a final consolidation into a working trajectory. The phases would be re-arranged as follows: Phase I would be an orientation for students to practice reasoning with functions and functional relationships and their graphical representations Phases II and III would have as their end goals students mastering the representation and symbolization processes with a focus on having students develop covariation reasoning skills focusing on developing: - an image of a rate-of-change in Phase II - an image of the accumulation function in Phase III The consolidation of the derivative-integral relationship would then follow in Phase IV. A number of revisions are needed to streamline and tighten the trajectory, especially at the transition points between phases. In future experiments, I would spend more time on trialling the last consolidation phase, after having made sure that the first three phases are mastered. The results presented indicate how students studying at a distance could be supported in better understanding the derivative integral relationship if the conditions for tutor-learner support are favourable. 247
260 The next section is a discussion of the envisioned HLT that would support that understanding The final envisioned HLT A summary of the final envisioned HLT is presented diagrammatically in figure This reconstruction is based on the results of the study. The goal of the HLT would be to motivate students into using curve (graph) sketching for developing increasingly refined conceptions of the derivative-integral relationship. Those activities that were not so effective in the trajectory have to be omitted. Some activities have been refined and new ones integrated. As it stands, the trajectory is not final. The conjectures are still hypothetical and there is high possibility that some of them will be refuted in further rounds of design experiments. The trajectory should unfold over four main phases; (a) Phase I orientation to the representation of a changing quantity in terms of functional relationships; (b) Phase IIrepresentation and symbolization of a rate-of-change function; (c) Phase IIIrepresentation and symbolization of an accumulation function. (d) Phase IVconsolidation of an understanding a formal expression of the derivative-integral relationship in the FTC equation. According to Swan (1982), mathematics is a powerful language for describing and analysing phenomena and should be taught in a manner emphasizing its use as a means of communication, while simultaneously paying attention to students mastery of its symbolic notation, rules and concepts. This project has been an attempt at adopting a similar type of communicative approach to teaching mathematics at a distance. The project was a trialling exercise of designing a remedial unit for introducing Calculus in a form of discussion around a function-pair. This approach has two benefits. It highlights the centrality of the function concept. It also starts students thinking about the reciprocal nature of the derivative-integral relationship right at the beginning of the unit. The trajectory s foundation is the analysis of a function-pair in order to get students to start thinking about the role of each side of the pair. An outline of the envisioned HLT is presented in Appendix G. 248
. 1) Analysing the different aspects of a varying quantity.")
261 Figure 5.45: Final envisioned HLT The envisioned HLT begins with the pre-test as before, a few modifications, and one extra question. The envisioned trajectory would have five main learning activities (Appendix G). 1) Analysing the different aspects of a varying quantity. The starting point in the orientation phase would be a set of activities encouraging students to explore the relationships between events and their corresponding graphs in a realistic context. One suggested starting activity is a revised water problem (Task C, second HLT) with exercises drawn in from Swan (1982). Water would be flowing steadily into bottles of different shapes and sizes and the student would be required to construct and analyze graphs showing how the height of the water varies as the volume in the bottle increases. The emphasis would be on making sure that students identify the aspects in the varying quantity which are changing and represent them graphically. The aim would be to have students learn to reason about how changes in the dependent variable are affected by changes in the independent variable in situations where these changes occur simultaneously. The ultimate goal would be to have students attaining MA5 reasoning, where the construction of an accurate curve is accompanied by a demonstration of an understanding of how the instantaneous rate of a varying quantity in question changes 249
262 continuously over the entire domain (Carlson, 2002, p. 15). Students would engage with the acts of observing, discussing, sketching and interpreting from graphs. Additional activities involving distance -time graphs can be added to facilitate student learning. 2) Predicting whether the cheetah catches the zebra using graphical representations. The prediction question would be preceded by a question with a descriptioninterpretation exercise to make sure that students are comfortable with interpreting from graphs. When predicting whether the cheetah catches the zebra, students would need to find a way of analysing the motion of each animal so as to compare how fast each travels, providing an indication of the accumulated distance each animal covers in the given time period. In most instances, students would try to work out the answer using algebraic manipulations. This would be an opportune moment to demonstrate to the students that algebraic manipulation would not suffice unless both animals were travelling at uniform speed. The students could then be encouraged to run through the strategy using curve sketching. A modified version of the activity with inputs from the Freudenthal Institute is presented in Question 2b (Appendix G). Students would need further guidance in terms of how to identify reference points from which to draw the two curves and make the comparisons. They would most probably construct different graphs, either distancetime or velocity- time graphs. A critique of the curves would be used to draw students attention to what the curve signifies and how this information is important for representing a model for analyzing varying functional behaviour. The activity should stimulate a need for using Calculus techniques for solving the problem. 3) Explaining the notion of average rate-of-change and the idea of an instantaneous rate-of-change The students experience of analysing the different aspects of a changing quantity, combined with the prediction activity, would form the basis for visualizing the difference quotient as a tool for quantifying rate-of-change. Applets such as the one developed by Doorman (2005), available at /toepassing_wisweb.en.html, can assist students with developing this image. A strategy is required to have the applets function on both an online environment and the mobile phone for those without internet access. A modification of task D (section 5.3.4) and activity 4 (section 5.4.5) together with a selection of activities from Swan (1982) 250
 Characterizing the accumulation function from given illustrations and/or examples.")
263 can be used afterwards to explain the idea of an instantaneous rate-of-change. The two examples of accumulating distance and volume can be carried through the HLT. Figure 5.46: An applet for reasoning about the rate-of-change 4) Characterizing the accumulation function from given illustrations and/or examples. The HLT would aim to have students link the measure of a rate-of- change with a measure of accumulation. In order to visualize a connection between the derivative (function 2) and the integral (function 1), students would need to see that the derivative is represented differently on the two graphs (see figure 5.4.7), and then shift their reasoning to a graph on which the derivative is a height and the accumulation function is represented as an area. Activity 3 (section 5.4.4) would have to be modified to allow students to make predictions about the accumulating quantity, and then compare their predictions with graphs illustrating the accumulation function in a specified interval. The anticipation is that in comparing their prediction with actual graphs, students would learn to associate the rate-of-change with the height, and the rectangle (area) with a multiplicative quantity (the variable on the x-axis multiplied by the rate-of-change on the y-axis). My initial expectation that students would construct this visual relationship on their own was unrealistic. More exercises are required at this stage to bring about the desired understanding. 5) Recognising the inverse character of the derivative-integral relationship in the FTC expression. The last activity 4 (section 5.4.5) can help students consolidate the ideas presented. The motion problem and the water problem (figure 5.61.) are activities in which the 251
 would assist with a visualisation of the FTC relationship. Figure 5.")
264 FTC expression can be elaborated. An applet developed by Kreider and Lahr (2001) at Dartmouth college ( (figure 5.47) would assist with a visualisation of the FTC relationship. Figure 5.47: An applet for reasoning about the FTC This could then be followed by an activity such as Hoffkamp s (2010) activity (figure 5.56) for consolidating an understanding of the FTC expression Challenges of RME adoption The challenges of RME adoption in a distance learning environment are difficult to eliminate but the challenges I encountered are summarized below: Challenge 1: Locating starting points and selecting appropriate learning activities for the HLT was a challenge to me as a researcher and instructional designer. This is a learning area I had not been practicing in for some time. But this challenge is not an uncommon to instructional designers as we are normally not content experts in the areas but rather work as didacticians. Challenge 2: Students in general, (including those studying at a distance), have not had opportunities to learn mathematics using inquiry-based methods. It will take a while to push distance learning into such a direction. However, the availability of accessible technologies will make this a reality. Challenge 3: The lack of a platform allowing for student-tutor interaction and an efficient mechanism for observing and maintaining this interaction. It is relatively easy to observe a group of students interacting in classroom. It is more difficult to observe students learning individually with predominantly print based learning materials. 252
265 5.8. Conclusion Concisely, my claim is that students can learn to reason about accumulating quantities and use this knowledge to develop an understanding of the derivative-integral relationship in the FTC expression, if an HLT comparable to the one suggested in section is used. The HLT offers an empirically based framework of how students may learn to reason about the FTC expression. The framework is not at the stage where it can be described as a local instruction theory. The sequences of activities and the associated supporting resources require refinement and further testing with more students and tutors to warrant a description of an instruction design theory. Of particular future interest is the development of a supportive web-based mobile learning environment that can fend for learner achievement within a distance learning situation. A team of researchers including content experts, programmers and instructional designers are required to test, develop and refine the HLT. In this project, I underestimated the type of effort, time and, especially resources required to carry out such an undertaking. The results presented in this chapter outline my attempt to use RME as an instruction design approach to introducing Calculus concepts when teaching at a distance with a mixture of results.students participating in the design experiments were placed on a path towards developing mathematical forms of reasoning about the FTC relationship, but this was not completely achieved. Much more still needs to be done in terms of refining the learning activities and testing them in a distance learning context. The series of design experiments have revealed knowledge about student reasoning in this learning domain in relation to four main areas of quantifying change, curve sketching, general mathematical reasoning and symbol use. Students struggle with processes of assigning measures to aspects of variations such as rate-of-change and accumulation. Students require assistance with techniques for categorizing variables such as tables to help with curve sketching. Students need a lot more exposure to types of inquiry-based activities to simulate deeper reasoning processes essential for conceptual understanding of both the derivative and the integral. The symbolization steps from intuitive reasoning to the formal processes of differentiation and integration and the relationship between them require more attention. The analysis results of the design experiments have improved the design of the HLT in that as a researcher, I am clearer about the starting point, choice of learning activities, the structure and sequencing of the HLT and the overall approach to instructional design for distance learning. 253
266 These results are summarized in the next chapter VI. 254
267 CHAPTER VI OUTCOMES AND CONCLUSIONS 6.1. Introduction The rationale for this study emerged from a realization that conventional instructional design approaches for introducing Calculus concepts, based on the logical sequencing and structuring of the mathematical concepts, did not adequately attend to, or addresses students ways of thinking. This was particularly important in a distance education environment where learners depend on instructional text to make sense of what is being presented, often without support from tutors. The instructional design theory of Realistic Mathematics Education (RME) was a promising approach for designing learning sequences based on actual investigations of the ways in which students think. In RME, learning mathematics would be based on student reconstruction of mathematical concepts in a process termed guided re-invention (Freudenthal, 1981, Gravemeijer, 1994). The design experiment methodology (Chapter IV) was applied in this study because it provided support for the development and testing of the HLT. This was a hypothetical path learners would take to master the concept in question. This study s focus was on trialling the process of RME theory-based design using the Fundamental Theorem of Calculus as an example. The main research question was formulated as follows: How, and to what extent, can the RME theory be used as an instructional design perspective in a unit introducing the relationship between the two basic Calculus concepts (the derivative and the integral) through distance education? Applying RME meant beginning the path towards developing a local instructional theory and adhering to methodological guidelines for further development (Gravemeijer 1999). In this study, the outcome has been an envisioned HLT. The HLT developed can be used as a framework for developing a remedial module for existing undergraduate students or as a preparatory unit for pre-college students. A provisional arrangement had been to develop mobile learning mechanism to allow for tutor-learner interaction. However this did not materialize exactly as planned. The main research question was broken into three sub-research questions 255
268 What does it mean to understand the derivative-integral relationship expressed in the Fundamental Theorem of Calculus at the undergraduate level? How can an introduction to this understanding be supported using the RME theoretical perspective at a distance? How does a group of students studying at a distance reason about the derivative-integral relationship? What are the advantages and disadvantages of adopting RME as an instructional design perspective for teaching Calculus at a distance? (section, 1.5, this dissertation) The rest of this chapter is a presentation of responses to these three sub-questions. It is an elaboration of the results presented and discussed in Chapter V combined with discussions in Chapters II, III and IV, in relation to the questions defined in Chapter I. The research implications and recommendations are presented in the last section Research Question 1 What does it mean to understand the derivative-integral relationship expressed in the Fundamental Theorem of Calculus at undergraduate level? Systemizing the derivative-integral relationship Understanding of the derivative-integral relationship in the Fundamental Theorem of Calculus expression infers that one is able to recognize and make sense of the mathematical objects in the expression, and re-construct the relationship between the properties of these mathematical objects appropriately. The level of appropriateness depends on how the system in which the expression is embedded is organized. One can characterize understanding by describing the system (Lidstone, 1992), or in terms of the organizing process or systemization (Klisinska, 2009). Lidstone (1992) refers to the resulting organized structure of concepts and methods as a symbolic technology (section 1.3). This technology offers a language for quantitatively representing and describing dynamic situations and how they change. In that regard, the symbolic technology of the derivative is different from that of the integral. While the technology for the derivative will be a description of the method(s) for determining the limit of a difference quotient, the technology of the derivative is slightly more complex. An example of a technology for determining the integral is one which involves partitioning a boundary, framing a sum and then determining the limit of the sum (section 2.1). Even though these two technologies differ in how they are 256
269 organized, they are unified by a common object of focus - the function. That is why an understanding of the derivative-integral relationship presupposes an understanding of the functional concept. The processes of differentiation and integration are described as they apply to functions (section 2.2.3). What makes an understanding of the derivative integral concept even more complex is that the function concept has a symbolic technology of its own. Functional expressions contain independent and dependent variables changing in relation to each other. Moreover, the methods of analysing these functional expressions differ. One can analyse these functional expressions using numeric categorizations such as tables, algebraic formulations or graphical inscriptions. How these entities and relationships are systemized affects their understanding. Klisinska (2009) proposes that the systemization of a body of knowledge can occur in two ways, by way of hierarchy, for example embedding Calculus in analysis and then in functional analysis, or by technologies, as when classifying differential equations by types of equations with different techniques to solves tasks (p. 122).The FTC unites two different sets of technologies (derivative and integral systemization). A hierarchical classification would place one technology over the other. A technological can be approached from a structural level (technology), or from a process level (technique). The FTC usually appears in two parts. The first part:, clearly shows a mathematical object with distinct properties, whereby a function is depicted as the derivative of an integral. The second part:, is the computation which provides a technique for evaluating a definite integral. Building an understanding the derivative-integral relationship relates to the tension created by asking oneself whether one should build an understanding of the parts making up the system before coming to an understanding of how the system works, or vice versa. In addition, there is the added challenge of selecting which parts form the fundamental building blocks of the understanding required. In this study, systemizing the derivative-integral relationship has been greatly influenced by a deliberate choice to focus more on the character of the learning activities (content, phrasing) rather than on the mode of delivery (print, web-based, mobile learning). This choice is a direct result of resource limitation. 257
270 Questions of how to build an understanding of mathematical expressions or concepts are typical instructional design inquiries. The difference in this project lies in how the responses have been developed. The first source of this understanding came from a literature review which comprised a historical review of the FTC development and a didactical analysis of selected texts. The second source of this understanding has been the response to the question 2 (section. 6.3) Learning from the development of the FTC expression History attributes the development of the formal model of the FTC to the intellectual contributions of Newton and Leibniz. In this project, my understanding of the FTC is largely drawn from Newton and Leibniz s contributions (section 2.1). I refer to the Riemann sum as modestly as possible, to introduce the idea of the integral as an area under the curve. I mention Cauchy and have used his formalized representations of the FTC but have not consulted his historical accounts. The work of Lebesgue surpasses introductory Calculus As it stands, the FTC expression has forms of representation; techniques characterizing its systemization and an embedded core idea underlying the derivative integral relationship. The rest of this section is a summary of these three aspects. (a) Forms of representation The FTC requires two main forms of representations for its understanding- graphical and symbolic. It is important to note that the forms of representation arose initially from a search for techniques to analyze changing quantities. For example, Newton s contributions stem from an analysis of motion. At a later stage, two problems (tangency and the area problem) become central to the evolvement of Calculus (section 1.3, this dissertation). Notational systems and symbols developed alongside the techniques for solving the motion problems, problems of tangency and quadrature. There was a progression from intuitive investigation of changing quantities, to quantifying change with variables, to the examination of curves, and then finally, to an analysis of functions. In these development processes, the operations differentiation and integration became formalized. The consolidation of these techniques into a unified FTC, allowing both for graphical representation (curve sketching) and algebraic manipulations stems from the work of Newton and Leibniz. For this study, an understanding of the derivative-integral relationship is built from an understanding of problems involving a function s rate-of-change and accumulation embedded in a process of curve sketching. The rate-of-change maps onto the geometric construction of the derivative as a tangent to the curve, while the accumulation function maps onto 258
271 the definite integral as the area underneath the curve. The representations are usually preceded by definitions. (b) Techniques characterizing the systemization of the FTC The common techniques characterizing the systemization of the FTC include, among others: defining the derivative and integral concepts, determining the slope, calculating an area, differentiating a function, integrating a function, conducting antidifferentiation, and so on. In most instructional texts, the definitions are presented followed by the theorem, examples, and the proof of the theorem. In this introductory unit, the proof of the FTC is left out. Often, students learn about the FTC by reproducing the techniques without knowledge of the underlying relationships. One could argue that this is acceptable at the introductory level of FTC learning, as what is important is the mastery and application of the technique, not the underlying theory. This contention is usually extended to an understanding of concepts which require the use of techniques or tools for their mastery. Is it the concept or the tool use which should be emphasized? Most teaching texts begin with an introduction to techniques and then introduce the symbolic notation while explaining and illustrating what the concepts are. The problem arises when the students are required to apply concepts in unfamiliar territory or justify their choice of strategy when solving particular problems. They lack some grounding schema or organized framework from which to make sense of a concept. In the analyses of the three HLTs of this dissertation, one of the challenges has been, and remains that of getting students to acquire a coherent cognitive framework from which the required reasoning and understanding could develop. In an RME-inspired approach to instructional design, students should engage with problems from which an understanding of the derivative-integral relationship is evoked. In the case of FTC, these could be problems where students go through a process of developing techniques for working out the distance, or determining an area from information given about the changing velocity of an object within a specific time interval. This could then lead to the co-evolvement of the symbolization and conceptual understanding (section 2.5.2). One entity central to an understanding of differentiation and integration is the limit. Historically, after a period of the development of Calculus techniques for manipulating infinitesimal, the limit concept became the unifying idea of Calculus. The limit concept is a mathematical dynamic thought process that explains and justifies why the derivative and integral exist. However, due to the difficulty students encounter while 259
272 studying this concept (section 2.4.2), I made a decision to refer to the limit concept in the developmental notes of both the derivative and the integral but avoided making it the central idea. An investigation involving the limit concept would have to involve mathematical experts conversant with the pitfalls of teaching this concept. In this study an attempt has been made to introduce the derivative-integral concept by exposing students to tasks involving the two concepts in an evolving HLT (section 5.3, 5.4 & 5.5, this dissertation). The greatest challenge has been in trying to embed the RME element of guided reinvention in the designing the learning tasks while addressing student learning challenges conveyed in the literature. A case in point is the Cheetah-Zebra task, the second HLT, (section 5.4, this dissertation). Instead of allowing the students to choose whatever approach (graphical, numerical or algebraic) to solve the problem, the guidance was targeted the graphical approach. With the time limitations, I was trying to find a point in the trajectory to address a conceptual learning problem of graphical representations (section 2.4.2, (c), this dissertation), rather prematurely. Achieving a balance of allowing student intuition to develop within the perimeters of a structured learning trajectory is an undertaking which has not been completely resolved in this project. (c) Embedded core idea underlying the derivative integral relationship. The central idea for this project was to bring about an intuitive understanding that differentiation and integration were inversely related. Newton s account of the FTC relationship consisted of a perception of integration as the process of constructing fluents from specified fluxions. Leibniz s version was based on an analysis of sums and differences, with differentials accumulating to form the integral. Both approaches converged to the geometrical problem of interpreting what the quadrature meant. To Newton, it meant finding the relation between a curves quadrature and its ordinate. For Leibniz, it meant finding a curve that had a given law of tangency. Leibniz had images of differentials accumulating to form the integral. For Newton, one could reconstruct a fluent quantity from information about its fluxion. History shows the derivative-integral relationship in the FTC evolving from intuitive ideas illustrated with graphical representations to the formal definitions. The major conceptual elements are the function, limit, derivative and integral. The deduction is that an understanding of the FTC requires a keen sense of the underlying idea(s), recognition of the main forms of representations involved, and mastery of specific techniques. This understanding is built from the ability to congregate all these ideas into a meaningful structure. The next section summarizes the conclusions drawn from the didactical analysis. 260
273 Teachings from a didactical analysis The didactical analysis aimed to uncover how other teachers and researchers had approached the FTC as a didactic object. At this stage, I wanted to find out about the structuring and sequencing of FTC content. I also sought to identify if there were epistemological obstacles and conceptual barriers related to learning the FTC and how these had been resolved in the past. This section is a summary of the conclusions drawn from the literature reviewed in sections 2.3 and 2.4. The first section concerns the structure and sequencing of the FTC. The second section addresses barriers to learning the FTC and how these affect understanding the FTC expression. (a) An approach for presenting FTC content In the four textbook materials analyzed, there were two distinct ways of presenting the FTC, as an object or what Klisinska (2009) refers to as a technology, or as a process, where the emphasis is on technique. However, within these two major distinctions, there were variations in terms of the focal teaching element and the learning goal. Table 6.1 summarizes the variations of approaches. Table 6.1: Approaches for presenting the FTC Author(s) Type of approach Teaching /learning goal. In the end students would develop James Stewart Process oriented with an an understanding that the integral of the rate-ofchange (1998) object view is equal to the total change.. Ostebee & Zorn Object oriented an awareness that a graphical interpretation of the (2002 rate-of-change of the area function is the height of Hughes-Hallett & et al., (1999) Process oriented the original function. the ability to determine a function, given its rate-ofchange given its rate-of-change to the The MALATI group Both process and object oriented. a conceptual introduction to the FTC In Ostebee and Zorn s approach, the FTC was viewed as a mathematical object connecting the derivative and the integral. Their presentation focused on the learner seeing the area function A f as an antiderivative of f. Graphically, the rate-of-change of the area function was the height of the original function. Stewart s approach was more process orientated in that the focus was students using the FTC as a tool for evaluating definite integrals. However, Stewart made sure that students were introduced to the structural component (an object view), of the derivative- antiderivative difference beforehand. Hughes-Hallett et al. s (1999) approach is a process oriented focusing on the function. The student learns how to determine the derivative, the integral, and then recovers a 261
274 function given its rate-of-change. The MALATI group s approach had elements of both an object approach in the form of students initial exploration of functions and functional relationships as mathematical objects. They then revert to the processes of finding the derivative and determining the integral. For this study an attempt has been made to accommodate both an object view to an understanding the FTC. This objects view - encompassing the main structural elements, and a process view involving the processes of differentiation, antidifferentiation and integration. (b) A Gateway to conceptual understanding of the FTC.The main two concerns stemming out of the didactical analysis literature had to do with first of all, the complexity of unpacking the FTC expression, as it involved unpacking and then rearranging a number of concepts and related techniques. The second concern was how to structure instruction in order to minimise students abrupt jump from intuitive to more formal ways of reasoning. Both Dubinsky (2000) and Tall (2003) recommend using approaches which build on human perceptual experiences to offer a foundation of leading to the formal approach. In Dubinsky (2000)s exposition, student programming was the foundation for making sense of a mathematical situation. Tall on the other hand, combined a human perception approach and the dynamism of the computer in order to use the magnification of the segment on the curve presented on a computer screen to introduce the idea of the limit. Both of these approaches require the use of a computer, which was directly used for this project. Dubinsky s (2000) assertion that understanding a mathematical circumstance and its formal expression required understanding both elements while maintaining a connection between the two cannot be overemphasized. It was not very clear how this could be achieved practically. In order to explain conceptual development, Tall s portrayal of a three phase world of mathematical representations (embodied, symbolic and formal), was a model useful for describing the development of mathematical thinking. In his terms, students development of mathematical thinking occurred when they made use of their set-befores (human mental abilities) such as recognition, repetition and language. However, according to Tall (2007), the actual cognitive development transpired when learners formed mental structures (met-befores) by engaging with instruction or through successive experience. Sfard (2001) supported this statement insisting that one makes sense of mathematical discourse only through persistent participation (p.17). Tall reiterated the concern stated at the beginning of this section that conflicts were likely to occur at the boundary between different worlds, 262
275 for instance, the embodiment and symbolic worlds. He also asserted that knowledge of the met-befores was crucial for instruction design. In section (2.4.2), obstacles to learning the FTC were explored. Three obstacles stood out: a failure to make sense of mathematical symbolism, difficulty with understanding the limit concept and problems with the construction of graphs. The literature exposed frameworks describing what should occur for student to develop an understanding of the FTC (Dubinsky, 2000; Tall, 2003; 2007; 2008; Carlson et al., 2001). The literature also contained conceptual analyses describing where students encountered difficulties when learning the FTC, and paths students should take to come to an appropriate understanding of this relationship (Thompson, 1994; Thompson & Silverman, 2008). However, there was a shortage of replicable examples of how students could be assisted in developing the required understanding. From an instructional design point of view, it made sense to consider the derivative and integral as tools for describing and organizing functional relationships between changing variables. The historical accounts indicated that the path to the development of the derivative-integral relationship in the FTC stemmed from intuitive ideas illustrated with graphical representations, into the symbolic notation and formal expressions used today. The function, limit, derivative and integral are the major conceptual building blocks. An understanding of the FTC requires students to develop a sense of the inverse nature of the derivative-integral relationship, by recognizing the main forms of representations (graphical and algebraic), and by mastering the techniques of differentiation and integration. Embedded in this understanding is an intuitive understanding of the limit concept. The progression towards an understanding of the FTC accommodates both a process view and an object view. The final reified mathematical is the result of the assembly of all the ideas into a meaningful structure. The next section summarizes the conclusions drawn from the response to the second research question. 6.3: Research Question 2 How can an introduction to this understanding be supported using the RME theoretical perspective through distance education? The RME approach (section 2.5.1) typifies Freudenthal s (1991) view of mathematics as a human activity integrated into normal ways of thinking. Entrenched in this activity are structural relationships of the mathematical entity and relationships linking the 263
276 activity to reality. The term reality refers both to physical entities and cognitive realities or thought processes. During the process of learning, the learner re-invents mathematics under the guidance of a tutor. In order to make sense of the mathematics, the learner has to re-construct the proposed content in their own personal way. RME offers a way of structuring this content in terms of processes of guided re-invention and emergent modelling. The learning activities follow a HLT designed to assist the learner to mathematize or form structural relationships horizontally, as links to reality, or vertically, in a process of reification Developing the HLT Learning trajectories are labels given to efforts to gather evidence of the paths students should follow while learning (Simon, 1995). Hypothesizing about these paths has its roots in the Piagetian Psychology of genetic epistemology (Piaget, 1977) of categorizing and characterizing stages of development of understanding. This process also draws from the Vygotskian idea of supporting or scaffolding learning development (Vygotsky, 1978). The learning trajectories are not entirely new concepts in themselves. Even in conventional instructional design, one utilizes the ideas of scope and sequencing to structure the learning content into an organized path the learner should take while studying. What is relatively new, especially within a distance learning environment, is the process of seeking evidence that students understanding progresses in a particular hypothesized way, and revising the trajectory if it does not. In the rest of this section, I summarize my attempt to achieve this undertaking, and give reasons where the planned efforts failed. Although RME studies are characterized by three main stages (preparation, design experiment, and a retrospective analysis), in this study these three stages overlapped with the actual design experiments, as the actual design process was iterative in nature. The study was broken down into three semi design experiments. The preparation stage overlapped with the first design experiment, and the retrospective analysis overlapped with the last experiment. The second and last trajectories were revisions of the first. The first draft HLT was informed by the literature review conducted on the FTC (Chapter II). At the end of each design experiment, aspects concerning the effectiveness of the HLT in terms of the projected goals were analyzed. Some practicality issues were also examined. The retrospective analysis was designed to gain further insights into the effectiveness and usefulness of the HLT. Details are presented in Chapters IV and V. 264
277 The main instrument has been the HLT itself as presented in the students workbooks. Data emerged from the evaluation of the trajectory as presented in the students work book, together with the assignments at the end of each learning unit. Other instruments were the pre-test and an interview schedule (Chapter IV). An interview schedule was used in the case of the second HLT. Participants were randomly selected depending on their willingness to participate in the study. No tutors were involved in the project except for the second trajectory where I required an instructor to oversee students engagement with the learning materials. The literature review contributed to the development of the first draft HLT for introducing the derivative-integral relationship as expressed in the FTC equation. The evaluation comments from two Dutch RME experts and one math lecturer were sources of consistency and validity. Consultation with mathematics experts is an area of weakness for this study and should be strengthened in the future. The conjecture guiding the instruction design was that an understanding of the inverse nature of the derivative-integral in the FTC expression could be brought about if students were guided through an HLT designed around the overarching idea of accumulation. The notion of a function pair, where one of the pairs was the derivative function and the other was the integral function, together with the covariation reasoning principle, formed part of this development. At the end of this study, the design process has produced a trajectory which will still require refinement. Another cycle of design experiments is still required to refine the trajectory. The next sections are summaries of the delineating a starting point for the HLT, designing the learning activities in and evaluating the HLT. (a) Delineating a starting point. The process of delineating a starting point was problematic. I had envisioned starting with an accumulating quantity such as water flowing into a container or a car covering a certain distance as starting points. In fact, the web-based version begins off with a video clip in which water is flowing into a tank. The first shortcoming was that I could not translate this into an actual problem where students would manipulate the changing levels of the accumulating quantity (either water or distance).this would have been followed by questions associating the accumulating quantity with its rate of change. Instead, I opted to start with an activity in which students were expected to construct graphical models comparing the motion of a cheetah chasing a zebra. The aim was to determine if they ever caught up (see sections 5.2.2, and 5.4.2). This activity was taken from work by one of the RME experts, Kindt (1979). 265
278 After analyzing the inputs from two RME experts who assisted with validating the questions, the learning sequence has been adjusted to begin with an activity involving the calibration of a bottle which requires students to reason about how the height of the liquid depends on, and varies with the volume of the liquid in the bottle. The activity is a modified version of the bottle problem (Task C, section 5.4.3) and has exercises in which students practice sketching graphs, as well as matching graphs with bottles. The activity is designed to assist student analyze the different variation aspects of a changing quantity and to begin to reason about changes in a dependent variable in relation to changes in the independent variable (MA5 Reasoning). The initial starting activity (the cheetah and zebra) is now the second activity. (b) Designing and evaluating the learning activities in the HLT.In this section, I summarize the outcomes of the evaluations of each of the learning trajectories in terms of instruction design (content and construct); student reasoning challenge and the practicality of adopting the trajectory. The first HLT was tested out with 6 participating students from Unisa (May 2009). The results of the evaluation of the outcomes of this first HLT can be summarized as follows (see also Chapter 5). Students were free to complete the tasks in their own time; there were no time restrictions. The pre-test given at the beginning of the trajectory revealed that students had some knowledge about the derivative and integral, but not sufficient about the relationship between them. The content and construct of the first HLT required more validation. For example, attempts to guide students into creating images of a quotient of differences in the changes or variations of two quantities did not work as planned. Students failed to view the Riemann sum as an object with which they could visualize an integral emerging. In general, the findings indicated that the HLT did not work as intended. Some changes were made to the trajectory as a result of student challenges. There were several problems identified regarding the students at the beginning of the design experiments - Students were not used to working with contextual problems. - Students initial images and interpretations of the mathematical symbols, mathematical definitions, and intuitive forms of reasoning were disjointed and not coherently linked to form one unified structure. - Students failed to recognize what aspects needed to be represented graphically. They found the interpretation of area under the curve and what the curve represents problematic. 266
279 - Students could not visualize the difference quotient as a reasoning tool, representing two variables changing simultaneously. - Students did not exhibit any sense of what the process of integration involved after the exposure to this activity. - No forms of MA (mental activity) reasoning could be discerned. - More effort was needed to acclimatize students to the RME approach. The presentation of the contextual problems should have stimulated this type of thinking but it did not. Instead, students felt that they were working out Physics, not mathematical problems. A lot more time should have been spent getting the students to familiarize with RME type questions. In terms of practicality, the results from the students evaluations (section 5.2.7) indicated that - Students found the exercises beneficial for revision as an introduction to Calculus concepts. However, the lack of a support mechanism meant that students could not be supported at those crucial teaching points. The second HLT was tested out with 6 participating pre-college students from Uganda (January, 2010). A tutor worked with the students in term of administering their participation and ensuring that they completed all the activities. No training about the RME theory was given to the tutor. The following summarizes the results from the evaluation of the development and testing of the second HLT. The content and construct of the second HLT was improved in terms of focus and alignments especially with the first two activities (task B and task C), but it would have been further improved with further consultation with experts. There were problems at the points of transition from one activity to another. The activities did not offer ample opportunity for students to operate in the world of physical objects, and then afterwards to transfer the observations and experiences gained into the world of formal mathematics. The learning environment did not have the tools to support these transactions. Apart from slight shifts in terms of constructing appropriate graphs for task B and reasoning with graphs in task C, the findings indicated that, on the whole, the HLT did not work as intended. Some changes were made to the trajectory from the analysis of student responses. Students still had the same problems of getting used to the RME approach as expressed by students participating in the first trajectory but their 267
280 complaints in this regard was less pronounced. As an instructional designer, I had gained a little bit more experience in drafting RME questions and some of them had improved. However, the design highlighted other problems which had not been visible before. Students produced better graphical representations and could reason better with graphs but still displayed some weaknesses. - Students had not developed an appropriate image of the function concept in which a function was portrayed as a unit capable of accepting variable inputs, with the objective of transforming them into outputs. - Still, students could not create stable images of an average rate-ofchange in which the covariation of two changing quantities could be constituted. - Students could not coordinate the process of changes in one variable with another; they also had problems differentiating between the dependent and dependent variables. - Students failed to visualize an accumulating quantity as composed of a multiplicative structure. - Students could not build for themselves systems for expressing the average rate-of-change leading into an understanding of the instantaneous rate-of-change. - Students needed to change their orientation towards learning mathematics in order to grapple with the key connections and patterns required to understand the Fundamental Theorem. With regards to the practicality of the unit, students felt that they learnt some new concepts such as the Riemann sums, and also came to understand the Calculus concept better. Students valued RME inspired activities as these allowed them to think deeply about what they were learning. Students also felt they had time to address some of the inherent problems they faced such as graph construction. Students from this group welcomed the mobile learning activities. The third version of the HLT was tested out with three students from Unisa (July 2011). A summary of the results from the evaluation of the development and testing of the third HLT follows. This time, the construct and content of the HLT was more refined in that: 268
281 - The goal was clearly defined. The goal was to assist students to develop an understanding of the inverse nature of the derivativeintegral relationship expressed in the FTC. - An overarching idea had been identified. The overarching idea was that of the accumulation of a quantity within a specific interval. - A strategy underlying the instruction design of the learning activities had been identified. This strategy involved getting students to view the derivative and integral as a function pair. This way, they would build an understanding of functions and, at the same time, compare the derivative and integral both as mathematical objects, and as tools for transforming functions. - I had a clearer sense of the target form of reasoning (covariation ) and how students could be supported in developing this form of reasoning. - I had an understanding of the cognitive skills student needed to acquire in order to come to reason about the FTC expression coherently. Students required a lot more with activities involving curve sketching as a platform to support the development of an intuitive understanding of the inverse relationship between differentiation and integration. The HLT was going to have to support the following elements. With regards to the practicality of the unit, students felt the activities helped them think deeper about their learning. However, there was a tendency to rush to complete the assignments without having read through the content thoroughly. Students tended to prefer the printed version to the mobile version. A representation of the final envisioned HLT version appears in section The full outline is available as Appendix G RME heuristics In this section I briefly reflect on the RME heuristics of Guided reinvention and Emergent modelling, and provide short description of the historical analysis and didactical phenomenology, and how I tried to include them in the instruction design. (a) Guided Re-invention. The intention was to have student s think creatively, openly, and independently. All the four major activities were framed so as to evoke the students into inventing their own diagrams and solutions. In some instances, such as in the case of the first activity, the addition of prompts and rephrasing of instructions 269
282 helped the students construct models on their own. In other instances, especially, where I tried to incorporate descriptions and explanations into the text to make the reading friendlier, this did not work very well. Rasmussen (2009) suggests the idea of creating Generative Alternatives whereby the teacher introduces alternate symbols or representations to evoke student explanations in instances where students face blockages. This is a crucial point where learning in a face-to-face environment differs from learning within a distance learning environment. A more structured way of inserting prompts and orientation is required to shift students into a habit of working with mathematical problems creatively without the support of a tutor. Future plans include the use software tools to give direction, but allow room for individual constructions. The other part of the guided re-invention heuristic involved the structuring and direction setting students required to progress through the different levels of progressive mathematization. Attaining a balance in instructional design where students have autonomy supported with guidance of a teacher is quite difficult to effect at a distance. For example, in the third trajectory, the teaching text was inundated with hints, thinking that this would provide more guidance for the distance student. A substitute for the teacher is required, even if it is in the form of pre-recorded video or audio segments of the tutor providing some alternative route. Preferably, some form of actual tutorstudent interaction could be included through the use of available technologies such as or the mobile phone. My conclusion was that guided re-invention was a difficult heuristic to attain in distance education. (b) Emergent modelling. Within the RME framework, models are vehicles for representing problem situation and support the advancement of vertical mathematising. Van den Heuvel-Panhuizen (2003) compares this notion to Vygotsyky s (1978) scaffolding. If identified correctly, models can fulfil the bridging function between the informal and the formal level: by shifting from a model of (Van den Heuvel-Panhuizen, 2003, p.14). It is possible for students to come to an understanding of the FTC expression through model building, and I initially attempted to draw up one model building plan (see section, 4.3.2). However, it became apparent that one required several model of/model for sessions to get a full understanding of the FTC, at least one for the rate-of change, another for the accumulation function and the final one for the relationship between the two. Identifying and coordinating the mathematical structures and concepts involved was a complex undertaking. It requires several lessons and a varied number of transition points along the lines of the FTC framework 270
283 illustrated in table 2.3. Just like the re-invention heuristic, the emergent modelling heuristic proved difficult to attain. The historical analysis provided ideas for formulating the HLT. The idea to start the HLT with a prediction activity using the zebra and cheetah to support initial reasoning about rate-of-change and accumulation comes from realizing that historically, mathematicians and scientist started off the reasoning processes with predications and estimations before deriving precise formulae and answers. The idea of leaving out the limit definition until after an exploration of the derivative and integral concept in the trajectory was also adopted from history. A didactical phenomenology (2.4.4.) offered a mechanism for deconstructing the elements within the FTC expression, allowing me to think of how these elements could be reconstituted to design a short, uncluttered an intuitive introduction to the FTC Symbolizing A conception that was not explored in some depth, especially in relation to designing and evaluating activities involving curve sketching, is that of diagrammatic reasoning (Bakker, 2004). This process has three steps; constructing the diagram, experimenting with the diagram, and then reflecting on the results of the experimenting process. The underlying explanation is derived from Bakker s (2004) interpretation Pierce s conception of signs and symbolizing. This is a conception where the sign exists in a triadic relation with its object and interpretant. Not only does this structure offer a way of organizing the instructional activities, it also offers a means of analyzing the symbolizing process. For example, a graph is a diagram, or a sign with indexical and symbolic elements (Bakker, 2004, p. 193). According to Pierce (in Bakker, 2004), a diagram has an indexing function that points to a certain direction, as well as an iconic function as it represents relations. In the activity involving the cheetah and the zebra, students were asked to construct graphs representing the motion of the two animals. It is possible to draw initial conclusions about the way student 2 and student 15 responded by analyzing their diagrams.it would have made better sense to structure the questions so as to lead the students through an experimental, and then a reflective stage. This would have assisted in evoking the kind of reasoning required, while eliciting information about their ways of reasoning and points requiring support. The questions following the presentation of the initial problem of the zebra and cheetah would need to be modified according to the diagrammatic reasoning model, where the 271
284 emphasis is on doing something while thinking and reasoning with diagrams (Bakker, 2004, p. 194). A cheetah is awakened from its afternoon nap by a zebra's hooves. This zebra is travelling at its top speed and still has plenty of energy to maintain this speed. At the moment, the cheetah decides to give chase, the zebra has a lead of 200 meters. Note: A cheetah can steadily reach a speed of 100 m/s in 2 seconds and can maintain that speed for a long while. The zebra, whose top speed is 50m/s, can maintain this speed for more than 6 km. Taking into consideration the above data on the running powers of the cheetah and the zebra,...can the cheetah catch the zebra? In the modified version: Step 1 would involve the construction of the diagram(s), using the functional relationship language. Here, one would be able to have a sense of the relations students consider significant in the problem. For instance, in this particular problem, it was important for students to realise that they had to construct two curves. The instruction would still remain the same. - On the same graph, draw graphs of speed versus time for the two animals. Let and Step 2, the experiment stage, would achieve two aims; - to introduce the representational system (of curve sketching) and the companying rules including those aspects students found difficult such as identifying the independent and dependent variable, choosing a scale, and identifying a starting point - to guide students into a process of selecting an interval from which to start the comparison and organisation. The modified questions for introducing the representational system would read: - What values are you placing on the x-axis and the y-axis and why? - What has guided the choice of your scale? - What is your starting point? Is it (0, 0)? If not, why have you selected another point? 272
285 Questions guiding students into selecting an interval for comparing the motion of the two animals would read: - Can you identify the point where the zebra is at the time the cheetah starts moving? Can you identify the point where the zebra is at the time the cheetah reaches its top speed? Step 3 would be the reasoning step where a need should be felt to construct new objects. In this case, there were two objects, one representing a rate-of-change and another representing the accumulation (distance) for each of the animals. This would have been the step where students would begin the symbolizing process, whereby they would go through a process of hypostatic abstraction (Bakker, 2004). Only then would the discussion of the responses to the question: -...can the cheetah catch the zebra?: commence. In a semiotic context, the outcome of a hypostatic abstraction is an abstract noun which replaces the predicate. In a mathematical reasoning context, this outcome can be considered to be a thought object. If we shift this reasoning to the context of the motion of the two animals, there were two possibilities. In one, there was a possibility of students moving from questions of how fast to an abstraction of the fastness of each of the animals. In the second, there was a chance of students progressing from asking how far to constructing images of the accumulated distance. If, for instance, students had taken the route of constructing images of the accumulated distance, they would have symbolised this entity by making a sign, possibly as a shape such as a rectangle, and then interpreted it as standing for an object (accumulated distance).the difficulty for such an interpretation is that although one aspect of the rectangle its width stands in for a relatively straightforward aspect (the time interval), the other side its height represents another aspect (rate-of-change) which is constituted from a changing ratio. After this point, the HLT should have been designed in a way that allowed the processes of experimentation with the diagrams and the reflection on the results, to lead to particular observed aspects becoming points of discussion, further abstraction and symbolization. In the envisioned trajectory, it is this element of pinpointing, and developing a discussion around a point, that is the missing link in the distance learning environment. When designing learning sequences at a distance, one has to anticipate and then immediately supply feedback without checking what the actual responses at these crucial points are. This is where a carefully designed mobile learning 273
286 environment would have assisted in the process. The next section summarizes an exploration of the mobile learning inclusion Research Question 3 What are the advantages and disadvantages of adopting RME as an instructional design perspective for teaching Calculus at a distance? Viewed from the perceptive of instructional design, the RME theory is more adapted for informing the guidance for developing learning sequences, because it is clearly built to support both learning and instruction in mathematics. Other theories such as the Dubinsky and MacDonald s (2002) constructivist theory of learning mathematics tend to focus on learning. Some of the advantages of adopting RME as an instructional design perspective for teaching Calculus at a distance are presented below. The two RME heuristics of guided re-invention and emergent modelling allow students to learn at their own pace, using their own methods which can only benefit their individual conceptual development. At the same time, the clearly defined goal of mathematizing helps one better structure and focus learning episodes. RME instruction emphasise the development of reasoning skills, communication skills and growth of a critical attitude, which are higher. order thinking skills often lacking in conventional instructional material The presentation of RME materials offers insights into how students learn and how this learning can be supported. If well developed, RME activities have the potential to make students better understand mathematical concepts. By adopting this perspective, instructors and instructional designers are challenged to learn the material at a deeper level, and to become more creative about teaching and assessment. There are, however, problems and challenges linked to RME adoption, especially for distance teaching. To name a few: It would be difficult to apply this kind of approach in instances where there are large student numbers such is the case in most distance education institutions. It takes a long time to understand the subject matter. The RME approach requires a new attitude towards teaching and assessment. 274
287 The RME approach requires different levels of mathematical activities with different assessment tools which are hard to design. Developing these tools requires a lot of research and testing. It is difficult to identify the different problems in different contexts needed to construct an effective HLT. It is also difficult to locate a balance between good contexts and effective problems. Interpreting the mathematical strategies and processes students have to demonstrate in the activities and the assessment, as well a scoring and judging, is complex. The most difficult challenge was creating opportunities for tutor-learner engagement using printed text only Discussion This section is a discussion of some lessons learnt emanating from a reflection of the research methodology, RME adoption, and the contribution of the research to the field of mathematical instruction design. (a) Methodological Reflection. As discussed in Chapter IV, the study followed a design research methodology (Bakker, Doorman & Drijvers, 2003; Cobb & Gravemeijer, 2008; Gravemeijer, 1994, Gravemeijer et al., 2000). This research design method provided the anchor for the design and development of the three versions of the learning trajectories. The cyclic processes of designing, evaluating and analyzing provided opportunities for increasing the validity and practicality of the learning sequences in relation to student understanding. In this design research approach, the study followed three main phases namely, a preparation phase, a distance design experiment phase and a retrospective analysis phase. Splitting the study this way helped in maintaining a focus in the research and a period for reflection after each phase. As much as possible, I tried to use the RME approach (Gravemeijer, 1994; Streefland, 1991) to develop the activities and provide direction in developing a hypothetical HLT introducing the derivative and integral relationship. This type of development research allows one to go through cycles of thought processes interspersed with design experimentation. There were three such cycles (section 4.5). Normally, the objective is to arrive at the generation of a local instructional theory. However, I was not able to get to this stage for this project. More rounds of iteration, testing, and revision of the projected conceptual levels and records of student progressions are required before the design cycle stabilizes into final levels, as determined by current level 275
288 descriptions being used to reliably code all data (Battista, 2010, p.539). Another limiting factor was the absence of a well-organized system for increasing the tutor s level of interaction with the students. As a result, the cyclic processes of the design experiments were confined to three particular periods where the group of distance learning students worked on learning sequences in 2009, 2010 and The outcomes of this study indicate that a framework for supporting the advancement of an understanding of the derivative-integral relationship in the FTC expression, could be developed under these circumstances. Still, it would have been better if the Hypothetical Learning trajectory (HLT) designed using the RME approach was investigated with more mathematical experts and more students in more cyclic processes. That way, the refinements of the HLT would have been more validated leading to the development of a fully-fledged instructional theory. In this study, I took the roles of instruction designer, researcher and instructor. This situation has affected the conclusion of this study as I have a biased, subjective view to the outcomes. To reduce this bias, there was a level of data triangulation in that data of the same phenomenon, such the effect of the RME-inspired learning unit, was studied at different periods, places and with different subjects. A second strategy used to reduce this bias was in the form of member checks which was realized at the end of the study when colleagues from Freudenthal Institute and one math lecturer looked through and made suggestions for improving the final HLT. This has been a point of weakness in this study. More subject matter experts and tutors should have evaluated the trajectory for its consistency, validity and practicality. There was some level of methodological triangulation in that the analysis of students responses was supported with interview during the second design experiment. Cobb and Gravemeijer (2008) identify trustworthiness, repeatability and generalizability as issues that need to be addressed in a research project of this nature. In terms of trustworthiness, I have tried to present data and the argumentation in a manner that is transparent. For repeatability, the research process and outcomes are documented to allow for replication by other researchers later on. Basing the argumentation on the theoretical constructs of guided re-invention and emergent modelling, theories which have been validated by other researchers increase the quality of internal validity, and make the achievement of failure to attain these principles, transparent. The results have been structured in a way that allows for generalisation, if and where possible. In his critique of design experiments Engeström (2011) cites three shortcomings: a vague unit of analysis; a linear approach to design whereby the researcher pre- 276
289 determines the end goals and searches for the refinement of a finished product; overlooking of the agency of the students and teachers. According to Engeström (2011, p. 602), the design experiment approach seems blind to the crucial difference between designer-led and user-led models of the innovation process. In general, more forms of design-based research are required as evidence that adopting this methodological approach is a worthwhile exercise ( Anderson & Shattuk, 2011). In my opinion, if designed carefully, the RME approach has the potential of overcoming some of these shortcomings.). (b) Reflection on the RME approach. The results outlined so far indicate that the adoption of the RME theory as an instructional design perspective in a unit introducing the relationship between the two basic Calculus concepts the derivative and the integral through distance education is possible with a number of conditions: A team of experts is required to research, test and develop the learning activities. Provision should be made for programmers and technologists for designing and maintaining learning support system (if mobile phones are to be used), together with learning tools, if possible. RME adoption is only possible with a small number of students Time and resources are critical factors for the success of RME adoption. The summarized results from attempts to adopt RME for designing a distance learning unit below should be read with the preceding paragraph as a background. As a background, I should clarify that I am restricted in approaching instructional design from an essentially individualistic perspective of psychological constructivism because this is the point from which the distance learner operates. Hopefully, at some later stage, one should be able to locate these findings in a web-based classroom learning set up for distance learners. Until that happens, it is best to focus on individual student s experience with the learning activity, and what is required to refine the design of this activity to orchestrate the required forms of student reasoning and learning. I align with the Vygotskyian (1987) claim that the tools (whether conceptual, symbolic or technical) with which people operate have a deep influence on the understandings they develop. I also concur with Cobb s (2011, p 97) view that the struggle for mathematical meaning can be seen in large part as a struggle for means of symbolizing. The results indicated that it was possible to identify a starting point of the instructional sequence experientially real to students (the reasoning with graphs task).the results 277
290 also showed that the initial instructional activities were justifiable in terms of the global endpoints of the hypothetical learning sequence (section 6.3). I could also, to some extent, collect student contributions of responses to the informal activity to form a basis on which they could construct increasingly sophisticated mathematical understandings. The major limitations had to do with a failure to collect student elaborations of models (graphs) of their informal mathematical activity, the lack of a mechanism allowing for tutor guidance, and some visible tools on which students could practice their mathematising. Throughout the execution of the design experiments, these three hindrances stifled transitions from a model of informal mathematical activity to a model for formal mathematics. However, one positive outcome was that students felt that the activities helped them think deeper and become more reflective when learning mathematics. The other positive outcome was the development of an instruction design framework for introducing the derivative-integral relation expressed in the FTC equation. Throughout the design experiments, there was a need for students to revert to their former ways of reasoning. Considering that this is a common student tendency, the following important aspects might be important for further development and implementation of the RME approach for other distance education tutors: It is important to specify to students, at the beginning of the learning unit that the RME approach being used is slightly different form the conventional approach. The RME expectations regarding the activities students are required to perform and the answers they are expected to give should be clearly communicated to the students right from the onset of the learning unit. If the use of a communicative support model (such as a mobile learning platform) is envisaged, this should be tested out before the beginning of the learning unit to ensure that all participating students have the required devices and are able to link to the learning resources. RME design requires identification of engaging and simulating activities to keep students motivated and engaged. RME adoption requires some effort in building a culture of questioning and acceptance of criticism from both students and instructor. To summarize, RME adoption is a long time project and requires adequate allocation of time and resources. 278
291 (c) Contribution to field of mathematical instructional design. The main aim of this dissertation was to examine the developmental efforts required to adapt the instructional design perspective of RME to the teaching and learning of Calculus through distance college descriptions of how students could be supported in reinventing an interpretation of the derivative-integral relationship in Fundamental Theorem of Calculus. This adds to the growing group of studies in which students are supported in re-inventing other mathematical concepts. For example, Larsen (2009) reported on a study in which a group of students reinvented the concepts of group and isomorphism. More recently, Swinyard (2011) has completed a study tracing students reinvention of the formal definition of limit. The main difference in this study is that the focus is on instructional design, and not only learning. Documenting the mistakes, shortcomings, and lessons learned in the instructional design process is a contribution to instructional design research. From an instructional design point of view, this study has drawn extensively from the seminal work of Bakker (2004) for guidance around what is required in developing a local instructional design theory and using design research. It has also drawn from Rasmussen and Blumenfeld s (2007) investigation of student reasoning with analytic expressions as they reinvented solutions to systems of two differential equations. This contribution advanced the RME design heuristic of emergent modelling in an undergraduate learning context. To some extent, this study aligns itself with a recent study by Zandieh and Rasmussen (2010) in which they elaborate on a framework defining as a mathematical activity (DMA - that structures the role of defining in students progress from informal to more formal ways of reasoning, in an undergraduate geometry course. Their study integrates the instructional design theory of RME and offers researchers and instructional designers a structured way to plan for the role of defining as a mathematical activity. The primary contribution for this research has been the advancement (or an attempt to advance) the RME theory as instruction design theory for planning a distance learning unit introducing the FTC, and focusing in curve sketching through distance education. In the remainder of this section, I provide a summary of suggestions for a unit introducing the derivative-integral relationship in Fundamental Theorem of Calculus. I focus on the first two layers (situational and referential) of the Gravemeijer s (1999) emergent model for transiting from informal to more formal ways of learning mathematics. The model has four layers of activity referred to as situational, referential, general, and formal. More work is required to refine the latter models (general and formal) when learning about the FTC.The goal of such a unit is that students learn to 279
292 construct and analyze graphs and to communicate about the derivative-integral relationship in the FTC, by investigating an accumulating quantity. The key concepts are rate-of-change and accumulation and the main form of reasoning that needs to be mastered is covariation reasoning. Though coherent reasoning about the relationship between the two main concepts is the goal of learning in the unit, they cannot be addressed at the same time. However, it is important to introduce students to these two concepts in a context where they occur together initially, so that they visualize the fastness and the build-up or accretion of a quantity as a collective unit, and build a sense of variation in the context of an accumulating quantity. I suggest starting with a brief analysis of the two concepts together before embarking on an analysis of each of them individually, ending with a discussion of the relationship between them. I advocate using Bakker s (2004) (diagrammatic reasoning concept) at the beginning as follows: Students construct their graphs of given situations. Students experiment with the notions of fastness/slowness together with notions of accumulation as aspects of variation, preferably with dynamic tools, if available. Students reflect on the graphical representations and get guided by the teacher to focus on the two concepts the accumulation function and the derivative function, as well as the relationship between them. I would use computer tools at this stage or further examples that allow students to experiment with visualizing the derivative as a concept on its own and accumulation as a concept on its own. The exploration of the derivative would involve the water problem (task C) to help students cement their covariation reasoning. This would be followed by an exploration of the accumulation function. It is important to provide students with tools that can help them become more proficient with their reasoning. This is the missing aspect in the current research project. From historical phenomenology, the contexts of motion and flowing quantities played important roles and, therefore, should form part of the overall discussion. Historically, the notion of the limit was introduced later as a cognitive tool to explain mathematical phenomena. The same approach should be adopted. The idea that the derivative and integral are invertible processes in given circumstances should be carried in the entire learning unit, not only at the end. In terms of structure and sequencing, Sangwin s (2011) suggestions, positioning word problems as proto-modelling exercises would be beneficial. Sangwin (2011) elaborates 280
293 on word problems as situations requiring modelling. He attributes mathematical sense making to three critical steps in mathematical modelling and problem solving. These include: mathematical representation; operation on mathematical abstractions and checking for a meaningful correspondence between the real situation and symbolic abstraction (Sangwin, 2011, p. 1436). He also distinguishes between four sets of modelling situations, exact models with exact solutions, exact models with approximate solutions, approximate models with exact solutions and approximate models with approximate solutions. Using Sangwin s (2011) technique, efficient task design is linked to choosing problems that are sufficiently novel to be a worthwhile challenge but that students stills have a realistic prospect of solving (Sangwin, 2011, p. 1443). He points to three phases of learning critical to mathematical understanding imitation, problem solving and deliberate practice. His suggestions can be applied to the choice of context problems in RME. Another theory that could influence task design is Brousseau s (1997) Theory of Didactic Situations. This theory organises the teaching process into three parts: (i) the non-didactical, which is not specifically organised to allow for learning; (ii) the didactical, in which the teachers explicitly organise tasks to teach students forms of knowledge in a specific manner; and (iii) the adidactical (a process of channeling students into solving problems on their own). As a result, students acquire the desired forms of knowledge and reasoning for understanding given concepts. At the heart of Brousseau s theory is the milieu, which describes the middle ground of the teaching and learning cognitive space in which the teacher, learner and all the facets of the teaching/learning environment interact. The basis for this theory is a Piagetian view of learning, where the learner goes through the universal processes of assimilation and adaptation in well-defined stages of learning development, until he or she reaches the complete adidactical situation of taking full responsibility for his or her learning. The role of technology (particularly mobile technology) for enhancing tutor-learner interaction is key to the success of this RME inspired approach to learning. I anticipate that a learning unit as summarized in the final envisioned trajectory would lead to a better understanding the inverse relationship between the derivative and the integral expressed in the FTC. More generally, I would hope that the approach promoted here will make some contribution to the field of mathematical Instructional design. 281
294 6.6. Limitations to the study It is important to emphasize the exploratory nature of this study and its limitations. First, the study only covers student responses to print-based learning activities and only analyzes individual responses to these activities. Although this may not seem as a distance learning activity, it is essentially the main learning in the distance learning space as distance learners are required to interact with and engage with texts individually in order to start the learning process. The results the results may not apply directly to all students who have forms of tutor/teacher support. Second, as the researcher I had difficulty gathering sufficient information necessary to conduct a comprehensive assessment of the student responses required in developing an understanding of the derivative-integral relationship. In particular, more direct targeting of the development of student concept images and how these are transformed during the engagement with the learning trajectory is required. The learning area investigated was too broad and the concepts too complex. Perhaps it would have made more sense to investigate one learning task at a deeper level. Still, one would need to frame the selected learning task within wider historical and didactical contexts. I believe that the process of generating these two contexts has added to the depth and educational contribution of the study. Third, because of the limited time and financial resources available, the final HLT was not tested. Resources and technical proficiency are required to develop the technology-enhanced learning environment in order to modify and transform the learning trajectory to an acceptable level. At this stage I did not have the resources to set up the required infrastructure. There are many demonstrations of successful mobile learning interventions that can be reproduced with adequate planning and resources. For instance, Wei and Chen s (2006) e-book interface design which allows students to enter queries on the text which were transferred to a discussion forum accessible through the mobile phone. Kinsella s (2009) mobile application allowing students to anonymously post questions to the teacher who in turn gives back summarized feedback to all participating students in real time. Hartnell-Young and Vetere (2008) personalized forms of learning which lets students capture everyday aspects of their lives in order to reconstruct their lived narratives within a classroom environment. In terms of mathematics learning, Genossar, Botzer and Yerushalmy (2008) analyzed the learning processes and experiences occurring within a mobile phone learning environment and found that apart from making the dynamic mathematical applications more accessible, the mobile phone enabled students to engage in real authentic tasks. 282
295 From their study, Roschelle, Patton & Tatar (2007) claim that using mobile devices transforms the mathematics classroom into a student, assessment, knowledge and community centered entity. It is very unlikely that educators in African contexts will manage to catch up with these advances. However, with sufficient resources, the winning approach to effective instruction design when using the mobile phone as a didactic support tool is one, which places students needs together with the education goal. According to Fore (2008), the resulting design product is one that balances purpose with function. Overall, while the study has been useful in gaining an understanding of the instructional design development process, it is clear that more detailed and coordinated studies should be undertaken to properly test the final HLT and work towards the development of a local instructional theory Recommendations Based on the results of this study, this section presents some recommendations that can be used for instructional design and further research Recommendations for instruction design for distance education The conventional way of introducing the basic Calculus concepts in distance learning texts is to state the definitions, followed by examples and then some applications. The rationale of this approach is that once students can read and understand what the definitions are, they will be able to apply the definitions to the examples and the applications. In Chapter 2, I criticize this approach because, embedded in the approach is the assumption that the teacher s (the writer of the text) interpretation of the text is exactly the same as that of the student reading and engaging with the text. The present research was an attempt to use an alternative method to instruction design which engages students in the learning activity, while at the same time offering opportunities for them to be guided into a better understanding of the mathematical concepts while studying at a distance. Although the assignment of developing a local instructional theory is not yet complete, the findings so far suggest that the process of developing learning trajectories has potential for improving the quality of distance learning materials. The insights about learning and information obtained about students challenges and conceptions can only work to improve learning. It is, therefore, recommended that the design experiments methodology is adopted for normal instruction practices, not only for RME driven projects, but also for other subjects besides mathematics. 283
296 This project has also highlighted the role of the teacher or the mathematics expert in informing the instruction design process. The teacher is pivotal in orienting, motivating, instituting norms of practice, guiding and identifying critical points for discussion. The recommendation is that distance learning practitioners pay attention to how teacher contributions are integrated into the instructional materials, using the latest technologies. For RME to be successful, it is also critical that there is a process of renegotiating the didactical contract of what is valued, and what is examined in a mathematics course. One of the deficiencies in the current instructional design practices is an informed way of analyzing students interpretation of texts (written and graphical).the recommendation is that semiotic analyses such as the diagrammatic reasoning employed by Bakker ( 2004) be extended to analyze students responses in order to improve the instruction design Recommendations for further research RME adoption in instruction design for distance education has been the main focus of investigation for this study. However, the conclusions regarding the instruction design is that there was a need to involve more mathematics and technological experts in order to improve the instructional design. More involved research is required to get to the stage of the evolvement of local instructional theory on understanding of FTC. With reference to mobile learning adoption, the study revealed that this type of intervention requires an institutional approach for to be effective. It is, therefore, recommended that more research projects focusing on mobile learning adoption for mathematics and other learning areas be taken up at an institutional level. In terms of Calculus education research, two areas will need to be revisited. The first area concerns an exploration of diagrammatic reasoning as an analytical tool for improving of the development of learning trajectories for teaching Calculus concepts. The second area deals with the use of tools for conceptual development and mathematical problem solving as applied to mobile devices. This should be carried out with reference to possible adoption in a distance learning environment. 284
297 REFERENCES Al-Zoubi, A. Y., Jeschke, S., & Pfeiffer, O. (2010). Mobile Learning in Engineering Education: The Jordan Example. Paper presented at the International Conference on E-Learning in the Workplace 2010, New York, NY, USA. Artigue, M. (1991). Analysis. In D. Tall (Ed.), Advanced Mathematical Thinking (pp ). Dordrecht: Kluwer Academic Publishers Anderson, T., & Shattuck, J. (2011). Design-Based Research: A Decade of Progress in Education Research? Educational Researcher, 41(1), Retrieved on from Attewell, J. (2005). From research and development to mobile learning: Tools for education and training providers and their learners.. Retrieved on from Attewell, J., & Savill-Smith, C. (2003). Mobile Learning and social inclusion: Focusing on learners and learning. In J. Attewell & C. Savill-Smith (Eds.), Learning with mobile devices: research and development (pp. 3-12). UK: Learning and Skills Development Agency. Retrieved from: learning.org/archive/docs/learning%20with%20mobile%20devices%20- %20A%20Book%20of%20Papers%20from%20MLEARN% pdf Bakker, A. (2004). Design Research in Statistics Education: On Symbolizing and Computer Minitools. Utrecht CD; ß Press. Bakker, A., Doorman, M., Drijvers, P. (2003). Design research on how IT may support the development of symbols and meaning in mathematics education. Retrieved January 10, 2008, from Bar-On, E., & Avital, S. (1986). Rate-of-change over an interval as a property of functions: Algebraic and numeric approach. International Journal of Mathematical Education in Science and Technology, 17 (1), Battista, M. (2010). Representations of learning for teaching: Learning progressions, learning trajectories, and levels of sophistication. In P. Brosnan, D. B. Erchick, & L. Flevares (Eds.), Proceedings of the Thirty-Second Annual Meeting of the North American Chapter of the International Group for the Psychology of Mathematics Education (pp ). Columbus, OH: The Ohio State University. Baya a, N. M., & Daher, W. M. (2009). Learning Mathematics in an Authentic Mobile Environment: the Perceptions of Students. International Journal of Interactive 285
298 Mobile Technologies (ijim)-3). Retrieved on from Bell, A., & Brookes, W. M. (1986). Two Comments on Didactical Phenomenology. For the Learning of Mathematics, 6 (1), Biccard, P. (2010). An investigation into the development of mathematical modelling competencies of grade 7 learners.unpublished masters thesis. University of, Stellenbosch., South Africa. Biggs, & Collis. (1982). Evaluating the Quality of Learning: The SOLO taxonomy New York: Academic Press. Bookman, J., & Friedman, C. P. (1994). A Comparison of the Problem Solving Performance of Students in Lab Based and Traditional Calculus. CBMS Issues in Mathematical Education, 4, Boyer, C. B. (1959). The history of the Calculus and its conceptual development. New York: Dover Publication. Bressoud, D. (1992). How should we introduce integration? The College Mathematics Journal, 23(4), Bressoud, D. (2006). Engaging Students through the History of Mathematics. Presentation made at Macalester College, St. Paul, MN Project NExT-WI, October 5, Retrieved on from Bressoud, D. (2010). Historical reflections on the teaching of the fundamental theory of integral Calculus. Retrieved on from Brown, A. (1992). Design experiments: Theoretical and methodological challenges in creating complex interventions in classroom setting. Journal of the Learing Sciences, 2, Brown, J., D., M., & Christian, R. (2008). Mobile Learning Update. The Learning Consortium Perspective,. Retrieved on from Brown, L., & Mokgele, M. (2007). Information literacy skills training of staff and students in the Unisa Library: Challenges and opportunities. Paper presented at the World Library and Information Congress: 73 rd IFLA General Conference & Council. Retrieved on from 286
299 Brousseau, G. (1997). Theory of Didactical situations in mathematics , [Edited and translated M. Cooper, N. Balacheff, R. Sutherland and V. Warfield.] Dordrecht: Kluwer Academic Publishers. (French version Théorie des situations.didactiques. [Textes rassemblés et préparés par N. Balacheff, M. Cooper,R. Sutherland, V. Warfield]. Grenoble: La pensée sauvage.) Carlson, M. P. (1998). A cross-sectional investigation of the development of the function concept. Research in collegiate mathematics education: CBMS Issues in Mathematics Education 7, Washington, DC: Mathematical Association of America. Carlson, M. P., Jacobs, S., Coe, E., Larsen, S., & Hsu, E. (2002). Applying covariational reasoning while modelling dynamic events: A framework and a study. Journal for Research in Mathematics Education, 33 (5), Carlson, M. P., Jacobs, S., & Larsen, S. (2001). An investigation of covariatonial reasoning and its role in learning the concepts of limit and accumulation.. Paper presented at the Proceedings of the 23th Annual Meeting of the Psychology of Mathematics Education, North American Chapter., Snowbird, Utah. Date? Carlson, M.P., C., Larsen, S., & Lesh, R. (2001). Integrating a models and modelling perspective with existing research and practice. In R. Lesh & H.Doerr (Eds.), Beyond constructivism in mathematics teaching and learning: A models & modelling perspective (pp ). Hillsdale, NJ: Lawrence Erlbaum. Carlson, M. P., & Oehrtman, M. (2005). Key aspects of knowing and learning the concept of function. Research Sampler, 9. Retrieved on from Carlson, M. P., Persson, J., & Smith, N. (2003). Developing and connecting Calculus students notions of rate-of-change and accumulation: The fundamental theorem of Calculus. Psychology of Mathematics Education, 2, Cerulli, M., Pedemonte, B., & Robotti, E. (2005). An integrated perspective to approach technology in mathematics education. Paper presented at the CERME 4, Sant Feliu de Guíxols, Spain, Retrieved on from E-2006.pdf. Çetin, N. (2009). The ability of students to comprehend the function-derivative relationship with regard to problems from their real life. PRIMUS, 19 (3),
300 Retrieved on from Chao, P.-Y., & Chen, G.-D. (2009). Augmenting paper-based learning with mobile phones Interacting with Computers., 21 (3), Chen, N-S., Teng, D. C-E., & Lee, C-H. (2010, April 2010). Augmenting paperbased reading activities with mobile technology to enhance reading comprehension Proceedings of the (2010), pp Paper presented at the 6th IEEE InternationaConference on Wireless, Mobile and Ubiquitous Technologies in Education (WMUTE 2010), Kaohsiung Christou, C., Papageorgiou, E., & Zachariades, T. (2002). The difficulties and reasoning of undergraduate mathematics students in the identification of functions. Paper presented at the 10th ICME Conference. Crete: Wiley., Crete. Cobb, P. (2000). Conducting classroom teaching experiments in collaboration with teachers. In R. Lesh & E.Kelly (Eds.), Handbook of research design in mathematics and science education (pp ). Mahwah, NJ: Erlbaum. Cobb, P. (2004). Mathematics, literacies, and identity. Reading Research Quarterly, 39, Cobb, P. (2011). Learning from distributed theories of intelligence. In E. Yackel, K. Gravemeijer & A. Sfard (Eds.), A Journey in mathematics education research: Insights from the work of Paul Cobb (pp ). New York: Springer. Cobb, P., Confrey, J., disessa, A., Lehrer, R., & Schauble, L. (2003). Design experiments in edcuational research. Educational Researcher, 32 (1), Cobb, P., & Gravemeijer, K. P. E. (2008). Experimenting to support and understand learning processes. In Anthony E. Kelly, R. A. Lesh & J. Y. Baek (Eds.), Handbook of design rsearch methods in education innovations in science, technology, engineering, and mathematics learning and teaching (pp ). New York, NY: Routledge. Cobb, P., Gravemeijer, K. P. E., Yackel, E., McClain, K., & Whitenack, J. (1977). Mathematizing and symbolizing: The emergence of chains of signification in one first-grade classroom. In D. Kirshner & J. A.Whitson (Eds.), Situated cognition theory: Social, semiotic, and neurological perspectives (pp ). Hillsdale, NJ: Lawrence Erlbaum. 288
301 Cobb, P., Wood, T., & Yackel, E. (1992). A constructivist alternative to the representational view of mind in mathematics education. Journal for Research in Mathematics Education, 23 (1), Cobb, P., & Yackel, E. (1996). Constructivist, emergent, and sociocultural perspectives in the context of developmental research. Educational Psychologist, 31, Collins, A. (1992). Toward a design science of education. In E. Scanlon & T. O'hea (Eds.), New directions in educational technology (pp ). Berlin: Springer Verlag. Cordero-Osorio, F. (1991). Taking a differential element: Its formation and meaning in the didactic discourse of Calculus. International Journal of Mathematical Education in Science and Technology, 22 (6), Cornu, B. (1991). Limits. In D.Tall (Ed.), Advanced Mathematical Thinking (pp ). Dordrecht: Kluwer Academic Publishers. Cortina, J. (2006). Instructional Design for Ratio. Unpublished doctoral dissertation. Vanderbilt University, Nashville, Tennessee, USA. Crowe D and Zand H (2001) Computers and undergraduate mathematics II: on the desktop Computers and Education 37, D Halluin, C., & Poisson, D. (1988). Une stratégie d enseignement des mathématiques: la mathématisation de situations intégrant l informatiquecomme outil et mode de pensée. Thèse de Doctorat, Université de Lille. Daher, W. (2010). Building mathematical knowledge in an authentic mobile phone environment. Australasian Journal of Educational Technology, 26 (1), de Lange, J. (1987). Mathematics, insight and meaning. Utrecht: OW&OC. Doorman, L. M. (2005). Modelling motion: From trace graphs to instantaneous change. Utrecht: CD- Beta Press. Doorman, L.M., & Kindt,M. (2011). Comments from RME experts. Appendix E, this dissertation. Doorman, L. M., & Van Maanen, J. (2008). A historical perspective on teaching and learning Calculus. Australian Senior Mathematics Journal. Retrieved on from Drijvers, P. (2002). Learning mathematics in a computer algebra environment: Obstacles are opportunities. Zentralblatt Für Didaktik Der Mathematik, 34,
302 Dubinsky. (2000). Meaning and formalism in mathematics. International Journal of Computers for Mathematical Learning, 5, Dubinsky, E., & McDonald, M. A. (2001). APOS: A Constructivist theory of learning in undergraduate mathematics education research. In D. Holton (Ed.), The teaching and learning of mathematics at university Level: An ICMI study (pp ). Dordrecht: Kluwer. Edelson, D. C. (2002). Design research: What we learn when we engage in design. The Journal of the Learning Sciences, 11 (1), Edwards,C.H. (1979). The Historical Development of the Calculus. New York: Springer- Verlag. Engelbrecht, J., & Harding, A. (2001). WWW Mathematics at the University of Pretoria: The trial run.. South African Journal of Science 9 (10), Engelbrecht, J., & Harding, A. (2004). Technologies involved in the teaching of undergraduate mathematics on the web. Journal of Online Mathematics and its Applications. Retrieved on from Engelbrecht, J., & Harding, A. (2005a). Cooperative learning as a tool for enhancing a web-based Calculus course. The ICTM2, Crete, Retrieved on from Engelbrecht, J., & Harding, A. (2005b). Teaching undergraduate mathematics on the internet 2: Attributes and possibilities. Educational Studies in Mathematics, 58 (2), Engeström, Y. (2011). From design experiments to formative interventions. Theory & Psychology, 21, Retrieved on from Estrada-Medina, J. (2004). Design of activities to observe the cognitive structure of students exposed to tasks which involve co-variation of quantities. Paper presented at the The annual meeting of the North American Chapter of the International Group for the Psychology of Mathematics Education, Delta Chelsea Hotel, Toronto, Ontario, Canada.Retrieved on from Estrada-Medina, J. (2005). Design of dynamic visual situations in a computaional environmet as setting to promote the learning of fundamental Calculus concepts. 290
303 Paper presented at the The 27th Annual Meeting of the Psychology of Mathematics Education, North American Chapter, Roanoke, Viginia, USA. Estrada-Medina, J., & Sanchez-Arena, E. (2006). Understanding the relation between accumulation and its rate-of-change in a computational environment through simulation of dynamic situations. Paper presented at the Proceedings of the 28th annual meeting of the North American Chapter of the International Group for the Pyschology of Mathematics Education, Mérida, México. Farmaki, V., Klaudatos, N., & Paschos, T. (2004). Integrating the history of mathematics in educational praxis: An Euclidean geometry approach to the solution of motion problems. Paper presented at the Proceedings 28th PME, Bergen, Norway. Farmaki, V., & Paschos, T. (2007). Employing genetic moments in the historyof mathematics in classroom activities. Education Studies in Mathematics, 66, Fauzan, A. (2002). Applying Realistic Mathematics Education (RME) in teaching geometry in Indonesian primary schools. Unpublished doctoral dissertation University of Twente, The Netherlands. Fernini-Mundy, J & Graham. K. G (1994). Research in Calculus learning: Understanding limits, derivatives, and integrals. In James J. Kaput & Ed Dubinsky, (Eds), Research issues in undergraduate mathematics learning, MAA notes 33, Mathematical Association of America, Washington, DC (pp ). Ferrini-Mundy, J., & Lauten, D. (1993). Teaching and learning calculus. In P. Wilson & S. Wagner (Eds), Research ideas for the classroom: High school mathematics (pp ). New York: MacMillan. Fore, D. (2008). How user-centered design will be the death of us and how ecological methods can help. Paper presented at the From Business to Buttons 2008, Malmö University: Harbour campus, Sweden. Retrieved on from Freudenthal, H. (1971) Geometry between the devil and the deep sea. Educational Studies in Mathematics, 3 (3/4), Freudenthal, H. (1973). Mathematics as an educational task. Dordrecht: Kluwer Academic Publishers. Freudenthal, H. (1983). Didactical phenomenology of mathematical structures. Dordrecht: Reidel. 291
304 Freudenthal, H. (1991). Revisiting mathematics education - China lectures..dodrecht: Kluwer Academic Publishers. Freudenthal, H. (1993). Thoughts on teaching mechanics: Didcatical phenomenology of the concept of force. Educational Studies in Mathemtics, 25, Gagne, R. M. (1996). The conditions of learning (1 st edition). New York, New York: Holt, Rinehart & Winston. Genossar, S., Botzer, G., & Yerushalmy, M. (2008). Learning with mobile technology: A case study with students in mathematics education. International Journal of Emerging Technologies in Learning, 4(1), Glaser, B.G., & Strauss, A. L. (1967) The discovery of grounded theory: Strategies for qualitative research New York: Aldine de Gruyter Glasersfeld, E. v. (1978). Radical constructivism and Piaget's concept of knowledge. In F. B. Murray (Ed.), The impact of Piagetian theory (pp ). Baltimore, MD: University Park Press. Godino, J. D. and Batanero, C. (2003). Semiotic functions in teaching and learning mathematics. In, Anderson, A. Sáenz-Ludlow, S. Zellweger and V. V. Cifarelli (Eds), Educational Perspectives on Mathematics as Semiosis: From Thinking to Interpreting to Knowing (pp ). Ottawa: LEGAS. Golden, K. M. (2006). First lecture: What is Calculus about and why should I study it? Retrieved on from Gray, E. & Tall, D. (2001). Relationships between embodied objects and symbolic prospects: An explanatory theory of success and failure in mathematics., In Van den Heuvel-Panhuizen. M. (Ed). Proceedings of the 25 th Conference of the International group for the Psychology of Mathematics Education, Utrecht, The Netherlands, 3, (pp ). Gravemeijer, K. P. E. (1994). Educational development and educational research. Journal for Research in Mathematics Education, 25 (5), Gravemeijer, K. P. E. (1999). How emergent models may foster the constitution of formal mathematics. Mathematical Thinking and Learning, 1 (2), Gravemeijer, K.P. E. (2004). Local instruction theories as a means of support for teachers in reform mathematics education. Mathematical Thinking and Learning, 6(2), Gravemeijer, K. P. E., Bowers, J., & Stephan, M. (2003). A hypothetical HLT on measurement and flexible arithmetic. In M. Stephan, J. Bowers, P. Cobb & K. 292
305 Gravemeijer (Eds.), Supporting students' development of measuring conceptions: JRME Monograph 12, (pp ). Reston, VA: NCTM. Gravemeijer, K.P. E., Cobb, P., Bowers, J. and Whitenack, J. (2000). Symbolizing, Modeling, and Instructional Design. In Paul Cobb, Erna Yackel, & Kay McClain (Eds.) Symbolizing and Communicating in Mathematics Classrooms: Perspectives on Discourse, Tools, and Instructional Design. Mahwah, NJ: Erlbaum and Associates Gravemeijer, K. P. E., & Bakker, A. (2006). Design research and design heuristics in statistics education. In: A. Rossman & B. Chance (Eds.), Proceedings of the seventh international conference on teaching Statistics, Salvador, Brazil, (pp. 1-6), Voorburg, the Netherlands: International Statistical Institute. Gravemeijer, K. P. E., & Doorman, M. (1999). Context problems in realistic mathematics education: A Calculus course as an example. Educational Studies in Mathematics, 39 ( ). Gravemeijer, K. P. E., & Terwel.J. (2000). Hans Freudenthal: A mathematician on didactics and curriculum theory. Journal of Curriculum Studies, 32 (6), Gravemeijer, K. P. E., van Galen, F., & Keijzer, R. (2005). Designing instruction on proportional reasoning with average speed. Proceedings of the 29th Conference of the International group for Psychology of Mathematics Education, 1, Hartnell-Young, E., & Vetere, F. (2008). A means of personalizing learning: Incorporating old and new literacies in the curriculum with mobile phones. Curriculum Journal, 19 (4), Hoffkamp, A. (2010). The use of interactive visualisations to foster the understanding of concepts of Calculus-design principles and empirical results. In: Proceedings of I2GEO2010, Hluboká nad Vltavou, Czech Republic. Submittet to ZDM. Hughes-Hallett, D., Gleason, A. M., Lock, F., Flath, D. E., Gordon, S. P., Lomen, D. O., Tucker, T. W. (1999). Applied Calculus for business, life, and social sciences. New Jersey: John Wiley & Sons. Human, P., Adonis, K., Hudson, K., Makama, J., Mdlalose, D., Sasman, M., Shembe, M. (1999a). A grade functions package (Module 1). MALATI (Mathematics learning and teaching initiative). Retrieved on from Human, P., Adonis, K., Hudson, K., Makama, J., Mdlalose, D., Sasman, M. Shembe, M. (1999b). A grade functions package (Module 2). MALATI (Mathematics 293
306 learning and teaching initiative). Retrieved on from Human, P., Adonis, K., Hudson, K., Makama, J., Mdlalose, D., Sasman, M.,Shembe, M. (1999c). A grade 12 Introductory Calculus package (Module 3). MALATI (Mathematics learning and teaching initiative). Retrieved on from Inglis, M., Mejia-Ramos, J. P., & Simpson, A. (2007). Modelling mathematical argumentation: The importance of qualification. Educational Studies in Mathematics, 66, Retrieved, from: Kelly, A. E., Baek, J. Y., Lesh, R. A., & Bannan-Ritland, B. (2008). Enabling innovations in education and synthesizing their impact. In A. E. Kelly, R. A. Lesh & J. Y. Baek (Eds.), Handbook of design research methods in education innovations in science, technology, engineering, and mathematics learning and teaching (pp. 1-18). New York, NY: Routledge. Kelly, A. E., & Lesh, R. (2000). Trends and shifts in research methods. In A. E. Kelly & R. A. Lesh (Eds.), Handbook of research design in mathematics and science education, (pp ). Mahwah, NJ: Lawrence Erlbaum Associates. Kinard, J., & Kozulin, A. (2008). Rigorous mathematical thinking: Conceptual formation in the mathematics classroom. New York: Cambridge University Press. King, J. P. (2009). Mathematics in 10 Lessons: The grand tour. New York: Prometheus Books. Kinsella, S. (2009). Many to one: Using the mobile phone to interact with large classes. British Journal of Educational Technology, 40 (5), Kinshuk, S. J., & Sutinen, E. (2004). Mobile adaptation extension of a digital learning tool. Paper presented at the The International Conference on Computers in Education (ICCE2004),Melbourne, Australia. Kitcher, P. (1983). The Nature of mathematical knowledge. New York: Oxford University Press. Kizito, R. (2012). Pre-testing Mathematical Concepts with the Mobile Phone: Implications for Curriculum Design. The International review of Research in Open and Distance Learning, 13 (1): Available at: 294
307 Kleiner, I. (2001). History of the infinitely small and the infinitely large in Calculus. Educational Studies in Mathematics, 48 (2/3), Kline.M. (1972). Mathematical thought from ancient to modern times. New York: Oxford University Press. Klisinska, A. (2009). The fundamental theorem of Calculus: A case study into the didactic transposition of proof. Unpublished doctoral dissertation, Luleå University of Technology, Porsön, Sweden. Kwon, O. N. (2002). Conceptualizing the realistic mathematics education approach in the teaching and learning of ordinary differential equations. Journal of the Korea Society of Mathematical Education Series Research in Mathematical Education, 6 (2), Lakatos. (1976). Proofs and refutations: The logic of mathematical discovery. Cambridge, UK: Cambridge University Press. Landsman, K. (2008): Where have all the students gone? In: Nieuw Archief voor Wiskunde 5(9), Larsen. S. (2009). Reinventing the concepts of group and isomorphism: The case of Jessica and Sandra. The Journal of Mathematical Behavior, 28 (2-3), Laurillard, D. (1993). Rethinking tniversity Thinking.London: Routledge. Lauten, A. D., Graham, K. G., & Ferrini-Mundy, J. (1994). Research in Calculus learning: Understanding of limits, derivatives and integrals. In J. J. Kaput & E.Dubinsky (Eds.), Research issues in undergraduate mathematics learning, MAA Notes (Vol. 33, pp ). Washington DC: MAA. Lesh, R.A., Carlson, M. & Larsen, S. (2000). Integrating models and modelling perspective with existing research and practice. In R. Lesh & H. Doerr (Eds.), Beyond constructivism in mathematics teaching and learning: A models and modelling perspective (pp ). Hillsdale, NJ: Lawrence Erlbaum Associates. Lesh, R. A. (2002). Research design in mathematics education: Focusing on design experiments. In L. English (Ed.), Handbook of international research in mathematics education (pp ). Hillsdale, NJ: Lawrence Erlbaum Associates. Leung, C., & Chan, Y. (2003). MLearning: A new paradigm in electronic learning. Paper presented at the Third IEEE International Conference on Advanced Learning Technologies (ICALT'03), Athens, Greece. 295
308 Lidstone, D. (1992). Calculus students' understanding of dynamic Concepts. Unpublished doctoral dissertation, Simon Fraser University, Burnaby, BC, Canada. MALATI Group (Mathematics learning and teaching initiative) (1999). Reconceptualizing Calculus Teaching. MALATI Introductory Calculus Rationale. Retrieved from: Marrongelle, K. (2002).The role of physics in students conceptualizations of calculus concepts: Implications of research on teaching. Paper presented at the 2 nd International Conference on the Teaching of Mathematics (at the undergraduate level). University of Crete, 1-6 July, 2002, Hersonissos, Crete, Greece. Practice). Retrieved on from: Mathee, M., & Liebenberg, J. (2007). Mathematics on the Move: Supporting mathematics learners through mobile technology in South Africa. Paper presented at the 6th international conference on mobile Learning, Melbourne, Australia. McDermott, L. C., Rosenquist, M. L., & van Zee, E. H. (1987). Student difficulties in connecting graphs and physics: Examples from kinematics. American Journal of Physics, 55 (6), Merrill, D. (2002). First principles of instruction. Education training research & development, 50 (3), MIT Open CourseWare site (Massachusetts Institute of Technology) open source website: Retrieved from : Montiel, M. (2005). The process of integration and the concept of integral: How does success with applications and comprehension of underlying notions such as accumulation relate to students' mathematical fluency? Unpublished doctoral dissertation. University of New Hampshire. USA? Moore, J. (2005). Undergraduate mathematics achievement in the emerging pngineers Programme. International Journal of Mathematics Education in Science and Technology, 36 (5), Motlik, S. (2008). Mobile learning in developing nations. International Review of Research in Open and Distance Learning, 9 (2),
309 Motsert, I. (2010). Incorporating a mobile interface in a blended learning programme for Mathematics teachers. Paper presented at the Learning Africa 2010 Conference in Lusaka, Zambia. Retrieved, from r%20sotl.pdf Nemirovsky, R., & Rubin, A. (1992). Students tendency to assume resemblances between a function and its derivative. TERC Working Paper, Nixon, E. G. (2005). Creating and learning abstract algebra: Historical phases and conceptual levels. Unpublished doctoral dissertation. Univeristy of South Africa, Pretoria. Orton, A. (1983a). Students understanding of differentiation. Educational studies in mathematics, 14, Orton, A. (1983b). Students understanding of integration. Educational Studies in Mathematics, 14, Orton, A. (1986). Introducing Calculus: An accumulation of teaching ideas? International Journal of Mathematics Education in Science and Technology, 17 (6), Ostebee, A., & Zorn, P. (2002). Calculus from graphical, numerical, and symbolic points of view, (2 nd ed.). Boston: Houghton Mifflin. Pantozzi, R. S. (2009). Making sense of the Fundamental Theorem of Calculus. Unpublished doctoral dissertation.. Rutgers State University of New Jersey, New Brunswick., USA Pence, B. J. (1995). Investigating the impact of change in the Calculus curriculum at San Jose State University. Proceedings of PME-19 Conference, V. 1, p Piaget, J. (1977). Psychology and epistemology: Towards a theory of knowledge. New York, NY: Penguin Books. Polya, G. (1965). Mathematical discovery: On understanding, learning and teaching problem solving ( 2 nd ed.). Hoboken, NJ: John Wiley & Sons. Prag, A. (1993). On James Gregory s Geometriae pars universalis, in The James Gregory Tercentenary Memorial Volume (pp ). London. Rasmussen, C., & Blumenfeld, H. (2007). Reinventing solutions to systems of linear differential equations. Journal of Mathematical Behavior 26,
310 Rasmussen, C., & King, K. D. (2000). Locating starting points in differential equations: A realistic mathematics education approach. International Journal of Mathematical Education in Science and Technology, 31 (2), Rasmussen, C., & Kwon, O. (2007). An inquiry oriented approach to undergraduate mathematics. Journal of Mathematical Behavior, 26, Rasmussen, C., Kwon, O. N., & Marrongelle, K. (2008). A framework for interpreting inquiry-oriented teaching. Proceedings of the Eleventh Special Interest Group of the Mathematical Association of America on Research in Undergraduate Mathematics Education. Rasmussen, C. & Marrongelle, K. (2006). Pedagogical content tools:integrating student reasoning and mathematics into instruction. Journal for Research in Mathematics Education, 37, Reigeluth, C., & Moore, J. (1999). Cognitive education and the cognitive domain. In C. Reigeluth (Ed.), Instructional design theories and models: A new paradigm of instructional theory (pp ). Mahwah, NJ: Lawrence Erlbaum. Roddick, C. (2003). Calculus reform and traditional students' use of Calculus in an engineering mechanics course CBMS issues in mathematical education, 12, Roh, K. H. (2008). Students images and their understanding of definitions of the limit of a sequence. Educational Studies in Mathematics, 69, Roschelle, J., Patton, C., & Tatar, D. (2007). Designing networked handheld devices to enhance school learning. Advances in Computers, 70, Sabbagh, M. (2007). Knowledge for proficient teaching of Calculus. Unpublished PhD or Masters?Thesis. University of Calgary, Library and Archives of Canada. Saldanha, L., & Thompson, P. (1998). Re-thinking co-variation from a quantitative perspective: Simultaneous continuous variation. In S. B. Berensen & N. Coulombe (Eds.), Proceedings of the twentieth annual meeting of the North American Chapter of the International Group for the Psychology of Mathematics Education (pp ). Raleigh, NC: North Carolina State University. Sangwin, C. J. (2011) Modelling the journey from elementary word problems to mathematical research. Notices of the American Mathematical Society, 58 (2)
311 Schwarzenberger, R. L. E., & Tall, D. (1978). Conflicts in the learning of real numbers and limits. Mathematics Teaching 82, Schwingendorf, K. E. (1999). Assessing the effectiveness of innovative educational reform efforts. In B. Gold, S. Keith & W. Marion (Eds.), Assessment practices in undergraduate mathematics, number 49 in MAA notes (pp ). Washington, DC: The Mathematical Association of America. Sfard, A. (1991). On the dual nature of mathematical conceptions: Reflections on processes and objects as different sides of the same coin. Educational Studies in Mathematics, 22 (1-36). Sfard, A. (2001). Learning mathematics as developing a discourse. In R. Speiser, C. Maher & C. Walter (Eds.), Proceedings of 21st Conference of PME-NA (pp ). Columbus, Ohio: Clearing House for Science, Mathematics, and Environmental Education Sierpinska, A. (1987). Humanities students and epistemological obstacles related to limits. Educational Studies in Mathematics, 18 (4), Sikk, J. (2004). Calculus for Engineers: A Conceptual Modelling Paradigm In M. Demlov & D. Lawson (Eds.), Proceedings of the Twelfth European Seminar of the SEFI MWG (pp ).Vienna: The Vienna University of Technology. Simon, M. A. (1995). Reconstructing mathematics pedagogy from a constructivist perspective. Journal for Research in Mathematics Education, 26, Simon, M. A., Saldanha, L., McClintock, E., Karagotz Akar, G., Watanabe, T., & Zembrat, I. (2007). Sudents' learning through their own activity: Towards a basis for a scientific approach to task design and sequencing. Paper presented at the 29 th annual meeting of North American Chapter of the International Group for the Psychology of Mathematics Education. Melbourne, Australia. Smalling. (1994). Course material for the qualitiative methodology.winter School, Pretoria: HSRC. Smith, N. N. (2008). Student's emergent conceptions of the fundamental theorem of Calculus. Unpublished doctoral dissertation. Arizona State University. State, Country Smith, J.A., & Osborn, M. (2007).Interpretative phenomenological analysis. In JA Smith (Eds) Qualitative Psychology. London: Sage. (2nd ed). 299
312 Schnepp, M., & Nemirvosky, R. (2001). Constructing a foundation for the fundamental theorem of calculus. In A. Cuoco & F. Curcio (Eds.), The role of representation in school mathematics. Reston, VA: NCTM. Steffe, L. P., & Thompson, P. W. (2000). Teaching experiment methodology: Underlying principles and essential elements. In R. Lesh & A. E. Kelly (Eds.), Research design in mathematics and science education (pp. xx-xx). Dordrecht, The Netherlands: Kluwer Academic Publishers. Stephan, M., & Rasmussen, C. (2002). Classroom mathematical practices in differential equations. Journal of Mathematical Behavior, 21, Stewart, J. (1998). Single variable Calculus: Concepts and contexts. Boston, MA: Brooks Cole. Streefland, L. (1991). Fractions in realistic mathematics education. A paradigm of developmental research. Dordrecht: Kluwer Acad. Publ. Dordrecht: Kluwer Academic Publishers. Suzuki, J. (2005). The lost Calculus ( ): Tangency and optimization without limits. Mathematics Magazine, Mathematics Association of America, Swan, M. (1985). The language of functions and Graphs, An examination Module for Secondary Schools. Joint Matriculation Board, Shell Centre for Mathematical Education. Swinyard, C. (2011). Reinventing the formal defintion of limit: The case of Amy and Mike. The Journal of Mathematical Behavior, 30 (2), Tall, D. O. (1991). Setting the Calculus straight. Mathematics Review, 2 (1), 2-6. Tall, D. O. (1993). Students difficulties in Calculus. Paper presented at the Conference Proceedings of the working group 3 ICME-7, Quebec, Canada. Tall, D.O. (1996). Functions and calculus. In A. J. Bishop (Ed.), International handbook of mathematics education (pp ). Dordrecht: Kluwer Academic. Tall, D. O. (2000). Cognitive Development in Advanced Mathematics Using Technology, Mathematics Education Research Journal. 12 (3), Tall, D. O. (2002). Using technology to support an embodied approach to learning concepts in mathematics. Paper presented at the First Coloquio de Historia e Tecnologia no Ensino de Matemática at Universidade do Estado do Rio De Janiero, Rio De Janeiro, Brazil. Tall, D. O. (2004). The three worlds of mathematics. For the Learning of Mathematics, 300
313 23 (3), Tall, D. O. (2007). Embodiment, symbolism and formalism in undergraduate mathematics education. Paper presented at the Keynote presented at the 10th Conference on Research in Undergraduate Mathematics Education, San Diego, California, USA. Tall, D. O. (2008). The transition to formal thinking in mathematics. Mathematics Education Research Journal 20 (2), Retrieved on from Tall, D. O. (2009). Dynamic mathematics and the blending of knowledge structures in the calculus. ZDM The International Journal on Mathematics Education, 41 (4) Tall, D. O., & Meija-Ramos, J. P. (2004). Reflecting on post Calculus-reform. Paper presented at the Plenary for Topic Group 12: Calculus, in 10th International Congress of Mathematics Education, Copenhagen, Denmark. Tall, D. O., Smith, D., & Piez, C. (2008). Technology and Calculus. In M. Heid & M. Blume (Eds.), Research on technology and the teaching and learning of mathematics: Vol. 1, Research Syntheses (pp ): National Council of Teachers of Mathematics. Tall, D. O., & Vinner, S. (1981). Concept image and concept definition in mathematics with special reference to limits and continuity. Educational Studies in Mathematics, 12, Tatar, D., Roschelle, J., Vahey, P., & Penuel, W. (2003). Hand-helds go to school. IEEE Computer, 36 (9), Thompson, P.W. (1994). Images of rate and operational understanding of the Fundamental Theorem of Calculus. Educational Studies in Mathematics 26 (2-3), Thompson, P. W. (2011, in press). Quantitative reasoning and mathematical modelling In L. L. Hatfield, S. Chamberlain & S. Belbase (Eds.), New perspectives ad directions for collaborative research in mathematics education. Laramie, WY: University of Wyoming Press. Thompson, P. W., & Saldanha, L. (1998). Re-thinking co-variation from a quantitative perspective: Simultaneous continuous variation. In S. B. Berensen & W. N. Coulombe, J. Kolb, K. Norwood, & L. Stiff (Eds.), Proceedings of the 20 th Annual Meeting of the North American Chapter of the International Group for the 301
314 Psychology of Mathematics Education ( Vol.1, pp ).north America. Raleigh, NC: North Carolina State University. Thompson, P. W., & Silverman, J. (2008). The concept of accumulation in Calculus. In M. Carlson & C. Rasmussen (Eds.), Making the connection: Research and teaching in undergraduate mathematics (pp ). Washington, DC: Mathematical Association of America. Toulmin, S. (1969). The uses of argument. Cambridge: Cambridge University Press. Traxler, J. (2007). Defining, discussing and evaluating mobile learning: The moving finger writes and having writ... The International Review of Research in Open and Distance Learning, 8 (2). Retrieved on from Treffers, A. (1987). Three dimensions. A model of goal and theory description in mathematics instruction the wiskobas project. Dordrecht: Kluwer Academic Publishers. Van den Heuvel-Panhuizen, M. (1996). Assessment and realistic mathematics education. Utrecht: CD-b Press,Freudenthal Institute, Utrecht University. Van den Heuvel-Panhuizen, M. (2003). The didactical use of models in Realistic Mathematics Education. Educational Studies in Mathematics, 54, Van Maanen, J. (1997). New maths may profit from old methods. For the Learning of Mathematics, 17 (2), Van Oers, B. (1998). From context to contextualizing. In E. Forman & B. van Oers (eds.), Mathematics learning in sociocultural contexts. Special issue of Learning and Instruction, 8(6) Van Rooyen, A. A. (2010). Effective integration of SMS communication into a distance education accounting module. Meditari: Research Journal of the School of Accounting Sciences, 18 (1), Vavoula, N., & Sharples, M. (2002) KLeOS: A personal, mobile, Knowledge and Learning Organisation System. In Milrad, M., Hoppe, U. Kinshuk (eds.) In Proceedings of the IEEE International Workshop on Mobile and Wireless Technologies in Education (WMTE2002), Aug 29-30, Vaxjo, Sweden, pp Viljoen, J. D., & CarlCook, A. (2005). The case for using SMS technologies to support distance education students in South Africa: Conversations. Perspectives in 302
315 Education: Research on ICTs and Education in South Africa, Special Issue, 4 (23), Vinner, S. (1991). The role of definitions in the teaching and learning of mathematics. In D. Tall (Ed.), Advanced mathematical thinking (pp ). Dordrecht: Kluwer Academic Publishers. Vygotsky, L. (1978). Mind in society. Cambridge, MA: Harvard University Press. Wagner, E. D. (2005). Enabling mobile learning. Educause Review, 40 (3), Wawro, M. (2011). Individual and collective analyses of the genesis of student reasoning regarding the Invertible Matrix Theorem in linear algebra. Dissertation Abstracts International, 72 (11). Retrieved from Dissertations & Theses: Full Text. (Publication No. AAT ). Wei, F.-S., & Chen, G.-D. (2006). Collaborative mentor support in a learning context using a ubiquitous discussion forum to facilitate knowledge sharing for lifelong learning. British Journal of Educational Technology, 37 (6), White, P., & Mitchelmore, M. (1996). Conceptual knowledge in introductory Calculus. Journal for Research in Mathematics Education, 27 (1), Williams, S. R. (1991). Models of limit held by college Calculus students. Journal for Research in Mathematics Education, 22 (3), Wilson, B. (1995). Situated instructional design: Blurring the distinctions between theory and practice, design and implementation, curriculum and instruction. Paper presented at the 1995 Annual National Convention of the Association for Educational Communications and Technology (AECT), Anaheim, CA. Woo, J. H. (2007). School mathematics and cultivation of mind. In J. H. Woo, H. C. Lew, K. S. Park & D. Y. Seo (Eds.), Proceedings of the 31st Conference of the International Group for the Psychology of Mathematics Education (Vol. 1, pp ). Seoul: PME. Wren, F. L., & Garrett, J. A. (1933). The development of the fundamental concepts of infinitesimal analysis. The American Mathematical Monthly, 40 (5), Yackel, E., Stephan, M., Rasmussen, C., & Underwood, D. (2003). Didactising: Continuing the work of Leen Streefland. Education Studies in Mathematics, 54,
316 Yerushalmy, M., & Ben-Zaken, O. (2004). Mobile phones in education: The case formathematics. Haifa. Retrieved from report.pdf Yerushalmy, M., & Sternberg, B. (2004). Didactic model bridging a concept with phenomena. Proceedings of the 28th Conference of the International Group for the Psychology of Mathematics Education (Vol. 4, pp ). Yousckevitch, A. P. (1976). The concept of function up to the middle of the 19th century. Archive for History of Exact Sciences, 16, Zandieh, M. (1997). The evolution of student understanding for the concept of derivative. Doctoral dissertation. Oregon State University. Zandieh, M., & Rasmussen, C. (2007). A case study of defining: Creating a new mathematical reality. Mathematical Thinking and Learning(in preparation). Zandieh, M., & Rasmussen, C. (2010). Defining as a mathematical activity: A framework for characterizing progress from informal to more formal ways of reasoning. The Journal of Mathematical Behavior, 29 (2), Zulkardi. (2002). Developing a learning environment on Realistic Mathematics Education for Indonesian student teachers. Paper presented in the IAMS-1 seminar at the Faculty of Mathematics at the University of Twente, June

317 APPENDICES Appendix A: The Mobile Pretest 305
318 Appendix B: First HLT 306
319 307
320 308
321 309
322 310
323 311
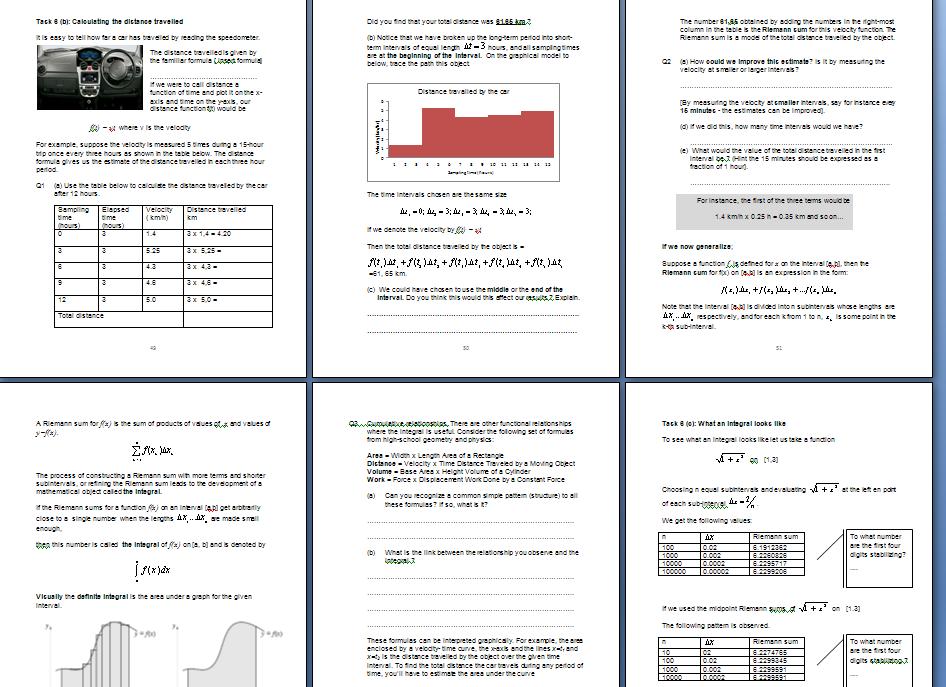
324 312
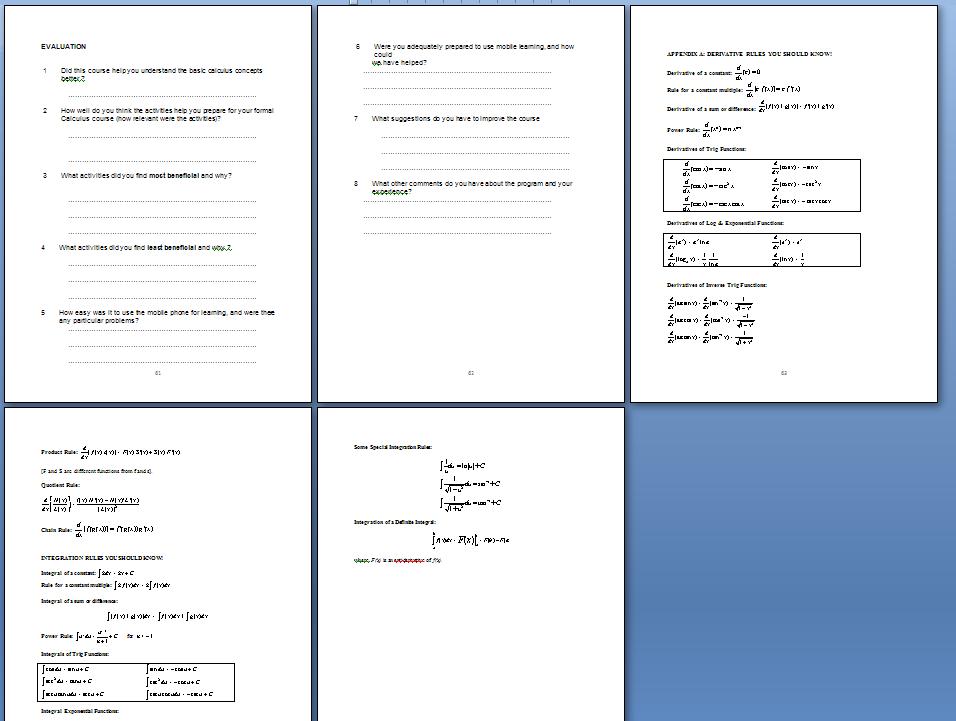
325 313
326 Appendix C: Second HLT 314
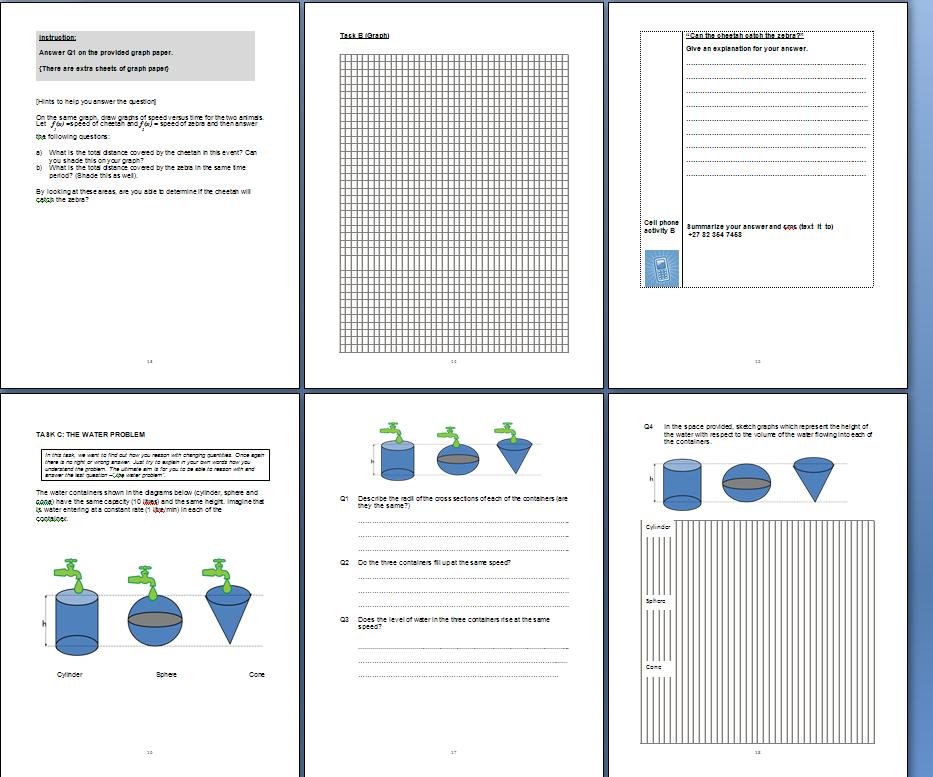
327 315
328 316
329 317
330 318
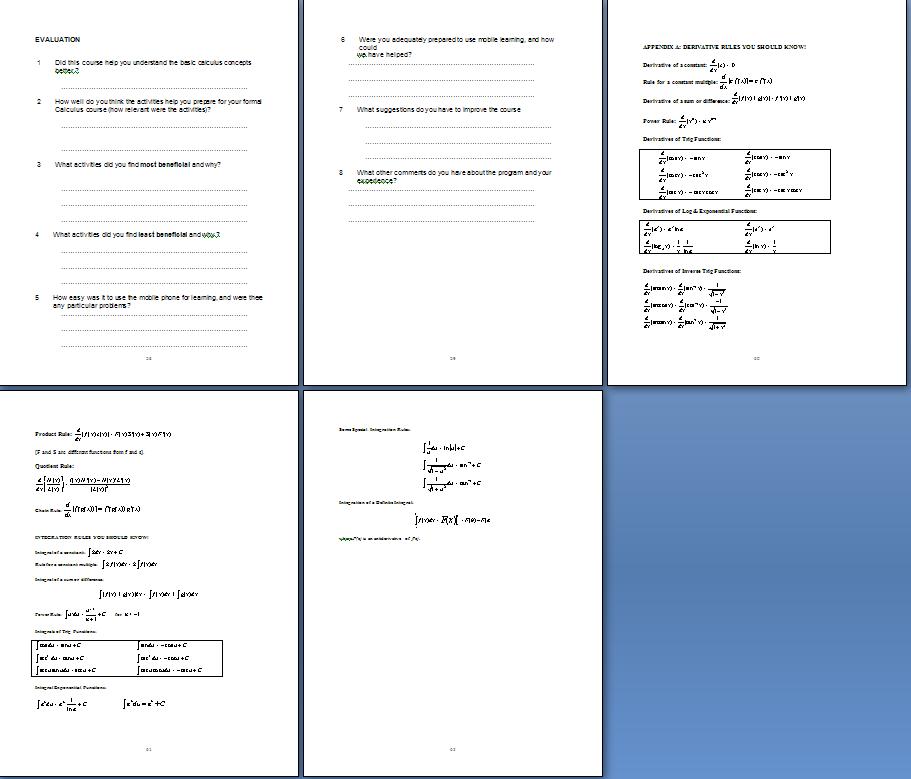
331 319
332 Appendix D:Third HLT 320
333 321
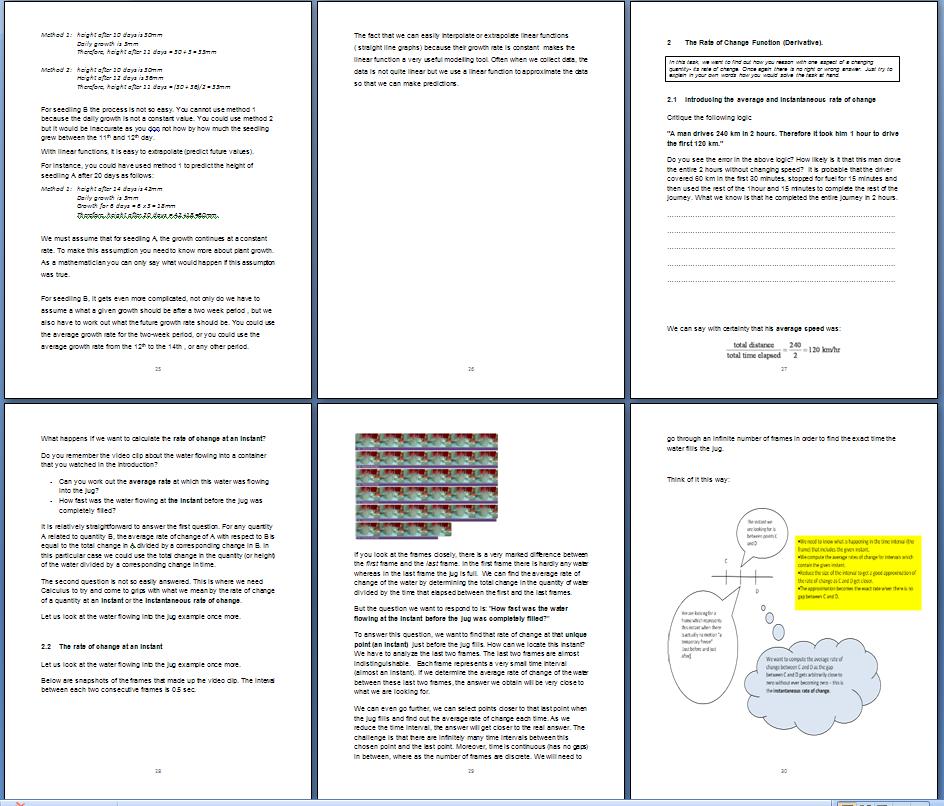
334 322
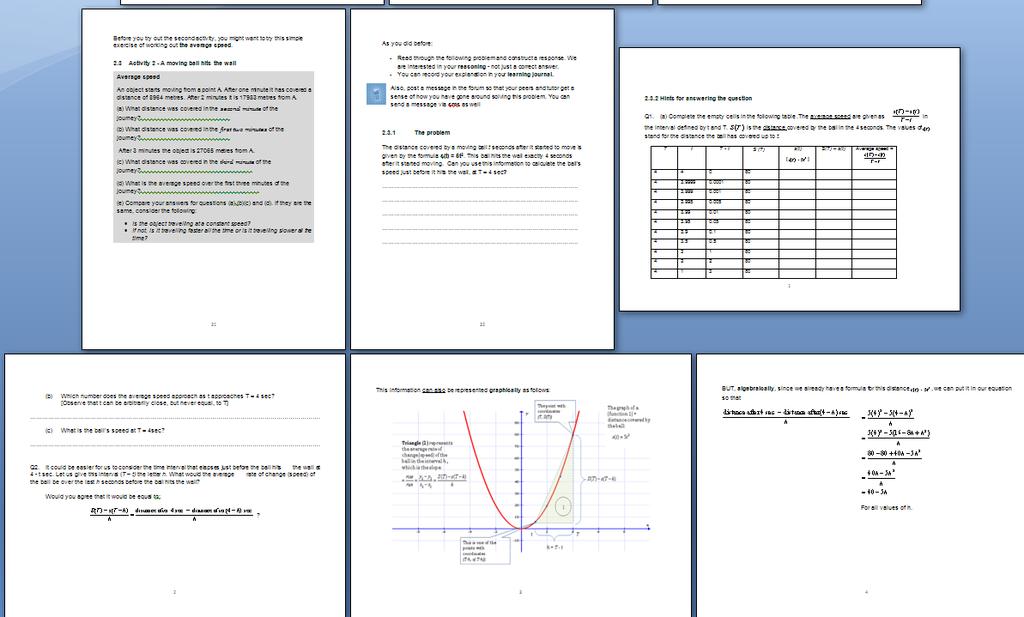
335 323
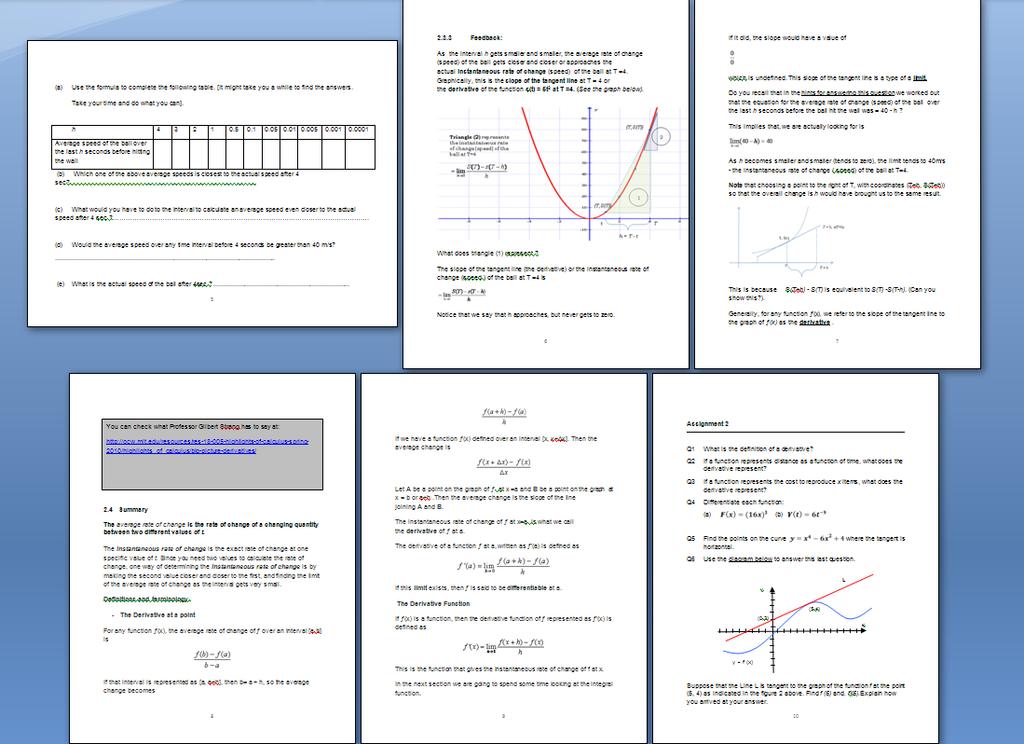
336 324
337 325
338 326
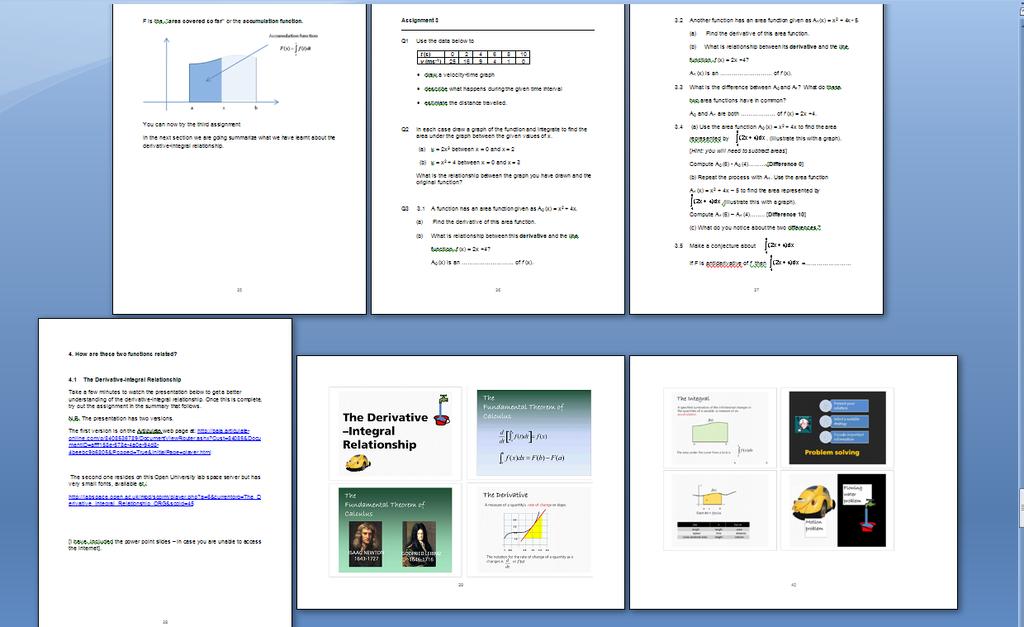
339 327
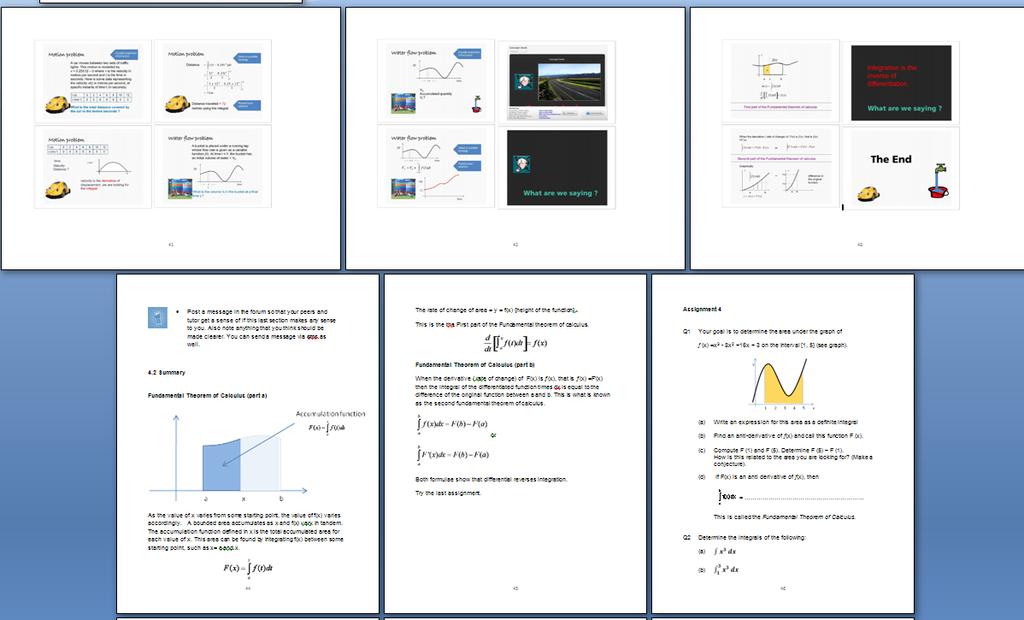
340 328
341 329
342 Appendix E: Comments from RME experts 330
343 Comments from RME experts (includes only pages where there are comments) 331
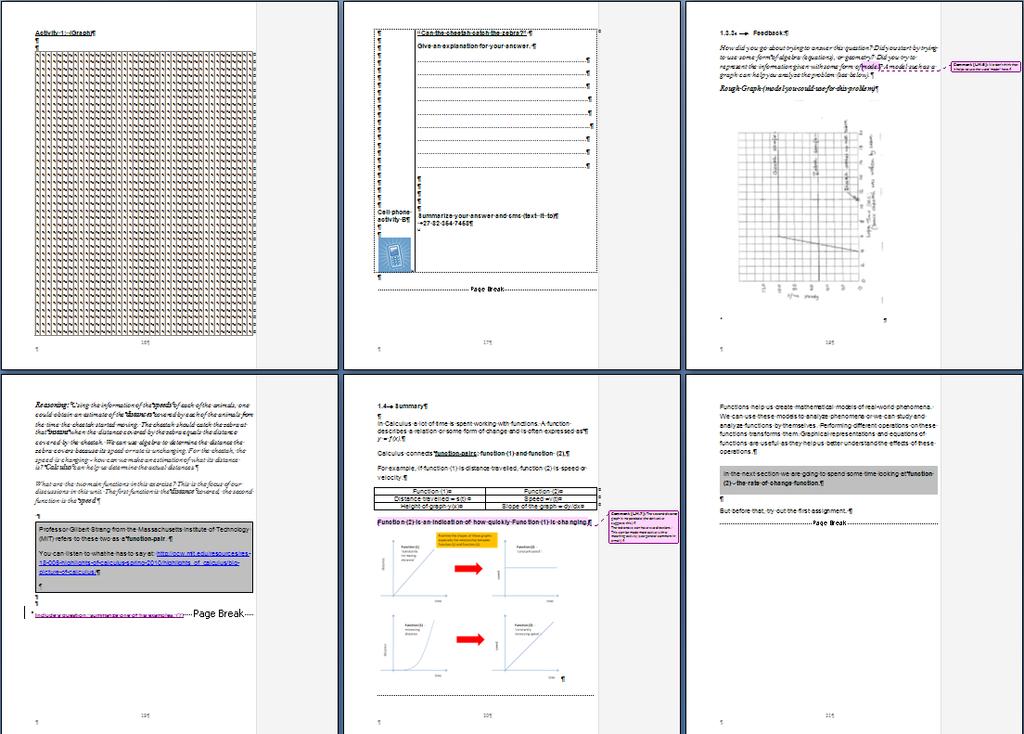
344 332
345 333
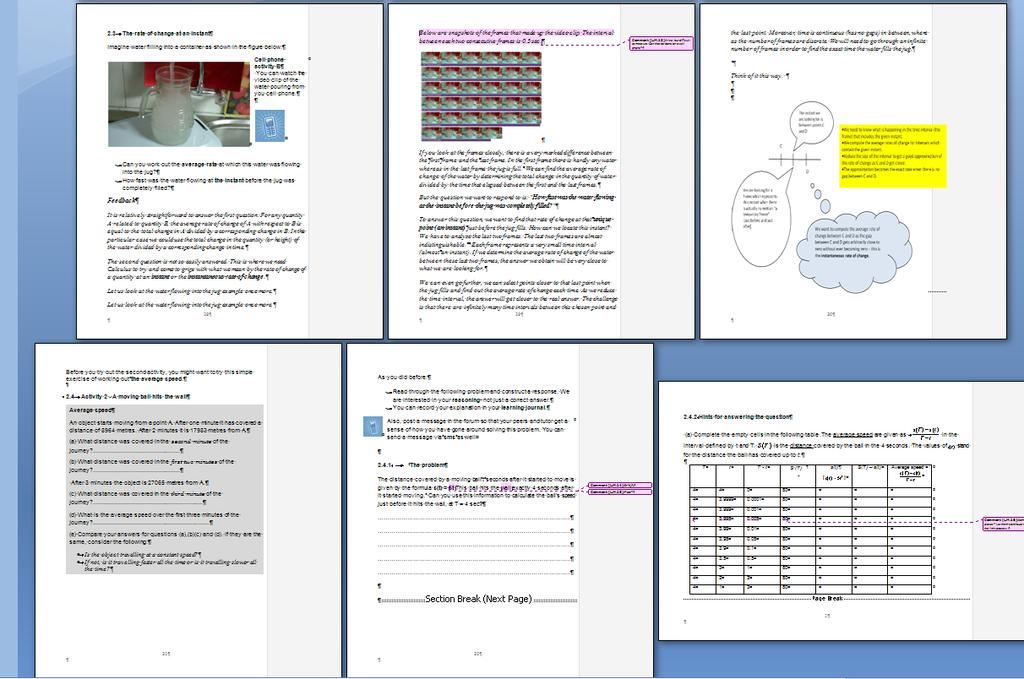
346 334
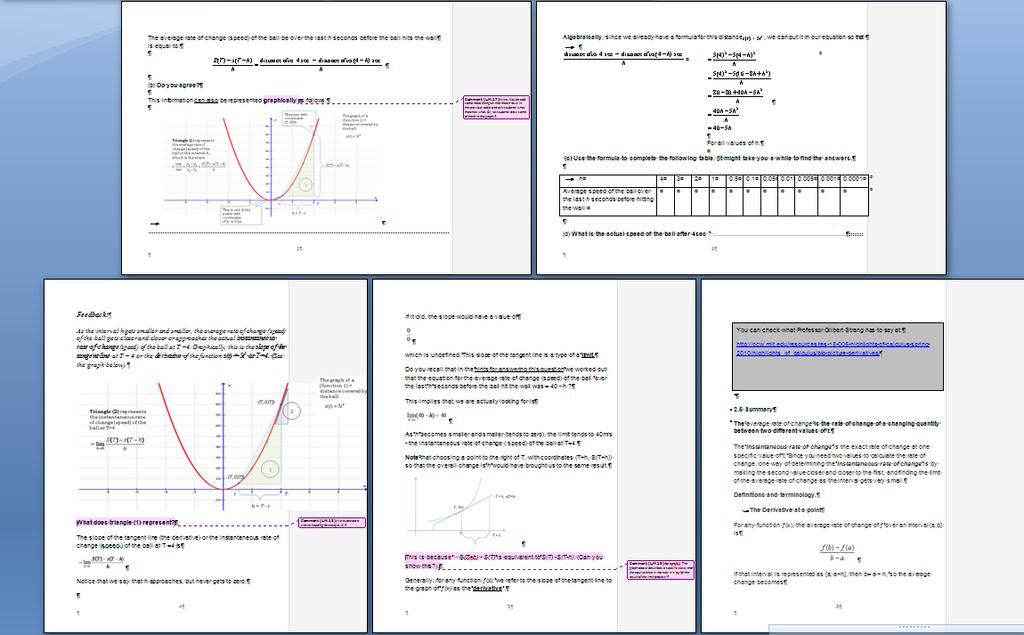
347 335
348 336
349 Appendix F: The Interview Schedule Interview on task performance and representational understanding of rate-of-change and accumulation of a function Goal for this interview: To assess the students intuitive understanding of the rate-of-change of a function, its accumulation and the relationship between them. This is used as a mechanism for investigating student understanding of the basic Calculus concepts (the derivative and the integral) as they are introduced in a distance learning environment. The focus is on seeing how students use mathematical techniques (numerical, graphical and symbolic) to solve tasks and how best they can be guided to re-invent their own understanding of these basic concepts for themselves. The interview consists of four parts: Reasoning with graphs (Cheetah/Zebra) The water problem The Derivative Function Area and the Fundamental theorem of Calculus. *[Note to the interviewer: In each of the interviews try to probe into the respondents understanding of what they are answering].anything in brackets [] is meant for the interviewer only. PART 1: REASONING WITH GRAPHS (CHEETAH/ZEBRA) TASK B In your own words, could you tell me what the word speed (or rate of change) means to you? [Look at how each student has responded to Q1 a) and b) and see if it makes sense or not, then ask]. Explain how you arrived at your answer. [Make sure that each respondent describes the path of each animal, marking the starting points clearly]. What does the area under a speed versus time graph tell you about the each function f 1 and f 2? PART 2: THE WATER PROBLEM TASK C Explain why you say that the radii of the cross sections of each of the containers are the same (or different). 337
350 Which container fills up fastest? Why? Which container fills up the slowest? Why? [Probe the students to establish what reasons are behind their explanations]. Is your answer based on the shape of the container, the height, the speed or a combination? Is there a difference between your response to Q2 and Q3 [if so, probe further]. Why do you think there is a difference? Explain in your own words the graphs you have drawn. For instance in cases where the graph is straight, curved, has a positive or negative gradient, explain why this happens and how this relates to the change in height of the water in the container. Do you have any problems with completing Q6? PART 3: THE DERIVATIVE FUNCTION TASK D In your own words, explain how you drew the interest versus time and interest rate versus time graphs. After working thorough task D, do you think you understand the concept of the derivative? Explain in your own words what the term derivative means. What does the term derivative function mean? Were there any parts of this task you found difficult to complete? If so, what were they? PART 4: AREA AND THE FUNDAMENTAL THEOREM OF CALCULUS TASK E Questions 1-6 are designed to introduce you to the concept of the integral briefly. Explain in your own words what the term integral means. What is an integral function? 338
351 Look at the graph for Q7 once again and explain in your own words what the expression x A( x) = f () t dt means to you. a Why are we saying that x d d f () t dt = f ( x) dx or that [ Ax ( )] f ( x ) 0 dx =? Does this make sense to you? Use your own words to explain this. You can use a graph to help with your explanations if you wish. * This interview schedule was developed by Rita Kizito. 339
352 Appendix G: The Last Trajectory Questions PRE-TEST: The trajectory will begin with Pre-Test QUESTION 1 (a) Taken from Swan (1982, p.94) 340
353 b) The water problem Imagine this bottle filling with water. Sketch a graph of the height as a function of the amount of water that s in the bottle. Graph 341
354 (c) Assessment Task Taken from Swan (1982, p.52) 342

355 QUESTION 2 (a) Taken from Swan (1982, p.102) 343

356 (b) Reasoning with graphs A cheetah is awakened from its afternoon nap by a zebra's hooves. This zebra is traveling at its top speed and has still has plenty of energy to maintain this speed. At the moment the cheetah decides to give chase, the zebra has a lead of 200 meters. Note: A cheetah can reach a steadily reach a speed of 100 m/s in 2 seconds and can maintain that speed for 6 seconds. The zebra, whose top speed is 50m/s, can maintain this speed for more than 6 km. Taking into consideration the above data on the running powers of the cheetah and the zebra,...can the cheetah catch up with the zebra? On the same grid, draw graphs of speed versus time for the two animals. Let c(x) = speed of cheetah and z(x) =speed of zebra What values are you placing on the x-axis and the y-axis and why? What has guided the choice of your scale? What is your starting point? Is it (0, 0)? If not, why have you selected another point? Can you identify the point where the zebra is at the time the cheetah starts moving? Can you identify the point where the zebra is at the time the cheetah starts cheetah reaches its top speed?...can the cheetah catch the zebra?: Hint Reasoning: Using the information of the speeds of each of the animals, one could obtain an estimate of the distances covered by each of the animals from the time the cheetah started moving. The cheetah should catch the zebra at that instant when the distance covered by the zebra equals the distance covered by the cheetah. We can use algebra to determine the distance the zebra covers because its speed or rate is unchanging. For the cheetah, the speed is changing - how can we make an estimation of what its distance is? Calculus can help us determine the actual distances. 344
357 (c) Sketching graphs from tables A Biology class measured the height of the seedlings over a two week period. The following information was recorded. Day Seedling A (height in mm) Seedling B (height in mm) Q1 What was the daily growth of seedling A? Q2 What was the daily growth of seedling B? Q3 Q4 Q5 What is the difference about the growth of the two seedlings? When was seedling A 21mm tall? Explain your method of calculation. When was seedling B 21mm tall? Explain your method of calculation. Q6 After 11 days what was the height of seedling A? Q7 After 11 days what was the height of seedling A? Q8 Plot the heights of both seedlings over the two week period on the same graph. Seedling heights 60 Height (mm) Age (days)

358 (d) Taken from Swan (1982, p.110) 346
359 QUESTION 3 Critique the following logic "A man drives 120 km in 2 hours. Therefore it took him 1 hour to drive the first 60 km." The distance covered by a moving ball t seconds after it started to move is given by the formula s(t) = 5t 2 This ball hits the wall exactly 4 seconds after it started moving. Can you use this information to calculate the ball's speed just before it hits the wall, at T = 4 s? Assessment Q1 What is the definition of a derivative? Q2 If a function represents distance as a function of time, what does the derivative represent? Q3 If a function represents the cost to reproduce x items, what does the derivative represent? Q4 Use the diagram below to answer this last question. L y (5,4) (0,2) x y = f (x) Suppose that the Line L is tangent to the graph of the function f at the point (5, 4) as indicated in the figure 2 above. Find f (5) and, f (5).Explain how you arrived at your answer. 347

 = t 2 + 1. What is the exact distance it covers in the first three seconds?")
.")
360 QUESTION 4 Use the following graph to determine the distance travelled by a vehicle during an eight-hour journey. You may assume that the time it took to reach 60 km/h initially and the stopping time are negligible. Explain your technique clearly and discuss ways that could improve your estimate.is there any way of exactly determining the distance travelled? An object is moving with a speed ƒ(t) = t What is the exact distance it covers in the first three seconds? Remember, this is the same as finding the exact area under the curve ƒ(t) = t between t = 0and t = 3. (see shaded area in the graph below. Also note that this object is moving continuously and smoothly (with no breaks). In each of the cases below draw a graph of the function and integrate to find the area under the graph between the given values of x. 1. y = 2x 3 between x = 0 and x = 2 2. y = x between x = 0 and x = 3 348
DIDACTIC MODEL BRIDGING A CONCEPT WITH PHENOMENA
 DIDACTIC MODEL BRIDGING A CONCEPT WITH PHENOMENA Beba Shternberg, Center for Educational Technology, Israel Michal Yerushalmy University of Haifa, Israel The article focuses on a specific method of constructing
Mathematics Program Assessment Plan
 Mathematics Program Assessment Plan Introduction This assessment plan is tentative and will continue to be refined as needed to best fit the requirements of the Board of Regent s and UAS Program Review
AP Calculus AB. Nevada Academic Standards that are assessable at the local level only.
 Calculus AB Priority Keys Aligned with Nevada Standards MA I MI L S MA represents a Major content area. Any concept labeled MA is something of central importance to the entire class/curriculum; it is a
FIRST ADDITIONAL LANGUAGE: Afrikaans Eerste Addisionele Taal 1
 MODULE NAME: FIRST ADDITIONAL LANGUAGE: Afrikaans Eerste Addisionele Taal 1 MODULE CODE: FAFR6121 ASSESSMENT TYPE: ASSIGNMENT 1 (PAPER ONLY) TOTAL MARK ALLOCATION: 100 MARKS TOTAL HOURS: 10 HOURS By submitting
MTH 141 Calculus 1 Syllabus Spring 2017
 Instructor: Section/Meets Office Hrs: Textbook: Calculus: Single Variable, by Hughes-Hallet et al, 6th ed., Wiley. Also needed: access code to WileyPlus (included in new books) Calculator: Not required,
Designing a Rubric to Assess the Modelling Phase of Student Design Projects in Upper Year Engineering Courses
 Designing a Rubric to Assess the Modelling Phase of Student Design Projects in Upper Year Engineering Courses Thomas F.C. Woodhall Masters Candidate in Civil Engineering Queen s University at Kingston,
Statewide Framework Document for:
 Statewide Framework Document for: 270301 Standards may be added to this document prior to submission, but may not be removed from the framework to meet state credit equivalency requirements. Performance
Using Realistic Mathematics Education with low to middle attaining pupils in secondary schools
 Using Realistic Mathematics Education with low to middle attaining pupils in secondary schools Paul Dickinson, Frank Eade, Steve Gough, Sue Hough Manchester Metropolitan University Institute of Education
Digital Fabrication and Aunt Sarah: Enabling Quadratic Explorations via Technology. Michael L. Connell University of Houston - Downtown
 Digital Fabrication and Aunt Sarah: Enabling Quadratic Explorations via Technology Michael L. Connell University of Houston - Downtown Sergei Abramovich State University of New York at Potsdam Introduction
THE ROLE OF TOOL AND TEACHER MEDIATIONS IN THE CONSTRUCTION OF MEANINGS FOR REFLECTION
 THE ROLE OF TOOL AND TEACHER MEDIATIONS IN THE CONSTRUCTION OF MEANINGS FOR REFLECTION Lulu Healy Programa de Estudos Pós-Graduados em Educação Matemática, PUC, São Paulo ABSTRACT This article reports
Mathematics subject curriculum
 Mathematics subject curriculum Dette er ei omsetjing av den fastsette læreplanteksten. Læreplanen er fastsett på Nynorsk Established as a Regulation by the Ministry of Education and Research on 24 June
This Performance Standards include four major components. They are
 Environmental Physics Standards The Georgia Performance Standards are designed to provide students with the knowledge and skills for proficiency in science. The Project 2061 s Benchmarks for Science Literacy
The Effectiveness of Realistic Mathematics Education Approach on Ability of Students Mathematical Concept Understanding
 International Journal of Sciences: Basic and Applied Research (IJSBAR) ISSN 2307-4531 (Print & Online) http://gssrr.org/index.php?journal=journalofbasicandapplied ---------------------------------------------------------------------------------------------------------------------------
AGS THE GREAT REVIEW GAME FOR PRE-ALGEBRA (CD) CORRELATED TO CALIFORNIA CONTENT STANDARDS
 CORRELATED TO CALIFORNIA CONTENT STANDARDS") AGS THE GREAT REVIEW GAME FOR PRE-ALGEBRA (CD) CORRELATED TO CALIFORNIA CONTENT STANDARDS 1 CALIFORNIA CONTENT STANDARDS: Chapter 1 ALGEBRA AND WHOLE NUMBERS Algebra and Functions 1.4 Students use algebraic
AGS THE GREAT REVIEW GAME FOR PRE-ALGEBRA (CD) CORRELATED TO CALIFORNIA CONTENT STANDARDS 1 CALIFORNIA CONTENT STANDARDS: Chapter 1 ALGEBRA AND WHOLE NUMBERS Algebra and Functions 1.4 Students use algebraic
SURVIVING ON MARS WITH GEOGEBRA
 SURVIVING ON MARS WITH GEOGEBRA Lindsey States and Jenna Odom Miami University, OH Abstract: In this paper, the authors describe an interdisciplinary lesson focused on determining how long an astronaut
Learning from and Adapting the Theory of Realistic Mathematics education
 Éducation et didactique vol 2 - n 1 2008 Varia Learning from and Adapting the Theory of Realistic Mathematics education Paul Cobb, Qing Zhao and Jana Visnovska Publisher Presses universitaires de Rennes
SPATIAL SENSE : TRANSLATING CURRICULUM INNOVATION INTO CLASSROOM PRACTICE
 SPATIAL SENSE : TRANSLATING CURRICULUM INNOVATION INTO CLASSROOM PRACTICE Kate Bennie Mathematics Learning and Teaching Initiative (MALATI) Sarie Smit Centre for Education Development, University of Stellenbosch
Exploring Derivative Functions using HP Prime
 Exploring Derivative Functions using HP Prime Betty Voon Wan Niu betty@uniten.edu.my College of Engineering Universiti Tenaga Nasional Malaysia Wong Ling Shing Faculty of Health and Life Sciences, INTI
Extending Place Value with Whole Numbers to 1,000,000
 Grade 4 Mathematics, Quarter 1, Unit 1.1 Extending Place Value with Whole Numbers to 1,000,000 Overview Number of Instructional Days: 10 (1 day = 45 minutes) Content to Be Learned Recognize that a digit
Math Pathways Task Force Recommendations February Background
 Math Pathways Task Force Recommendations February 2017 Background In October 2011, Oklahoma joined Complete College America (CCA) to increase the number of degrees and certificates earned in Oklahoma.
Dakar Framework for Action. Education for All: Meeting our Collective Commitments. World Education Forum Dakar, Senegal, April 2000
 Dakar Framework for Action Education for All: Meeting our Collective Commitments Text adopted by the World Education Forum Dakar, Senegal, 26-28 April 2000 Dakar Framework for Action Education for All:
Math 181, Calculus I
 Math 181, Calculus I [Semester] [Class meeting days/times] [Location] INSTRUCTOR INFORMATION: Name: Office location: Office hours: Mailbox: Phone: Email: Required Material and Access: Textbook: Stewart,
Course Name: Elementary Calculus Course Number: Math 2103 Semester: Fall Phone:
 Course Name: Elementary Calculus Course Number: Math 2103 Semester: Fall 2011 Instructor s Name: Ricky Streight Hours Credit: 3 Phone: 405-945-6794 email: ricky.streight@okstate.edu 1. COURSE: Math 2103
Degree Qualification Profiles Intellectual Skills
 Degree Qualification Profiles Intellectual Skills Intellectual Skills: These are cross-cutting skills that should transcend disciplinary boundaries. Students need all of these Intellectual Skills to acquire
The Journal of Mathematical Behavior
 Journal of Mathematical Behavior 31 (2012) 117 129 Contents lists available at ScienceDirect The Journal of Mathematical Behavior journa l h o me pag e: ww w.elsevier.com/locate/jmathb Teacher listening:
Document number: 2013/ Programs Committee 6/2014 (July) Agenda Item 42.0 Bachelor of Engineering with Honours in Software Engineering
 Agenda Item 42.0 Bachelor of Engineering with Honours in Software Engineering") Document number: 2013/0006139 Programs Committee 6/2014 (July) Agenda Item 42.0 Bachelor of Engineering with Honours in Software Engineering Program Learning Outcomes Threshold Learning Outcomes for Engineering
Document number: 2013/0006139 Programs Committee 6/2014 (July) Agenda Item 42.0 Bachelor of Engineering with Honours in Software Engineering Program Learning Outcomes Threshold Learning Outcomes for Engineering
Radius STEM Readiness TM
 Curriculum Guide Radius STEM Readiness TM While today s teens are surrounded by technology, we face a stark and imminent shortage of graduates pursuing careers in Science, Technology, Engineering, and
COMPETENCY-BASED STATISTICS COURSES WITH FLEXIBLE LEARNING MATERIALS
 COMPETENCY-BASED STATISTICS COURSES WITH FLEXIBLE LEARNING MATERIALS Martin M. A. Valcke, Open Universiteit, Educational Technology Expertise Centre, The Netherlands This paper focuses on research and
AGENDA LEARNING THEORIES LEARNING THEORIES. Advanced Learning Theories 2/22/2016
 AGENDA Advanced Learning Theories Alejandra J. Magana, Ph.D. admagana@purdue.edu Introduction to Learning Theories Role of Learning Theories and Frameworks Learning Design Research Design Dual Coding Theory
Montana Content Standards for Mathematics Grade 3. Montana Content Standards for Mathematical Practices and Mathematics Content Adopted November 2011
 Montana Content Standards for Mathematics Grade 3 Montana Content Standards for Mathematical Practices and Mathematics Content Adopted November 2011 Contents Standards for Mathematical Practice: Grade
EQuIP Review Feedback
 EQuIP Review Feedback Lesson/Unit Name: On the Rainy River and The Red Convertible (Module 4, Unit 1) Content Area: English language arts Grade Level: 11 Dimension I Alignment to the Depth of the CCSS
Higher education is becoming a major driver of economic competitiveness
 Executive Summary Higher education is becoming a major driver of economic competitiveness in an increasingly knowledge-driven global economy. The imperative for countries to improve employment skills calls
P. Belsis, C. Sgouropoulou, K. Sfikas, G. Pantziou, C. Skourlas, J. Varnas
 Exploiting Distance Learning Methods and Multimediaenhanced instructional content to support IT Curricula in Greek Technological Educational Institutes P. Belsis, C. Sgouropoulou, K. Sfikas, G. Pantziou,
Helping Graduate Students Join an Online Learning Community
 EDUCAUSE Review. Monday, May 22, 2017 http://er.educause.edu/articles/2017/5/helping-graduate-students-join-an-online-learning-community Helping Graduate Students Join an Online Learning Community by Christina
University of Groningen. Systemen, planning, netwerken Bosman, Aart
 University of Groningen Systemen, planning, netwerken Bosman, Aart IMPORTANT NOTE: You are advised to consult the publisher's version (publisher's PDF) if you wish to cite from it. Please check the document
prehending general textbooks, but are unable to compensate these problems on the micro level in comprehending mathematical texts.
 Summary Chapter 1 of this thesis shows that language plays an important role in education. Students are expected to learn from textbooks on their own, to listen actively to the instruction of the teacher,
Handbook of Research Design in Mathematics and Science Education
 Handbook of Research Design in Mathematics and Science Education Edited by Anthony E. Kelly Rutgers University Richard A. Lesh Purdue University LAWRENCE ERLBAUM ASSOCIATES, PUBLISHERS 2000 Mahwah, New
Julia Smith. Effective Classroom Approaches to.
 Julia Smith @tessmaths Effective Classroom Approaches to GCSE Maths resits julia.smith@writtle.ac.uk Agenda The context of GCSE resit in a post-16 setting An overview of the new GCSE Key features of a
Understanding and improving professional development for college mathematics instructors: An exploratory study
 Understanding and improving professional development for college mathematics instructors: An exploratory study Natasha M. Speer & Jon R. Star Michigan State University The past two decades have seen increased
Self Study Report Computer Science
 Computer Science undergraduate students have access to undergraduate teaching, and general computing facilities in three buildings. Two large classrooms are housed in the Davis Centre, which hold about
EDIT 576 DL1 (2 credits) Mobile Learning and Applications Fall Semester 2014 August 25 October 12, 2014 Fully Online Course
 Mobile Learning and Applications Fall Semester 2014 August 25 October 12, 2014 Fully Online Course") GEORGE MASON UNIVERSITY COLLEGE OF EDUCATION AND HUMAN DEVELOPMENT GRADUATE SCHOOL OF EDUCATION INSTRUCTIONAL DESIGN AND TECHNOLOGY PROGRAM EDIT 576 DL1 (2 credits) Mobile Learning and Applications Fall
GEORGE MASON UNIVERSITY COLLEGE OF EDUCATION AND HUMAN DEVELOPMENT GRADUATE SCHOOL OF EDUCATION INSTRUCTIONAL DESIGN AND TECHNOLOGY PROGRAM EDIT 576 DL1 (2 credits) Mobile Learning and Applications Fall
Arizona s English Language Arts Standards th Grade ARIZONA DEPARTMENT OF EDUCATION HIGH ACADEMIC STANDARDS FOR STUDENTS
 Arizona s English Language Arts Standards 11-12th Grade ARIZONA DEPARTMENT OF EDUCATION HIGH ACADEMIC STANDARDS FOR STUDENTS 11 th -12 th Grade Overview Arizona s English Language Arts Standards work together
Logical Soft Systems Methodology for Education Programme Development
 Issues in Informing Science and Information Technology Logical Soft Systems Methodology for Education Programme Development Ho-Leung Tsoi Caritas Francis Hsu College, Hong Kong hltsoi@yahoo.com Abstract
Kentucky s Standards for Teaching and Learning. Kentucky s Learning Goals and Academic Expectations
 Kentucky s Standards for Teaching and Learning Included in this section are the: Kentucky s Learning Goals and Academic Expectations Kentucky New Teacher Standards (Note: For your reference, the KDE website
First Grade Standards
 These are the standards for what is taught throughout the year in First Grade. It is the expectation that these skills will be reinforced after they have been taught. Mathematical Practice Standards Taught
Introduction and Motivation
 1 Introduction and Motivation Mathematical discoveries, small or great are never born of spontaneous generation. They always presuppose a soil seeded with preliminary knowledge and well prepared by labour,
A cautionary note is research still caught up in an implementer approach to the teacher?
 A cautionary note is research still caught up in an implementer approach to the teacher? Jeppe Skott Växjö University, Sweden & the University of Aarhus, Denmark Abstract: In this paper I outline two historically
1. Programme title and designation International Management N/A
 PROGRAMME APPROVAL FORM SECTION 1 THE PROGRAMME SPECIFICATION 1. Programme title and designation International Management 2. Final award Award Title Credit value ECTS Any special criteria equivalent MSc
Penn State University - University Park MATH 140 Instructor Syllabus, Calculus with Analytic Geometry I Fall 2010
 Penn State University - University Park MATH 140 Instructor Syllabus, Calculus with Analytic Geometry I Fall 2010 There are two ways to live: you can live as if nothing is a miracle; you can live as if
Maximizing Learning Through Course Alignment and Experience with Different Types of Knowledge
 Innov High Educ (2009) 34:93 103 DOI 10.1007/s10755-009-9095-2 Maximizing Learning Through Course Alignment and Experience with Different Types of Knowledge Phyllis Blumberg Published online: 3 February
Professional Learning Suite Framework Edition Domain 3 Course Index
 Domain 3: Instruction Professional Learning Suite Framework Edition Domain 3 Course Index Courses included in the Professional Learning Suite Framework Edition related to Domain 3 of the Framework for
Guest Editorial Motivating Growth of Mathematics Knowledge for Teaching: A Case for Secondary Mathematics Teacher Education
 The Mathematics Educator 2008, Vol. 18, No. 2, 3 10 Guest Editorial Motivating Growth of Mathematics Knowledge for Teaching: A Case for Secondary Mathematics Teacher Education Azita Manouchehri There is
Evaluation of Learning Management System software. Part II of LMS Evaluation
 Version DRAFT 1.0 Evaluation of Learning Management System software Author: Richard Wyles Date: 1 August 2003 Part II of LMS Evaluation Open Source e-learning Environment and Community Platform Project
Timeline. Recommendations
 Introduction Advanced Placement Course Credit Alignment Recommendations In 2007, the State of Ohio Legislature passed legislation mandating the Board of Regents to recommend and the Chancellor to adopt
Grade 6: Correlated to AGS Basic Math Skills
 Grade 6: Correlated to AGS Basic Math Skills Grade 6: Standard 1 Number Sense Students compare and order positive and negative integers, decimals, fractions, and mixed numbers. They find multiples and
Learning Disability Functional Capacity Evaluation. Dear Doctor,
 Dear Doctor, I have been asked to formulate a vocational opinion regarding NAME s employability in light of his/her learning disability. To assist me with this evaluation I would appreciate if you can
ICTCM 28th International Conference on Technology in Collegiate Mathematics
 DEVELOPING DIGITAL LITERACY IN THE CALCULUS SEQUENCE Dr. Jeremy Brazas Georgia State University Department of Mathematics and Statistics 30 Pryor Street Atlanta, GA 30303 jbrazas@gsu.edu Dr. Todd Abel
South Carolina English Language Arts
 South Carolina English Language Arts A S O F J U N E 2 0, 2 0 1 0, T H I S S TAT E H A D A D O P T E D T H E CO M M O N CO R E S TAT E S TA N DA R D S. DOCUMENTS REVIEWED South Carolina Academic Content
NCSC Alternate Assessments and Instructional Materials Based on Common Core State Standards
 NCSC Alternate Assessments and Instructional Materials Based on Common Core State Standards Ricki Sabia, JD NCSC Parent Training and Technical Assistance Specialist ricki.sabia@uky.edu Background Alternate
Syllabus ENGR 190 Introductory Calculus (QR)
") Syllabus ENGR 190 Introductory Calculus (QR) Catalog Data: ENGR 190 Introductory Calculus (4 credit hours). Note: This course may not be used for credit toward the J.B. Speed School of Engineering B. S.
Syllabus ENGR 190 Introductory Calculus (QR) Catalog Data: ENGR 190 Introductory Calculus (4 credit hours). Note: This course may not be used for credit toward the J.B. Speed School of Engineering B. S.
Developing an Assessment Plan to Learn About Student Learning
 Developing an Assessment Plan to Learn About Student Learning By Peggy L. Maki, Senior Scholar, Assessing for Learning American Association for Higher Education (pre-publication version of article that
Pedagogical Content Knowledge for Teaching Primary Mathematics: A Case Study of Two Teachers
 Pedagogical Content Knowledge for Teaching Primary Mathematics: A Case Study of Two Teachers Monica Baker University of Melbourne mbaker@huntingtower.vic.edu.au Helen Chick University of Melbourne h.chick@unimelb.edu.au
Objectives. Chapter 2: The Representation of Knowledge. Expert Systems: Principles and Programming, Fourth Edition
 Chapter 2: The Representation of Knowledge Expert Systems: Principles and Programming, Fourth Edition Objectives Introduce the study of logic Learn the difference between formal logic and informal logic
CHALLENGES FACING DEVELOPMENT OF STRATEGIC PLANS IN PUBLIC SECONDARY SCHOOLS IN MWINGI CENTRAL DISTRICT, KENYA
 CHALLENGES FACING DEVELOPMENT OF STRATEGIC PLANS IN PUBLIC SECONDARY SCHOOLS IN MWINGI CENTRAL DISTRICT, KENYA By Koma Timothy Mutua Reg. No. GMB/M/0870/08/11 A Research Project Submitted In Partial Fulfilment
THEORETICAL CONSIDERATIONS
 Cite as: Jones, K. and Fujita, T. (2002), The Design Of Geometry Teaching: learning from the geometry textbooks of Godfrey and Siddons, Proceedings of the British Society for Research into Learning Mathematics,
EDIT 576 (2 credits) Mobile Learning and Applications Fall Semester 2015 August 31 October 18, 2015 Fully Online Course
 Mobile Learning and Applications Fall Semester 2015 August 31 October 18, 2015 Fully Online Course") GEORGE MASON UNIVERSITY COLLEGE OF EDUCATION AND HUMAN DEVELOPMENT INSTRUCTIONAL DESIGN AND TECHNOLOGY PROGRAM EDIT 576 (2 credits) Mobile Learning and Applications Fall Semester 2015 August 31 October
GEORGE MASON UNIVERSITY COLLEGE OF EDUCATION AND HUMAN DEVELOPMENT INSTRUCTIONAL DESIGN AND TECHNOLOGY PROGRAM EDIT 576 (2 credits) Mobile Learning and Applications Fall Semester 2015 August 31 October
What s in a Step? Toward General, Abstract Representations of Tutoring System Log Data
 What s in a Step? Toward General, Abstract Representations of Tutoring System Log Data Kurt VanLehn 1, Kenneth R. Koedinger 2, Alida Skogsholm 2, Adaeze Nwaigwe 2, Robert G.M. Hausmann 1, Anders Weinstein
FROM QUASI-VARIABLE THINKING TO ALGEBRAIC THINKING: A STUDY WITH GRADE 4 STUDENTS 1
 FROM QUASI-VARIABLE THINKING TO ALGEBRAIC THINKING: A STUDY WITH GRADE 4 STUDENTS 1 Célia Mestre Unidade de Investigação do Instituto de Educação, Universidade de Lisboa, Portugal celiamestre@hotmail.com
Number of students enrolled in the program in Fall, 2011: 20. Faculty member completing template: Molly Dugan (Date: 1/26/2012)
") Program: Journalism Minor Department: Communication Studies Number of students enrolled in the program in Fall, 2011: 20 Faculty member completing template: Molly Dugan (Date: 1/26/2012) Period of reference
Program: Journalism Minor Department: Communication Studies Number of students enrolled in the program in Fall, 2011: 20 Faculty member completing template: Molly Dugan (Date: 1/26/2012) Period of reference
Teaching a Laboratory Section
 Chapter 3 Teaching a Laboratory Section Page I. Cooperative Problem Solving Labs in Operation 57 II. Grading the Labs 75 III. Overview of Teaching a Lab Session 79 IV. Outline for Teaching a Lab Session
HOLMER GREEN SENIOR SCHOOL CURRICULUM INFORMATION
 HOLMER GREEN SENIOR SCHOOL CURRICULUM INFORMATION Subject: Mathematics Year Group: 7 Exam Board: (For years 10, 11, 12 and 13 only) Assessment requirements: Students will take 3 large assessments during
Multiple Intelligences 1
 Multiple Intelligences 1 Reflections on an ASCD Multiple Intelligences Online Course Bo Green Plymouth State University ED 5500 Multiple Intelligences: Strengthening Your Teaching July 2010 Multiple Intelligences
Programme Specification
 Programme Specification Title: Crisis and Disaster Management Final Award: Master of Science (MSc) With Exit Awards at: Postgraduate Certificate (PG Cert) Postgraduate Diploma (PG Dip) Master of Science
A Study of the Effectiveness of Using PER-Based Reforms in a Summer Setting
 A Study of the Effectiveness of Using PER-Based Reforms in a Summer Setting Turhan Carroll University of Colorado-Boulder REU Program Summer 2006 Introduction/Background Physics Education Research (PER)
Delaware Performance Appraisal System Building greater skills and knowledge for educators
 Delaware Performance Appraisal System Building greater skills and knowledge for educators DPAS-II Guide for Administrators (Assistant Principals) Guide for Evaluating Assistant Principals Revised August
Inquiry Learning Methodologies and the Disposition to Energy Systems Problem Solving
 Inquiry Learning Methodologies and the Disposition to Energy Systems Problem Solving Minha R. Ha York University minhareo@yorku.ca Shinya Nagasaki McMaster University nagasas@mcmaster.ca Justin Riddoch
2013/Q&PQ THE SOUTH AFRICAN QUALIFICATIONS AUTHORITY
 2013/Q&PQ THE SOUTH AFRICAN QUALIFICATIONS AUTHORITY Policy and Criteria for the Registration of Qualifications and Part Qualifications on the National Qualifications Framework Compiled and produced by:
The recognition, evaluation and accreditation of European Postgraduate Programmes.
 1 The recognition, evaluation and accreditation of European Postgraduate Programmes. Sue Lawrence and Nol Reverda Introduction The validation of awards and courses within higher education has traditionally,
Firms and Markets Saturdays Summer I 2014
 PRELIMINARY DRAFT VERSION. SUBJECT TO CHANGE. Firms and Markets Saturdays Summer I 2014 Professor Thomas Pugel Office: Room 11-53 KMC E-mail: tpugel@stern.nyu.edu Tel: 212-998-0918 Fax: 212-995-4212 This
Using Virtual Manipulatives to Support Teaching and Learning Mathematics
 Using Virtual Manipulatives to Support Teaching and Learning Mathematics Joel Duffin Abstract The National Library of Virtual Manipulatives (NLVM) is a free website containing over 110 interactive online
Guidelines for Writing an Internship Report
 Guidelines for Writing an Internship Report Master of Commerce (MCOM) Program Bahauddin Zakariya University, Multan Table of Contents Table of Contents... 2 1. Introduction.... 3 2. The Required Components
Math-U-See Correlation with the Common Core State Standards for Mathematical Content for Third Grade
 Math-U-See Correlation with the Common Core State Standards for Mathematical Content for Third Grade The third grade standards primarily address multiplication and division, which are covered in Math-U-See
Software Maintenance
 1 What is Software Maintenance? Software Maintenance is a very broad activity that includes error corrections, enhancements of capabilities, deletion of obsolete capabilities, and optimization. 2 Categories
success. It will place emphasis on:
 1 First administered in 1926, the SAT was created to democratize access to higher education for all students. Today the SAT serves as both a measure of students college readiness and as a valid and reliable
Representational Fluency and Symbolisation of Derivative
 Representational Fluency and Symbolisation of Derivative Alan Gil Delos Santos & Michael O. J. Thomas The University of Auckland The nature of mathematical concepts has been the subject of some scrutiny
University of the Free State Language Policy i
 University of the Free State Language Policy i 1. Preamble The University of the Free State (UFS) is committed to: Enabling a language rich environment committed to multilingualism with particular attention
Abstractions and the Brain
 Abstractions and the Brain Brian D. Josephson Department of Physics, University of Cambridge Cavendish Lab. Madingley Road Cambridge, UK. CB3 OHE bdj10@cam.ac.uk http://www.tcm.phy.cam.ac.uk/~bdj10 ABSTRACT
Conceptual Framework: Presentation
 Meeting: Meeting Location: International Public Sector Accounting Standards Board New York, USA Meeting Date: December 3 6, 2012 Agenda Item 2B For: Approval Discussion Information Objective(s) of Agenda
Faculty of Education/Fakulteit Opvoedkunde
 Faculty of Education/Fakulteit Opvoedkunde Masters and Doctoral Degree Selection Form/ Meesters en Doktorale Graad-keuringsvorm Name/Naam:.. Student number/studentenommer: Study field/studieveld:... Write
Davidson College Library Strategic Plan
 Davidson College Library Strategic Plan 2016-2020 1 Introduction The Davidson College Library s Statement of Purpose (Appendix A) identifies three broad categories by which the library - the staff, the
A BLENDED MODEL FOR NON-TRADITIONAL TEACHING AND LEARNING OF MATHEMATICS
 Readings in Technology and Education: Proceedings of ICICTE 2010 407 A BLENDED MODEL FOR NON-TRADITIONAL TEACHING AND LEARNING OF MATHEMATICS Wajeeh Daher Al-Qasemi Academic College of Education Israel
D Road Maps 6. A Guide to Learning System Dynamics. System Dynamics in Education Project
 D-4506-5 1 Road Maps 6 A Guide to Learning System Dynamics System Dynamics in Education Project 2 A Guide to Learning System Dynamics D-4506-5 Road Maps 6 System Dynamics in Education Project System Dynamics
The College Board Redesigned SAT Grade 12
 A Correlation of, 2017 To the Redesigned SAT Introduction This document demonstrates how myperspectives English Language Arts meets the Reading, Writing and Language and Essay Domains of Redesigned SAT.
Developing a concrete-pictorial-abstract model for negative number arithmetic
 Developing a concrete-pictorial-abstract model for negative number arithmetic Jai Sharma and Doreen Connor Nottingham Trent University Research findings and assessment results persistently identify negative
HARPER ADAMS UNIVERSITY Programme Specification
 HARPER ADAMS UNIVERSITY Programme Specification 1 Awarding Institution: Harper Adams University 2 Teaching Institution: Askham Bryan College 3 Course Accredited by: Not Applicable 4 Final Award and Level:
Livermore Valley Joint Unified School District. B or better in Algebra I, or consent of instructor
 Livermore Valley Joint Unified School District DRAFT Course Title: AP Macroeconomics Grade Level(s) 11-12 Length of Course: Credit: Prerequisite: One semester or equivalent term 5 units B or better in
Arizona s College and Career Ready Standards Mathematics
 Arizona s College and Career Ready Mathematics Mathematical Practices Explanations and Examples First Grade ARIZONA DEPARTMENT OF EDUCATION HIGH ACADEMIC STANDARDS FOR STUDENTS State Board Approved June
Level 6. Higher Education Funding Council for England (HEFCE) Fee for 2017/18 is 9,250*
 Fee for 2017/18 is 9,250*") Programme Specification: Undergraduate For students starting in Academic Year 2017/2018 1. Course Summary Names of programme(s) and award title(s) Award type Mode of study Framework of Higher Education
Programme Specification: Undergraduate For students starting in Academic Year 2017/2018 1. Course Summary Names of programme(s) and award title(s) Award type Mode of study Framework of Higher Education
Notes on The Sciences of the Artificial Adapted from a shorter document written for course (Deciding What to Design) 1
 1") Notes on The Sciences of the Artificial Adapted from a shorter document written for course 17-652 (Deciding What to Design) 1 Ali Almossawi December 29, 2005 1 Introduction The Sciences of the Artificial
Notes on The Sciences of the Artificial Adapted from a shorter document written for course 17-652 (Deciding What to Design) 1 Ali Almossawi December 29, 2005 1 Introduction The Sciences of the Artificial
WHY SOLVE PROBLEMS? INTERVIEWING COLLEGE FACULTY ABOUT THE LEARNING AND TEACHING OF PROBLEM SOLVING
 From Proceedings of Physics Teacher Education Beyond 2000 International Conference, Barcelona, Spain, August 27 to September 1, 2000 WHY SOLVE PROBLEMS? INTERVIEWING COLLEGE FACULTY ABOUT THE LEARNING