Preparing for the Pre-Professional Skills Tests
|
|
|
- Berniece Elliott
- 6 years ago
- Views:
Transcription
1 RESEARCH REPORT July 2001 RR Preparing for the Pre-Professional Skills Tests Lawrence J. Stricker Gita Z. Wilder Statistics & Research Division Princeton, NJ 08541
2 Preparing for the Pre-Professional Skills Tests Lawrence J. Stricker and Gita Z. Wilder Educational Testing Service, Princeton, New Jersey July 2001
3 Research Reports provide preliminary and limited dissemination of ETS research prior to publication. They are available without charge from: Research Publications Office Mail Stop 10-R Educational Testing Service Princeton, NJ 08541
4 Abstract This study investigated the extent and nature of preparation for the Pre-Professional Skills Tests (PPST ), the reasons for preparing or not preparing, and differences in these results for White and minority-group test takers and for middle-class and working-class test takers. Recent PPST test takers were surveyed. Preparation for the PPST was limited and mainly involved activities that were free or inexpensive, such as taking a sample test. The reported reasons for not preparing and the empirical correlates of measures of preparation were primarily attitudinal. Ethnic-group and social-class differences in the extent and nature of test preparation were minimal, but there were some differences in reported reasons and correlates of preparation, primarily less awareness of test preparation resources by White and middle-class test takers and few correlates of test preparation for Black test takers. Key words: PPST, test preparation, attitudes, ethnicity, social class i
5 Acknowledgements Thanks are due to Gail S. Rys for arranging the pilot testing; Drew H. Gitomer for reviewing the questionnaire; Susan J. Miller for assisting in the pilot testing; Cheri L. Ashton and Bert Palencia for providing PPST data; Debra E. Friedman for coordinating the data collection; Gerry A. Kokolis, Ting Lu, Norma A. Norris, and Michelle Najarian for carrying out the computer analysis; and Daniel R. Eignor, Donald E. Powers, and Richard J. Tannenbaum for reviewing a draft of this report. ii
6 Introduction In a recent focus-group study, a substantial number of students who had taken the Pre- Professional Skills Tests (PPST) said that they did little or no preparation for the test (Wilder & Stricker, 1998). Moreover, only one person acknowledged ever hearing of LearningPlus, a computerized instructional program that covers the same skills evaluated by the test (reading, mathematics, and writing) and provides test preparation for the PPST and another Praxis I test, the computer-based Praxis I: Academic Skills Assessments. Similarly, in a 1996 survey of Praxis I test takers, 31% reported that they had not prepared for the test (Gordon S. Black Corporation, 1996). This massive lack of preparation is particularly surprising in view of the high-stakes nature of the PPST when it is used for admission to teacher education programs and for teacher certification, as well as in light of the high failure rates on this test, especially for members of minority groups (e.g., Garcia, 1985; Minnesota Board of Teaching, 1991; Smith, 1987; Snow, 1995). The students in the focus groups offered several explanations for this lack of preparation, notably (a) the belief that one simply cannot prepare for basic skills tests and (b) the cost in time and money for test preparation. Still, solid evidence is lacking. As a matter of fact, very little is known about why students prepare or do not prepare for any kind of test, including classroom tests (Van Etten, Freebern, & Pressley, 1997). Clearly, it would be in everyone s interest if test preparation were more universal. This would minimize an extraneous source of variation in test performance (e.g., Anastasi, 1981; Messick, 1981) and might increase the number of test takers passing the PPST and qualifying for teacher education and teacher certification. There appears to be a demand for test preparation courses provided by test publishers. In a 1997 survey of a national sample, 75% of the undergraduates reported that testing organizations should offer such courses (Rowan & Blewitt Incorporated, 1998). And there is dissatisfaction with ETS s current efforts at test preparation. In surveys of Praxis I test takers in 1996 and in , 19% in 1996 and 14% in reported that ETS materials did not provide good preparation on test taking strategies (Gordon S. Black Corporation, 1996, 1998). At the same time, though, there is also evidence that examinees do not use the test preparation resources that are readily available. In a 1997 study of six institutions that provide LearningPlus to their students, few students used it and those who did used it very little (Wilder & Cline, 1997). 1
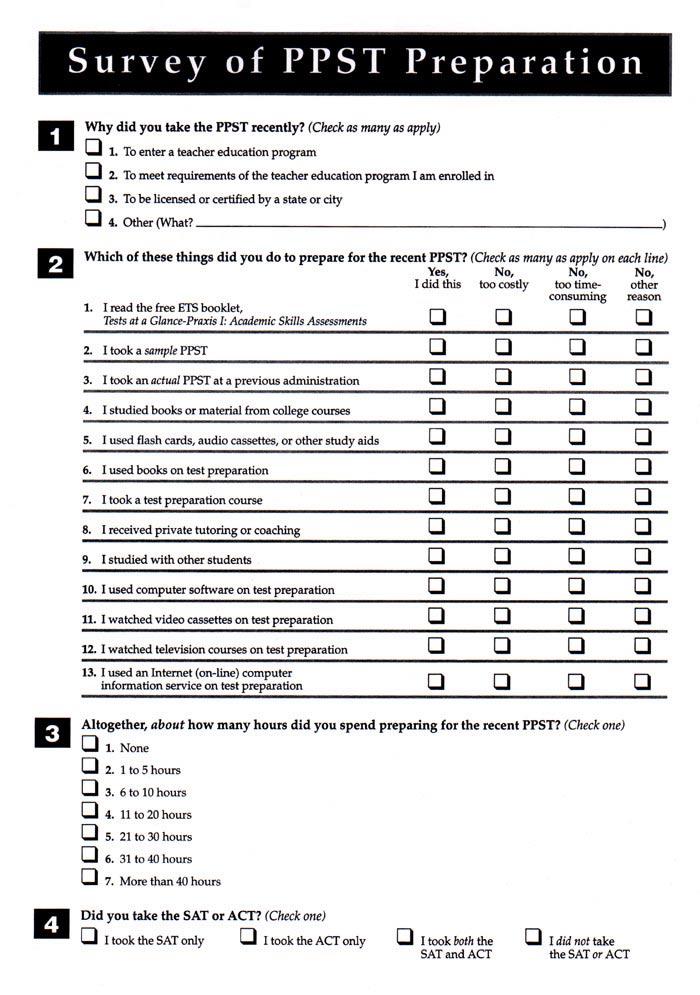
7 The puzzling juxtaposition between the lack of preparation for the PPST and the high failure rate for this high-stakes test, as well as the social consequences of these failures, makes it evident that a better understanding is needed of the reasons many test takers do not prepare for the PPST. Accordingly, the purpose of this study was to survey the test preparation of recent PPST test takers to illuminate (a) the extent and nature of test preparation; (b) the reasons for preparing or not preparing; (c) interest in new kinds of test preparation material and services; and (d) differences in these results for subgroups of special interest: White and minority-group test takers, and middle-class and working-class test takers (as indexed by parental education). Method Sample The sample was drawn from the 4,486 test takers taking the PPST at the June 12, 1999, administration: one-fifth of White test takers (N=708) and all of the remaining test takers, Black (N=591), Hispanic (N=96), Asian (N=132), other ethnicity (N=132), and unknown ethnicity (N=231), a total of 1,890 test takers. A total of 951 (50.3%) test takers responded to the survey: 383 White, 285 Black, 45 Hispanic, 75 Asian, 68 other ethnicity, and 95 with unknown ethnicity. Measures Questionnaire A questionnaire was devised to assess preparation for the PPST, reasons for preparing and possible correlates of preparation, and reactions to possible changes in test preparation material and services. (This questionnaire appears in the Appendix.) The questionnaire was pilot tested with a group of 10 teacher education students at the University of Delaware who had recently taken the PPST for teacher certification. The questionnaire took approximately 5 to 10 minutes to complete. The variables on the questionnaire follow: 1 1. Test preparation activities. This is a 13-item scale (Q. 2, subquestions 1 to 13), Which of these things did you do to prepare for the recent PPST? (e.g., I took a sample PPST ), adapted from Powers (1988, 1998), with four alternatives ( Yes, I did this ; No, too costly ; No, too time-consuming ; No, other reason ). The score was the number of Yes, I did this responses. 2
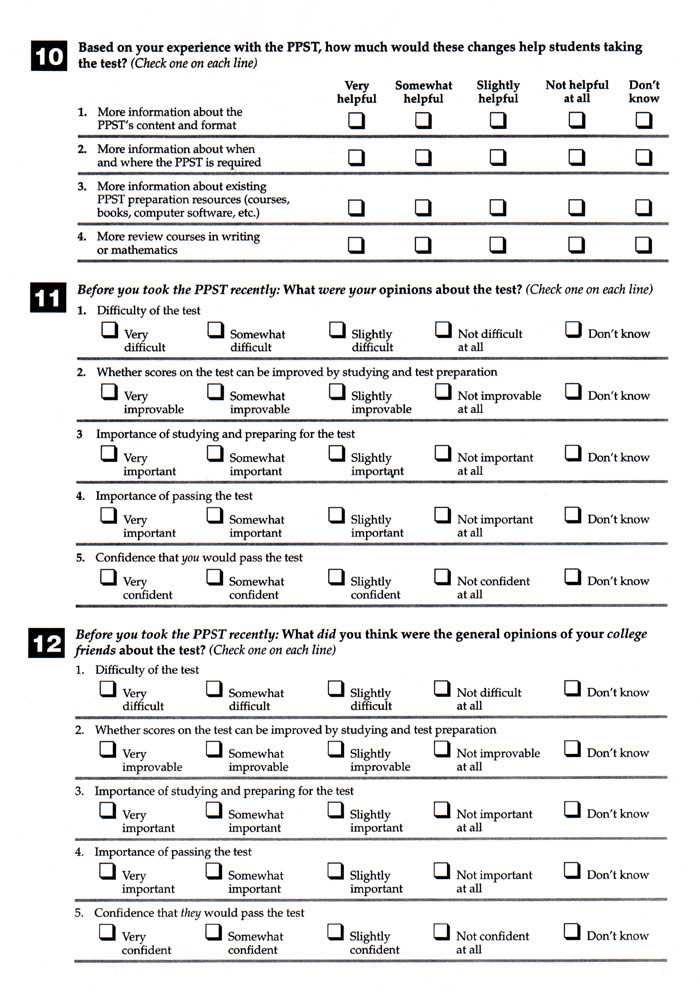
8 2. Test preparation time. This is a single item (Q. 3), Altogether, about how many hours did you spend preparing for the recent PPST? with seven alternatives ( None to More than 40 hours ). 3. Preparation relative to the SAT or ACT. This is a single item (Q. 5), Compared to the recent PPST, how much did you prepare for the SAT or ACT? with seven alternatives ( Much more for the SAT/ACT [1] to Much less for the SAT/ACT [7]). 4. Reasons for preparing more for the SAT or ACT. This is a single item (Q. 6), If you prepared MORE for the SAT or ACT than the PPST: Why? with nine alternatives (e.g., I thought the PPST was not as important ). 5. Information received about the PPST Timing. This is a five-item scale (Q. 8, subquestions 1 to 5), When did you first find out these things about the PPST? (e.g., The PPST is required by your college or for hiring/licensing as a teacher ), with five alternatives ( 1997 or earlier ; 1998 ; 1999 ; Don t recall ; Never ). The score was the number of Never responses. 6. Own opinions about the PPST. This is a four-item scale (Q. 11, subquestions 1 to 4), Before you took the PPST recently: What were your opinions about the test? (e.g., Difficulty of the test ), with five alternatives (e.g., Very difficult to Not at all difficult, plus Don t know ). The items assess attitudes about the PPST that may affect preparation for it. The score was the number of Very and Somewhat responses. 7. Own confidence about the PPST. This is a single item (Q. 11, subquestion 5), Before you took the PPST recently: What were your opinions about the test? (i.e., Confidence that you would pass the test ), with five alternatives ( Very confident [4] to Not confident at all [1], plus Don t know ). 8. Friends opinions about the PPST. This is a four-item scale (Q. 12, subquestions 1 to 4), Before you took the PPST recently: What did you think were the general opinions of your college friends about the test? paralleling Own Opinions about the PPST. 9. Friends confidence about the PPST. This is a single item (Q. 12, subquestion 5), Before you took the PPST recently: What did you think were the general opinions of your college friends about the test? (i.e., Confidence that they would pass the test ), paralleling Own Confidence about the PPST. 3
9 10. Professors opinions about the PPST. This is a four-item scale (Q. 13, subquestions 1 to 4), Before you took the PPST recently: What did you think were the general opinions of your professors about the test? paralleling Own Opinions about the PPST. 11. Friends preparation. This is a single item (Q. 7), How much did most of your college friends prepare for the recent PPST? with five alternatives ( A lot [4] to Not at all [1], plus Don t know). 12. Test anxiety. This is a single item (Q. 14), How anxious do you usually get when you take important tests? with six alternatives ( Extremely anxious [5] to Not anxious at all [1], plus Don t know ). 13. Academic self-esteem. This is a single item (Q. 15), How do you think you compare to other college students in academic ability? with eight alternatives ( Very much above average [7] to Very much below average [1], plus Don t know ). 14. Academic locus of control. This is a single item (Q. 16), How much of your success in school depends on your own effort and ability rather than luck or favoritism? with five alternatives ( All of it [4] to None of it [1], plus Don t know ). 15. Information received about the PPST Source. This is a five-item scale (Q. 9, subquestions 1 to 5), How did you first find out these things about the PPST? paralleling Information Received about the PPST Timing, with six alternatives ( ETS material ; Professors or college staff ; College friends ; Another way ; Don t know ; and Never did ). The four scores were the number of ETS material responses, number of Professors or college staff responses, number of College friends responses, and number of Another way responses. 16. Reasons for taking the PPST. This is a single item (Q. 1), Why did you take the PPST recently? with four alternatives ( To enter a teacher education program ; To meet requirements of the teacher education program I am enrolled in ; To be licensed or certified by a state or city ; and Other ). 17. SAT or ACT taken. This is a single item (Q. 4), Did you take the SAT or ACT? with four alternatives ( I took the SAT only ; I took the ACT only ; I took both the SAT and ACT ; and I did not take the SAT or ACT ). The score was the number of tests taken. 18. Changes in test preparation material and services. This is a four-item scale (Q. 10, subquestions 1 to 4), Based on your experience with the PPST, how much would these changes 4
10 help students taking the test? (e.g., More information about the PPST s content and format ), with five alternatives ( Very helpful to Not helpful at all, plus Don t know ). Other Variables Additional variables were derived from the registration form and Background Information Questionnaire completed by the test takers when they registered for the test, from the PPST itself, and from archival data from several sources for the test takers colleges (specifically, the schools where training relevant to the PPST was received). These variables consisted of demographic variables needed to categorize subsamples in the analyses and possible correlates of preparation for the PPST characteristics of test takers themselves and their colleges. The variables follow: 1. Age (age in years at the test administration) 2. Sex 3. Ethnicity (White, Black, Hispanic, Asian, Other) 2 4. Parental education (Both parents have high school education or less; one or both parents have college education.) (Note that for brevity these two categories are described in this report as high school educated and college educated parents.) 5. Years since school (number of years since college or graduate school; Currently attending college or graduate school to More than 10 years ) 6. Enrolled in teacher education program ( Currently ; Formerly ; Never ) 7. Undergraduate GPA ( below 1.5 [1.25] to [3.75]) 3 8. College: Control (Public, Independent, Catholic, Protestant and other religious; National Center for Education Statistics [NCES], 1998b) 9. College: Historically Black college (NCES, 1998a) 10. College: Carnegie Classification (Research Universities to Associate of Arts Colleges; Carnegie Foundation for the Advancement of Teaching, 1994) 11. College: Selectivity (entrance difficulty in 1997; Most Difficult to Noncompetitive; Peterson s, 1997) 12. College: Number of PPST takers (current test administration) 13. Current PPST tests taken (number in current test administration) 5
11 14. Previous PPST tests taken (number in October 1997 to April 1999 test administrations) 15. PPST Reading score (This is a scaled score, ranging from 150 to 190.) 16. PPST Writing score (This is a scaled score, ranging from 150 to 190.) 17. PPST Mathematics score (This is a scaled score, ranging from 150 to 190.) Procedure A letter describing the purpose of the study, along with the questionnaire and a return envelope, was mailed to each test taker on June 10, 1999, to arrive immediately after the test administration on June 12. A follow-up letter, with another questionnaire and return envelope, was mailed to each test taker on July 1, 1999, three weeks after the initial letter. (Both letters appear in the Appendix.) Analysis The representativeness of the respondents was appraised by chi-square analyses of the categorical background variables, and t tests of the means for the continuous background variables and PPST scores for respondents and nonrespondents. The overall extent of test preparation was evaluated by frequency distributions of these variables for the total sample. Ethnic-group and social-class differences in Reasons for Preparing More for the SAT or ACT were assessed by frequency distributions computed separately for the ethnic groups and for test takers with high school educated and college educated parents. Multiple responses precluded significance tests of group differences for these variables. (Ethnic-group and parental education differences for the other test preparation variables were analyzed in the correlational analyses described below.) The data for White test takers were weighted (by a factor of five) to compensate for their undersampling. The convergence between the four key test preparation variables (Number of Test Preparation Activities, Test Preparation Time, Preparation Relative to SAT or ACT, and Information Received about PPST Timing: Number of Never Responses), their correlates, and differences in relationships across ethnic groups and social classes were evaluated from the product-moment intercorrelations of the questionnaire measures and other variables. The 6
12 intercorrelations were computed using a pair-wise missing-data program for the total sample, and separately for White and Black test takers and for test takers with high school educated and college educated parents. (Small sample sizes precluded separate analyses for test takers with Hispanic, Asian, or other ethnicity.) The data for White test takers were weighted in the analyses for the total sample and for the parental education subsamples. Dummy codes were used for Test Preparation Time, Sex, Ethnicity, Parental Education, Years Since School, Enrolled in Teacher Education Program, College: Control, College: Historically Black College, College: Carnegie Classification, College: Selectivity, and Reasons for Taking the PPST. 4 The multiple correlations of the six sets of dummy variables were computed with each of the four key test preparation variables. The sets were Ethnicity, Years Since School, Enrolled in Teacher Education Program, College: Control, College: Carnegie Classification, and Reasons for Taking the PPST. 5 The overall reactions to Changes in Test Preparation Material and Services were evaluated by frequency distributions for the total sample. Ethnic-group and social-class differences in this variable were appraised from frequency distributions computed separately for the ethnic groups and for test takers with high school educated and college educated parents, and accompanying chi-square analyses of the group differences in the distributions. The data for White test takers were weighted in the analyses for the total sample and for the parental education subsamples. Both statistical and practical significance were considered in evaluating the results. For statistical significance, a.05 alpha level was used in all analyses. For practical significance, indexes that reflect a small effect size, accounting for 1% of the variance, was used: a W of.10 in the chi-square analyses, a d of.20 in the t test of means, and an r or R of.10 in the correlation analyses (Cohen, 1988). In analyses involving weighted data, the actual N, not the weighted N, was used in calculating chi-square and W, and in assessing the statistical significance of r and R. (In assessing the statistical significance of R when there was missing data, the smallest N for the constituent intercorrelations was used.) 7
13 Results Comparisons of Respondents and Nonrespondents The frequency distributions of the categorical background variables for the respondents and nonrespondents and the chi-square tests are summarized in Table 1. The means of the continuous background variables and the t tests are summarized in Table 2. Only two differences in these two sets of analyses were statistically and practically significant: Sex more respondents (82%) than nonrespondents (74%) were women (χ 2 = 18.46, p <.01, W =.10), and Current PPST Tests Taken respondents took more PPST tests (M = 2.39) than nonrespondents (M = 2.10) in the current administration (t = 6.28, p <.01, d =.29). 8
14 Table 1 Frequency Distributions of Categorical Background Variables, for Respondents and Nonrespondents Percentage Variable Respondents Nonrespondents χ 2 W Sex (N = 948) (N = 935) 18.46*.10 a Male Female Ethnicity (N = 951) (N = 939) White Black Hispanic 5 5 Asian 8 6 Other 7 7 Unknown Parental education (N = 806) (N = 770) High school or less College or more Years since school (N = 869) (N = 818) Currently attending Under three years Four or more years 9 11 Enrolled in teacher education program (N = 866) (N = 813) Currently Formerly Never College: Control (N = 741) (N = 703) Public Independent 6 6 Catholic 5 3 Protestant and other religious College: Historically Black College (N = 751) (N = 721) Yes No (Table continues) 9
15 Table 1 (continued) Percentage Variable Respondents Nonrespondents χ 2 W College: Carnegie Classification (N = 743) (N = 717) Research universities I and II Doctoral universities I and II Master s colleges and universities I and II Baccalaureate colleges I and II Associate of arts colleges and 4 4 specialized institutions College: Selectivity (N = 719) (N = 695) Most difficult or very difficult 4 4 Moderately difficult Minimally difficult or noncompetitive Note. Percentages may not total to 100% because of rounding error. *p <.01. a W >
16 Table 2 Means of Continuous Background Variables and PPST Scores, for Respondents and Nonrespondents Variable Respondents Nonrespondents t d N Mean S.D. N Mean S.D. Age *.18 GPA *.15 College Number of PPST test takers Current PPST tests taken *.29 a Previous PPST tests taken PPST Reading score PPST Writing score *.15 PPST Mathematics score *.18 * p <.01. a d >.20. Frequency Distributions of Test Preparation Variables Individual Test Preparation Activities The frequency distributions for individual test preparation activities appear in Table 3, and the frequency distributions for the number of these activities appears in Table 4. The most common activities were I read the free ETS booklet, Tests at a Glance Praxis I: Academic Skills Assessment (70%); I took a sample PPST (51%); I used books on test preparation (43%); I studied books or material from college courses (32%); and I took an actual PPST at a previous administration (21%). Too costly and Too time-consuming were equally common reasons for not doing these activities, but neither accounted for 20% or more of the 11
17 reasons for any activity (Table 3). The number of activities ranged from 0 (15%) to (1%); the median was 2.3 activities (Table 4). Test Preparation Time The frequency distribution for the time spent preparing for the PPST appears in Table 5. Nineteen percent reported spending no time preparing, at one extreme, and five percent reported spending more than 40 hours, at the other extreme. The median was 4.9 hours. Preparation Relative to the SAT or ACT The frequency distribution for preparation time for the PPST relative to the SAT or ACT appears in Table 6. The percentage reporting that they prepared more for the SAT or ACT than for the PPST (43%) was greater than the percentage reporting that they prepared more for the PPST than for the SAT or ACT (30%). Reasons for Preparing More for the SAT or ACT The frequency distribution for the reasons for preparing more for the SAT or ACT than for the PPST appears in Table 7 for the total sample. The corresponding frequency distributions for the ethnic groups and for test takers with high school educated and college educated parents appear in Tables 8 and 9, respectively. Total sample. The most common reasons given were I thought my PPST scores would be good enough without preparation (35%); I had some other reason (26%); I plan to take PPST again if my scores are not good enough (25%); I did not know about resources for test preparation (25%); and I thought it was not possible to prepare for the PPST (20%). Ethnicity. The White and Black groups differed appreciably on four reasons. (Small sample sizes precluded comparisons for other ethnic groups.) I thought it was not possible to prepare for the PPST and I did not know about resources for PPST preparation were more frequent responses for White test takers (21% and 26%, respectively) than for Black test takers (13% for both reasons). I plan to take PPST again if my scores are not good enough and I had some other reason were more frequent responses for Black test takers (36% and 39%, respectively) than for White test takers (23% and 24%, respectively). 12
18 Parental education. The parental education groups differed on three reasons. I did not know about resources for PPST preparation was a more frequent reason for test takers with college educated parents than for test takers with high school educated parents (28% vs. 13%). I plan to take PPST again if my scores are not good enough and I had some other reason were more frequent responses for test takers with high school educated parents than for test takers with college educated parents (30% and 32% vs. 24% and 25%). Information received about the PPST Timing. The percentage of Never responses for individual kinds of information received about the PPST appears in Table 10 and the frequency distribution of the number of these responses appears in Table 11. The percentage of Never responses was consistently low, ranging from 2% for The PPST is required by your college or for hiring/licensing as a teacher to 12% for Sample PPST questions on tests (Table 10). Seventy-seven percent of the test takers had no Never responses, at one extreme, and 0% had five such responses; the median was 0 Never responses (Table 11). 13
19 Table 3 Frequency Distributions for Individual Test Preparation Activities Percentage Yes, No, No, No, I did this too costly too time- other Activity consuming reason N I read the free ETS booklet, ,444 Tests at a Glance Praxis I Academic Skills Assessment I took a sample PPST ,424 I took an actual PPST at a ,304 previous administration I studied books or materials ,375 from college courses I used flash cards, audio ,381 cassettes, or other study aids I used books on test preparation ,447 I took a test preparation course ,416 I received private tutoring or ,398 coaching I studied with other students ,327 I used computer software on ,402 test preparation I watched video cassettes on ,351 test preparation I watched television courses on ,330 test preparation I used an Internet (on-line) ,341 computer information service on test preparation Note. Percentages may not total 100% because of rounding error. 14
20 Table 4 Frequency Distribution of Number of Test Preparation Activities Number of Percentage Activities (N = 2,146) to 13 1 Note. Percentage may not total 100% because of rounding error. 15
21 Table 5 Frequency Distribution of Test Preparation Time Time Percentage (hours) (N = 2,480) None 19 1 to to to to to 40 3 More than 40 5 Note. Percentage may not total 100% because of rounding error. 16
22 Table 6 Frequency Distribution of Preparation Relative to the SAT or ACT Preparation Percentage (N = 1,649) Much more for the SAT/ACT 17 Somewhat more for the SAT/ACT 14 Slightly more for the SAT/ACT 12 About the same for the SAT/ACT 27 Slightly less for the SAT/ACT 5 Somewhat less for the SAT/ACT 6 Much less for the SAT/ACT 19 Note. Percentage may not total 100% because of rounding error. 17
23 Table 7 Frequency Distribution of Reasons for Preparing More for the SAT or ACT, for Total Sample Reason Percentage (N = 655) I thought my PPST scores would be good enough without preparation 35 I had some other reason 26 I plan to take PPST again if my scores are not good enough 25 I did not know about resources for PPST preparation (books, courses, etc.) 25 I thought it was not possible to prepare for the PPST 20 I thought PPST preparation resources (books, courses, etc.) cost too much 12 I could not find resources for PPST preparation (books, courses, etc.) 9 I thought PPST preparation took more time than I had 9 I thought the PPST was not as important 4 Note. Percentages may not total 100% because of multiple responses. 18
24 Table 8 Frequency Distribution of Reasons for Preparing More for the SAT or ACT, for Ethnic Groups Percentage for Ethnic Group White Black Hispanic Asian Other Reason (N = 515) (N = 69) (N = 11) (N = 19) (N = 15) I thought my PPST scores would be good enough without preparation I had some other reason I plan to take PPST again if my scores are not good enough I did not know about resources for PPST preparation (books, courses, etc.) I thought it was not possible to prepare for the PPST I thought PPST preparation resources (books, courses, etc.) cost too much I could not find resources for PPST preparation (books, courses, etc.) I thought PPST preparation took more time than I had I thought the PPST was not as important Note. Percentages may not total 100% because of multiple responses. 19
25 Table 9 Frequency Distribution of Reasons for Preparing More for the SAT or ACT, for Test Takers with High School Educated and College Educated Parents Percentage for Parents Education Group High School College Reason (N = 124) (N = 491) I thought my PPST scores would be good enough without preparation I had some other reason I plan to take PPST again if my scores are not good enough I did not know about resources for PPST preparation (books, courses, etc.) I thought it was not possible to prepare for the PPST I thought PPST preparation resources (books, courses, etc.) 9 14 cost too much I could not find resources for PPST preparation 12 9 (books, courses, etc.) I thought PPST preparation took more time than I had 5 8 I thought the PPST was not as important 2 4 Note. Percentages may not total 100% because of multiple responses. 20
26 Table 10 Percentage of Never Responses for Individual Kinds of Information Received about PPST Information Percentage a Sample PPST questions on tests 12 (2,308) Passing scores on the PPST required by your college or by states/cities for 10 (2,342) hiring/licensing States and cities that require the PPST for hiring/licensing as a teacher 8 (2,332) Details about the content and format of the PPST (different subtests, 6 (2,309) types of questions, time limits, etc.) The PPST is required by your college or for hiring/licensing as a teacher 2 (2,398) a The total N appears in parentheses. Table 11 Frequency Distribution of Number of Never Responses for Information Received about PPST Number of Percentage Never Responses (N = 2,034) to 5 0 Note. Percentages may not total 100% because of rounding error. 21
27 Correlations with Test Preparation Measures Intercorrelations of Test Preparation Measures The intercorrelations of the four test preparation measures appear in Table 12 for the total sample. The corresponding correlations for White and Black test takers, and for test takers with high school educated and college educated parents appear in Tables 13 and 14, respectively. (The signs of the correlations with Information Received about PPST Timing: Number of Never Responses were reflected so that positive correlations with all test preparation measures consistently represent high preparation.) Total sample. All of the intercorrelations were statistically and practically significant, ranging from.58 between Test Preparation Time and Number of Preparation Activities to.16 between Test Preparation Time and Information Received about PPST Timing: Number of Never Responses. Ethnicity. With the exception of one negligible correlation for Black test takers (Number of Preparation Activities with Preparation Relative to the SAT or ACT), all of the intercorrelations of the test preparation measures were significant for both White and Black test takers. The correlations ranged from.14 to.57 for the former, and from.08 to.56 for the latter. Parental education. All of the intercorrelations of the test preparation measures were significant for both parental education groups. The correlations ranged from.20 to.62 for test takers with high school educated parents, and from.16 to.56 for test takers with college educated parents. 22
28 Table 12 Intercorrelations of Test Preparation Measures, for Total Sample Variable (1) (2) (3) (4) (1) Number of test preparation activities (2) Test preparation time (3) Preparation relative to the SAT or ACT.19 (4) Information received about the PPST Timing: Number of Never responses Note. Ns vary from 1,352 to 2,146. Correlations that are both statistically (p <.05, two-tail) and practically (r >.10) significant are underlined. Signs of correlations with Information Received about the PPST Timing: Number of Never Responses have been reflected. Table 13 Intercorrelations of Test Preparation Measures, for White and Black Test Takers Variable (1) (2) (3) (4) (1) Number of test preparation activities (2) Test preparation time (3) Preparation relative to the SAT or ACT (4) Information received about the PPST Timing: Number of Never responses Note. The intercorrelations for White test takers appear above the diagonal and those for Black test takers below it. Ns vary from 216 to 337 for the former and from 137 to 223 for the latter. Correlations that are both statistically (p <.05, two-tail) and practically (r >.10) significant are underlined. Signs of correlations with Information Received about the PPST Timing: Number of Never Responses have been reflected. 23
29 Table 14 Intercorrelations of Test Preparation Measures, for Test Takers with High School Educated and College Educated Parents Variable (1) (2) (3) (4) (1) Number of test preparation activities (2) Test preparation time (3) Preparation relative to the SAT or ACT (4) Information received about the PPST Timing: Number of Never responses Note. The intercorrelations for test takers with high school educated parents appear above the diagonal and those for test takers with college educated parents appear below it. Ns vary from 335 to 581 for the former and from 926 to 1,442 for the latter. Correlations that are both statistically (p <.05, two-tail) and practically (r >.10) significant are underlined. Signs of correlations with Information Received about the PPST Timing: Number of Never Responses have been reflected. Correlations of Questionnaire Measures, Background Variables, and PPST Scores with Test Preparation Measures The correlations of the questionnaire measures, background variables, and PPST scores with the four test preparation measures appear in Table 15 for the total sample. The corresponding correlations for White and Black test takers and for test takers with high school educated and college educated parents appear in Tables 16 and 17, respectively. (Again, the signs of the correlations with Information Received about PPST Timing: Number of Never Responses were reflected, as already explained.) Total Sample. The questionnaire measures, background variables, and PPST scores had extensive patterns of statistically and practically significant correlations with the test preparation measures. Ten variables correlated consistently with all of the test preparation measures: Own 24
30 Opinions about the PPST (.29 to.37), Own Confidence about the PPST (-.18 to -.23), Friends Opinions about the PPST (.15 to.29), Friends Preparation (.14 to.30), Previous PPST Tests Taken (.16 to.44), Current PPST Tests Taken (-.13 to -.42), PPST Reading Score (-.11 to -.26), PPST Writing Score (-.14 to -.23), and PPST Mathematics Score (-.20 to -.39). Ethnicity. The questionnaire measures, background variables, and PPST scores had extensive patterns of significant correlations with the test preparation measures for the White and Black test takers. Some variables had consistent correlation with all of the four preparation measures. In both samples, there was one such variable: Friends Opinions about the PPST (.10 to.28 for the White sample, and.14 to.31 for the Black sample). In the White sample only, there were six such variables: Own Opinions about the PPST (.30 to.39), Own Confidence about the PPST (-.19 to -.30), Test Anxiety (.17 to.34), Previous PPST Tests Taken (.16 to.47), Current PPST Tests Taken (-.13 to -.45), and PPST Mathematics Score (-.22 to -.38). And in the Black sample only, there was one such variable: Professors Opinions about PPST (.16 to.26). Of these variables, only one variable Professors Opinions about the PPST, in the Black sample did not have consistent correlations with the preparation measures in the total sample. Parental education. The questionnaire measures, background variables, and PPST scores had extensive patterns of significant correlations with the preparation measures for test takers with high school educated and college educated parents. Some variables had consistent correlations with all of the preparation measures. In both samples, there were two such variables: Own Opinions about PPST (.39 to.41 for the high school educated sample and.26 to.36 for the college educated sample) and Friends Opinions about the PPST (.13 to.33 for the high school educated sample and.14 to.27 for the college educated sample). In the high school educated sample, there was one variable: Age (.14 to.30). And in the college educated sample, there were seven variables: Own Confidence about the PPST (-.15 to -.27), Friends Preparation (.12 to.21), Test Anxiety (.11 to.30), Previous PPST Tests Taken (.15 to.45), Current PPST Tests Taken (-.13 to -.40), PPST Writing Score (-.13 to -.23), and PPST Mathematics Score (-.14 to -.41). Of these variables, only one variable Age, in the high school educated sample did not have consistent correlations with the preparation measures in the total sample. 25
31 Frequency Distributions of Test Preparation Changes The frequency distribution for Test Preparation Changes variables appear in Table 18 for the total group. The corresponding frequency distributions for the ethnic groups and for the test takers with high school educated and college educated parents appear in Tables 19 and 20, respectively. Total sample. The majority of the test takers reported that three of the four changes in test preparation More information about the PPST s content and format (59%), More information about existing PPST preparation resources (60%), and More review courses in writing or mathematics (56%) would be very helpful. And many (46%) reported that More information about when and where the PPST is required would be very helpful. Ethnicity. The ethnic groups had statistically and practically significant differences on one of the four variables. More Black than White test takers reported that More review courses in writing or mathematics would be helpful (χ 2 = 40.55, p <.01, W =.22). For example, 82% of Black test takers and 51% of White test takers reported it would be very helpful. Parental education. Test takers with high school educated and college educated parents had significant differences on two of the four variables. More of the test takers with high school educated parents reported that More information about the PPST s content and format (χ 2 = 17.11, p <.01, W =.15) and More review courses in writing or mathematics (χ 2 = 21.51, p <.01, W =.16) would be helpful. For example, 65% of test takers with high school educated parents and 56% of test takers with college educated parents reported that more information about content and format would be very helpful. And 67% of test takers with high school educated parents and 50% of test takers with college educated parents reported that more review courses would be very helpful. 26
32 Table 15 Correlations of Questionnaire Measures, Background Variables, and PPST Scores with Test Preparation Measures, for Total Sample Test Preparation Measure Relative to Information Variable Activities a Time b SAT or ACT c Never d Own opinions about the PPST Own confidence about the PPST Friends opinions about the PPST Friends confidence about the PPST Professors opinions about the PPST Friends preparation Test anxiety Academic self-esteem Academic locus of control Information received about the PPST Source: ETS material Information received about the PPST Source: Professors or college staff (Table continues) 27
33 Table 15 (continued) Test Preparation Measure Relative to Information Variable Activities a Time b SAT or ACT c Never d Information received about the PPST Source: College friends Information received about the PPST Source: Another way Age Sex Ethnicity Parental education Years since school Enrolled in teacher education program Undergraduate GPA College: Control College: Historically Black College College: Carnegie Classification (Table continues) 28
34 Table 15 (continued) Test Preparation Measure Relative to Information Variable Activities a Time b SAT or ACT c Never d College: Selectivity College: Number of PPST takers Reasons for taking the PPST SAT or ACT taken Current PPST tests taken Previous PPST tests taken PPST Reading score PPST Writing score PPST Mathematics score Note. Ns vary from 973 to 2,432. Correlations that are both statistically (p <.05, two-tail) and practically (r.l0) significant are underlined. Signs of correlations with Information Received about PPST Timing: Number of Never Responses have been reflected. a Number of Test Preparation Activities. b Test Preparation Time. c Preparation Relative to SAT or ACT. d Information Received about PPST Timing: Number of Never Responses. 29
35 Table 16 Correlations of Questionnaire Measures, Background Variables, and PPST Scores with Test Preparation Measures, for White and Black Test Takers Test Preparation Measure White Test Takers Black Test Takers Relative to Information-- Relative to Information Variable Activities a Time b SAT or ACT c Never d Activities a Time b SAT or ACT c Never d Own opinions about the PPST Own confidence about the PPST Friends opinions about the PPST Friends confidence about the PPST Professors opinions about the PPST Friends preparation Test anxiety Academic self-esteem Academic locus of control Information received about the PPST Source: ETS material Information received about the PPST Source: Professors or college staff (Table continues) 30
36 Table 16 (continued) Test Preparation Measure White Test Takers Black Test Takers Relative to Information Relative to Information Variable Activities a Time b SAT or ACT c Never d Activities a Time b SAT or ACT c Never d Information received about the PPST Source: College friends Information received about the PPST Source: Another way Age Sex Ethnicity Parental education Years since school Enrolled in teacher education program Undergraduate GPA College: Control College: Historically Black College College: Carnegie Classification (Table continues) 31
37 Table 16 (continued) Test Preparation Measure White Test Takers Black Test Takers Relative to Information-- Relative to Information-- Variable Activities a Time b SAT or ACT c Never d Activities a Time b SAT or ACT c Never d College: Selectivity College: Number of PPST takers Reasons for taking the PPST SAT or ACT taken Current PPST tests taken Previous PPST tests taken PPST Reading score PPST Writing score PPST Mathematics score Note. Ns vary from 158 to 375 for White test takers and from 94 to 279 for Black test takers. Correlations that are both statistically (p <.05, two-tail) and practically (r.l0) significant are underlined. Signs of correlations with Information Received about the PPST Timing: Number of Never Responses have been reflected. a Number of Test Preparation Activities. b Test Preparation Time, c Preparation Relative to SAT or ACT. d Information Received about PPST Timing: Number of Never Responses. 32
38 Table 17 Correlations of Questionnaire Measures, Background Variables, and PPST Scores with Test Preparation Measures, for Test Takers with High School Educated and College Educated Parents Test Preparation Measure High School Educated Parents College Educated Parents Relative to Information Relative to Information Variable Activities a Time b SAT or ACT c Never d Activities a Time b SAT or ACT c Never d Own opinions about the PPST Own confidence about the PPST Friends opinions about the PPST Friends confidence about the PPST Professors opinions about the PPST Friends preparation Test anxiety Academic self-esteem Academic locus of control Information received about the PPST Source: ETS material (Table continues) 33
39 Table 17 (continued) Test Preparation Measure High School Educated Parents College Educated Parents Relative to Information Relative to Information Variable Activities a Time b SAT or ACT c Never d Activities a Time b SAT or ACT c Never d Information received about the PPST Source: Professors or college staff Information received about the PPST Source: College friends Information received about the PPST Source: Another way Age Sex Ethnicity Parental education Years since school Enrolled in teacher education program Undergraduate GPA College: Control College: Historically Black College (Table continues) 34
40 Table 17 (continued) Test Preparation Measure High School Educated Parents College Educated Parents Relative to Information Relative to Information Variable Activities a Time b SAT or ACT c Never d Activities a Time b SAT or ACT c Never d College: Carnegie Classification College: Selectivity College: Number of PPST takers Reasons for taking PPST SAT or ACT taken Current PPST tests taken Previous PPST tests taken PPST Reading score PPST Writing score PPST Mathematics score Note. Ns vary from 207 to 691 for test takers with high school educated parents and from 709 to 1,564 for test takers with college educated parents. Correlations that are both statistically (p <.05, two-tail) and practically (r.l0) significant are underlined. Signs of correlations with Information Received about PPST Timing: Number of Never Responses have been reflected. a Number of Test Preparation Activities. b Test Preparation Time. c Preparation Relative to SAT or ACT. d Information Received about PPST Timing: Number of Never Responses. 35
41 Table 18 Frequency Distribution for Changes in Test Preparation Material and Services, for Total Sample Percentage Very Somewhat Slightly Not Helpful Don t Change Helpful Helpful Helpful at All Know N More information about the PPST s content and format ,444 More information about when ,424 and where the PPST is required More information about existing ,430 PPST preparation resources (courses, books, computer software, etc.) More review courses in writing ,448 or mathematics Note. Percentages may not total 100% because of rounding error. 36
42 Table 19 Frequency Distribution for Changes in Test Preparation Material and Services, for Ethnic Groups Percentage Very Somewhat Slightly Not Helpful Don t Change Helpful Helpful Helpful at All Know N χ 2 W More information a about the PPST s content and format White ,885 Black Hispanic Asian Other More information a about when and where the PPST is required White ,865 Black Hispanic Asian Other More information about existing PPST preparation resources (courses, books, computer software, etc.) White ,870 Black Hispanic Asian Other More review courses in writing or mathematics a 40.55*.22 a White ,890 Black Hispanic Asian Other Note. Percentages may not total 100% because of rounding error. * p <.01. a W >
43 Table 20 Frequency Distribution Changes in Test Preparation Material and Services, for Test Takers with High School Educated and College Educated Parents Percentage Very Somewhat Slightly Not Helpful Don t Change Helpful Helpful Helpful at All Know N χ 2 W More information 17.11*.15 a about the PPST s content and format High school educated parents College ,584 educated parents More information about when and where the PPST is required High school educated parents College ,569 educated parents a More information about existing PPST preparation resources (courses, books, computer software, etc.) High school educated parents College ,575 educated parents More review courses in 21.57*.16 a writing or mathematics High school educated parents College ,583 educated parents Note. Percentages may not total 100% because of rounding error. * p <.01. a W >
44 Discussion Extent and Nature of Test Preparation Preparation for the PPST is, indeed, limited, judging from the present results. This outcome is consistent with the focus-group study of PPST takers (Wilder & Stricker, 1998) and the survey of Praxis I test takers (Gordon S. Black Corporation, 1996). The greater preparation for the SAT than for the PPST observed in this study is congruent with two surveys of SAT takers (Powers, 1988, 1998). Only 3% to 9% of the SAT takers reported that they did not prepare at all for the SAT; the comparable figure was 19% in the present study. Although test takers engaged in a variety of preparation activities, the most common ones were free or inexpensive, such as reading free material provided by ETS or taking a sample test; costly activities, such as test preparation courses or tutors, were infrequent. This contrast between inexpensive and costly activities is generally consistent with the findings in surveys of SAT takers (Powers, 1988, 1998). A major difference between the present study and these surveys is that appreciably more SAT takers than PPST takers reported that they had participated in a test preparation course (over 15% to 18% for SAT takers vs. 5% for PPST takers) and had taken an actual test (SAT or PSAT) previously (over 63% to 81% for SAT takers vs. 22% for PPST takers). These two differences probably reflect the divergent test-taking cultures for the SAT and PPST. SAT preparation courses are probably more widely available than PPST courses. SAT courses are offered by many high schools (47% to 52% in the two surveys of SAT takers; Powers, 1988, 1998) and by many commercial organizations. In contrast, though no firm data are available, it appears that few colleges and universities offer PPST preparation courses. And at least one nationwide test preparation company, Kaplan Educational Centers, does not offer such courses. The restricted availability of PPST preparation courses may be attributed to the smaller number of PPST takers: In the testing year, 2,348,759 students took the SAT (K. Morrison, personal communication, November 14, 2000) and approximately 117,000 students took the PPST (R. J. Tannenbaum, personal communication, November 2, 2000). Alternatively, it may reflect smaller demand for preparation by PPST takers, though the present findings about interest in test preparation products and services suggest otherwise. 39
45 The greater tendency for SAT takers than for PPST takers to have taken the actual test previously (either the SAT or PSAT for SAT takers) is probably due to two factors. One is the widespread use of the PSAT, which is required in many schools. In , 2,290,939 students took that test (B. Schubert, personal communication, March 9, 2001). The second is how the SAT and PPST are evaluated by test users: continuously for the SAT and pass-fail for the PPST. SAT takers commonly take the test in their junior year in high school and retake it in their senior year in an effort to improve their scores, and thereby enhance their chances of acceptance by the college or university of their choice. In contrast, PPST takers only need to pass the test, and hence only retake it if they fail. An important aspect of the findings is the absence of ethnic-group or social-class differences in the extent and nature of test preparation. Although this result is bothersome because of the higher failure rates for minority groups, it suggests that the reasons for lack of preparation for the PPST lie elsewhere. Possible Reasons for Not Preparing The reported reasons for not preparing and the empirical correlates of the preparation measures provide some insight into the lack of preparation. The reasons and the correlates are primarily attitudinal. Test takers who report that they prepare the least also report that they are confident that they will do well on the test, are not test anxious, think that the test is easy and preparing for it is unimportant, think that their peers share these beliefs, and think that their peers do little preparation, too. Ignorance of test preparation resources and experience in taking the PPST also seem to play a role, but a lesser one, and issues of time or money appear to have little or no involvement. These findings are generally congruent with the observations in a qualitative study of preparation for classroom tests that preparation depends on students believing that it would make a difference (Van Etten et al., 1997). When students perceived that the outcome of the test was determined by their ability or their prior knowledge rather than by their effort in preparing, they prepared less. Applying this observation to the PPST, insofar as PPST takers believe that they will perform well enough to pass the test or that it is impossible to prepare for it (presumably because the PPST assesses basic skills), they would be expected not to prepare. The present 40
46 findings about the relevance of peer opinions and behavior are also consistent with another observation in the qualitative study: Others (peers and families) influence preparation. Subgroup differences in reported reasons and correlates of preparation, particularly less awareness of test preparation resources by White and middle-class test takers and fewer correlates of test preparation for Black test takers, suggest that the processes underlying lack of preparation vary in some ways with ethnicity and social class. These differences also need to be taken into account in planning interventions to improve test preparation that will be maximally effective. A major theme running through the findings is that test takers attitudes that they will do well on the test was an important contributor to their lack of preparation. In fact, these attitudes were only weakly related to actual test performance (e.g., Own Confidence correlated.30 to.34 with the PPST scores in the total sample). Hence, the test takers were not accurate forecasters of their test performance, the upshot being that some did not prepare enough and failed as a consequence. The inaccuracy of these forecasts is not surprising, for only about half of the test takers reported taking a sample PPST and even fewer reported taking an actual PPST, and thus did not have a good basis for assessing their test performance. (SAT takers, in contrast, are much more likely to have obtained good feedback, either from a sample test or from having taken an actual SAT or PSAT; Powers, 1988, 1998). This inaccuracy is exacerbated by differences in passing scores from state to state and from college to college. An obvious remedy would be to foster greater opportunities for accurate feedback about likely PPST performance that test takers can use to gauge their need for preparation. Changes in Test Preparation Material and Services The findings about possible changes in test preparation material and services make it clear that there is considerable interest among all test takers, but especially among minority and working-class test takers, in all kinds of test preparation, running the gamut from more information about the PPST to more review courses in writing and mathematics. At the same time, it must be borne in mind that many of these same test takers did not use test preparation material that is already easily available to them, such as Tests at a Glance Praxis I: Academic Skills Assessment and the sample tests in the Pre-Professional Skills Tests (PPST) Guide. 41
47 Test Preparation and PPST Performance The inverse relationships between test preparation and PPST performance is noteworthy. The most likely explanation for this seemingly counterintuitive relationship may simply be that test takers who prepare most do so because they are the most deficient in the abilities assessed by the PPST (e.g., Powers & Hecht, 1982). Such a relationship has been found in other studies of test preparation for admissions tests, such as the Graduate Record Examinations (GRE ) General Test (Powers, 1985) and the Graduate Management Admission Test (GMAT ) (Powers & Hecht, 1982). Conclusion The longstanding and important phenomenon that stimulated this study many people do not prepare for the PPST, though everyone knows it is difficult appears to be explicable in terms of test takers attitudes. There is good reason to hope that their misperceptions can be corrected by accurate feedback. An experimental demonstration of this point is clearly in order. 42
48 References Anastasi, A. (1981). Diverse effects of training on tests of academic intelligence. In B. F. Green (Ed.), New directions for testing and measurement: Issues in testing coaching, disclosure, and ethnic bias (pp. 5 20). San Francisco: Jossey-Bass. Carnegie Foundation for the Advancement of Teaching. (1994). A classification of institutions of higher education (1994 ed.). Princeton, NJ: Author. Cohen, J. (1988). Statistical power analysis for the behavioral sciences (2nd. ed.). Hillsdale, NJ: Erlbaum. Garcia, P.A. (1985). A study on teacher competency testing and test validity with implications for minorities and the results or the use of the Pre-Professional Skills Tests (PPST) as a screening device for entrance into teacher education programs in Texas (Final Report, NIE Grant No. NIE-G ). Edinburg, TX: Pan American University. (ERIC Document Reproduction Service No. ED ) Gordon S. Black Corporation. (1996). Educational Testing Service, 1996 customer satisfaction benchmarking project. Rochester, NY: Author. Gordon S. Black Corporation. (1998). Educational Testing Service, customer satisfaction measurement. Rochester, NY: Author. Messick, S. (1981). The controversy over coaching: Issues of effectiveness and equity. In B. F. Green (Ed.), New directions for testing and measurement: Issues in testing coaching, disclosure, and ethnic bias (pp ). San Francisco: Jossey-Bass. Minnesota Board of Teaching. (1991). Report of Minnesota s three-year administration of the Pre-Professional Skills Tests St. Paul, MN: Author. (ERIC Document Reproduction Service No. ED ) National Center for Education Statistics. (1998a). Digest of education statistics, Washington, DC: U.S. Government Printing Office. National Center for Education Statistics. (1998b). Directories of postsecondary institutions, 1997: Vol. 1. Degree-granting institutions. Washington, DC: U.S. Government Printing Office. Peterson s (1997). Peterson s four-year colleges, (28th ed.). Princeton, NJ: Author. Powers, D. E. (1985). Effects of coaching on GRE Aptitude Test scores. Journal of Educational Measurement, 22,
49 Powers, D. E. (1988). Preparing for the SAT: A survey of programs and resources (College Board Report 88-7; ETS Research Report 88-40). New York: College Entrance Examination Board. Powers, D. E. (1998). Preparing for the SAT I: Reasoning test An update (College Board Report 98-5; ETS Research Report 98-34), New York: College Entrance Examination Board. Powers, D. E., & Hecht, L. W. (1982). Preparing for the Graduate Management Admission Test: A descriptive study of candidates use of alternative methods of test preparation (GMAC Research Report 82-2; ETS Research Report 82-36). Princeton, NJ: Educational Testing Service. Rowan & Blewitt Incorporated. (1998). Educational Testing Service nationwide opinion survey final report. Washington, DC: Author. Smith, G. P. (1987). The impact of competency tests on teacher education: Ethical and legal issues in selecting and certifying teachers. In M. Haberman & J. M. Backus (Eds.), Advances in teacher education (Vol. 3, pp ). Norwood, NJ: Ablex. Snow, M. B. (1995). The Nevada competency testing program for educational personnel. Carson City, NV: Nevada Department of Education, Planning, Research, and Evaluation Branch. (ERIC Document Reproduction Service No. ED ) Van Etten, S., Freebern, G., & Pressley, M. (1997). College students beliefs about exam preparation. Contemporary Educational Psychology, 22, Wilder, G. Z., & Cline, F. A. (1997). Research on LearningPlus outcomes: Report of a preliminary study. Princeton, NJ: Educational Testing Service. Wilder, G. Z., & Stricker, L. J. (1998). Perceptions of the fairness of Praxis tests and consequences for test performance: Focus group results. Princeton, NJ: Educational Testing Service. 44
50 Notes 1 The scoring of single items is shown in brackets. 2 The Hispanic category consists of Mexican, Puerto Rican, and Other Hispanic; the Asian category consists of Asian, Southeast Asian, and Pacific Islander; and the Other category consists of Native American and Other. 3 The scoring is shown in brackets. 4 The codes for the dummy variables were: a. Test Preparation Time (11 to 20 hours, 21 to 30 hours, 31 to 40 hours, More than 40 hours=1; None, 1 to 5 hours, 6 to 10 hours=0) b. Sex (female=1, male=0) c. Ethnicity (White=1, All others=0; Black=1, All others=0; Hispanic=1, All others=0; Asian=1, All others=0; Other=1, All others=0) d. Parental Education (College educated=1; Not college educated=0) e. Years Since School (Currently attending=1, All others=0; Less than 1 year and 1 3 years=1, All others=0; 4 6 years, 7 10 years, More than 10 years=1, all others=0) f. Enrolled in Teacher Education Program (Currently=1, All others=0; Formerly=1, All others=0; Never=1, All others=0) g. College: Control (Public=1, All others=0; Independent=1, All others=0; Catholic=1, All others=0; Protestant and other religious=1, All others=0) h. College: Historically Black College (Yes=1, No=0) i. College: Carnegie Classification (Research Universities I and II=1, All others=0; Doctoral Universities I and II=1, All others=0; Master s Colleges and Universities=1; All others=0; Baccalaureate Colleges I and II=1, All others=0; Associate of Arts Colleges and Specialized Institutions=1, all others=0) j. College: Selectivity (Moderately Difficult, Very Difficult, and Most Difficult=1; Noncompetitive or Minimally Difficult=0) k. Reasons for Taking the PPST (Enter=1, All others=0; Requirements=1, All others=0; Enter and Requirements=1, All others=0; License=1, All others=0; Enter, Requirements, and License=1, All others=0; Miscellaneous=1, All others=0) 5 One dummy variable was excluded from each set to avoid collinearity: Other for Ethnicity, Miscellaneous for Reasons for Taking the PPST, 4 years or More for Years Since School, 45
51 Never for Enrolled in Teacher Education Program, Protestant and Other Religious for College: Control, and Associate of Arts Colleges and Specialized Institutions for College: Carnegie Classification. 46
52 Appendix Survey of PPST Preparation Initial Letter Sent to PPST Takers Follow-up Letter Sent to PPST Takers
53
54
55
Psychometric Research Brief Office of Shared Accountability
 August 2012 Psychometric Research Brief Office of Shared Accountability Linking Measures of Academic Progress in Mathematics and Maryland School Assessment in Mathematics Huafang Zhao, Ph.D. This brief
STEM Academy Workshops Evaluation
 OFFICE OF INSTITUTIONAL RESEARCH RESEARCH BRIEF #882 August 2015 STEM Academy Workshops Evaluation By Daniel Berumen, MPA Introduction The current report summarizes the results of the research activities
Evaluation of Teach For America:
 EA15-536-2 Evaluation of Teach For America: 2014-2015 Department of Evaluation and Assessment Mike Miles Superintendent of Schools This page is intentionally left blank. ii Evaluation of Teach For America:
(Includes a Detailed Analysis of Responses to Overall Satisfaction and Quality of Academic Advising Items) By Steve Chatman
 By Steve Chatman") Report #202-1/01 Using Item Correlation With Global Satisfaction Within Academic Division to Reduce Questionnaire Length and to Raise the Value of Results An Analysis of Results from the 1996 UC Survey
Report #202-1/01 Using Item Correlation With Global Satisfaction Within Academic Division to Reduce Questionnaire Length and to Raise the Value of Results An Analysis of Results from the 1996 UC Survey
School Competition and Efficiency with Publicly Funded Catholic Schools David Card, Martin D. Dooley, and A. Abigail Payne
 School Competition and Efficiency with Publicly Funded Catholic Schools David Card, Martin D. Dooley, and A. Abigail Payne Web Appendix See paper for references to Appendix Appendix 1: Multiple Schools
National Survey of Student Engagement Spring University of Kansas. Executive Summary
 National Survey of Student Engagement Spring 2010 University of Kansas Executive Summary Overview One thousand six hundred and twenty-one (1,621) students from the University of Kansas completed the web-based
An Empirical Analysis of the Effects of Mexican American Studies Participation on Student Achievement within Tucson Unified School District
 An Empirical Analysis of the Effects of Mexican American Studies Participation on Student Achievement within Tucson Unified School District Report Submitted June 20, 2012, to Willis D. Hawley, Ph.D., Special
Principal vacancies and appointments
 Principal vacancies and appointments 2009 10 Sally Robertson New Zealand Council for Educational Research NEW ZEALAND COUNCIL FOR EDUCATIONAL RESEARCH TE RŪNANGA O AOTEAROA MŌ TE RANGAHAU I TE MĀTAURANGA
2005 National Survey of Student Engagement: Freshman and Senior Students at. St. Cloud State University. Preliminary Report.
 National Survey of Student Engagement: Freshman and Senior Students at St. Cloud State University Preliminary Report (December, ) Institutional Studies and Planning National Survey of Student Engagement
learning collegiate assessment]
![learning collegiate assessment]](/thumbs/71/66063392.jpg "learning collegiate assessment]") [ collegiate learning assessment] INSTITUTIONAL REPORT 2005 2006 Kalamazoo College council for aid to education 215 lexington avenue floor 21 new york new york 10016-6023 p 212.217.0700 f 212.661.9766
[ collegiate learning assessment] INSTITUTIONAL REPORT 2005 2006 Kalamazoo College council for aid to education 215 lexington avenue floor 21 new york new york 10016-6023 p 212.217.0700 f 212.661.9766
Peer Influence on Academic Achievement: Mean, Variance, and Network Effects under School Choice
 Megan Andrew Cheng Wang Peer Influence on Academic Achievement: Mean, Variance, and Network Effects under School Choice Background Many states and municipalities now allow parents to choose their children
American Journal of Business Education October 2009 Volume 2, Number 7
 Factors Affecting Students Grades In Principles Of Economics Orhan Kara, West Chester University, USA Fathollah Bagheri, University of North Dakota, USA Thomas Tolin, West Chester University, USA ABSTRACT
A Study of Metacognitive Awareness of Non-English Majors in L2 Listening
 ISSN 1798-4769 Journal of Language Teaching and Research, Vol. 4, No. 3, pp. 504-510, May 2013 Manufactured in Finland. doi:10.4304/jltr.4.3.504-510 A Study of Metacognitive Awareness of Non-English Majors
African American Male Achievement Update
 Report from the Department of Research, Evaluation, and Assessment Number 8 January 16, 2009 African American Male Achievement Update AUTHOR: Hope E. White, Ph.D., Program Evaluation Specialist Department
Session 2B From understanding perspectives to informing public policy the potential and challenges for Q findings to inform survey design
 Session 2B From understanding perspectives to informing public policy the potential and challenges for Q findings to inform survey design Paper #3 Five Q-to-survey approaches: did they work? Job van Exel
The Impact of Honors Programs on Undergraduate Academic Performance, Retention, and Graduation
 University of Nebraska - Lincoln DigitalCommons@University of Nebraska - Lincoln Journal of the National Collegiate Honors Council - -Online Archive National Collegiate Honors Council Fall 2004 The Impact
THE PENNSYLVANIA STATE UNIVERSITY SCHREYER HONORS COLLEGE DEPARTMENT OF MATHEMATICS ASSESSING THE EFFECTIVENESS OF MULTIPLE CHOICE MATH TESTS
 THE PENNSYLVANIA STATE UNIVERSITY SCHREYER HONORS COLLEGE DEPARTMENT OF MATHEMATICS ASSESSING THE EFFECTIVENESS OF MULTIPLE CHOICE MATH TESTS ELIZABETH ANNE SOMERS Spring 2011 A thesis submitted in partial
Redirected Inbound Call Sampling An Example of Fit for Purpose Non-probability Sample Design
 Redirected Inbound Call Sampling An Example of Fit for Purpose Non-probability Sample Design Burton Levine Karol Krotki NISS/WSS Workshop on Inference from Nonprobability Samples September 25, 2017 RTI
Introduction to Questionnaire Design
 Introduction to Questionnaire Design Why this seminar is necessary! Bad questions are everywhere! Don t let them happen to you! Fall 2012 Seminar Series University of Illinois www.srl.uic.edu The first
SAT Results December, 2002 Authors: Chuck Dulaney and Roger Regan WCPSS SAT Scores Reach Historic High
 ABOUT THE SAT 2001-2002 SAT Results December, 2002 Authors: Chuck Dulaney and Roger Regan WCPSS SAT Scores Reach Historic High The Scholastic Assessment Test (SAT), more formally known as the SAT I: Reasoning
Effective Pre-school and Primary Education 3-11 Project (EPPE 3-11)
") Effective Pre-school and Primary Education 3-11 Project (EPPE 3-11) A longitudinal study funded by the DfES (2003 2008) Exploring pupils views of primary school in Year 5 Address for correspondence: EPPSE
Effective Pre-school and Primary Education 3-11 Project (EPPE 3-11) A longitudinal study funded by the DfES (2003 2008) Exploring pupils views of primary school in Year 5 Address for correspondence: EPPSE
EFFECTS OF MATHEMATICS ACCELERATION ON ACHIEVEMENT, PERCEPTION, AND BEHAVIOR IN LOW- PERFORMING SECONDARY STUDENTS
 EFFECTS OF MATHEMATICS ACCELERATION ON ACHIEVEMENT, PERCEPTION, AND BEHAVIOR IN LOW- PERFORMING SECONDARY STUDENTS Jennifer Head, Ed.S Math and Least Restrictive Environment Instructional Coach Department
Shyness and Technology Use in High School Students. Lynne Henderson, Ph. D., Visiting Scholar, Stanford
 Shyness and Technology Use in High School Students Lynne Henderson, Ph. D., Visiting Scholar, Stanford University Philip Zimbardo, Ph.D., Professor, Psychology Department Charlotte Smith, M.S., Graduate
NATIONAL SURVEY OF STUDENT ENGAGEMENT (NSSE)
") NATIONAL SURVEY OF STUDENT ENGAGEMENT (NSSE) 2008 H. Craig Petersen Director, Analysis, Assessment, and Accreditation Utah State University Logan, Utah AUGUST, 2008 TABLE OF CONTENTS Executive Summary...1
NATIONAL SURVEY OF STUDENT ENGAGEMENT (NSSE) 2008 H. Craig Petersen Director, Analysis, Assessment, and Accreditation Utah State University Logan, Utah AUGUST, 2008 TABLE OF CONTENTS Executive Summary...1
Linking the Common European Framework of Reference and the Michigan English Language Assessment Battery Technical Report
 Linking the Common European Framework of Reference and the Michigan English Language Assessment Battery Technical Report Contact Information All correspondence and mailings should be addressed to: CaMLA
BENCHMARK TREND COMPARISON REPORT:
 National Survey of Student Engagement (NSSE) BENCHMARK TREND COMPARISON REPORT: CARNEGIE PEER INSTITUTIONS, 2003-2011 PREPARED BY: ANGEL A. SANCHEZ, DIRECTOR KELLI PAYNE, ADMINISTRATIVE ANALYST/ SPECIALIST
UK Institutional Research Brief: Results of the 2012 National Survey of Student Engagement: A Comparison with Carnegie Peer Institutions
 UK Institutional Research Brief: Results of the 2012 National Survey of Student Engagement: A Comparison with Carnegie Peer Institutions November 2012 The National Survey of Student Engagement (NSSE) has
Institution of Higher Education Demographic Survey
 Institution of Higher Education Demographic Survey Data from all participating institutions are aggregated for the comparative studies by various types of institutional characteristics. For that purpose,
What is related to student retention in STEM for STEM majors? Abstract:
 What is related to student retention in STEM for STEM majors? Abstract: The purpose of this study was look at the impact of English and math courses and grades on retention in the STEM major after one
Demographic Survey for Focus and Discussion Groups
 Appendix F Demographic Survey for Focus and Discussion Groups Demographic Survey--Lesbian, Gay, and Bisexual Discussion Group Demographic Survey Faculty with Disabilities Discussion Group Demographic Survey
Report on organizing the ROSE survey in France
 Report on organizing the ROSE survey in France Florence Le Hebel, florence.le-hebel@ens-lsh.fr, University of Lyon, March 2008 1. ROSE team The French ROSE team consists of Dr Florence Le Hebel (Associate
IS FINANCIAL LITERACY IMPROVED BY PARTICIPATING IN A STOCK MARKET GAME?
 21 JOURNAL FOR ECONOMIC EDUCATORS, 10(1), SUMMER 2010 IS FINANCIAL LITERACY IMPROVED BY PARTICIPATING IN A STOCK MARKET GAME? Cynthia Harter and John F.R. Harter 1 Abstract This study investigates the
Level 1 Mathematics and Statistics, 2015
 91037 910370 1SUPERVISOR S Level 1 Mathematics and Statistics, 2015 91037 Demonstrate understanding of chance and data 9.30 a.m. Monday 9 November 2015 Credits: Four Achievement Achievement with Merit
Evaluation of Hybrid Online Instruction in Sport Management
 Evaluation of Hybrid Online Instruction in Sport Management Frank Butts University of West Georgia fbutts@westga.edu Abstract The movement toward hybrid, online courses continues to grow in higher education
THEORY OF PLANNED BEHAVIOR MODEL IN ELECTRONIC LEARNING: A PILOT STUDY
 THEORY OF PLANNED BEHAVIOR MODEL IN ELECTRONIC LEARNING: A PILOT STUDY William Barnett, University of Louisiana Monroe, barnett@ulm.edu Adrien Presley, Truman State University, apresley@truman.edu ABSTRACT
NATIONAL CENTER FOR EDUCATION STATISTICS RESPONSE TO RECOMMENDATIONS OF THE NATIONAL ASSESSMENT GOVERNING BOARD AD HOC COMMITTEE ON.
 NATIONAL CENTER FOR EDUCATION STATISTICS RESPONSE TO RECOMMENDATIONS OF THE NATIONAL ASSESSMENT GOVERNING BOARD AD HOC COMMITTEE ON NAEP TESTING AND REPORTING OF STUDENTS WITH DISABILITIES (SD) AND ENGLISH
Alpha provides an overall measure of the internal reliability of the test. The Coefficient Alphas for the STEP are:
 Every individual is unique. From the way we look to how we behave, speak, and act, we all do it differently. We also have our own unique methods of learning. Once those methods are identified, it can make
TAIWANESE STUDENT ATTITUDES TOWARDS AND BEHAVIORS DURING ONLINE GRAMMAR TESTING WITH MOODLE
 TAIWANESE STUDENT ATTITUDES TOWARDS AND BEHAVIORS DURING ONLINE GRAMMAR TESTING WITH MOODLE Ryan Berg TransWorld University Yi-chen Lu TransWorld University Main Points 2 When taking online tests, students
Chapters 1-5 Cumulative Assessment AP Statistics November 2008 Gillespie, Block 4
 Chapters 1-5 Cumulative Assessment AP Statistics Name: November 2008 Gillespie, Block 4 Part I: Multiple Choice This portion of the test will determine 60% of your overall test grade. Each question is
NATIONAL SURVEY OF STUDENT ENGAGEMENT
 NATIONAL SURVEY OF STUDENT ENGAGEMENT 2010 Benchmark Comparisons Report OFFICE OF INSTITUTIONAL RESEARCH & PLANNING To focus discussions about the importance of student engagement and to guide institutional
Effective Recruitment and Retention Strategies for Underrepresented Minority Students: Perspectives from Dental Students
 Critical Issues in Dental Education Effective Recruitment and Retention Strategies for Underrepresented Minority Students: Perspectives from Dental Students Naty Lopez, Ph.D.; Rose Wadenya, D.M.D., M.S.;
Segmentation Study of Tulsa Area Higher Education Needs Ages 36+ March Prepared for: Conducted by:
 Segmentation Study of Tulsa Area Higher Education Needs Ages 36+ March 2004 * * * Prepared for: Tulsa Community College Tulsa, OK * * * Conducted by: Render, vanderslice & Associates Tulsa, Oklahoma Project
A Guide to Adequate Yearly Progress Analyses in Nevada 2007 Nevada Department of Education
 A Guide to Adequate Yearly Progress Analyses in Nevada 2007 Nevada Department of Education Note: Additional information regarding AYP Results from 2003 through 2007 including a listing of each individual
Legacy of NAACP Salary equalization suits.
 Why tests, anyway? Legacy of NAACP Salary equalization suits. If you can t beat em, test em. Boom! Legacy of teacher tests NTE PRAXIS-II Pearson Content Examinations GRE ACT SAT All are statistically significantly
https://secure.aacte.org/apps/peds/print_all_forms.php?view=report&prin...
 1 of 35 4/25/2012 9:56 AM A» 2011 PEDS» Institutional Data inst id: 3510 Institutional Data A_1 Institutional Information This information will be used in all official references to your institution. Institution
OVERVIEW OF CURRICULUM-BASED MEASUREMENT AS A GENERAL OUTCOME MEASURE
 OVERVIEW OF CURRICULUM-BASED MEASUREMENT AS A GENERAL OUTCOME MEASURE Mark R. Shinn, Ph.D. Michelle M. Shinn, Ph.D. Formative Evaluation to Inform Teaching Summative Assessment: Culmination measure. Mastery
Meeting these requirements does not guarantee admission to the program.
 .Eastern Connecticut State University, School of Education & Professional Studies Committee on Admission and Retention in Education (CARE) UNDERGRADUATE ELEMENTARY Teacher Certification Application Application
Updated: December Educational Attainment
 Updated: Educational Attainment Among 25- to 29-year olds, the proportions who have attained a high school education, some college, or a bachelor s degree are all rising, according to longterm trends.
Linking the Ohio State Assessments to NWEA MAP Growth Tests *
 Linking the Ohio State Assessments to NWEA MAP Growth Tests * *As of June 2017 Measures of Academic Progress (MAP ) is known as MAP Growth. August 2016 Introduction Northwest Evaluation Association (NWEA
Race, Class, and the Selective College Experience
 Race, Class, and the Selective College Experience Thomas J. Espenshade Alexandria Walton Radford Chang Young Chung Office of Population Research Princeton University December 15, 2009 1 Overview of NSCE
Bellevue University Bellevue, NE
 C O L L E G E P R O F I L E - O V E R V I E W Bellevue University Bellevue, NE Bellevue, founded in 1966, is a private university. Its campus is located in Bellevue, in the Omaha metropolitan area. Web
READY OR NOT? CALIFORNIA'S EARLY ASSESSMENT PROGRAM AND THE TRANSITION TO COLLEGE
 READY OR NOT? CALIFORNIA'S EARLY ASSESSMENT PROGRAM AND THE TRANSITION TO COLLEGE Michal Kurlaender University of California, Davis Policy Analysis for California Education March 16, 2012 This research
Educational Attainment
 A Demographic and Socio-Economic Profile of Allen County, Indiana based on the 2010 Census and the American Community Survey Educational Attainment A Review of Census Data Related to the Educational Attainment
Van Andel Education Institute Science Academy Professional Development Allegan June 2015
 Van Andel Education Institute Science Academy Professional Development Allegan June 2015 Science teachers from Allegan RESA took part in professional development with the Van Andel Education Institute
The Demographic Wave: Rethinking Hispanic AP Trends
 The Demographic Wave: Rethinking Hispanic AP Trends Kelcey Edwards & Ellen Sawtell AP Annual Conference, Las Vegas, NV July 19, 2013 Exploring the Data Hispanic/Latino US public school graduates The Demographic
What Is The National Survey Of Student Engagement (NSSE)?
?") National Survey of Student Engagement (NSSE) 2000 Results for Montclair State University What Is The National Survey Of Student Engagement (NSSE)? US News and World Reports Best College Survey is due next
National Survey of Student Engagement (NSSE) 2000 Results for Montclair State University What Is The National Survey Of Student Engagement (NSSE)? US News and World Reports Best College Survey is due next
Undergraduates Views of K-12 Teaching as a Career Choice
 Undergraduates Views of K-12 Teaching as a Career Choice A Report Prepared for The Professional Educator Standards Board Prepared by: Ana M. Elfers Margaret L. Plecki Elise St. John Rebecca Wedel University
Making Sales Calls. Watertown High School, Watertown, Massachusetts. 1 hour, 4 5 days per week
 Making Sales Calls Classroom at a Glance Teacher: Language: Eric Bartolotti Arabic I Grades: 9 and 11 School: Lesson Date: April 13 Class Size: 10 Schedule: Watertown High School, Watertown, Massachusetts
08-09 DATA REVIEW AND ACTION PLANS Candidate Reports
 08-09 DATA REVIEW AND ACTION PLANS Candidate Reports Data Observations Implications for Change Action for Change Admitted to TEP Only ~24% of students Recruit more secondary majors Develop recruitment
Shelters Elementary School
 Shelters Elementary School August 2, 24 Dear Parents and Community Members: We are pleased to present you with the (AER) which provides key information on the 23-24 educational progress for the Shelters
OPAC and User Perception in Law University Libraries in the Karnataka: A Study
 ISSN 2229-5984 (P) 29-5576 (e) OPAC and User Perception in Law University Libraries in the Karnataka: A Study Devendra* and Khaiser Nikam** To Cite: Devendra & Nikam, K. (20). OPAC and user perception
Iowa School District Profiles. Le Mars
 Iowa School District Profiles Overview This profile describes enrollment trends, student performance, income levels, population, and other characteristics of the public school district. The report utilizes
Lesson M4. page 1 of 2
 Lesson M4 page 1 of 2 Miniature Gulf Coast Project Math TEKS Objectives 111.22 6b.1 (A) apply mathematics to problems arising in everyday life, society, and the workplace; 6b.1 (C) select tools, including
Association Between Categorical Variables
 Student Outcomes Students use row relative frequencies or column relative frequencies to informally determine whether there is an association between two categorical variables. Lesson Notes In this lesson,
On-the-Fly Customization of Automated Essay Scoring
 Research Report On-the-Fly Customization of Automated Essay Scoring Yigal Attali Research & Development December 2007 RR-07-42 On-the-Fly Customization of Automated Essay Scoring Yigal Attali ETS, Princeton,
Best Colleges Main Survey
 Best Colleges Main Survey Date submitted 5/12/216 18::56 Introduction page 1 / 146 BEST COLLEGES Data Collection U.S. News has begun collecting data for the 217 edition of Best Colleges. The U.S. News
U VA THE CHANGING FACE OF UVA STUDENTS: SSESSMENT. About The Study
 About The Study U VA SSESSMENT In 6, the University of Virginia Office of Institutional Assessment and Studies undertook a study to describe how first-year students have changed over the past four decades.
CHAPTER 5: COMPARABILITY OF WRITTEN QUESTIONNAIRE DATA AND INTERVIEW DATA
 CHAPTER 5: COMPARABILITY OF WRITTEN QUESTIONNAIRE DATA AND INTERVIEW DATA Virginia C. Mueller Gathercole As a supplement to the interviews, we also sent out written questionnaires, to gauge the generality
University of Maine at Augusta Augusta, ME
 C O L L E G E P R O F I L E - O V E R V I E W University of Maine at Augusta Augusta, ME U Maine at Augusta, founded in 1965, is a public university. Its 165-acre campus is located in Augusta, 50 miles
Process Evaluations for a Multisite Nutrition Education Program
 Process Evaluations for a Multisite Nutrition Education Program Paul Branscum 1 and Gail Kaye 2 1 The University of Oklahoma 2 The Ohio State University Abstract Process evaluations are an often-overlooked
SUNY Downstate Medical Center Brooklyn, NY
 C O L L E G E P R O F I L E - O V E R V I E W SUNY Downstate Medical Center Brooklyn, NY SUNY Health Science Center at Brooklyn, founded in 1858, is a public, upper-division institution. Its 13-acre campus
New Jersey Institute of Technology Newark College of Engineering
 New Jersey Institute of Technology Newark College of Engineering AND IN ELECTRICAL AND COMPUTER ENGINEERING Program Review Last Update: Nov. 23, 2005 MISSION STATEMENTS DOCTOR OF PHILOSOPHY IN ELECTRICAL
Essentials of Ability Testing. Joni Lakin Assistant Professor Educational Foundations, Leadership, and Technology
 Essentials of Ability Testing Joni Lakin Assistant Professor Educational Foundations, Leadership, and Technology Basic Topics Why do we administer ability tests? What do ability tests measure? How are
STUDENT SATISFACTION IN PROFESSIONAL EDUCATION IN GWALIOR
 International Journal of Human Resource Management and Research (IJHRMR) ISSN 2249-6874 Vol. 3, Issue 2, Jun 2013, 71-76 TJPRC Pvt. Ltd. STUDENT SATISFACTION IN PROFESSIONAL EDUCATION IN GWALIOR DIVYA
Supply and Demand of Instructional School Personnel
 Supply and Demand of Instructional School Personnel Presentation to the 82 nd Annual Virginia Middle and High School Principals Conference and Exposition Mrs. Patty S. Pitts Assistant Superintendent of
TRENDS IN. College Pricing
 2008 TRENDS IN College Pricing T R E N D S I N H I G H E R E D U C A T I O N S E R I E S T R E N D S I N H I G H E R E D U C A T I O N S E R I E S Highlights 2 Published Tuition and Fee and Room and Board
School Size and the Quality of Teaching and Learning
 School Size and the Quality of Teaching and Learning An Analysis of Relationships between School Size and Assessments of Factors Related to the Quality of Teaching and Learning in Primary Schools Undertaken
About the College Board. College Board Advocacy & Policy Center
 15% 10 +5 0 5 Tuition and Fees 10 Appropriations per FTE ( Excluding Federal Stimulus Funds) 15% 1980-81 1981-82 1982-83 1983-84 1984-85 1985-86 1986-87 1987-88 1988-89 1989-90 1990-91 1991-92 1992-93
Proficiency Illusion
 KINGSBURY RESEARCH CENTER Proficiency Illusion Deborah Adkins, MS 1 Partnering to Help All Kids Learn NWEA.org 503.624.1951 121 NW Everett St., Portland, OR 97209 Executive Summary At the heart of the
Miami-Dade County Public Schools
 ENGLISH LANGUAGE LEARNERS AND THEIR ACADEMIC PROGRESS: 2010-2011 Author: Aleksandr Shneyderman, Ed.D. January 2012 Research Services Office of Assessment, Research, and Data Analysis 1450 NE Second Avenue,
Bellevue University Admission Application
 Bellevue University Admission Application Bellevue University is an open admissions university. Once you submit your application, we will begin the process of evaluating your credits and developing your
NCEO Technical Report 27
 Home About Publications Special Topics Presentations State Policies Accommodations Bibliography Teleconferences Tools Related Sites Interpreting Trends in the Performance of Special Education Students
Descriptive Summary of Beginning Postsecondary Students Two Years After Entry
 NATIONAL CENTER FOR EDUCATION STATISTICS Statistical Analysis Report June 994 Descriptive Summary of 989 90 Beginning Postsecondary Students Two Years After Entry Contractor Report Robert Fitzgerald Lutz
teacher, peer, or school) on each page, and a package of stickers on which
 on each page, and a package of stickers on which") ED 026 133 DOCUMENT RESUME PS 001 510 By-Koslin, Sandra Cohen; And Others A Distance Measure of Racial Attitudes in Primary Grade Children: An Exploratory Study. Educational Testing Service, Princeton,
ED 026 133 DOCUMENT RESUME PS 001 510 By-Koslin, Sandra Cohen; And Others A Distance Measure of Racial Attitudes in Primary Grade Children: An Exploratory Study. Educational Testing Service, Princeton,
Application for Postgraduate Studies (Research)
") Application for Postgraduate Studies (Research) Please complete clearly. This form will be photocopied. Applicant Number (for office use only). For office use only: Admissions Office Admissions Tutor Interview
Application for Postgraduate Studies (Research) Please complete clearly. This form will be photocopied. Applicant Number (for office use only). For office use only: Admissions Office Admissions Tutor Interview
Evidence for Reliability, Validity and Learning Effectiveness
 PEARSON EDUCATION Evidence for Reliability, Validity and Learning Effectiveness Introduction Pearson Knowledge Technologies has conducted a large number and wide variety of reliability and validity studies
National Longitudinal Study of Adolescent Health. Wave III Education Data
 National Longitudinal Study of Adolescent Health Wave III Education Data Primary Codebook Chandra Muller, Jennifer Pearson, Catherine Riegle-Crumb, Jennifer Harris Requejo, Kenneth A. Frank, Kathryn S.
Sociology 521: Social Statistics and Quantitative Methods I Spring Wed. 2 5, Kap 305 Computer Lab. Course Website
 Sociology 521: Social Statistics and Quantitative Methods I Spring 2012 Wed. 2 5, Kap 305 Computer Lab Instructor: Tim Biblarz Office hours (Kap 352): W, 5 6pm, F, 10 11, and by appointment (213) 740 3547;
Entrepreneurial Discovery and the Demmert/Klein Experiment: Additional Evidence from Germany
 Entrepreneurial Discovery and the Demmert/Klein Experiment: Additional Evidence from Germany Jana Kitzmann and Dirk Schiereck, Endowed Chair for Banking and Finance, EUROPEAN BUSINESS SCHOOL, International
National Survey of Student Engagement (NSSE)
") 2008 NSSE National Survey of Student Engagement (NSSE) Understanding SRU Student Engagement Patterns of Evidence NSSE Presentation Overview What is student engagement? What do we already know about student
2008 NSSE National Survey of Student Engagement (NSSE) Understanding SRU Student Engagement Patterns of Evidence NSSE Presentation Overview What is student engagement? What do we already know about student
Cooper Upper Elementary School
 LIVONIA PUBLIC SCHOOLS www.livoniapublicschools.org/cooper 213-214 BOARD OF EDUCATION 213-14 Mark Johnson, President Colleen Burton, Vice President Dianne Laura, Secretary Tammy Bonifield, Trustee Dan
Graduate Division Annual Report Key Findings
 Graduate Division 2010 2011 Annual Report Key Findings Trends in Admissions and Enrollment 1 Size, selectivity, yield UCLA s graduate programs are increasingly attractive and selective. Between Fall 2001
Cooper Upper Elementary School
 LIVONIA PUBLIC SCHOOLS http://cooper.livoniapublicschools.org 215-216 Annual Education Report BOARD OF EDUCATION 215-16 Colleen Burton, President Dianne Laura, Vice President Tammy Bonifield, Secretary
JOB OUTLOOK 2018 NOVEMBER 2017 FREE TO NACE MEMBERS $52.00 NONMEMBER PRICE NATIONAL ASSOCIATION OF COLLEGES AND EMPLOYERS
 NOVEMBER 2017 FREE TO NACE MEMBERS $52.00 NONMEMBER PRICE JOB OUTLOOK 2018 NATIONAL ASSOCIATION OF COLLEGES AND EMPLOYERS 62 Highland Avenue, Bethlehem, PA 18017 www.naceweb.org 610,868.1421 TABLE OF CONTENTS
Application for Admission to Postgraduate Studies
 Ref A Application for Admission to Postgraduate Studies Please read the attached notes before completing the application form Section A Personal Details (Please see notes) Surname / Family name Email Mr
Textbook Evalyation:
 STUDIES IN LITERATURE AND LANGUAGE Vol. 1, No. 8, 2010, pp. 54-60 www.cscanada.net ISSN 1923-1555 [Print] ISSN 1923-1563 [Online] www.cscanada.org Textbook Evalyation: EFL Teachers Perspectives on New
National Survey of Student Engagement (NSSE) Temple University 2016 Results
 Temple University 2016 Results") Introduction The National Survey of Student Engagement (NSSE) is administered by hundreds of colleges and universities every year (560 in 2016), and is designed to measure the amount of time and effort
Introduction The National Survey of Student Engagement (NSSE) is administered by hundreds of colleges and universities every year (560 in 2016), and is designed to measure the amount of time and effort
Status of Women of Color in Science, Engineering, and Medicine
 Status of Women of Color in Science, Engineering, and Medicine The figures and tables below are based upon the latest publicly available data from AAMC, NSF, Department of Education and the US Census Bureau.
Please complete these two forms, sign them, and return them to us in the enclosed pre paid envelope.
 Anatomical Donation Program Jack and Pearl Resnick Campus 1300 Morris Park Avenue, Rm F627N Bronx, NY 10461 Phone: 718.430.3142 Fax: 718.430.8997 anatomical.gifts@einstein.yu.edu We sincerely thank you
Interprofessional educational team to develop communication and gestural skills
 Title Interprofessional educational team to develop communication and gestural skills Authors Annamaria Bagnasco 1, Giancarlo Torre 2, Nicola Pagnucci 3, Angela Tolotti 3, Francesca Rosa 3, Loredana Sasso