SUPERVISED AGRICULTURAL EXPERIENCE IN KENTUCKY: CONDITION AND PERCEPTIONS
|
|
|
- Aubrey Whitehead
- 6 years ago
- Views:
Transcription
. University of Kentucky Master's Theses. 514.")
1 University of Kentucky UKnowledge University of Kentucky Master's Theses Graduate School 2008 SUPERVISED AGRICULTURAL EXPERIENCE IN KENTUCKY: CONDITION AND PERCEPTIONS Cameron Cash White University of Kentucky Recommended Citation White, Cameron Cash, "SUPERVISED AGRICULTURAL EXPERIENCE IN KENTUCKY: CONDITION AND PERCEPTIONS" (2008). University of Kentucky Master's Theses This Thesis is brought to you for free and open access by the Graduate School at UKnowledge. It has been accepted for inclusion in University of Kentucky Master's Theses by an authorized administrator of UKnowledge. For more information, please contact
2 ABSTRACT OF THESIS SUPERVISED AGRICULTURAL EXPERIENCE IN KENTUCKY: CONDITION AND PERCEPTIONS Agricultural education consists of three components: classroom instruction, FFA, and supervised agricultural experience (SAE). SAE is the experiential learning component in which students apply agricultural principles and concepts. The purpose of this study was to identify the perceptions of Kentucky high school agriculture teachers toward the value of SAE, the quality components of SAE, and teacher satisfaction with SAE. A secondary purpose was to determine the status of SAE participation in Kentucky. This study concluded that Kentucky agriculture teachers perceive SAE as a valuable component of agricultural education. Moreover, teachers were in agreement with accepted quality standards for SAE programs, but the findings implied that other quality indicators may be valid. Furthermore, teachers were not satisfied with their SAE programs. A slight majority of students in Kentucky agricultural education programs have a SAE with the bulk of those SAEs categorized as either placement or entrepreneurship SAEs. Based on the conclusions, the author recommended that a SAE task force be created to address concerns related to SAE participation, student and teacher motivation to conduct SAE, state rewards for SAEs, and assessing the quality of SAE programs in Kentucky. KEYWORDS: Agricultural Education, Supervised Agricultural Experience, Experiential Learning, SAE Participation, Agriculture Teacher Perceptions Cameron Cash White April,
3 SUPERVISED AGRICULTURAL EXPERIENCE IN KENTUCKY: CONDITION AND PERCEPTIONS By Cameron Cash White Dr. Robin Peiter Horstmeier Director of Thesis Dr. Randy Weckman Director of Graduate Studies April 24, 2008
4 RULES FOR THE USE OF THESES Unpublished theses submitted for the Master s degree and deposited in the University of Kentucky Library are as a rule open for inspection, but are to be used only with due regard to the rights of the authors. Bibliographical references may be noted, but quotations or summaries of parts may be published only with the permission of the author, and with the usual scholarly acknowledgments. Extensive copying or publication of the thesis in whole or in part also requires the consent of the Dean of the Graduate School of the University of Kentucky. A library that borrows this thesis for use by its patrons is expected to secure the signature of each user. Name Date
5 THESIS Cameron Cash White The Graduate School University of Kentucky 2008
6 SUPERVISED AGRICULTURAL EXPERIENCE IN KENTUCKY: CONDITION AND PERCEPTIONS THESIS A thesis submitted in partial fulfillment of the requirements for the degree of Master of Science in the College of Agriculture at the University of Kentucky By Cameron Cash White Lexington, Kentucky Director: Dr. Robin Peiter Horstmeier, Assistant Professor of Agricultural Education Lexington, Kentucky 2008 Copyright Cameron C. White 2008
7 ACKNOWLEDGEMENTS To all of the individuals who have guided me through my educational experiences at Lyon County and at the University of Kentucky, thank you. To my parents, thank you for your love and encouragement throughout my life. To my sister, thanks for always being there and helping me out when I got stuck. You three are my foundation, and I love you all very much. To Jen, I cannot even picture what the past two years would have been like without you in my life. Your love and support these past two years working through this project and finding a job have kept me going when I felt overwhelmed. You keep me grounded no matter what life throws at me. To Dr. Robin Peiter Horstmeier, you have served as my advisor throughout this educational process, both undergraduate and graduate. You have been instrumental in preparing me to be an agriculture teacher and I appreciate your encouragement to challenge myself as a graduate assistant for the past two years. Thank you for guiding me through the thesis development process as my committee chair and providing me with opportunities to continue research in agricultural education. To Dr. Tracy Kitchel, thank you for the opportunities you have provided me as TA in class and for the lessons in research and data analysis. Your encouragement and critiques have been instrumental to the completion of my thesis and my graduate education. To Dr. Randy Weckman, thank you for the encouragement throughout the thesis development process and your encouragement to continue to pursue education and continually learn. Your advice and support has helped get me through this process. iii
8 To Cord, Joey, Amber, and Derek thanks for being my colleagues in the grad office. Cord and Joey, the conversations we shared everyday in the office kept me sane when adapting to a new situation. Joey, the time we spent annoying Cord about his obsessions and playing trashcan basketball will be a cherished memory. Cord, your work ethic and aspirations to change agricultural education for the better serve as an inspiration for me as I prepare to teach. You both encouraged me to work on my master s for two years instead of one so that we could all pursue our degrees and have fewer changeovers the second year then you both left. Fortunately, I survived with the help of Derek and Amber. Derek and Amber, I appreciate the many discussions we have had about life during and after grad school. You each brought a very down to earth and realistic perspective to the office. I have enjoyed sharing random music days throughout the year and I am thankful that you all were around to keep me sane as I finished this whole process. I know that all four of you will make phenomenal agriculture teachers and wish you all the best. iv
9 TABLE OF CONTENTS ACKNOWLEDGEMENTS...iii LIST OF TABLES... vii LIST OF FIGURES...viii LIST OF FILES... ix CHAPTER 1: INTRODUCTION... 1 Background and Setting... 1 Conceptual Framework... 4 Statement of the Problem... 7 Purpose of the Study... 7 Objectives... 8 Definition of Terms... 8 Limitations of the Study... 9 Basic Assumptions... 9 Significance of the Problem CHAPTER 2: REVIEW OF LITERATURE Purpose of the Study Participation in Supervised Agricultural Experience Status of Participation Factors that Affect Participation Value of Supervised Agricultural Experience Supervised Agricultural Experience Quality Teacher Satisfaction with Supervised Agricultural Experience Summary of Review of Literature CHAPTER 3: METHODOLOGY Purpose of the Study Objectives Research Design Populations and Sample Population Sample Frame Error Sampling Error Selection Error Instrumentation Validity Procedures Reliability Procedures Data Collection Data Analysis Hypotheses CHAPTER 4: RESULTS AND FINDINGS Purpose of the Study Objectives Objective Objective v
10 Objective Objective Objective Objective CHAPTER 5: CONCLUSIONS AND RECOMMENDATIONS Purpose of the Study Objectives Conclusions and Implications Objective Objective Objective Objective Objective Objective Recommendations Recommendations for Further Research APPENDIX A: APPENDIX B: APPENDIX C: APPENDIX D: APPENDIX E: APPENDIX F: APPENDIX G: APPENDIX H: APPENDIX I: APPENDIX J: APPENDIX K: APPENDIX L: APPENDIX M: REFERENCES VITA vi
11 LIST OF TABLES Table 3.1, Comparison of Early to Late Respondents for SAE Constructs Table 4.1, Interval Demographic Characteristics of Kentucky Agriculture Teachers Table 4.2, Nominal and Ordinal Demographic Characteristics of Kentucky Agriculture Teachers Table 4.3, Student Participation in SAE as Reported by Kentucky Agriculture Teachers Table 4.4, Value of SAE as Reported by Kentucky Agriculture Teachers Table 4.5, Kentucky Agriculture Teacher Perceptions Regarding SAE Quality Components Table 4.6, Satisfaction of Kentucky Agriculture Teachers Regarding SAE Table 4.7, T-test Results for Differences in SAE Constructs by Degree Earned by the Agriculture Teacher Table 4.8, Analysis of Variance of Value Construct by Teaching Experience Table 4.9, Analysis of Variance of Quality Construct by Teaching Experience Table 4.10, Analysis of Variance of Satisfaction Construct by Teaching Experience Table 4.11, Analysis of Variance of Value Construct by Teacher Certification Rank Table 4.12, Analysis of Variance of Quality Construct by Teacher Certification Rank Table 4.13, Analysis of Variance of Satisfaction Construct by Teacher Certification Rank Table 4.14, Analysis of Variance of Value Construct by Department Size Table 4.15, Analysis of Variance of Quality Construct by Department Size Table 4.16, Analysis of Variance of Satisfaction Construct by Department Size vii
12 LIST OF FIGURES Figure 1.1. Illustration of the complete agricultural education program... 1 Figure 1.2. Conceptual model for conducting SAE research Figure 1.3. Cross-section of conceptual model for conducting SAE research... 7 viii
13 LIST OF FILES White_Thesis_2008.pdf (1.80 MB) ix
14 CHAPTER 1: INTRODUCTION Background and Setting Agricultural education was funded and regulated in public high schools in 1917 with the passage of the Smith-Hughes Act (NVEA, 2006). Section ten of the act required that experiential farm projects be a part of all high school programs, stating that all secondary high school agricultural education programs shall provide for directed or supervised practice in agriculture, either on a farm provided for by the school or other farm, for at least six months per year (NVEA, 2006, sec. 10). This project, known today as supervised agricultural experience (SAE), continues to be an integral part of agricultural education programs. The National FFA Organization lists three components of an agricultural education program: 1) classroom/laboratory instruction, 2) FFA, and 3) SAE (FFA Student Handbook, 2000). The general agricultural instruction component is represented by classroom instruction. FFA represents the leadership component and SAE represents the experiential learning component. Experiential learning is recognized as a valuable component of agricultural education and is included in the FFA motto with the line, doing to learn (FFA Student Handbook, 2000, p. 27). The agricultural education model can be represented by three interlocking circles of equal size to demonstrate the equal importance of each component. Figure 1.1 is an illustration of the complete agricultural education program. Classroom/ Laboratory Instruction SAE FFA Figure 1.1. Illustration of the complete agricultural education program.. 1
15 In Kentucky, the purpose of agricultural education is to provide career exploration, orientation, and preparation for those students who have an interest in some aspect of agriculture (Overview, 2006, p. 3). The Kentucky agriculture program of studies stresses student participation in cooperative education and work-based learning experiences, which may include a student s SAE program. The need for work-based learning experiences, such as SAE, are further stressed by the School-to-Work program which is used statewide in Kentucky to create an easy transition from secondary or post secondary education to work (Work based learning guide, 2006). The Kentucky Legislature (2006) identified SAE supervision as a priority for agriculture teachers. KRS section 11 provides 12-month employment for agriculture teachers and states that the added funds are to be used for the supervision and instruction of students in agriculture experience programs. SAE has undergone many changes within agricultural education. Though its national presence occurred with the Smith-Hughes Act in 1917 (NVEA, 2006), the project method of teaching was developed by Rufus Stimson, a pioneer agricultural educator, years before the act (Moore, 1988). The project method of teaching served as an inspiration for the experiential learning project the act required. The projects mandated by the Smith-Hughes Act were farm activities only (NVEA, 2006). At the time, almost 20% of the United States population lived on farms. However, the makeup of United States farmland changed so that by the 1980s only 2.2% of Americans lived on farms (Camp et al., 2000). In 1963, the Vocational Education Act was passed containing wording which was meant to expand SAE to include off-farm activities; however, the act is often interpreted that SAE is no longer a required activity of agriculture students (Dyer & Osborne, 1995). The name and definition of SAE have changed significantly through the years. Initially, it was referred to as the Farm Project Program (Camp et al., 2000). It was described more recently in 1988 as Supervised Occupational Experience (SOEP) (Phipps & Osborne, 1988). Phipps and Osborne (1988) defined SOEP as all the practical agricultural activities of educational value conducted by students outside of class and laboratory instruction or on school-released time for which systematic instruction and 2
16 supervision are provided by their teachers, parents, employers, or others (313). In 1992, a handbook titled, SAE: Experiencing Agriculture, was written by Barrick, Arrington, Heffernan, Hughes, Moody, Ogline, and Whaley (1992) to assist agricultural educators in planning and conducting SAE programs. The handbook signified the name change from SOEP to SAE. It also provided a new definition for SAE that cited specifically that SAE programs should be planned experiences that apply principles introduced in the classroom. According to Barrick et al. (1992), SAE could be described as the actual, planned application of concepts and principles learned in agricultural education (p.1). The definition continued to name individuals who should be involved with the supervision of a SAE including agriculture teachers, parents, and employers. This definition is widely accepted within the agricultural education community (Camp et al., 2000) and is similar to the definition recognized by the National FFA Organization (2006a; 2006b). SOEPs were intended to prepare students for eventual employment in the agricultural industry. In response to increased diversity in agriculture student enrollment, the program was expanded to include exploratory experiences that did not necessarily prepare students for employment but gave students a chance to inquire into agricultural fields. Barrick et al. (1992) described three types of SAEs: exploratory, entrepreneurship, and placement. Exploratory SAEs were designed for students interested in agriculture, but who did not plan to pursue a career within the agricultural industry. The purpose of the entrepreneurship SAE was to help students develop the ability to own and manage production agriculture or agribusiness enterprises (p. 5). The purpose of the placement SAE was to provide students with a placement on farms or in an agricultural business (Barrick et al., 1992). Today, the National FFA Organization recognizes all three SAE types described by Barrick et al. and has expanded to include two additional types: research/experimentation and analysis (National FFA Organization, 2006b) and service learning (The Official FFA Student Handbook, 2006). Students who conduct carefully planned, curriculum-based and long-term investigations of applied or basic areas related to agricultural and environmental science (National FFA Organization, 2006b, p. 2-2) are considered to have a research SAE. The purpose of the service learning SAE is to 3
17 connect community service and school activities in a supervised learning experience (The Official FFA Student Handbook, 2006). Studies identify a variety of benefits to students involved in SAE, as well as community and agricultural education program benefits. Students receive real-world experience through SAE (Barrick et al., 1992; Camp et al., 2000; National FFA Organization, 2006a, 2006b). According to Dyer and Williams (1997a) SAE also prepares students for jobs related to agriculture. In addition, SAE has a positive influence on work attitudes and behaviors of students and increases students general knowledge and awareness of agriculture. SAE has been shown to have a significant and positive economic impact on communities (Retallick & Martin, 2005; West & Iverson, 1999). Since the passage of the Vocational Education Act in 1963, SAE has been in decline (Dyer & Osborne, 1995). The act has been interpreted to mean that SAE is no longer required for all agriculture students. In addition, most agriculture teachers recognize the value of SAE and believe it to be beneficial to students (Barrick, Hughes, & Baker, 1991), but many fail to implement SAE in their classrooms (Dyer & Osborne, 1995). Despite a report by the National Research Council in 1988 which recommended that students participate in SAE programs, little change has occurred in student participation (Dyer & Osborne, 1995). Wilson and Moore (2006) reported similar findings regarding SAE participation over the last thirty years. Some states have experienced an overall decline in SAE participation (Steele, 1997), while others have experienced slow growth in comparison to overall agricultural education programs (Retallick & Martin, 2005). Wilson and Moore (2006) further reported that the SAE component of agricultural education remains weak. Conceptual Framework Dewey (1938) recognized a relationship between experience and education. Much of the research related to SAE is based on this theoretical framework. Dewey hypothesized that learning takes place as experiences build; each experience should lead to another experience. He believed that every experience will influence one s tendency to seek out further experience and one s interpretation of that experience. Bandura (1977) expanded upon this initial hypothesis using social learning theory. He proposed that an 4
18 individual may learn not only through direct experiences, but also through vicarious experiences. Social learning theory explains that each experience, whether direct or vicarious, will influence one s attitude and perception of that experience and other experiences. He indicated that the interaction between attitude and experience was reciprocal. In other words, one s attitude will influence the experience and the experience will influence one s attitude. However, this theory alone is not adequate to warrant study regarding agriculture teachers perceptions toward the value of SAE, the quality components of SAE, and satisfaction with SAE. In addition to the theoretical underpinnings of Dewey and Bandura, a conceptual framework was employed for this study based on a model for conducting research on SAE developed by Dyer and Osborne (1996). The model was derived from a synthesis of research regarding SAE and it provides a graphical depiction of the relationships between SAE-related variables. A variety of state implemented programs, student characteristics, teacher characteristics, university policies and curriculum standards, community characteristics, high school policies and characteristics, and FFA program characteristics influence the implementation of SAE in an agricultural education program and numerous other aspects of student SAEs. These characteristics in turn influence the initial SAE involvement level of students. A variety of other influences during students initial involvement in SAE will influence students continued involvement in SAE and eventually the outcomes of students SAE programs. Figure 1.2 is a graphical depiction of the model developed by Dyer and Osborne. 5
.")
19 Figure 1.2. Conceptual model for conducting SAE research.. This study focused on a cross-section of the model that included teacher characteristics, the implementation of SAE, and the initial SAE involvement level of students (Figure 1.3). Numerous teacher characteristics including one s philosophy and attitude toward SAE affect how SAE is implemented in an agricultural education program. The implementation procedures will ultimately determine the amount of initial involvement of students in SAE programs. 6
20 Teacher Philosophy/Attitudes toward SAE Knowledge of SAE Agricultural Experience Personal SAE Experience General Teacher Effectiveness Years of Teaching Experience Work Load Implementation SAE Design Standards/Expectations Teacher Effectiveness Supervision Teacher Encouragement Incentives Evaluation Initial SAE Involvement Level Figure 1.3. Cross-section of conceptual model for conducting SAE research. Statement of the Problem Dyer and Osborne (1995) cited a need for determining factors that contribute to varying SAE participation by state. Dyer and Osborne (1996) identified a need to define SAE program quality, and distinguish the key determinants. Retallick and Martin (2004) cited a need to identify and evaluate enrollment trends in state SAE programs for which this study may provide a foundation in Kentucky. Career and technical education in Kentucky recognizes work-based learning as a vital component to a student s education (Overview/program of studies for agriculture, 2006). The SAE component of the agricultural education model fulfills the criteria for work-based learning in Kentucky. In addition, the first provision for KRS section 11, the state law that provides extended contracts for agriculture teachers in Kentucky, is the supervision and instruction of students in agriculture experience programs (Kentucky Legislature, 2006). This idea raises the question: Do agricultural education teachers in Kentucky value SAE? If so, what practices of teachers are contributing to the condition of SAE in Kentucky? What are the perceptions of teachers regarding the quality indicators of SAE as identified by the National Council for Agricultural Education (2007)? Additionally, what is the satisfaction level of Kentucky high school agriculture teachers regarding the current status of SAE in their individual programs? Purpose of the Study The purpose of this study was to describe teachers perceptions regarding SAE and selected characteristics (gender, age, number of years teaching, department size, 7
21 number of students in the agricultural education program, level of education, and regional location) of Kentucky high school agricultural educators included in the study. A secondary purpose of this study was to describe the current status of SAE in Kentucky. Objectives The specific objectives for this study were to describe: 1. Selected characteristics (gender, age, Kentucky teacher rank certification, number of years teaching, department size, number of students in the agricultural education program, level of education, and regional location) of Kentucky high school agricultural educators in the study. 2. The current status of SAE in Kentucky (number of students participating, percent of agriculture students participating, and student participation in SAE types). 3. The perceptions of Kentucky high school agricultural educators regarding the value of SAE. 4. The perceptions of Kentucky high school agricultural educators regarding SAE quality. 5. The satisfaction of Kentucky high school agricultural educators regarding SAE in their individual programs. 6. The differences among teachers perceptions regarding SAE by selected characteristics (number of years teaching, department size, level of education, and rank certification level). Definition of Terms Terms relevant to this study were identified and defined as follows: Agricultural Education Student: a student enrolled in a high school agricultural education program. Agricultural Educator: a licensed teacher educating students in a high school agricultural education program. 8
22 Quality: Constitutive definition - degree of excellence. Operational definition - the degree to which an agricultural education program meets criteria for a quality program. Satisfaction: Constitutive definition - the quality or state of being satisfied. Operational definition - the degree to which a teacher is satisfied or content with SAE programs in his or her agricultural education program as defined by the National Council for Agricultural Education (2007). Supervised Agricultural Experience Program (SAE): the actual, planned application of concepts and principles learned in agricultural education (Barrick et al., 1992, p. 1). Value: Constitutive definition - relative worth, utility, or importance. Operational definition - relative worth, utility, or importance of SAE to the total agricultural education program and agriculture students. Limitations of the Study 1. The results are limited to agricultural educators in the state of Kentucky. 2. Time and money restrictions do not allow for a census of Kentucky agricultural educators. 3. The study will only deal with responses of secondary agricultural educators in the state of Kentucky. Basic Assumptions For the purpose of this study, the following basic assumptions were determined: 1. Teachers will provide truthful responses to the questionnaire. 2. Teachers will provide accurate data regarding the agricultural education program enrollment and SAE participation. 3. Teachers in the study are certified high school educators. 4. Teachers in the study utilize SAE in their agricultural education programs. 9
23 Significance of the Problem Findings of this study will benefit agricultural educators, agriculture teacher educators, and state agricultural education staff in Kentucky. This study will contribute to the research base regarding the value of experiential learning, specifically SAE, in agricultural education, the perceptions of quality indicators of SAE programs, as well as the current status of SAE. Findings of this study may be useful in identifying areas to improve SAE programs in states with similar SAE program conditions. Barrick et al. (1991) found that agriculture teachers value SAE as a component in agricultural education; however, in 1995, Dyer and Osborne reported that SAE is not being fully implemented in many classrooms. This finding indicates a possible disconnect between agriculture teachers philosophies and practices. The findings of this study will be valuable to teacher educators in the state of Kentucky. If the findings of this study are consistent with Dyer and Osborne (1995) and a disconnect between agriculture teachers philosophies and practices is identified, teacher educators may be instrumental in alleviating this issue by designing curriculum that includes a focus on the value of SAE and the implementation of SAE. If the findings of the study reflect that SAE in Kentucky has strong support from agriculture teachers and is in good condition, states that have weaker SAE programs may find the practices of Kentucky agriculture teachers and teacher educators helpful in revitalizing their own programs. Conversely, if the study reveals that teachers in Kentucky do not value SAE as a necessary component of an agricultural education program, reasons for this perception must be identified. State agricultural education staff may also benefit from the findings of this study. The study will provide specific information regarding SAE participation in each of the Kentucky regions as well as the perceptions of agriculture teachers regarding SAE value and quality indicators. State staff may use this information to identify focus areas for SAE improvement in specific regions in Kentucky. The satisfaction of agriculture teachers with their SAE programs is related to the quantity of students who participate in their SAE programs (White & Pals, 2004). Research also supports that teacher attitude has the strongest influence on student participation in SAE (Dyer & Osborne, 1995). These findings may indicate a cyclical pattern in which low student participation negatively influences the perceptions and 10
24 attitudes of teachers regarding SAE, which in turn negatively influences student participation. This study will add to the research base regarding the correlation between student participation and teacher attitude. 11
25 CHAPTER 2: REVIEW OF LITERATURE Purpose of the Study The purpose of this study was to describe teachers perceptions regarding SAE and selected characteristics (gender, age, number of years teaching, department size, number of students in the agricultural education program, level of education, and regional location) of Kentucky high school agricultural educators included in the study. A secondary purpose of this study was to describe the current status of SAE in Kentucky. Participation in Supervised Agricultural Experience Wilson and Moore (2006) stated that during the first 50 years of agricultural education federal law mandated that all students have a supervised experience program (p. 2). Since the passing of the Vocational Education Act in 1963, SAE participation has been in decline (Dyer & Osborne, 1995). In 1988, the National Research Council recommended that students should participate in a SAE program, but little change has occurred in SAE participation since that time. Dyer and Osborne (1995) stated that the majority of agriculture teachers claimed to support the idea of SAE, but failed to implement it in their classroom, which resulted in decreased SAE participation. They explained that teachers are perceived to be the major reason for SAE program success or failure (p. 10). However, a deficiency in research exists regarding strategies that may be implemented to improve the quality of SAE programs and student participation (White & Pals, 2004). Status of Participation SAE has been in decline since 1963 (Dyer & Osborne, 1995). The SAE component of agricultural education remains weak in comparison to the total program (Moore, Kirby, & Becton, 1997; Wilson & Moore, 2006). Despite the initiatives to revitalize SAE in recent years, there is very little difference between the number of students involved in SAE than thirty years ago (Wilson & Moore, 2006). Some states have experienced an overall decline in SAE participation (Steele, 1997). Other states are experiencing growth in SAE programs but at a slower rate than the growth of agricultural 12
26 education programs. Iowa experienced tremendous growth from 1991 to 2001 in Business Ownership and Agriscience Project SAEs, but the overall percentage of agriculture students involved in SAE has decreased (Retallick & Martin, 2005). Despite recent SAE trends, little research exists which identifies ways to increase student participation. Factors that Affect Participation Literature describes a variety of factors that influence student participation in SAE. The success of SAE depends heavily on the agricultural education teacher (Barrick et al., 1992). Dyer and Osborne (1995) stated that the most influential factor that affects student participation is the teacher s attitude toward SAE. Agriculture teachers who have written SAE policies and conduct parent-student orientations for SAE report higher SAE participation (White & Pals, 2004). Also, agricultural education programs that require all students to have a SAE and base a portion of students grades on participation report higher participation (Dyer & Osborne, 1995; White & Pals, 2004). Factors that affect a teacher s ability to supervise students SAEs, such as lack of extended contracts, lack of assistance with transportation costs, and scheduling difficulties with other school activities have a negative influence on student participation (Steele, 1997). Studies have also shown that agriculture teachers who have achieved a M.S. degree or higher report higher SAE participation than teachers who have only a B.S. (White & Pals, 2004). Studies found a positive correlation between SAE and FFA participation (White & Pals, 2004). Retallick and Martin (2004) also stated that in Iowa, SAE and FFA participation are highly correlated. However, no studies have demonstrated a cause-effect relationship where FFA participation influences SAE participation or vice versa. Other variables that influence SAE participation include demographic variables. SAE participation is higher in rural areas with white males (Dyer & Osborne, 1995). Retallick and Martin (2004) explained that class sizes in Iowa have increased, but fewer students participate in SAE and FFA. They hypothesized that the problem may be because these two programs have not been modified to meet the new needs of today s diverse students (p. 183). 13
27 Value of Supervised Agricultural Experience Many studies have been completed that disclose numerous benefits of SAE. Barrick et al. (1992) listed a multitude of benefits for all partners involved in SAE, including students, teachers, employers, the community, the local agricultural education program, and the agricultural industry as a whole. The Work Based Learning Guide (2006) stated that three-fourths of secondary high school graduates in Kentucky begin without a baccalaureate degree and many lack the skills and experiences necessary for success in a career. Students who participate in SAE develop these skills and gain valuable experience. The pillars of experiential learning manifested in agricultural education through SAE fall directly in line with the psychological principles that bring about significant and meaningful learning experiences for students (Knobloch, 2003, p. 31). Knobloch s notions are further supported by Barrick et al. (1992), who stated that SAEs provide effective and meaningful ways of developing competencies in agriculture (p. 2). Students receive realworld experience through SAE that may ease the transition from school to career (Barrick et al., 1992; National FFA Organization, 2006a, 2006b). Camp et al. (2000) provided further support for this claim stating that SAE enhances classroom learning by providing real-life experience for students (p. 16). Dyer and Williams (1997) also stated that SAEs help students prepare for jobs and careers related to agriculture. Literature purports that SAE provides students with motivation to learn more both in and out of the classroom (Barrick et al., 1992; Camp et al., 2000; National FFA Organization, 2006a, 2006b). Research has identified a moderate correlation between SAE and student achievement in agricultural education (Cheek, Arrington, Carter, & Randell, 1994); however, no experimental studies have been conducted that demonstrate a cause-effect relationship between SAE and student achievement (Dyer & Osborne, 1995). Cheek et al. (1994) raised the question: does SAE participation improve student achievement or do high achievers tend to participate more in SAE? Other benefits for students participating in SAE include a positive influence on work attitudes and behaviors and a general increase in knowledge of agriculture (Dyer & Williams, 1997a). Deficiencies in research related to benefits of participation in SAE for students include 14
28 the influence of SAE participation on improving communication skills and problemsolving skills (Dyer & Williams, 1997a). SAE also benefits the local agricultural education program. SAE improves school and community relations by creating links between the agricultural education program and supporters from business, industry, and the community (National FFA Organization, 2006a, 2006b). Barrick et al. (1992) stated that SAE provides basis for year-round instruction (p. 8). Research concerning SAE quality provides further support for this assertion. Agricultural education programs with summer employment contracts have higher quality SAEs than those programs without extended employment (Dyer & Osborne, 1996; Dyer & Williams, 1997b). The Kentucky Legislature (2006) requires that agriculture teachers supervise students SAEs as part of the rationale for providing extended summer contracts through KRS section 11. SAE also provides programs with a source of income to help further establish SAE and finance educational experiences for students beyond high school (Retallick & Martin, 2005). Barrick et al. (1992) listed four SAE benefits for communities: 1. Provides the community with a competent and educated labor force 2. Develops wage-earning capabilities in youth 3. Provides the community with a citizenry that is better informed on agricultural-related issues 4. Provides leadership to carry out community activities (p. 8) Quality SAE programs have been shown to have significant economic impact on communities and industry. Retallick and Martin (2005) reported that school districts receive a positive return on their investment in the local agricultural education program. They stated that students earn more money through SAE programs than school districts invest in salaries and travel for agricultural education programs (p. 52). The authors continued, If an economic value were placed on the intangible benefits [of SAE], the return would be even higher (p. 52). These findings are supported by previous research by West and Iverson (1999) who found that the economic value of SAE programs in Georgia totaled over $12 million per year, as well as Graham and Birkenholz (1999), who reported that SAE programs in Missouri totaled over $31 million in
29 Perceptions of the value of SAE are generally positive. Barrick et al. (1991) reported that school administrators, teachers, and employers all had very positive feelings toward supervised experiences. They continued that parents and students also have positive feelings toward these experiences, but they tend to value SAEs less than teachers, employers, and school administrators. The perceived value of SAE differs among the various partners involved. High school agriculture teachers agree that SAE is a valuable and important component of agricultural education (Wilson & Moore, 2006). Additionally, many agriculture teachers believe that SAE should be required of every FFA member in an agricultural education program. Whaley and Lucero (1993) recommended that SAE program participation be mandatory for all students enrolled in agricultural education, but overall the profession is split on whether a SAE should be required of all agriculture students (White & Pals, 2004). These reports indicate that some teachers do not believe SAE is valuable. Though teachers value SAE, classroom instruction and FFA have first priority (Wilson & Moore, 2006). In 1997, Steele reported that agriculture teachers in New York were not unified in the belief that a quality agricultural education program must have all three components of a quality program listed in the FFA Student Handbook. Because SAE has least priority for most agriculture teachers, it may be overlooked in some programs. Steele also cited a lack of free time in the teacher s schedule for SAE as a factor contributing to the decline of SAE in New York. Camp et al. (2000) found that the most significant problem facing SAE was that many teachers do not feel that it is appropriate for their student population and therefore do not promote it. As agricultural education continues to move to a more science-based curriculum, some teacher educators fear that new agriculture teachers may not fully understand and value Supervised Agricultural Experiences (SAE) and FFA enough to promote them and integrate them into their education programs (Shelley-Tolbert et al., 2000, p. 57). Significant changes in SAE have occurred in order to account for the move to science-based agricultural curriculum, but in order to ensure that SAE remains relevant a variety of project options must be available to students (Whaley & Lucero, 1993). 16
30 Research indicates that agriculture teachers in a multi-teacher program tend to have more positive perceptions toward supervising students SAEs than teachers in a single teacher department (Swortzel, 1996). This difference may be due to the ability of teachers in multi-teacher departments to distribute SAE responsibilities among the other teachers in the department. Swortzel also found that agriculture teachers in Tennessee who were not involved in an agricultural education program as high school students had more positive perceptions toward the supervision of SAEs than teachers who were involved in agricultural education in high school. Swortzel was unsure of the difference in these two types of teachers, but one may speculate that the teachers in this study who had SAEs in high school may have had poor experiences with their advisors. Agriculture teachers who did not have SAEs in high school may see more value in SAEs than teachers who had SAEs. Dyer and Osborne (1995) suggested that educators shift their focus away from the record keeping aspect of SAE and recognize their SAE programs as a valuable experiential learning tool. Whaley and Lucero (1993) supported this suggestion, stating that SAE success should be measured by the activities within each individual project instead of the tangible products of the projects. Shelley-Tolbert et al. (2000) concluded that the unique experiential learning and leadership components of agricultural education are viewed as being valuable enough to retain, regardless of any program focus (p. 59). Research supports a more holistic view of SAE that recognizes student progress and growth rather than the end product. Supervised Agricultural Experience Quality Dyer and Osborne (1996) listed a variety of factors that are positively related to SAE quality and size. These factors include: length of teacher contract, support from parents, teacher assistance with SAE, number of years of high school agriculture completed by the agriculture teacher, number of years that students have participated in the agricultural education program, and teacher priority of SAE. As the number of supervised visits increases, SAE quality increases, which demonstrates the need for extended teacher contracts (Dyer & Williams, 1997b). White and Pals (2004) concluded that the most important factors that influence SAE quality are parent support, interest to 17
31 the students, flexibility, and complete records (p. 113). Findings indicated that students with quality SAEs have parent and teacher support as well as high interest and extended experience in agriculture. The Agriculture Teacher s Manual (National FFA Organization, 2006a) listed five factors which define SAE quality. According to the manual, quality SAEs are: teacher supervised, documented, curriculum based, student managed, and planned and comprehensive. The manual also noted that students should receive recognition for SAEs. The factors named by the National FFA Organization reflect previous research and serve to provide a consistent framework by which to measure SAE quality in agricultural education programs. The National FFA Organization (2006b) identified three levels of quality for each of the five factors. Agriculture teachers may rate students SAEs as initial, commendable, or superior according to each factor. The National Council for Agricultural Education (2007) included experiential learning as a quality program standard for secondary agricultural education. The Council identified seven quality indicators for SAE in agricultural education programs: 1. All students have experiential learning (SAE) programs based on career pathways/clusters/interests and agricultural curriculum standards. 2. Experiential learning (SAE) programs are planned, developed and managed by the student with instruction and support by the agriculture teacher, parents and/or employer. 3. The agriculture teacher maintains accurate records of all experiential learning (SAE) supervision. 4. Continuous instruction and supervision of student experiential learning (SAE) programs are provided by the agriculture teachers throughout the calendar year. 5. Each agriculture student maintains up-to-date and accurate experiential learning (SAE) records. 6. An annual summary of students experiential learning (SAE) programs is completed and submitted to appropriate entities. 7. Students have comprehensive experiential learning (SAE) programs that show evidence of growth in size and/or scope. (p. 29) 18
32 SAE programs may be rated and ranked on each quality indicator as exemplary (4), promising (3), improving (2), struggling (1), or non-existent (0). The scores from each quality indicator may be added to determine the quality of a SAE program. Jenkins and Kitchel (2008) utilized the Delphi technique to determine the quality components of high school agricultural education programs according to experts in the field. Forty statements related to SAE quality were either rejected or did not reach consensus, while only six quality indicators were agreed on in the study. The accepted components were related to supervision of SAEs and SAE diversity. The authors concluded that there is disagreement within the profession regarding the quality indicators of SAEs and reasons for this disagreement should be identified and addressed. Teacher Satisfaction with Supervised Agricultural Experience Literature regarding agricultural education teacher satisfaction focuses primarily on overall job satisfaction. Little research exists which analyzes agriculture teachers satisfaction with their SAE programs specifically. Barrick et al. (1991) conducted a synthesis of research on supervised experience programs. The authors identified three studies before 1991 which focused on the satisfaction of agriculture teachers with the SAE component of their programs. Barrick et al. stated that there was a decline in agriculture teachers job satisfaction with SAEs from 1950 to Dyer and Osborne (1995) cited Barrick et al., stating that teachers may be growing dissatisfied with conducting SAE programs (p. 8). More recently, White and Pals (2004) identified a possible correlation between agriculture teacher satisfaction with SAE and student participation with SAE. Teachers included in their study were generally unsatisfied with SAE participation when participation levels were low and vice versa. Other studies include teacher satisfaction with SAE as an indicator of overall agriculture teacher job satisfaction (Walker, Garton, & Kitchel, 2004). Summary of Review of Literature Agriculture production projects were required by law of all agriculture students until the passage of the Vocational Education Act in 1963 (Dyer & Osborne, 1995). Since 19
33 that time, SAE has declined (Dyer & Osborne, 1995) despite initiatives to promote and strengthen the component of agricultural education (Wilson & Moore, 2006). Though agricultural educators recognize the benefits of SAE and value it as a component of agricultural education, many have difficulty implementing SAE in their programs (Dyer & Osborne, 1995). Kentucky requires a work-based learning component of all career and technical education programs (CTE, 2001) which may be fulfilled through SAE in agricultural education (Overview, 2006). Quality SAEs have been shown to benefit communities and schools economically (Retallick & Martin, 2005; West & Iverson, 1999) and students (Dyer & Williams, 1997). Findings in this study will help agricultural educators and teacher educators in Kentucky improve the condition of SAE. 20
34 CHAPTER 3: METHODOLOGY Purpose of the Study The purpose of this study was to describe teachers perceptions regarding SAE and selected characteristics (gender, age, number of years teaching, department size, number of students in the agricultural education program, level of education, and regional location) of Kentucky high school agricultural educators included in the study. A secondary purpose of this study was to describe the current status of SAE in Kentucky. Objectives The specific objectives for this study were to describe: 1. Selected characteristics (gender, age, Kentucky teacher rank certification, number of years teaching, department size, number of students, collegiate training, and regional location) of Kentucky high school agricultural educators in the study. 2. The current status of SAE in Kentucky (number of students participating, percent of agriculture students participating, and student participation in SAE types). 3. The perceptions of Kentucky high school agricultural educators regarding the value of SAE. 4. The perceptions of Kentucky high school agricultural educators regarding SAE quality. 5. The satisfaction of Kentucky high school agricultural educators regarding SAE in their individual programs. 6. The differences among teachers perceptions regarding SAE by selected characteristics (number of years teaching, department size, level of education, and rank certification level). Research Design The design of this study was descriptive. Descriptive research seeks only to describe data and does not identify any correlations among data. The study used a cross- 21
35 sectional survey to collect data regarding the population of agriculture teachers in Kentucky. A cross-sectional survey is a survey that is taken at a single point in time (Ary, Jacobs, & Razavieh, 2002). Populations and Sample Population The target population of this study was all Kentucky secondary high school agricultural educators (N = 245). The accessible population was also all Kentucky secondary high school agricultural educators. Sample This study used a random sample (n = 152) of the population (N = 245) to ensure that the sample would be representative of the population. The findings of this study may be generalized to the entire state as well as specific regions of the state which will make the study more useful to individual programs, as well as state agricultural education staff who may design general and region specific strategies to bolster SAE in Kentucky. Frame Error Frame error results from a difference between the target population and the population from which the sample is drawn (McCracken, 1998). Frame error was minimized by using the most current, up-to-date list of agriculture teachers in Kentucky from state agricultural education staff. Sampling Error Ary et al. (2002) stated that sampling error is an inverse function of sample size (p. 172). The sample size of this study (n = 152) was recommended by Krejcie and Morgan (1960). Sampling error was also minimized by using a random sampling technique so that the findings of the study may be generalized to the population. 22
36 Selection Error Selection error occurs when some sampling units have a greater chance of being included in the sample than other units (McCracken, 1998). The frame was purged of duplicates before creating the sample in order to allow each member of the population an equal and independent chance of inclusion in the sample. Instrumentation The instrument used in this study was a questionnaire designed by the researcher to fulfill the purpose and objectives of the study. The questionnaire measured the current status of SAE in Kentucky, perceptions of agriculture teachers regarding the value of SAE, perceptions of agriculture teachers regarding the definition of SAE quality, and the satisfaction of agriculture teachers with their SAE programs. The researcher drew from questionnaires used in previous studies (Steele, 1997; White & Pals, 2004; Wilson & Moore, 2006) to improve both validity and reliability. The questionnaire was composed of five sections which used a combination of 6-point Likert-type questions and other close-ended questions. The Likert-type questions were scaled to 6 points in order to increase reliability. Both an electronic form (Appendix A) and a hard copy version (Appendix B) of the questionnaire were produced. The first section consisted of forty-three 6-point Likert-type questions designed to satisfy objective three. Participants were asked to respond by clicking or circling the number that best described their opinions regarding each statement on a scale from 1 to 6 where 1 = Strongly Disagree and 6 = Strongly Agree. The questions determined the degree to which agriculture teachers believe SAEs are a valuable component of agricultural education and should be required of students. Questions in the section addressed the relative worth, utility, and importance of SAE in each program. For example, the statements Quality SAEs provide real-life experiences for students and The local agricultural education program benefits from offering SAE address the worth and utility of SAE to both students and the total agricultural education program. In addition, the statement I require every FFA member to have a SAE demonstrates how much agriculture teachers stress SAE as an important component of agricultural education. 23
37 The second section dealt with SAE quality and corresponded with objective four. The section consisted of twenty two 6-point Likert-type questions which determined the degree to which agriculture teachers agree with the SAE quality indicators outlined by the National Council for Agricultural Education (2007) and the degree to which they use quality SAE practices. Participants were asked to respond by clicking or circling the number that best described their opinions regarding each statement on a scale from 1 to 6 where 1 = Strongly Disagree and 6 = Strongly Agree. SAE program should be based on the career pathways of students is an example quality statement from section two. Section 3 consisted of ten 6-point Likert-type questions that corresponded to the satisfaction of agriculture teachers with SAE in their agricultural education programs and objective five. Participants were asked to respond by clicking or circling the number that best described their opinions regarding each statement on a scale from 1 to 6 where 1 = Strongly Disagree and 6 = Strongly Agree. An example statement from section 3 is I am satisfied with the number of students in my program enrolled in SAE. The fourth section consisted of three questions. The questions determined the number of students in each agricultural education program, the number of students who participate in SAE within each program, and the number of students participating in each SAE category as described in the Local Program Success Guide (National FFA Organization, 2006b) which corresponded to objective two. Because students may have multiple SAEs that fall in two or more categories, participants were asked to only count a student once for his/her primary SAE. The final section determined general agriculture teacher characteristics in order to satisfy objective 1. Questions were designed to identify gender, age, level of education, and number of years teaching, as well as the department size and regional location of the agricultural education program of each agriculture teacher. Participants were also asked to identify their current teacher rank certification, the number of extended days they receive on their contract, and whether or not they had a block designated for SAE supervision. 24
38 Validity Procedures Validity is defined as the ability of an instrument to measure the items it is purported to measure (Ary et al., 2002). The two types of validity addressed by the researcher were face and content validity. Face validity is the extent to which an instrument appears to measure what it claims to measure and content validity is the extent to which the questions in an instrument relate to and fulfill the purpose and objectives of the study. In order to address validity, an expert panel (n = 8) of individuals involved in agricultural education was used. The panel consisted of three university faculty members in agricultural education, two members of state agricultural education staff, one high school agricultural educator outside the state of Kentucky, and two staff members of the National Association of Agricultural Educators. The panel assessed both face and content validity. Reliability Procedures Reliability is the extent to which the measurements of an instrument are consistent (Ary et al., 2002). To assess reliability, Cronbach s alpha coefficient was calculated based on a field study of 35 Tennessee agriculture teachers not included in the study sample. Cronbach s alpha coefficient is a reliability coefficient used to determine whether a series of questions measures the same construct and is often used when items have no right or wrong answer (Ary et al. 2002), such as the Likert attitude scales employed in this study. Field testing is used to identify ambiguities, misunderstandings, or other inadequacies (Ary et al., 2002, p. 402) in the instrument. The field study was conducted in early fall The same data collection procedures were used as the actual study. An updated list of Tennessee agriculture teachers was retrieved from university staff in Tennessee and used as the frame for the pilot study. A random sample of 35 teachers was drawn from the frame using the Research Randomizer (2007). The questionnaire was mailed out in a six-step process as outlined by Dillman (2000). A postcard was mailed to the sample on August 30, 2007 informing them of their selection for participation in the study. The first mailing of the questionnaire was sent via on September 13, The included a letter explaining the importance of the study and thanked them for their participation. A link to 25
39 the online questionnaire was included in the letter, as well as a questionnaire identification number which the participants were asked to input when filling out the questionnaire. On September 20, 2007, a reminder was sent to non-respondents to remind them of the study. A second questionnaire was sent to non-respondents via on September 28, Participants were again reminded of the importance of the study and given a link to the questionnaire and their questionnaire identification number. On October 8, 2007, a final reminder was sent to additional non-respondents. In order to obtain the greatest response possible, a paper version of the questionnaire was sent to non-respondents on October 17, A pre-addressed stamped envelope was included for the participants to return the questionnaire to the researcher. A final reminder letter was sent to non-respondents on October 31, 2007 stressing the importance of the participants responses and thanking them for their participation in the study. The pilot study resulted in 22 responses giving a response rate of approximately 62.9%. Data for the pilot study were analyzed using SPSS/PC Plus Appropriate questionnaire items were reverse coded before performing reliability tests. Cronbach s alpha coefficients were calculated for the value, quality, and satisfaction sections of the questionnaire. For the value section consisting of forty three, a reliability coefficient of 0.95 was determined. For the quality section consisting of twenty two questions, a reliability coefficient of 0.85 was calculated. For the satisfaction section consisting of twenty one questions, a reliability coefficient of 0.75 was established. Eleven items in the satisfaction section were identified as either ambiguous or unrelated to the construct and were removed from the final version of the questionnaire. The reliability coefficient was recalculated for the satisfaction section consisting of ten questions to be Data Collection Data were collected using an internet and mailed questionnaire. One of the most important limitations of the mailed questionnaire is a low rate of return (Ary et al., 2002). Low return rate represents a source of data collection error. To assure the highest return rate possible, the questionnaire was mailed out in a six-step process using a modified version of the process outlined by Dillman (2000). A postcard (Appendix C) was mailed 26
40 on November 6, 2007 to individuals included in the sample to inform them of their selection for participation in the study and the importance of the study to the profession. The first mailing of the questionnaire was sent on November 19, 2007 via . An (Appendix D) was sent to participants in the study describing the purpose and importance of the study and thanking them for their responses. The link for the online questionnaire was included in the with an identification number which participants were asked to provide when completing the questionnaire. Participants were also informed of a drawing for one of two $30 FFA Unlimited Gift Certificates as an incentive for completing the questionnaire. Dillman (2000) stated that including an incentive as a gesture of goodwill may produce a sense of reciprocal obligation (p. 153). On November 28, 2007, a reminder (Appendix E) was sent to non-respondents to remind the participants of the study and thank them for their responses. A second mailing of the questionnaire was sent on December 5, 2007 via that included a cover letter (Appendix F) to remind the non-respondents of the importance of the study and thank them again for their responses. Participants were reminded of their identification number and provided the link to the questionnaire. A second reminder (Appendix G) was sent via on December 17, 2007 to remind nonrespondents of the importance of the study and the incentive for their participation. A final mailing of the questionnaire was sent via postal mail on January 2, 2008 that included a cover letter (Appendix H), the questionnaire, and an addressed, stamped envelope in which to return the questionnaire. The cover letter outlined the purpose of the study and the importance of their response to agricultural education in Kentucky and reminded them of the incentive drawing for one of two $30 FFA Unlimited Gift Certificates. A final letter (Appendix I) was sent to non-respondents on January 10, 2008 to remind them of the study and stress the importance of their response. Individuals who did not respond by January 28, 2008 were considered non-respondents and a source of error in the study. On January 28, 2008, two individuals were randomly drawn from the pool of respondents to receive one $30 FFA Unlimited Gift Certificate each. According to Miller and Smith (1983) research has shown that late respondents are often similar to nonrespondents (p. 48). To reduce non-response error, the responses of early and late respondents were compared using an independent samples t-test 27
41 According to Ary et al. (2002), the independent samples t-test may be used to determine if a significant difference exists between two sample means. For this study, early respondents were defined as the individuals who responded before the second mailing of the questionnaire was sent to the sample. The individuals who responded any time after the second questionnaire were considered late respondents. According to these definitions, respondents were grouped into early and late respondents and compared. A significant level was a priori at.05. Table 3.1 summarizes the data. Data revealed no significant differences between early and late respondents. Table 3.1 Comparison of Early to Late Respondents for SAE Constructs Early Respondents Late Respondents Construct M SD M SD p Value Quality Satisfaction Data Analysis Data were analyzed using SPSS/PC Negatively phrased items were reverse coded. Frequencies and percentages, as well as measures of central tendency, including means, medians, and modes, and measures of variance, including variance and standard deviation, were reported. Objective 1 sought to identify the demographic characteristics of Kentucky agricultural education teachers. Teachers were asked to report their age, gender, number of years teaching, agriculture department size, level of education, number of extended days, whether or not teachers had a block designated for SAE supervision, and regional location. Age, number of years teaching, and number of extended days were collected as interval data. Interval data are data which can be placed in rank order and have equal intervals between measurement units (Ary et al., 2002). These data were analyzed and 28
42 reported in terms of means and standard deviations. Data for gender, agriculture department size, level of education, whether or not teachers had a designated block for SAE supervision and regional location were nominal data. Nominal data are data which may be categorized but do not imply rank order. Additionally, interval data were transformed into ordinal categories for analysis with the nominal data. These data were analyzed and reported in terms of frequencies and percentages. Objective 2 sought to determine the participation levels of students in Kentucky agricultural education programs and in SAE categories. Teachers were asked to report student participation levels numerically which resulted in interval data. These data were analyzed and reported in terms of means and standard deviations. Due to the high variance in participation levels, ranges and skewness scores were reported. Skewed data result in value distributions that are not symmetrical which may indicate the presence of extreme scores (Ary et al., 2002). Histograms were also reported for objective 2 to show the distribution of each participation category. Objective 3 sought to determine the perceived value of SAE as reported by Kentucky agriculture teachers while objective 4 purposed to determine the key components of SAE quality. Additionally, objective 5 sought to determine the level of satisfaction among Kentucky agricultural education teachers. These objectives employed a 6-point Likert scale (1 = Strongly Disagree to 6 = Strongly Agree) resulting in interval data. Data were reported in terms of means and standard deviations. In addition, an overall mean score was calculated for the value, quality, and satisfaction constructs. The purpose of objective 6 was to determine if any differences existed between the demographic data and the value, quality, and satisfaction constructs. When responses were grouped according to the degree earned by the teacher, the cells did not achieve at least a 1:3 ratio. Therefore, data for degree earned were regrouped into a dichotomous variable; namely, the data were grouped into agriculture teachers who have a bachelor s degree and agriculture teachers who have a master s degree or higher. A t-test was computed to identify differences between the SAE constructs by the degree earned by the teacher. T-tests are often used to compare data from two groups (Ary et al., 2002). The use of t-tests implies multiple assumptions (Shavelson, 1996). Levene s test of equality of variance was used to address the assumption of homogeneity of variance (Appendix J). 29
43 Results for Levene s test of equality of variance showed that the assumption that variance is equal among the satisfaction construct by gender of the teacher is not valid, so equal variance was not assumed for the satisfaction construct in this t-test. A significance level was set a priori at.05. Means, standard deviations, and p-values for each group were reported. The remaining demographic data (number of years teaching, certification rank, and agriculture department size) had multiple response possibilities so an analysis of variance (ANOVA) was performed to identify differences between the SAE constructs. In order to achieve at least a 1:3 ratio within the data cells, data for number of years teaching and department size were regrouped. Data for number of years teaching were regrouped into four categories (1-5 years, 6-10 years, years, and 21 or more years). Data for department size were regrouped into three categories (1 teacher department, 2 teacher department, and 3 or more teacher department. Unlike t-tests, ANOVA can test the difference between two or more means (Ary et al., 2002, p. 193). The use of ANOVA implies several assumptions (Shavelson, 1996). To address the assumption regarding homogeneity of variance, Levene s test of equality of variance was used (Appendix K). For the assumption of normality of distribution, box plots were examined to identify outliers. An ANOVA was not performed for the SAE constructs by agriculture teacher age because age and number of years teaching are highly correlated among agriculture teachers. Additionally, an ANOVA was not performed for the SAE constructs by the number extended days teachers have due to a lack of variance among the categories. F-values and p-values were reported for each construct by each demographic characteristic. Additionally, hypotheses were formed in order to assess differences that may result from the ANOVA. Hypotheses Dewey (1938) postulated a connection between learning and experience. He believed that one experience will modify an individual s interpretation of both past and future experiences. Bandura (1977) used social learning theory to expand Dewey s initial hypothesis to include not only direct experience, but also vicarious experiences. He explained that a person s psychological functioning, which may include perceptions and 30
44 attitudes toward a specific experience, is a result of a continuous reciprocal interaction of personal and environmental determinants (p ). In the context of agricultural education, advisors experiences range from supervising SAEs to teaching classroom content. Considering this theory, one may reasonably hypothesize that as a teacher experiences the everyday demands of an agricultural education advisor, his or her perceptions toward the value and quality components of SAEs and overall satisfaction with SAE may be altered. Drawing on the insights of Dyer and Osborne (1996), the conceptual framework for this study (see Figure 2) identifies a variety of teacher characteristics which influence the implementation of SAEs in their programs, including knowledge of SAE, teacher experience, and their own attitudes toward SAE. In the context of social learning theory, the interaction of these characteristics may influence the perceptions of teachers regarding the value of SAE, the quality components of SAE, and teacher satisfaction with SAE. The following hypotheses were developed to assess differences that may exist among the SAE constructs (value, quality, and satisfaction) by selected characteristics of teachers. H 1 : There are statistically significant differences in the SAE constructs (value, quality, and satisfaction) by the degree earned by the agriculture teacher. The degree earned by the agriculture teacher is a representation of his or her educational level. A master s degree will signify a different range of experiences from a bachelor s degree. Teachers are exposed to different perspectives and learning theories that relate to all components of agricultural education programs through college courses. The added knowledge from graduate classes may influence how teachers perceive their SAE programs. Teachers perceptions regarding the value of SAE and the quality components of SAE may be more positive as a result of graduate education which stresses SAE as an important component of agricultural education. A higher education level also indicates that the individual may have had more opportunities for interaction with professors and other teachers. These interactions may allow teachers to experience other teacher s programs. These vicarious experiences may cause teachers to identify deficiencies in their own SAE programs or strengths of their 31
45 programs which may influence their level of satisfaction with their students SAE programs. H 2 : There are statistically significant differences in the SAE constructs (value, quality, and satisfaction) by the number of years a teacher has taught. The conceptual framework used in this study includes years of teaching experience as a characteristic of the teacher which will eventually influence the implementation of SAE and a variety of other SAE program characteristics. Based on the theories of Dewey (1938) and Bandura (1977), the teacher s experience in the profession will have an effect on his or her attitude toward different aspects of the profession, including SAE. More experienced teachers have worked with SAEs for longer periods of time and have more refined opinions about the value of SAEs, the quality components of SAEs, and their satisfaction with SAEs. More experienced teachers also have had more chances to interact with other teachers. Teachers may incorporate the ideas and experiences of other teachers to develop their perceptions regarding the SAE constructs (value, quality, and satisfaction). H 3 : There are statistically significant differences in the SAE constructs (value, quality, and satisfaction) by teacher certification rank. Teacher certification rank is an indicator of an agriculture teacher s educational level. A Rank I Certification signifies a different range of experiences than a Rank III Certification. Though similar, teacher certification rank and degree earned are distinct demographic variables. Specifically, a teacher who has a master s degree will have at least Rank II Certification but not necessarily Rank I Certification. Rank I Certification indicates that a teacher has received at least 30 hours of graduate level credit beyond a master s degree. A higher education level may influence a teacher s perceptions regarding the value of SAE, the quality components of SAE, and the satisfaction of teachers with their SAE programs because agriculture teachers will have higher levels of interactions with other agriculture teachers and professors. 32
46 H 4 : There are statistically significant differences in the SAE constructs (value, quality, and satisfaction) by the agriculture program department size. Dewey (1938) believed that each experience an individual has will influence how he or she perceives future experiences. Teachers in multi-teacher departments have a different experience as advisors than those in single teacher departments. As the number of teachers in the agriculture program increases so does the ability of teachers to distribute responsibilities among one another, which includes SAE supervision. Teachers in multi-teacher programs may have less difficulty with time management and therefore value SAE more and be more satisfied with their respective programs. According to social learning theory, individuals can learn through interaction with others, both by observation and through the use of verbal symbols (Bandura, 1977). Moreover, social learning theory Agriculture teachers in multi-teacher departments have multiple chances to interact with one another. Agriculture teachers in these departments may receive support from each other, exchange and discuss ideas with each other, and receive constructive criticism from each other. These kinds of experiences are available to teachers in single teacher departments only through teachers in other disciplines. Though some of these teachers may have responsibilities similar to the agriculture teacher, the experience will be different. The camaraderie available to teachers in multiteacher departments is not as accessible to teachers in single teacher programs. 33
47 CHAPTER 4: RESULTS AND FINDINGS Purpose of the Study The purpose of this study was to describe teachers perceptions regarding SAE and selected characteristics (gender, age, number of years teaching, department size, number of students in the agricultural education program, level of education, and regional location) of Kentucky high school agricultural educators included in the study. A secondary purpose of this study was to describe the current status of SAE in Kentucky. Objectives The specific objectives for this study were to describe: 1. Selected characteristics (gender, age, Kentucky teacher rank certification, number of years teaching, department size, number of students in the agricultural education program, level of education, and regional location) of Kentucky high school agricultural educators in the study. 2. The current status of SAE in Kentucky (number of students participating, percent of agriculture students participating, and student participation in SAE types). 3. The perceptions of Kentucky high school agricultural educators regarding the value of SAE. 4. The perceptions of Kentucky high school agricultural educators regarding SAE quality. 5. The satisfaction of Kentucky high school agricultural educators regarding SAE in their individual programs. 6. The differences among teachers perceptions regarding SAE by selected characteristics (number of years teaching, department size, level of education, and rank certification level). Objective 1 Objective 1 sought to determine the selected demographic characteristics (gender, age, Kentucky teacher rank certification, number of years teaching, department size, 34
48 number of students in the agricultural education program, level of education, and regional location) of Kentucky high school agriculture teachers included in the study. Data collected for age, number of years teaching, and number of extended days resulted in interval data and were reported using means and standard deviations. This data is presented in Table 4.1. Additionally, interval data collected for age, number of years teaching, and number of extended days were also categorized into ordinal data. Nominal and ordinal data for this objective are summarized using frequencies and percentages in Table 4.2. Table 4.1 Interval Demographic Characteristics of Kentucky Agriculture Teachers (n = 109) Variable M SD Age (n = 105) Years Teaching (n = 105) Extended Days (n = 106) Table 4.2 Nominal and Ordinal Demographic Characteristics of Kentucky Agriculture Teachers (n = 109) Variable f % Gender (n= 108) Male Female Kentucky Teacher Rank Certification (n = 104) Rank I Rank II Rank III SAE Supervision Period (n = 105) Yes No
49 Table 4.2 (continued) Nominal and Ordinal Demographic Characteristics of Kentucky Agriculture Teachers (n = 109) Variable F % Age (n = 105) years years years years years years years years years and over Years Teaching (n = 105) and over Department Size (n = 106) 1 Teacher Teachers Teachers Teachers # of Extended Days (n = 106)
50 Table 4.2 (continued) Nominal and Ordinal Demographic Characteristics of Kentucky Agriculture Teachers (n = 109) Variable F % Education (n = 100) Bachelor s Degree Master s Degree Doctorate Degree Other Degree Region (n = 109) Barren River Big Sandy River Bluegrass Green River Kentucky River Lake Cumberland Licking River Lincoln Trail Northern Kentucky Pennyrile Purchase Of the respondents, 81 (75.00%) teachers were male while only 27 (25.00%) were female. In terms of age, 8 (7.60%) teachers were between the age of 20 and 24. The most frequent age for responding agriculture teachers was years and years with 24 (22.90%) teachers each. Additionally, 8 (7.60%) teachers were years of age, 12 (11.40%) were between the ages of years, 5 (4.80%) were years of age, 20 (19.00%) were years of age, 4 (3.80%) were between the ages of years, and 0 (0.00%) were 60 or more years of age. The mean age for agriculture teachers in this study was 37.1 years (SD = 10.46) ranging from 22 years to 59 years. 37
51 In terms of teaching experience, 29 (27.60%) respondents taught 1-5 years, 27 (25.70%) agriculture teachers had taught 6-10 years, 16 (15.20%) teachers had taught years, 8 (7.60%) teachers had taught years, 6 (5.70%) respondents had taught years, 13 (12.40%) teachers had taught years, and 6 (5.70%) had taught 31 years of more. On average, agriculture teachers in Kentucky had taught for 13.0 years (SD = 9.98). In terms of Kentucky teaching rank certification, 51 (49.00%) agriculture teachers had achieved Rank I Certification level, 39 (36.50%) teachers had Rank II Certification level, and 15 (14.40%) had achieved Rank III Certification level. Additionally, 24 (24.00%) agriculture teachers had only a Bachelor s degree, 70 (70.00% teachers had a Master s degree, 0 (0.00%) had doctorate degree, and 6 (6.00%) were categorized as having an other degree. The teachers categorized as other identified themselves in 4 other categories. Two (1.80%) teachers were categorized as 2 masters, two (1.80%) teachers received national board certification from the National Board for Professional Teaching Standards (NBPTS), and 1 (0.90%) teacher had a degree in secondary administration. In terms of department size, 24 (22.60%) teachers worked in a 1 teacher agricultural education department, 59 (55.70%) teachers worked in a 2 teacher department, 20 (18.90%) teachers worked in a 3 teacher department, and 3 (2.80%) teachers worked in a department of 4 teachers or more. Regarding the number of extended days, 3 (2.80%) agriculture teachers had 0-20 extended days, 1 (0.90%) teacher had extended days, and 102 (96.20%) teachers had 40 or more extended days. The mean score for extended days was 52.5 (SD = 8.62). In addition, 5 (4.80%) agriculture teachers identified that they had a block specifically designated for SAE supervision, while 100 (95.20%) teachers did not have a SAE supervision block. Regional location for respondents varied. Fourteen (12.80%) agricultural education teachers were in the Barren River region, 6 (5.50%) were in the Big Sandy River region, 19 (17.40%) were in the Bluegrass Region, 5 (4.60%) were in the Green River region, 7 (6.40%) were in the Kentucky River region, 11 (10.10%) were in the Lake Cumberland region, 7 (6.40%) were in the Licking River region, 11 (10.10%) were in the Lincoln Trail region, 15 (13.80%) were in the Northern Kentucky region, 10 (9.20%) were in the Pennyrile region, and 4 (3.70%) were in the Purchase region. 38
52 Objective 2 Objective 2 sought to describe the current status of SAE in Kentucky in terms of total participation by students in SAE, the percentage of agriculture students participating in SAE, and the number of students participating in each of the five major SAE types. These findings are interval data and are presented in Table 4.3 using measures of central tendency, specifically: range, mean, standard deviation, and skewness. Table 4.3 Student Participation in SAE as Reported by Kentucky Agriculture Teachers (n = 109) Area of Participation Min. Max. M SD Skew Agricultural Education Program (n = 98) Students with SAEs (n = 100) Exploratory (n = 91) Research/Experimentation (n = 88) Ownership/Entrepreneurship (n = 95) Placement (n = 95) Service Learning (n = 92) The size of agricultural education programs in Kentucky ranged from 7 to 800 students. The mean size for agriculture programs was approximately 198 (SD = ) students. Of the students in agriculture programs, on average 126 (60%, SD = ) students in the program had a SAE. Student participation in SAEs ranged from 0 students to 800 students. In the typical Kentucky agricultural education program, of the students with SAEs 23 (16%, SD = 35.80) students had exploratory SAEs, 5 (4%, SD = 9.40) students had research/experimentation SAEs, 39 (33%, SD = 39.30) students had ownership/entrepreneurship SAEs, 53 (38%, SD = 58.73) students had placement SAEs, and 12 (9%, SD = 20.45) students had service learning SAEs. The results for SAE participation were positively skewed. Skewness scores ranged from 1.98 to For clarity, data for student participation in SAE were organized into histograms (See Appendix L) to view the distribution of student participation. 39
53 One respondent was identified as an outlier in the distribution. This respondent reported that his or her agricultural education program had 800 total students participating. Each student in this program had a SAE. This respondent indicated that 200 students had exploratory SAEs, 20 students had research/experimentation SAEs, 80 students had ownership/entrepreneurship SAEs, 400 students had placement SAEs, and 100 students had service learning SAEs. Objective 3 Objective 3 sought to determine the perceived value of SAE as reported by Kentucky agriculture teachers. Data were collected using a researcher designed questionnaire. Teachers were asked to rate their perceptions of 43 value related statements on a 6-point Likert type scale which resulted in interval data. A total of 109 responses were received from participants. Table 4.4 summarizes the data for objective 3 in terms of means and standard deviations. In addition, frequencies and percentages were calculated in relation to the 6-point Likert scale (Appendix M). Table 4.4 Value of SAE as Reported by Kentucky Agriculture Teachers (n = 109) Statement M a SD I am familiar with the role of SAEs within the 3-circle model Quality SAEs provide real-life experiences for students I encourage all of my students to have a SAE Students gain knowledge through entrepreneurship SAEs Students gain knowledge through placement SAEs Students gain valuable hands-on experience through placement SAEs Students gain knowledge through service learning SAEs SAE participation positively affects students work attitudes Students gain valuable hands-on experience through service learning SAEs I encourage some of my students to have a placement SAE
54 Table 4.4 (continued) Value of SAE as Reported by Kentucky Agriculture Teachers (n = 109) Statement M a SD Students gain knowledge through research/experimentation SAEs Students gain valuable hands-on experience through research/experimentation SAEs All chapter officers should have a SAE Students gain valuable hands-on experience through entrepreneurship SAEs Students gain knowledge through exploratory SAEs I encourage some of my students to have an entrepreneurship SAE In order to have a quality agricultural education program, SAE, FFA, and in-class instruction are required The local agricultural education program benefits from offering SAE Students gain valuable hands-on experience through exploratory SAEs Quality SAEs get students started in an agricultural career Quality SAEs improve student mastery of course objectives A quality SAE should be a requirement for FFA degree advancement SAE should be required of every FFA member I encourage my students to conduct SAE because of the proficiency award recognition I encourage some of my students to have a service learning SAE As agriculture continues to change, SAE opportunities will remain relevant to students A quality SAE should be required for FFA scholarships
55 Table 4.4 (continued) Value of SAE as Reported by Kentucky Agriculture Teachers (n = 109) Statement M a SD SAE should be required of every student in an agricultural class Pre-service agricultural education programs should teach that every student should have a SAE SAE is beneficial to some students I encourage some of my students to have an exploratory SAE I encourage some of my students to have a research/experimentation SAE A successful agriculture program cannot be achieved without SAE I require every FFA member to have a SAE Part of a student s grade in class should be based on SAE SAE can be required of every student Teachers should spend as much time working with SAE as with FFA activities SAE activities are as important as FFA activities SAEs are as relevant to urban settings as rural settings I require every student enrolled in an agriculture class to have a SAE Only SAEs that change in some way each year provide students with quality agricultural experiences I have as much time for SAE activities as FFA activities Students receive recognition for their SAEs on the local level in my program Overall Value Construct a Scale from 1 = Strongly Disagree to 6 = Strongly Agree As Table 4.4 outlines, agriculture teacher s agreement with the value statements included in the study varied significantly. Teachers most strongly agreed that they were 42
56 familiar with SAEs (M = 5.58, SD = 0.98), that SAEs give students real-life experiences (M = 5.55, SD = 0.89), and that they encourage all of their students to have SAEs (M = 5.50, SD = 0.94). Among the least agreed with statements, agriculture teachers disagreed that they had as much time for SAE activities as FFA activities (M = 3.33, SD = 1.49) and that students receive recognition for SAEs in their local programs (M = 2.25, SD = 1.70). In addition to the individual value statement analysis, data were analyzed to determine an overall score for the value construct for SAE. Data analysis revealed a mean score of 4.68 (SD = 0.66) for overall value of SAE. Objective 4 The purpose of this objective was to determine what Kentucky agricultural education teachers believed constituted a quality SAE. Twenty two quality statements were developed which aligned with the SAE quality indicators outlined by the National Council for Agricultural Education (2007). Teachers rated statements based on a 6-point Likert scale (1 = Strongly Disagree to 6 = Strongly Agree) and 109 responses were collected. Interval data for this objective are summarized in Table 4.5 in terms of means and standard deviations. Additionally, frequencies and percentages were calculated in relation to the 6-point Likert scale (Appendix M). Table 4.5 Kentucky Agriculture Teacher Perceptions Regarding SAE Quality Components (n = 109) Statement M a SD Placement SAEs are beneficial to students Rewards should be provided for students with outstanding SAEs at the state level Entrepreneurship SAEs are beneficial to students The role of the agriculture teacher in a SAE program is to provide support for students Recognition for SAEs should be provided at the local level
57 Table 4.5 (continued) Kentucky Agriculture Teacher Perceptions Regarding SAE Quality Components (n = 109) Statement M a SD The teacher should provide continuous supervision for students SAEs throughout the year Service learning SAEs are beneficial to students Students should be required to keep up-to-date records of their SAE programs The teacher should keep written records of SAE supervisory visits Students SAEs should show evidence of growth in size and scope The teacher should provide continuous instruction for students SAEs throughout the year Exploratory SAEs are beneficial to students Research/experimentation SAEs are beneficial to students Requiring SAE of each FFA member benefits the local FFA program The role of the agriculture teacher in a SAE program is to provide instruction Requiring SAE of each FFA member improves the quality of the total SAE program The student should be the primary planner of the SAE program Requiring SAE of each student enrolled in an agriculture class improves the quality of the total SAE program SAE programs should be based on the career pathways of students SAE programs should be aligned with Kentucky s skills standards
58 Table 4.5 (continued) Kentucky Agriculture Teacher Perceptions Regarding SAE Quality Components (n = 109) Statement M a SD The teacher should create a summary of all students SAE programs at the end of the calendar year SAE programs should be based on the national agricultural curriculum standards Overall Quality Construct a Scale from 1 = Strongly Disagree to 6 = Strongly Agree As Table 4.5 summarizes, all statements were agreed with by Kentucky agriculture teachers. Agriculture teachers most strongly agreed that placement SAEs are beneficial to students (M = 5.53, SD = 0.86), that outstanding SAEs should be rewarded at the state level (M = 5.50, SD = 0.96), and that entrepreneurship SAEs are beneficial to students (M = 5.48, SD 0.92). Kentucky agriculture teachers least agreed that SAE programs should be aligned with Kentucky s skills standards (M = 4.37, SD = 1.35), that SAE programs should be based on national agricultural curriculum standards (M = 4.12, SD = 1.39), and that teachers should create a summary of students SAEs at the end of each calendar year (M = 4.22, SD = 1.51). In addition to data analysis on individual statements, an overall quality score was calculated through summated means. This quality score demonstrated agreement with the SAE quality indicators outlined by the National Council for Agricultural Education (2007). A mean score of 4.98 (SD = 0.70) was computed. Objective 5 Objective 5 sought to determine the level of satisfaction of Kentucky agriculture teachers with SAEs in their individual programs. Data were collected using ten statements included on the researcher constructed questionnaire. Respondents were asked to rate their level of agreement with the statements on a 6-point Likert scale (1 = Strongly 45
59 Disagree to 6 = Strongly Agree). Means and standard deviations were reported on this interval data and summarized in Table 4.6. In addition, frequencies and percentages were calculated in relation to the 6-point Likert scale (Appendix M). Table 4.6 Satisfaction of Kentucky Agriculture Teachers Regarding SAE (n = 109) Statement M a SD Overall, I am satisfied with the scope of students SAEs in my program I am satisfied with the number of students in my program enrolled in SAE I am satisfied with SAE participation in my program when compared to FFA participation and classroom enrollment. I am satisfied with the number of proficiencies my program submits to the regional level I am satisfied with the quality of the SAEs in my program I am satisfied with the overall diversity of SAEs in my program I am satisfied with my students motivation to participate in SAE I am satisfied with my students level of record keeping for their SAEs I am satisfied with my ability to integrate SAE, FFA, and inclass instruction into my agricultural education program I am satisfied with the level of rewards provided at the state level for outstanding SAEs Overall Satisfaction Construct a Scale from 1 = Strongly Disagree to 6 = Strongly Agree Kentucky agriculture teachers slightly agreed that they were satisfied with the scope of students SAEs (M = 3.67, SD = 1.45). Respondents most disagreed that they 46
60 were satisfied with their students motivation to participate in SAEs (M = 3.16, SD = 1.43), their students level of record keeping for their SAEs (M = 2.89, SD = 1.40). Additionally, respondents most disagreed that they were satisfied with rewards provided at the state level for outstanding SAEs (M = 2.70, SD = 1.43). To complement the data analysis for individual statements, an overall satisfaction score was computed in the form of summated means. The mean satisfaction score was 3.17 (SD = 0.66). Objective 6 This objective sought to assess any differences in the SAE constructs by the demographic characteristics of Kentucky agricultural education teachers. Hypotheses were developed to assess these differences. Null hypothesis one, stating that there are no statistically significant differences in the SAE constructs (value, quality, and satisfaction) by degree earned by the teacher, was tested using a t-test. A significance level was set a priori at.05. T-test results are presented in Table 4.7. P-values for quality and satisfaction were not significant at the.05 level. The null hypothesis was not rejected for the quality and satisfaction constructs; that is, there are no differences in the quality and satisfaction constructs by degree earned by the agriculture teacher. The p-value for the value construct was significant at the.05 level, so the null hypothesis was rejected. In other words, there are statistically significant differences in the value construct by degree earned by the agriculture teacher. Table 4.7 T-test Results for Differences in SAE Constructs by Degree Earned by the Agriculture Teacher Bachelor s (n = 76) Master s or Higher (n = 24) Construct M SD M SD p Value Quality Satisfaction
61 Null hypothesis two, which stated that there are no statistically significant differences in the SAE constructs (value, quality, and satisfaction) by the number of years the teacher had taught, was tested using an analysis of variance (ANOVA). An alpha level was set a priori at.05. Results for each construct are presented in Table 4.8, Table 4.9, and Table Levene s test of equality of variance was used to test the assumption of equal variance. The F-values for the value construct (F 1,103 = 1.16, p = 0.28), quality construct (F 1,102 = 0.14, p = 0.71), and satisfaction construct (F 1, 100 = 0.21, p = 0.65) were not significant so the assumption of equal variance was valid. Table 4.8 Analysis of Variance of Value Construct by Teaching Experience Source Sum of Squares df Mean Square F p Between Groups Within Groups Total Table 4.9 Analysis of Variance of Quality Construct by Teaching Experience Source Sum of Squares df Mean Square F p Between Groups Within Groups Total Table 4.10 Analysis of Variance of Satisfaction Construct by Teaching Experience Source Sum of Squares df Mean Square F p Between Groups Within Groups Total
62 The results in Table 4.8, Table 4.9, and Table 4.10 indicated that the F-values for the value construct (F 1,103 = 0.61, p = 0.61), quality construct (F 1,102 = 0.18, p = 0.91), and satisfaction construct (F 1,100 = 0.51, p = 0.68) were not significant at the.05 level. The researcher failed to reject the null hypothesis; that is, there are no statistically significant differences in the SAE constructs by the number of years the agriculture teacher has taught. Null hypothesis three, stating that there are no differences in the SAE constructs by teacher certification rank, was tested using an ANOVA. An alpha level was set a priori at.05. Results for each construct are summarized in Table 4.11, Table 4.12, and Table To test the assumption of equal variance, Levene s test of equality of variance was used. The F-values for the value construct (F 2,101 = 1.35, p = 0.26), quality construct (F 2,101 = 0.88, p = 0.42), and satisfaction construct (F 2,98 = 1.69, p = 0.19) were not significant so the assumption of equality of variance was valid. Table 4.11 Analysis of Variance of Value Construct by Teacher Certification Rank Source Sum of Squares df Mean Square F p Between Groups Within Groups Total Table 4.12 Analysis of Variance of Quality Construct by Teacher Certification Rank Source Sum of Squares df Mean Square F p Between Groups Within Groups Total
63 Table 4.13 Analysis of Variance of Satisfaction Construct by Teacher Certification Rank Source Sum of Squares df Mean Square F p Between Groups Within Groups Total For the ANOVA, the F-values for the value construct (F 2,101 = 1.83, p = 0.17), quality construct (F 2,101 = 0.40, p = 0.67), and satisfaction construct (F 2,98 = 2.04, p = 0.14) were not significant at the.05 level. The null hypothesis was not rejected. In other words, there are no statistically significant differences in the SAE constructs by teacher certification rank. Null hypothesis four, stating that there are no statistically significant differences in the SAE constructs by department size, was tested using an ANOVA. An alpha level was set a priori at.05. Data are presented in Table 4.14, Table 4.15, and Table Levene s test of equality of variance was used to test the assumption of homogeneity of variance. The F-values for the value construct (F 2,103 = , p = 0.12), quality construct (F 2,102 = 0.71, p = 0.49), and satisfaction construct (F 2,100 = 1.26, p = 0.29) were not significant at the.05 level so the assumption of homogeneity of variance was valid. Table 4.14 Analysis of Variance of Value Construct by Department Size Source Sum of Squares df Mean Square F p Between Groups Within Groups Total
64 Table 4.15 Analysis of Variance of Quality Construct by Department Size Source Sum of Squares df Mean Square F p Between Groups Within Groups Total Table 4.16 Analysis of Variance of Satisfaction Construct by Department Size Source Sum of Squares df Mean Square F p Between Groups Within Groups Total As shown in Table 4.14, Table 4.15, and Table 4.16, the F-values for the value construct (F 2,103 = 1.10, p = 0.34), quality construct (F 2,102 = 0.68, p = 0.51), and satisfaction construct (F 2,100 = 2.55, p = 0.08) were not significant at the.05 level; therefore the researcher failed to reject the null hypothesis. In other words, there are no statistically significant differences in the SAE constructs by department size. 51
65 CHAPTER 5: CONCLUSIONS AND RECOMMENDATIONS Purpose of the Study The purpose of this study was to describe teachers perceptions regarding SAE and selected characteristics (gender, age, number of years teaching, department size, number of students in the agricultural education program, level of education, and regional location) of Kentucky high school agricultural educators included in the study. A secondary purpose of this study was to describe the current status of SAE in Kentucky. Objectives The specific objectives for this study were to describe: 1. Selected characteristics (gender, age, Kentucky teacher rank certification, number of years teaching, department size, number of students in the agricultural education program, level of education, and regional location) of Kentucky high school agricultural educators in the study. 2. The current status of SAE in Kentucky (number of students participating, percent of agriculture students participating, and student participation in SAE types). 3. The perceptions of Kentucky high school agricultural educators regarding the value of SAE. 4. The perceptions of Kentucky high school agricultural educators regarding SAE quality. 5. The satisfaction of Kentucky high school agricultural educators regarding SAE in their individual programs. 6. The differences among teachers perceptions regarding SAE by selected characteristics (number of years teaching, department size, level of education, and rank certification level). 52
66 Conclusions and Implications Objective 1 The typical Kentucky agricultural education teacher is 37 years old with 13 years of teaching experience. The majority of agriculture teachers in Kentucky are male. The overwhelming majority of agriculture teachers have a master s degree and Rank I Certification. Only a small percentage of agriculture teachers are at the Rank III Certification level. This finding indicates that Kentucky agriculture teachers continue to seek credit beyond a bachelor s degree to increase their certification rank and pay scale. Most agriculture teachers have taught from one to fifteen years indicating that some agriculture teachers achieve Rank I Certification early in their tenure. In terms of individual programs, the majority of agriculture programs employ two teachers. A very low percentage of programs employ four or more teachers. Agriculture teachers in smaller one or two teacher programs may have more negative perceptions of SAEs than teachers in larger departments (Swortzel, 1996). An overwhelming majority of agriculture teachers have extended days indicating that the concerns expressed by Steele (1997) are not shared in Kentucky. However, most Kentucky agriculture teachers do not have a SAE supervision period which may decrease time available for SAE implementation. This lack of time for SAEs may contribute to negative perceptions of SAE in Kentucky. In terms of regional location, data were varied. The region with the highest number of agriculture teachers was the Bluegrass Region while the lowest was the Purchase region. Data from objectives 2, 3, 4, and 5 may vary between regions due to cultural, social, or economic differences. These differences should be analyzed to determine ways to improve the condition and perception of SAE within regions. Objective 2 The typical program in Kentucky has 198 students enrolled in agriculture classes with 126 students with SAEs; however, the size of agriculture programs and SAE participation vary significantly. A slight majority of students in Kentucky agricultural education programs have SAEs. Of students that have SAEs, the majority of those SAEs 53
67 are placement SAEs followed by ownership/entrepreneurship SAEs. Very few SAEs fall into the categories of research/experimentation or service learning. The discrepancy between participation in these SAE types may be due to student and/or agriculture teacher knowledge or acceptance of research/experimentation and service learning SAEs which are relatively new areas. The majority of students SAEs are categorized as placement or entrepreneurship SAEs. This conclusion implies that research/experimentation SAEs, service learning SAEs, and exploratory SAEs are underrepresented in the typical Kentucky agriculture program. An outlier was identified in the data. This respondent had significantly higher student participation in SAEs than other respondents and was a member of at least a four teacher program. This finding indicates that teachers in multi-teacher programs may be able to distribute responsibilities to better accommodate for high student participation. However, data collected in this study does not describe the activities that teachers count as a SAE. It may be that teachers in this program are more lax in their definition of SAE. Objective 3 As an overall mean score, Kentucky agriculture teachers value SAE. Agriculture teachers are familiar with the SAE component of agricultural education. They believe that SAEs provide real-life experiences for students consistent with Barrick et al (1992) and the National FFA Organization (2006a, 2006b). More specifically, they believe that each major SAE category can provide valuable hands-on experience for students and increase students knowledge. Consistent with Camp et al. (2000), Kentucky agriculture teachers feel that SAE participation can positively influence student s work attitudes. They feel that quality SAEs can get students started on a career path and improve students understand of class material which is consistent with the findings of Cheek et al. (1994). These teachers also believe that the overall local program benefits from offering SAEs. These conclusions imply that SAE is a valuable component of agricultural education. Kentucky agricultural education teachers believe that all three components of agricultural education are required in order to have a quality program and that a quality 54
68 program cannot be achieved without the SAE component which is not consistent with the perceptions of teachers in other states (Steele, 1997). Agriculture teachers believe that chapter officers should have SAEs and they believe to a lesser degree that all FFA members and students enrolled in agriculture classes should have a SAE consistent with the recommendations of Whaley and Lucero (1993). Additionally, they believe that SAEs should be included as a requirement for FFA degree advancement and FFA scholarships. To a lesser degree, agriculture teachers believe that SAE activities are as important as FFA activities and agriculture teachers should spend as much time working with SAE activities as with FFA activities. Due to the high variance in Kentucky agriculture teacher s opinions on these factors, a significant number of teachers may feel that FFA activities have a higher priority than SAE activities which is consistent with the findings of Wilson and Moore (2006). Similar findings indicate that agriculture teachers are mixed regarding their opinions of the relevance of SAE to urban settings as well as whether SAEs should change somehow each year to provide quality experiences for students. Regarding the actual implementation of SAEs in programs, Kentucky agriculture teachers vary. Kentucky agricultural education teachers encourage every student to have a SAE, especially placement and entrepreneurship SAEs. Service learning SAEs are also highly encouraged; however, research/experimentation and exploratory SAEs are encouraged by agriculture teachers less than the other three categories. Though agriculture teachers encourage every student to have a SAE they prefer certain SAE categories to others. These teachers may value placement, entrepreneurship, and service learning SAES above research/experimentation and exploratory SAEs which may account for higher participation levels in entrepreneurship and placement SAEs in Kentucky agriculture programs. Additionally, a small majority of Kentucky agriculture teachers require all of their agriculture students to have a SAE and an even stronger majority require every FFA members to have a SAE; however, more agriculture teachers believe that that all agriculture students and FFA members should have SAE as compared to the number of teachers that actually require SAEs. These findings indicate a disconnect between the philosophies of agriculture teachers and their actions. This conclusion is consistent with the findings of Dyer and Osborne (1995). 55
69 Though Kentucky agriculture teachers value SAE and make attempts to implement SAE in their programs, they do not feel that they have enough time for SAE activities in comparison to FFA activities. This finding indicates that FFA activities receive preferential treatment compared to SAE activities which may demonstrate a value imbalance. As one teacher commented on the questionnaire, Time is the limiting factor in all [agriculture] programs, not desire or dedication. Agriculture teachers prioritize their time in accordance with their values. Moreover, Kentucky agriculture programs do not provide much recognition for outstanding SAEs at the local level. These conclusions imply that though Kentucky teachers value SAE, they lack time to allocate to implementing SAE in their programs. Objective 4 Overall, Kentucky agriculture teachers agree with the SAE quality indicators outlined by the National Council for Agricultural Education (2007). Specifically, agriculture teachers believe that all SAE categories are beneficial to students; however, placement and entrepreneurship SAEs are believed to be more beneficial than others. Agriculture teachers may believe that these types of SAEs provide students with higher quality experiences which may account for differences in student participation in the individual SAE categories. Agriculture teachers only slightly agreed with the first quality indicator, All students have experiential learning (SAE) programs based on career pathways/clusters/interests and agricultural curriculum standards (National Council for Agricultural Education, 2007, p. 29). SAEs should be developed that focus on students career interests. Agriculture teachers also believe that SAEs should be based on both state and national curriculum standards. These conclusions imply that the first quality indicator should be accepted by the profession. The second quality indicator states, Experiential learning programs are planned, developed and managed by the student with instruction and support by the agriculture teacher, parents and/or employer (p. 29). Agriculture teachers believe that their role should be to provide instruction and support to students who should be the primary 56
70 planner of the SAE. These conclusions demonstrate that the second quality indicator should be accepted by the profession. Agriculture teachers were in moderate agreement regarding the third quality indicator, The agriculture teacher maintains accurate records of all experiential learning (SAE) supervision (p. 29). Kentucky agriculture teachers believe that they should keep some form of written records of supervisory visits. This conclusion shows that the third quality indicator should be accepted by the agricultural education profession. Agriculture teachers moderately agreed concerning the fourth quality indicator, Continuous instruction and supervision of student experiential learning (SAE) programs are provided by the agriculture teachers throughout the calendar year (p. 29). Both statements related to this quality indicator received moderate agreement from agriculture teachers. This conclusion indicates that the fourth quality indicator should be embraced by the profession. Agriculture teachers agreed with the fifth quality indicator, Each agriculture student maintains up-to-date and accurate experiential learning (SAE) records, and the sixth quality indicator, An annual summary of students experiential learning (SAE) programs is completed and submitted to appropriate entities (p. 29). Agriculture teachers moderately agreed regarding the seventh quality indicator, Students have comprehensive experiential learning (SAE) programs that show evidence of growth in size and/or scope (p. 29). These conclusions imply that the fifth, sixth, and seventh quality indicators should be accepted by the profession. In addition, agriculture teachers agree that students should be rewarded for their SAEs at both the state and local level. The level of rewards may be an indicator of quality of individual SAE programs and the statewide condition of SAE. Also, agriculture teachers believe that requiring SAE of every agriculture student increases the quality of the total SAE program. This finding indicates that Kentucky agriculture teachers believe that the amount of participation in SAE is an indicator of total program quality. These conclusions may indicate that the quality indicators outlined by National Council for Agricultural Education (2007) may not be exhaustive. 57
71 Objective 5 Overall, Kentucky agricultural education teachers are not satisfied with their students SAE programs. The highest rated statement related to the scope of student SAEs and was only slightly agreed with overall. The data suggests that agriculture teachers are split on their satisfaction with the scope of students SAEs. Agriculture teachers are slightly dissatisfied with the total number of students with SAEs in their programs. Agricultural education teachers were even more dissatisfied with SAE participation when compared to FFA participation which indicates that even though FFA may be more valued by Kentucky agriculture teachers than SAE, SAE participation levels are still not at a satisfactory level. Agriculture teachers value SAE, but may not be implementing it effectively in their programs due to time constraints. Agriculture teachers were not satisfied with the number of proficiencies their chapter submits to the local level. Agriculture teachers were also slightly dissatisfied with the quality and diversity of SAEs in their programs. This finding may be a result of agriculture teachers tendency to encourage more students to have placement and entrepreneurship SAEs than other SAEs. Community demographics may also influence the diversity of SAEs in a given program. Agriculture teachers were also dissatisfied with student motivation to participate in SAEs as well as their level of record keeping. Kentucky agriculture teachers were least satisfied with their ability to integrate SAE, FFA, and classroom instruction into the total program which may indicate a low self efficacy for SAE integration. Even though agriculture teachers are familiar with the SAE component, they may have difficulty integrating it into the total program. Agriculture teachers are most dissatisfied with the level of rewards provided at the state level. Objective 6 Significant differences were not identified between any of the three constructs by number of years teaching, department size, and teaching rank certification. Variation was almost non-existent among the constructs by number of years teaching which may imply that Kentucky agriculture teacher s perceptions regarding the value of SAE, the quality components of SAE, and their satisfaction with their SAE programs are not changing 58
72 over time. In other words, Kentucky agriculture teacher s attitudes toward SAE when entering the profession will likely stay with them for the remainder of their tenure. Very little variation existed among the constructs by agricultural education program department size. This finding was not consistent with the findings of Swortzel (1996) who found that agriculture teachers in larger departments tended to have more positive perceptions toward the supervision of students SAEs. This discrepancy may be due to the scope of this study compared to Swortzel s study. Little variation existed among the SAE constructs by teaching rank certification. Again, this finding implies that Kentucky agriculture teachers attitudes toward SAE are not changing as they gain experience, whether through interactions with teachers or through further education. This conclusion may have implications for Kentucky agriculture teacher educators and state staff. If the state hopes to influence teacher s attitudes toward SAE, initiatives must be focused toward undergraduates in agricultural education and early career agriculture teachers. A statistically significant difference was assessed in the value construct by degree earned. This finding paints a slightly different picture of the educational level of the teacher than the finding regarding differences in the construct by teaching rank certification. This finding implies that teachers with master s degrees may value SAE differently than teachers with bachelor s degrees; however, the actual difference in means was relatively small, so this finding may have little practical implication. Because the differences in means by degree earned were small and the differences in the construct by teaching rank certification were not statistically significant, this conclusion is an area that warrants further research. Recommendations Agriculture teachers recognize SAE as a valuable component of agricultural education. Agriculture teacher education programs should continue to teach that SAEs are a necessary part of a quality high school agriculture program. SAE should continue to be used as a requirement for FFA degree advancement and FFA scholarship. The SAE scholarship and degree requirement may serve as motivation for students to participate in SAEs. Moreover, agriculture teacher education and professional development in 59
73 Kentucky should be expanded in the area of SAE to include topics related to developing programs in both rural and urban areas, managing the entire program, overall time management, and ways to provide rewards and recognition for students SAEs at the local level. The agricultural education profession in the state of Kentucky should embrace the quality indicators established by the National Council for Agricultural Education (2007). State staff should undergo an effort to assess the quality of agricultural education SAE programs based on these standards. Additionally, efforts should be made to create curriculum standards for Kentucky agricultural education programs on which student SAEs may be based. National agricultural education curriculum standards should also be formed which apply to all agricultural education programs. Based on these findings, a standardized instrument for SAE supervisory visits may be beneficial to agriculture teachers. Professional development in this state should be expanded to include the use of this new SAE supervision instrument and synthesizing individual students SAE program information to create a summary of the total SAE program condition. Agriculture teacher education curriculum and professional development should focus on the benefits of all five major SAE categories to improve the perceptions of Kentucky agriculture teachers toward research/experimentation, exploratory, and placement SAEs. Moreover, teacher education and professional development should be further expanded to include topics related to providing instruction and support for all students with SAEs throughout the entire year. This study focused on the condition of SAE at the current time. State staff should track the participation levels of students in SAE across the state year to year. This data will be helpful in determining whether SAE in Kentucky is growing or declining. The findings from this study indicate that Kentucky teacher education programs and professional development should be expanded for current and future agriculture teachers to include topics on teaching record keeping to students, how to continually develop students SAEs, and the integration of SAE, FFA, and classroom instruction into the total agricultural education program. Moreover state staff should open a discussion with Kentucky teachers to determine areas of deficiency in state rewards for SAEs. Agriculture teachers dissatisfaction with state SAE rewards may stem from issues with 60
74 the amount of rewards given, the diversity of rewards given, or the quality of rewards given within each SAE category. Agriculture state staff and teacher educators should partner to analyze demographic differences that occur between regions in which teachers are satisfied with their SAE programs and regions in which teachers are dissatisfied with their SAE programs to determine if any regional characteristics influenced the results of this study. Agricultural education teacher educators and state staff in Kentucky should also work together to determine the root causes of agriculture teacher dissatisfaction with SAEs in Kentucky as a whole and within each region and design professional development and education curriculum which address these issues. A Kentucky task force should be created to lead an effort to revitalize SAEs in Kentucky. The task force should consist of leaders in Kentucky Team Ag Ed, which includes state staff, teacher educators, and teachers. The task force should focus on expanding student participation in SAE within agriculture programs, increasing the diversity of SAEs in Kentucky, motivating teachers to implement and students to participate in SAE programs, expanding the level of state rewards for outstanding SAEs, and assessing the quality of current student SAEs. Recommendations for Further Research Based upon the conclusions of this study, the researcher offers the following recommendations for further research: This study was a foundational study from which to build data regarding SAE in Kentucky. This study should be replicated in similar states where a deficiency in SAE research exists. Moreover, national studies should be completed to assess the national state of SAE and perceptions of teachers toward SAEs. Research should focus on the seven quality indicators for SAE programs (National Council for Agricultural Education, 2007) used in this study to determine their validity among other teachers. Moreover, research should seek to determine if these indicators are exhaustive or if other indicators should be added. Data from this study should be analyzed to determine relationships that exist between the value, quality, and satisfaction constructs of this study. 61
75 Data from this study should be further analyzed to assess any relationship that may exist between student participation in SAE and agriculture teacher satisfaction with SAEs. Data from this study should be analyzed to identify relationships that may exist between teacher demographics and the level of student participation in SAE. SAE participation varied among the five SAE categories. Future research should seek to identify the causes of this variation. Do agriculture teachers value certain SAE categories more than others? Do agriculture teachers encourage students to participate in one SAE category more than others? This study sought to quantitatively explain the perceptions of Kentucky agriculture teachers regarding SAE. Qualitative data should be collected regarding the perceived value of SAE, the definition of SAE quality, and the satisfaction of teachers with their SAE programs. Qualitative data may provide rich descriptions of the value of SAE and agriculture teachers satisfaction with SAE. Such data may also identify additional indicators of SAE program quality. Future research should seek to identify the activities that teachers count as SAEs. Further research is warranted in the area of agriculture teacher satisfaction with SAE to determine the causes of the low satisfaction with SAE of Kentucky agricultural education teachers. Future research should approach SAE from the conceptual perspective conceived by Dyer and Osborne (1996). Research should focus on the perceptions of other individuals involved in the implementation of SAEs, including students, parents, employers, school administrators, agriculture teacher educators, and agricultural education state staff. Also, school policies and other school characteristics should be examined to determine any influence on SAE program participation and quality. Community characteristics which may influence SAE programs in different areas should also be examined. The relationship between department size and the perceptions of teachers toward SAE warrants further insight as the findings of this study were inconsistent with literature on SAE (Swortzel, 1996). 62
76 A difference was found among the value construct of SAE by degree earned by the teacher. This difference should be further analyzed to determine if a relationship exists between the two variables. 63
77 APPENDIX A: ELECTRONIC COPY SAE IN KENTUCKY QUESTIONNAIRE 64
78 65
79 66
80 67
81 68
82 69
83 70
84 APPENDIX B: HARD COPY SAE IN KENTUCKY QUESTIONNAIRE 71
85 72
86 73
87 74
88 75
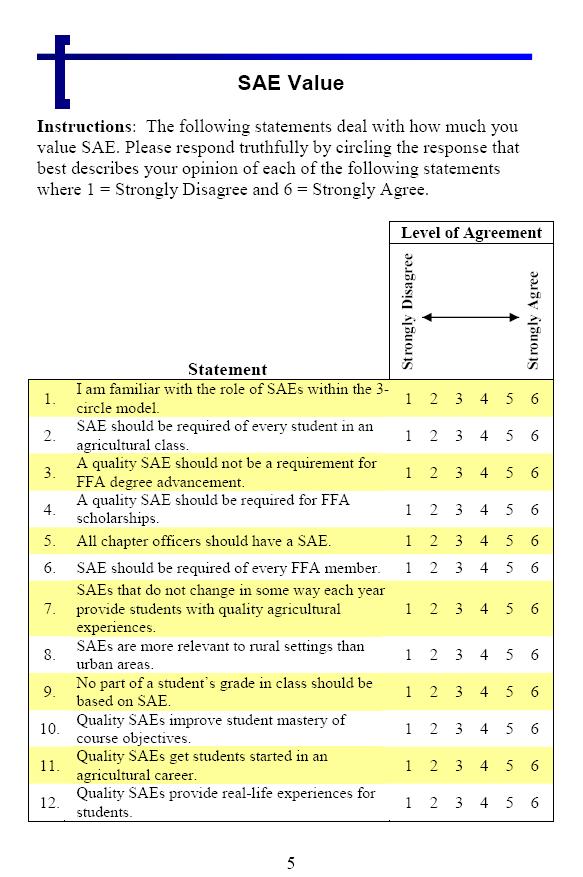
89 76
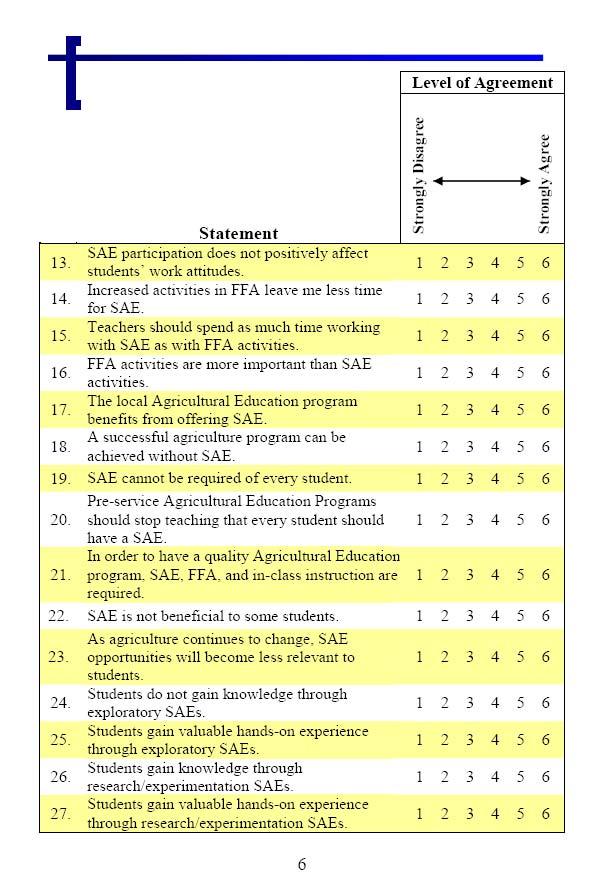
90 77
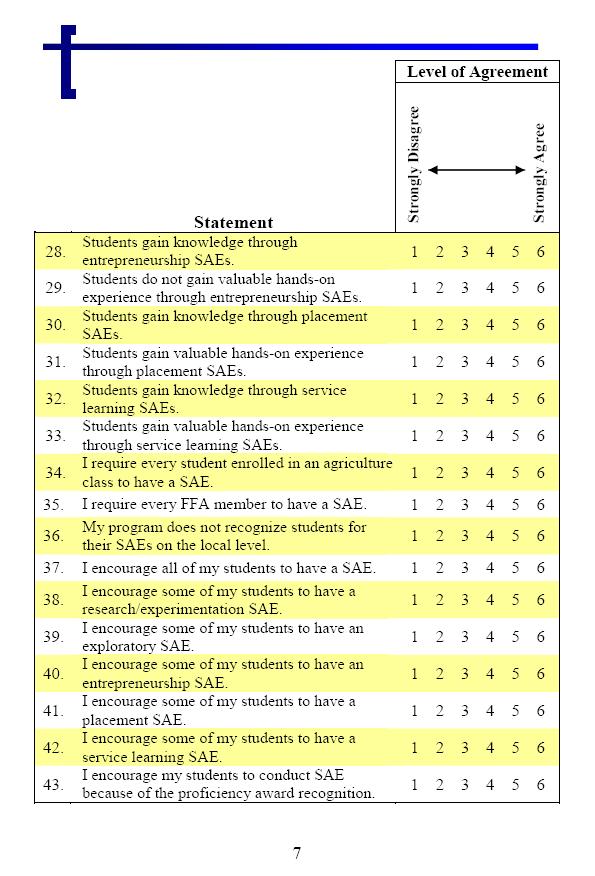
91 78
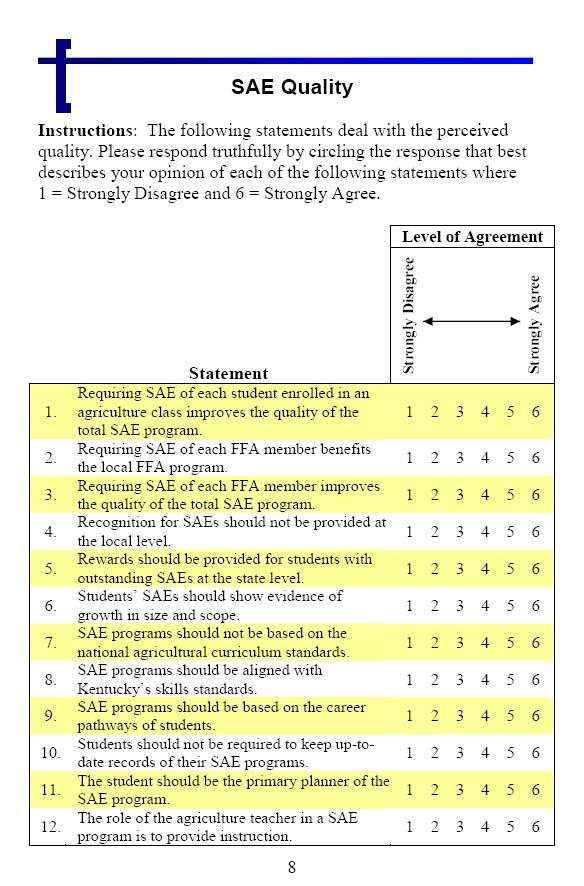
92 79
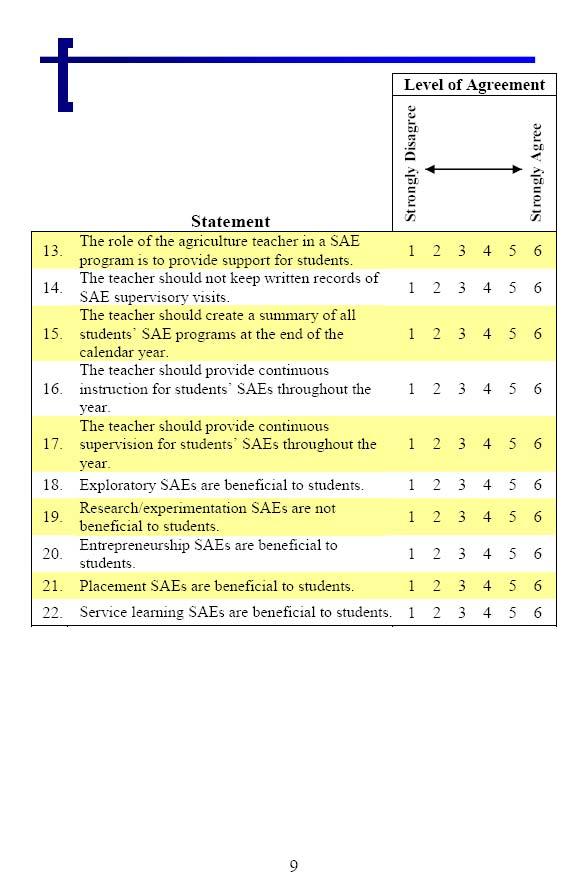
93 80
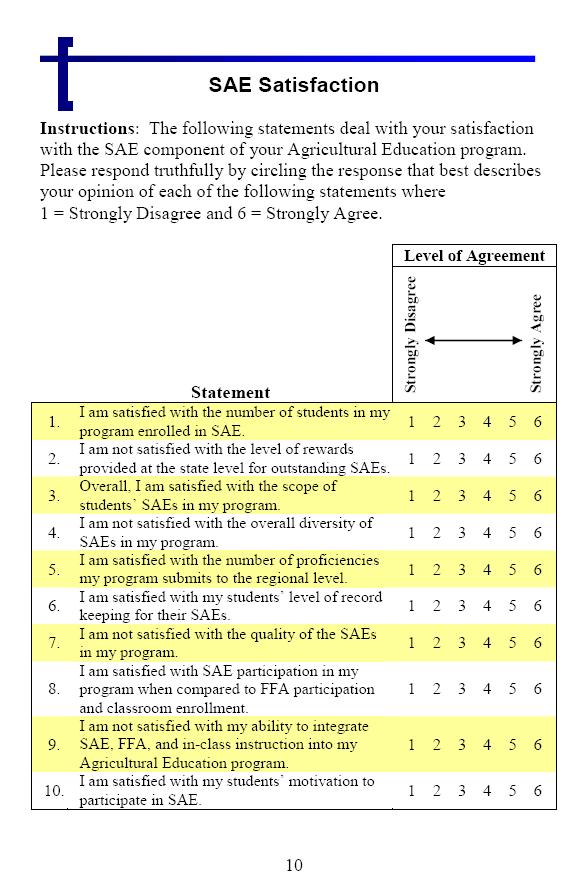
94 81
Online Journal for Workforce Education and Development Volume V, Issue 3 - Fall 2011
 SCIENCE, MATH, SOCIAL STUDIES, AND LANGUAGE ARTS ACHIEVEMENT OF HIGH SCHOOL STUDENTS IN A COMPLETE PROGRAM OF AGRISCIENCE EDUCATION IN GEORGIA: A BASELINE STUDY Dennis Duncan, Ph.D. University of Georgia
Delaware Performance Appraisal System Building greater skills and knowledge for educators
 Delaware Performance Appraisal System Building greater skills and knowledge for educators DPAS-II Guide for Administrators (Assistant Principals) Guide for Evaluating Assistant Principals Revised August
HAVE YOU ever heard of someone
 The Purpose and Types of Supervised Agricultural Experience Programs HAVE YOU ever heard of someone who did not get a particular job because the person didn t have experience? What is experience, and how
Inquiry Learning Methodologies and the Disposition to Energy Systems Problem Solving
 Inquiry Learning Methodologies and the Disposition to Energy Systems Problem Solving Minha R. Ha York University minhareo@yorku.ca Shinya Nagasaki McMaster University nagasas@mcmaster.ca Justin Riddoch
MASTER OF ARTS IN APPLIED SOCIOLOGY. Thesis Option
 MASTER OF ARTS IN APPLIED SOCIOLOGY Thesis Option As part of your degree requirements, you will need to complete either an internship or a thesis. In selecting an option, you should evaluate your career
UK Institutional Research Brief: Results of the 2012 National Survey of Student Engagement: A Comparison with Carnegie Peer Institutions
 UK Institutional Research Brief: Results of the 2012 National Survey of Student Engagement: A Comparison with Carnegie Peer Institutions November 2012 The National Survey of Student Engagement (NSSE) has
CHALLENGES FACING DEVELOPMENT OF STRATEGIC PLANS IN PUBLIC SECONDARY SCHOOLS IN MWINGI CENTRAL DISTRICT, KENYA
 CHALLENGES FACING DEVELOPMENT OF STRATEGIC PLANS IN PUBLIC SECONDARY SCHOOLS IN MWINGI CENTRAL DISTRICT, KENYA By Koma Timothy Mutua Reg. No. GMB/M/0870/08/11 A Research Project Submitted In Partial Fulfilment
THE PENNSYLVANIA STATE UNIVERSITY SCHREYER HONORS COLLEGE DEPARTMENT OF MATHEMATICS ASSESSING THE EFFECTIVENESS OF MULTIPLE CHOICE MATH TESTS
 THE PENNSYLVANIA STATE UNIVERSITY SCHREYER HONORS COLLEGE DEPARTMENT OF MATHEMATICS ASSESSING THE EFFECTIVENESS OF MULTIPLE CHOICE MATH TESTS ELIZABETH ANNE SOMERS Spring 2011 A thesis submitted in partial
Supervised Agriculture Experience Suffield Regional 2013
 Name Chapter Mailing address Home phone Email address: Cell phone Date of Birth Present Age Years of Ag. Ed. completed as of Year in school or year of graduation Year Greenhand Degree awarded Total active
Supervised Agricultural Experience Unit Agriculture, Food, and Natural Resources Texas Education Agency
 Supervised Agricultural Experience Unit Agriculture, Food, and Natural Resources Texas Education Agency LESSON: Agricultural Careers and Opportunities in SAE OBJECTIVES: 1. Identify as a class a variety
OKLAHOMA 4-H SHOOTING SPORTS POLICY Revised June 2010 Revised June 2007 Original 1994
 OKLAHOMA 4-H SHOOTING SPORTS POLICY Revised June 2010 Revised June 2007 Original 1994 I. SITUATION STATEMENT The Oklahoma 4-H Shooting Sports Program started in 1982. During that time it developed into
PROFESSIONAL TREATMENT OF TEACHERS AND STUDENT ACADEMIC ACHIEVEMENT. James B. Chapman. Dissertation submitted to the Faculty of the Virginia
 PROFESSIONAL TREATMENT OF TEACHERS AND STUDENT ACADEMIC ACHIEVEMENT by James B. Chapman Dissertation submitted to the Faculty of the Virginia Polytechnic Institute and State University in partial fulfillment
Contract Language for Educators Evaluation. Table of Contents (1) Purpose of Educator Evaluation (2) Definitions (3) (4)
 Purpose of Educator Evaluation (2) Definitions (3) (4)") Table of Contents (1) Purpose of Educator Evaluation (2) Definitions (3) (4) Evidence Used in Evaluation Rubric (5) Evaluation Cycle: Training (6) Evaluation Cycle: Annual Orientation (7) Evaluation Cycle:
Table of Contents (1) Purpose of Educator Evaluation (2) Definitions (3) (4) Evidence Used in Evaluation Rubric (5) Evaluation Cycle: Training (6) Evaluation Cycle: Annual Orientation (7) Evaluation Cycle:
Education in Armenia. Mher Melik-Baxshian I. INTRODUCTION
 Education in Armenia Mher Melik-Baxshian I. INTRODUCTION Education has always received priority in Armenia a country that has a history of literacy going back 1,600 years. From the very beginning the school
Colorado State University Department of Construction Management. Assessment Results and Action Plans
 Colorado State University Department of Construction Management Assessment Results and Action Plans Updated: Spring 2015 Table of Contents Table of Contents... 2 List of Tables... 3 Table of Figures...
TEXAS CHRISTIAN UNIVERSITY M. J. NEELEY SCHOOL OF BUSINESS CRITERIA FOR PROMOTION & TENURE AND FACULTY EVALUATION GUIDELINES 9/16/85*
 TEXAS CHRISTIAN UNIVERSITY M. J. NEELEY SCHOOL OF BUSINESS CRITERIA FOR PROMOTION & TENURE AND FACULTY EVALUATION GUIDELINES 9/16/85* Effective Fall of 1985 Latest Revision: April 9, 2004 I. PURPOSE AND
NORTH CAROLINA VIRTUAL PUBLIC SCHOOL IN WCPSS UPDATE FOR FALL 2007, SPRING 2008, AND SUMMER 2008
 E&R Report No. 08.29 February 2009 NORTH CAROLINA VIRTUAL PUBLIC SCHOOL IN WCPSS UPDATE FOR FALL 2007, SPRING 2008, AND SUMMER 2008 Authors: Dina Bulgakov-Cooke, Ph.D., and Nancy Baenen ABSTRACT North
Higher education is becoming a major driver of economic competitiveness
 Executive Summary Higher education is becoming a major driver of economic competitiveness in an increasingly knowledge-driven global economy. The imperative for countries to improve employment skills calls
Table of Contents. Internship Requirements 3 4. Internship Checklist 5. Description of Proposed Internship Request Form 6. Student Agreement Form 7
 Table of Contents Section Page Internship Requirements 3 4 Internship Checklist 5 Description of Proposed Internship Request Form 6 Student Agreement Form 7 Consent to Release Records Form 8 Internship
Segmentation Study of Tulsa Area Higher Education Needs Ages 36+ March Prepared for: Conducted by:
 Segmentation Study of Tulsa Area Higher Education Needs Ages 36+ March 2004 * * * Prepared for: Tulsa Community College Tulsa, OK * * * Conducted by: Render, vanderslice & Associates Tulsa, Oklahoma Project
A THESIS. By: IRENE BRAINNITA OKTARIN S
 THE EFFECTIVENESS OF BLENDED LEARNING TO TEACH WRITING VIEWED FROM STUDENTS CREATIVITY (An Experimental Study at the English Education Department of Slamet Riyadi University in the Academic Year of 2014/2015)
Oklahoma State University Policy and Procedures
 Oklahoma State University Policy and Procedures REAPPOINTMENT, PROMOTION AND TENURE PROCESS FOR RANKED FACULTY 2-0902 ACADEMIC AFFAIRS September 2015 PURPOSE The purpose of this policy and procedures letter
Effective practices of peer mentors in an undergraduate writing intensive course
 Effective practices of peer mentors in an undergraduate writing intensive course April G. Douglass and Dennie L. Smith * Department of Teaching, Learning, and Culture, Texas A&M University This article
THE INFLUENCE OF COOPERATIVE WRITING TECHNIQUE TO TEACH WRITING SKILL VIEWED FROM STUDENTS CREATIVITY
 THE INFLUENCE OF COOPERATIVE WRITING TECHNIQUE TO TEACH WRITING SKILL VIEWED FROM STUDENTS CREATIVITY (An Experimental Research at the Fourth Semester of English Department of Slamet Riyadi University,
Karla Brooks Baehr, Ed.D. Senior Advisor and Consultant The District Management Council
 Karla Brooks Baehr, Ed.D. Senior Advisor and Consultant The District Management Council This paper aims to inform the debate about how best to incorporate student learning into teacher evaluation systems
SASKATCHEWAN MINISTRY OF ADVANCED EDUCATION
 SASKATCHEWAN MINISTRY OF ADVANCED EDUCATION Report March 2017 Report compiled by Insightrix Research Inc. 1 3223 Millar Ave. Saskatoon, Saskatchewan T: 1-866-888-5640 F: 1-306-384-5655 Table of Contents
Testimony to the U.S. Senate Committee on Health, Education, Labor and Pensions. John White, Louisiana State Superintendent of Education
 Testimony to the U.S. Senate Committee on Health, Education, Labor and Pensions John White, Louisiana State Superintendent of Education October 3, 2017 Chairman Alexander, Senator Murray, members of the
(Includes a Detailed Analysis of Responses to Overall Satisfaction and Quality of Academic Advising Items) By Steve Chatman
 By Steve Chatman") Report #202-1/01 Using Item Correlation With Global Satisfaction Within Academic Division to Reduce Questionnaire Length and to Raise the Value of Results An Analysis of Results from the 1996 UC Survey
Report #202-1/01 Using Item Correlation With Global Satisfaction Within Academic Division to Reduce Questionnaire Length and to Raise the Value of Results An Analysis of Results from the 1996 UC Survey
M.S. in Environmental Science Graduate Program Handbook. Department of Biology, Geology, and Environmental Science
 M.S. in Environmental Science Graduate Program Handbook Department of Biology, Geology, and Environmental Science Welcome Welcome to the Master of Science in Environmental Science (M.S. ESC) program offered
Doctoral GUIDELINES FOR GRADUATE STUDY
 Doctoral GUIDELINES FOR GRADUATE STUDY DEPARTMENT OF COMMUNICATION STUDIES Southern Illinois University, Carbondale Carbondale, Illinois 62901 (618) 453-2291 GUIDELINES FOR GRADUATE STUDY DEPARTMENT OF
Statistical Analysis of Climate Change, Renewable Energies, and Sustainability An Independent Investigation for Introduction to Statistics
 5/22/2012 Statistical Analysis of Climate Change, Renewable Energies, and Sustainability An Independent Investigation for Introduction to Statistics College of Menominee Nation & University of Wisconsin
BENCHMARK TREND COMPARISON REPORT:
 National Survey of Student Engagement (NSSE) BENCHMARK TREND COMPARISON REPORT: CARNEGIE PEER INSTITUTIONS, 2003-2011 PREPARED BY: ANGEL A. SANCHEZ, DIRECTOR KELLI PAYNE, ADMINISTRATIVE ANALYST/ SPECIALIST
Improving recruitment, hiring, and retention practices for VA psychologists: An analysis of the benefits of Title 38
 Improving recruitment, hiring, and retention practices for VA psychologists: An analysis of the benefits of Title 38 Introduction / Summary Recent attention to Veterans mental health services has again
CONNECTICUT GUIDELINES FOR EDUCATOR EVALUATION. Connecticut State Department of Education
 CONNECTICUT GUIDELINES FOR EDUCATOR EVALUATION Connecticut State Department of Education October 2017 Preface Connecticut s educators are committed to ensuring that students develop the skills and acquire
AB104 Adult Education Block Grant. Performance Year:
 AB104 Adult Education Block Grant Performance Year: 2015-2016 Funding source: AB104, Section 39, Article 9 Version 1 Release: October 9, 2015 Reporting & Submission Process Required Funding Recipient Content
Early Warning System Implementation Guide
 Linking Research and Resources for Better High Schools betterhighschools.org September 2010 Early Warning System Implementation Guide For use with the National High School Center s Early Warning System
POLICIES AND PROCEDURES
 UNIVERSITY OF HOUSTON - CLEAR LAKE School of Education POLICIES AND PROCEDURES December 10, 2004 Version 8.3 SCHOOL OF EDUCATION POLICIES AND PROCEDURES TABLE OF CONTENTS SECTION TITLE PAGE PREAMBLE...
Intellectual Property
 Intellectual Property Section: Chapter: Date Updated: IV: Research and Sponsored Projects 4 December 7, 2012 Policies governing intellectual property related to or arising from employment with The University
Australia s tertiary education sector
 Australia s tertiary education sector TOM KARMEL NHI NGUYEN NATIONAL CENTRE FOR VOCATIONAL EDUCATION RESEARCH Paper presented to the Centre for the Economics of Education and Training 7 th National Conference
HDR Presentation of Thesis Procedures pro-030 Version: 2.01
 HDR Presentation of Thesis Procedures pro-030 To be read in conjunction with: Research Practice Policy Version: 2.01 Last amendment: 02 April 2014 Next Review: Apr 2016 Approved By: Academic Board Date:
WP 2: Project Quality Assurance. Quality Manual
 Ask Dad and/or Mum Parents as Key Facilitators: an Inclusive Approach to Sexual and Relationship Education on the Home Environment WP 2: Project Quality Assurance Quality Manual Country: Denmark Author:
University of Waterloo School of Accountancy. AFM 102: Introductory Management Accounting. Fall Term 2004: Section 4
 University of Waterloo School of Accountancy AFM 102: Introductory Management Accounting Fall Term 2004: Section 4 Instructor: Alan Webb Office: HH 289A / BFG 2120 B (after October 1) Phone: 888-4567 ext.
Evaluation of Hybrid Online Instruction in Sport Management
 Evaluation of Hybrid Online Instruction in Sport Management Frank Butts University of West Georgia fbutts@westga.edu Abstract The movement toward hybrid, online courses continues to grow in higher education
What is PDE? Research Report. Paul Nichols
 What is PDE? Research Report Paul Nichols December 2013 WHAT IS PDE? 1 About Pearson Everything we do at Pearson grows out of a clear mission: to help people make progress in their lives through personalized
Tentative School Practicum/Internship Guide Subject to Change
 04/2017 1 Tentative School Practicum/Internship Guide Subject to Change Practicum and Internship Packet For Students, Interns, and Site Supervisors COUN 6290 School Counseling Practicum And COUN 6291 School
SAE FOR ALL TEACHER GUIDE. Real Learning for a Real Future. Supervised Agricultural Experience
 Supervised Agricultural Experience SAE FOR ALL TEACHER GUIDE Real Learning for a Real Future A Project by The National Council for Agricultural Education TABLE OF CONTENTS Welcome to the SAE for All Teacher
University of Toronto Mississauga Degree Level Expectations. Preamble
 University of Toronto Mississauga Degree Level Expectations Preamble In December, 2005, the Council of Ontario Universities issued a set of degree level expectations (drafted by the Ontario Council of
Higher Education / Student Affairs Internship Manual
 ELMP 8981 & ELMP 8982 Administrative Internship Higher Education / Student Affairs Internship Manual College of Education & Human Services Department of Education Leadership, Management & Policy Table
VI-1.12 Librarian Policy on Promotion and Permanent Status
 University of Baltimore VI-1.12 Librarian Policy on Promotion and Permanent Status Approved by University Faculty Senate 2/11/09 Approved by Attorney General s Office 2/12/09 Approved by Provost 2/24/09
Guidelines for Incorporating Publication into a Thesis. September, 2015
 Guidelines for Incorporating Publication into a Thesis September, 2015 Contents 1 Executive Summary... 2 2 More information... 2 3 Guideline Provisions... 2 3.1 Background... 2 3.2 Key Principles... 3
Kelso School District and Kelso Education Association Teacher Evaluation Process (TPEP)
") Kelso School District and Kelso Education Association 2015-2017 Teacher Evaluation Process (TPEP) Kelso School District and Kelso Education Association 2015-2017 Teacher Evaluation Process (TPEP) TABLE
Kelso School District and Kelso Education Association 2015-2017 Teacher Evaluation Process (TPEP) Kelso School District and Kelso Education Association 2015-2017 Teacher Evaluation Process (TPEP) TABLE
Knowledge management styles and performance: a knowledge space model from both theoretical and empirical perspectives
 University of Wollongong Research Online University of Wollongong Thesis Collection University of Wollongong Thesis Collections 2004 Knowledge management styles and performance: a knowledge space model
Greek Teachers Attitudes toward the Inclusion of Students with Special Educational Needs
 American Journal of Educational Research, 2014, Vol. 2, No. 4, 208-218 Available online at http://pubs.sciepub.com/education/2/4/6 Science and Education Publishing DOI:10.12691/education-2-4-6 Greek Teachers
Principal vacancies and appointments
 Principal vacancies and appointments 2009 10 Sally Robertson New Zealand Council for Educational Research NEW ZEALAND COUNCIL FOR EDUCATIONAL RESEARCH TE RŪNANGA O AOTEAROA MŌ TE RANGAHAU I TE MĀTAURANGA
School Size and the Quality of Teaching and Learning
 School Size and the Quality of Teaching and Learning An Analysis of Relationships between School Size and Assessments of Factors Related to the Quality of Teaching and Learning in Primary Schools Undertaken
School Leadership Rubrics
 School Leadership Rubrics The School Leadership Rubrics define a range of observable leadership and instructional practices that characterize more and less effective schools. These rubrics provide a metric
Delaware Performance Appraisal System Building greater skills and knowledge for educators
 Delaware Performance Appraisal System Building greater skills and knowledge for educators DPAS-II Guide (Revised) for Teachers Updated August 2017 Table of Contents I. Introduction to DPAS II Purpose of
Fort Lewis College Institutional Review Board Application to Use Human Subjects in Research
 Fort Lewis College Institutional Review Board Application to Use Human Subjects in Research Submit this application by email attachment to IRB@fortlewis.edu I believe this research qualifies for a Full
Governors and State Legislatures Plan to Reauthorize the Elementary and Secondary Education Act
 Governors and State Legislatures Plan to Reauthorize the Elementary and Secondary Education Act Summary In today s competitive global economy, our education system must prepare every student to be successful
OFFICE OF ENROLLMENT MANAGEMENT. Annual Report
 2014-2015 OFFICE OF ENROLLMENT MANAGEMENT Annual Report Table of Contents 2014 2015 MESSAGE FROM THE VICE PROVOST A YEAR OF RECORDS 3 Undergraduate Enrollment 6 First-Year Students MOVING FORWARD THROUGH
Reference to Tenure track faculty in this document includes tenured faculty, unless otherwise noted.
 PHILOSOPHY DEPARTMENT FACULTY DEVELOPMENT and EVALUATION MANUAL Approved by Philosophy Department April 14, 2011 Approved by the Office of the Provost June 30, 2011 The Department of Philosophy Faculty
Entrepreneurial Discovery and the Demmert/Klein Experiment: Additional Evidence from Germany
 Entrepreneurial Discovery and the Demmert/Klein Experiment: Additional Evidence from Germany Jana Kitzmann and Dirk Schiereck, Endowed Chair for Banking and Finance, EUROPEAN BUSINESS SCHOOL, International
State Budget Update February 2016
 State Budget Update February 2016 2016-17 BUDGET TRAILER BILL SUMMARY The Budget Trailer Bill Language is the implementing statute needed to effectuate the proposals in the annual Budget Bill. The Governor
Motivation to e-learn within organizational settings: What is it and how could it be measured?
 Motivation to e-learn within organizational settings: What is it and how could it be measured? Maria Alexandra Rentroia-Bonito and Joaquim Armando Pires Jorge Departamento de Engenharia Informática Instituto
Developing Students Research Proposal Design through Group Investigation Method
 IOSR Journal of Research & Method in Education (IOSR-JRME) e-issn: 2320 7388,p-ISSN: 2320 737X Volume 7, Issue 1 Ver. III (Jan. - Feb. 2017), PP 37-43 www.iosrjournals.org Developing Students Research
GUIDE TO EVALUATING DISTANCE EDUCATION AND CORRESPONDENCE EDUCATION
 GUIDE TO EVALUATING DISTANCE EDUCATION AND CORRESPONDENCE EDUCATION A Publication of the Accrediting Commission For Community and Junior Colleges Western Association of Schools and Colleges For use in
California s Bold Reimagining of Adult Education. Meeting of the Minds September 6, 2017
 California s Bold Reimagining of Adult Education Meeting of the Minds September 6, 2017 Adult Education in California Historically CDE State Run Program $750M (est) Ten Program Areas K12 Districts / County
Descriptive Summary of Beginning Postsecondary Students Two Years After Entry
 NATIONAL CENTER FOR EDUCATION STATISTICS Statistical Analysis Report June 994 Descriptive Summary of 989 90 Beginning Postsecondary Students Two Years After Entry Contractor Report Robert Fitzgerald Lutz
Teacher Supply and Demand in the State of Wyoming
 Teacher Supply and Demand in the State of Wyoming Supply Demand Prepared by Robert Reichardt 2002 McREL To order copies of Teacher Supply and Demand in the State of Wyoming, contact McREL: Mid-continent
FACTORS THAT INFLUENCE THE COLLEGE CHOICE PROCESS FOR AFRICAN AMERICAN STUDENTS. Melanie L. Hayden. Thesis submitted to the Faculty of the
 FACTORS THAT INFLUENCE THE COLLEGE CHOICE PROCESS FOR AFRICAN AMERICAN STUDENTS by Melanie L. Hayden Thesis submitted to the Faculty of the Virginia Polytechnic Institute and State University In partial
Providing Feedback to Learners. A useful aide memoire for mentors
 Providing Feedback to Learners A useful aide memoire for mentors January 2013 Acknowledgments Our thanks go to academic and clinical colleagues who have helped to critique and add to this document and
PROFESSIONAL INTEGRATION
 Shared Practice PROFESSIONAL INTEGRATION THE COLLÈGE DE MAISONNEUVE EXPERIMENT* SILVIE LUSSIER Educational advisor CÉGEP de Maisonneuve KATIA -- TREMBLAY Educational -- advisor CÉGEP de Maisonneuve At
Practical Research. Planning and Design. Paul D. Leedy. Jeanne Ellis Ormrod. Upper Saddle River, New Jersey Columbus, Ohio
 SUB Gfittingen 213 789 981 2001 B 865 Practical Research Planning and Design Paul D. Leedy The American University, Emeritus Jeanne Ellis Ormrod University of New Hampshire Upper Saddle River, New Jersey
Students attitudes towards physics in primary and secondary schools of Dire Dawa City administration, Ethiopia
 World Journal of Educational Research and Reviews Vol. 2(2), pp. 014-021, January, 2016. www.premierpublishers.org, ISSN: 2326-7221 WJERR Research Article Students attitudes towards physics in primary
Math Pathways Task Force Recommendations February Background
 Math Pathways Task Force Recommendations February 2017 Background In October 2011, Oklahoma joined Complete College America (CCA) to increase the number of degrees and certificates earned in Oklahoma.
FTE General Instructions
 Florida Department of Education Bureau of PK-20 Education Data Warehouse and Office of Funding and Financial Reporting FTE General Instructions 2017-18 Questions and comments regarding this publication
Procedia - Social and Behavioral Sciences 209 ( 2015 )
") Available online at www.sciencedirect.com ScienceDirect Procedia - Social and Behavioral Sciences 209 ( 2015 ) 503 508 International conference Education, Reflection, Development, ERD 2015, 3-4 July 2015,
Available online at www.sciencedirect.com ScienceDirect Procedia - Social and Behavioral Sciences 209 ( 2015 ) 503 508 International conference Education, Reflection, Development, ERD 2015, 3-4 July 2015,
Document number: 2013/ Programs Committee 6/2014 (July) Agenda Item 42.0 Bachelor of Engineering with Honours in Software Engineering
 Agenda Item 42.0 Bachelor of Engineering with Honours in Software Engineering") Document number: 2013/0006139 Programs Committee 6/2014 (July) Agenda Item 42.0 Bachelor of Engineering with Honours in Software Engineering Program Learning Outcomes Threshold Learning Outcomes for Engineering
Document number: 2013/0006139 Programs Committee 6/2014 (July) Agenda Item 42.0 Bachelor of Engineering with Honours in Software Engineering Program Learning Outcomes Threshold Learning Outcomes for Engineering
Successfully Flipping a Mathematics Classroom
 2014 Hawaii University International Conferences Science, Technology, Engineering, Math & Education June 16, 17, & 18 2014 Ala Moana Hotel, Honolulu, Hawaii Successfully Flipping a Mathematics Classroom
Student Course Evaluation Class Size, Class Level, Discipline and Gender Bias
 Student Course Evaluation Class Size, Class Level, Discipline and Gender Bias Jacob Kogan Department of Mathematics and Statistics,, Baltimore, MD 21250, U.S.A. kogan@umbc.edu Keywords: Abstract: World
ScienceDirect. Noorminshah A Iahad a *, Marva Mirabolghasemi a, Noorfa Haszlinna Mustaffa a, Muhammad Shafie Abd. Latif a, Yahya Buntat b
 Available online at www.sciencedirect.com ScienceDirect Procedia - Social and Behavioral Scien ce s 93 ( 2013 ) 2200 2204 3rd World Conference on Learning, Teaching and Educational Leadership WCLTA 2012
BSM 2801, Sport Marketing Course Syllabus. Course Description. Course Textbook. Course Learning Outcomes. Credits.
 BSM 2801, Sport Marketing Course Syllabus Course Description Examines the theoretical and practical implications of marketing in the sports industry by presenting a framework to help explain and organize
PUBLIC SCHOOL OPEN ENROLLMENT POLICY FOR INDEPENDENCE SCHOOL DISTRICT
 PUBLIC SCHOOL OPEN ENROLLMENT POLICY FOR INDEPENDENCE SCHOOL DISTRICT Policy 423.1 This policy shall be administered in accordance with the state public school open enrollment law in sections 118.51 and
Senior Project Information
 BIOLOGY MAJOR PROGRAM Senior Project Information Contents: 1. Checklist for Senior Project.... p.2 2. Timeline for Senior Project. p.2 3. Description of Biology Senior Project p.3 4. Biology Senior Project
ARTICLE XVII WORKLOAD
 ARTICLE XVII WORKLOAD 17.1 The normal college workload for unit based instructors per academic semester shall be the equivalent of fifteen (15) semester units of undergraduate instruction. The normal college
Learning Resource Center COLLECTION DEVELOPMENT POLICY
 Los Angeles Mission College Learning Resource Center COLLECTION DEVELOPMENT POLICY I. PURPOSE AND GOALS II. III. IV. SELECTION OF BOOKS Responsibility Criteria for Selection Subject Boundaries Language
ABET Criteria for Accrediting Computer Science Programs
 ABET Criteria for Accrediting Computer Science Programs Mapped to 2008 NSSE Survey Questions First Edition, June 2008 Introduction and Rationale for Using NSSE in ABET Accreditation One of the most common
Kentucky s Standards for Teaching and Learning. Kentucky s Learning Goals and Academic Expectations
 Kentucky s Standards for Teaching and Learning Included in this section are the: Kentucky s Learning Goals and Academic Expectations Kentucky New Teacher Standards (Note: For your reference, the KDE website
Alpha provides an overall measure of the internal reliability of the test. The Coefficient Alphas for the STEP are:
 Every individual is unique. From the way we look to how we behave, speak, and act, we all do it differently. We also have our own unique methods of learning. Once those methods are identified, it can make
CONTINUUM OF SPECIAL EDUCATION SERVICES FOR SCHOOL AGE STUDENTS
 CONTINUUM OF SPECIAL EDUCATION SERVICES FOR SCHOOL AGE STUDENTS No. 18 (replaces IB 2008-21) April 2012 In 2008, the State Education Department (SED) issued a guidance document to the field regarding the
STUDENT SATISFACTION IN PROFESSIONAL EDUCATION IN GWALIOR
 International Journal of Human Resource Management and Research (IJHRMR) ISSN 2249-6874 Vol. 3, Issue 2, Jun 2013, 71-76 TJPRC Pvt. Ltd. STUDENT SATISFACTION IN PROFESSIONAL EDUCATION IN GWALIOR DIVYA
Rules of Procedure for Approval of Law Schools
 Rules of Procedure for Approval of Law Schools Table of Contents I. Scope and Authority...49 Rule 1: Scope and Purpose... 49 Rule 2: Council Responsibility and Authority with Regard to Accreditation Status...
Individual Interdisciplinary Doctoral Program Faculty/Student HANDBOOK
 Individual Interdisciplinary Doctoral Program at Washington State University 2017-2018 Faculty/Student HANDBOOK Revised August 2017 For information on the Individual Interdisciplinary Doctoral Program
Programme Specification. BSc (Hons) RURAL LAND MANAGEMENT
 RURAL LAND MANAGEMENT") Programme Specification BSc (Hons) RURAL LAND MANAGEMENT D GUIDE SEPTEMBER 2016 ROYAL AGRICULTURAL UNIVERSITY, CIRENCESTER PROGRAMME SPECIFICATION BSc (Hons) RURAL LAND MANAGEMENT NB The information contained
Programme Specification BSc (Hons) RURAL LAND MANAGEMENT D GUIDE SEPTEMBER 2016 ROYAL AGRICULTURAL UNIVERSITY, CIRENCESTER PROGRAMME SPECIFICATION BSc (Hons) RURAL LAND MANAGEMENT NB The information contained
Lesson M4. page 1 of 2
 Lesson M4 page 1 of 2 Miniature Gulf Coast Project Math TEKS Objectives 111.22 6b.1 (A) apply mathematics to problems arising in everyday life, society, and the workplace; 6b.1 (C) select tools, including
Spring North Carolina Community Colleges Golden LEAF Scholars Program Two-Year Colleges
 Spring 2017 North Carolina Community Colleges Instructions: Complete the following application and return to the college s Financial Aid Office. Application Deadline: March 1, 2017 March 7, 2017 Contact:
eportfolio Guide Missouri State University
 Social Studies eportfolio Guide Missouri State University Updated February 2014 Missouri State Portfolio Guide MoSPE & Conceptual Framework Standards QUALITY INDICATORS MoSPE 1: Content Knowledge Aligned
Financing Education In Minnesota
 Financing Education In Minnesota 2016-2017 Created with Tagul.com A Publication of the Minnesota House of Representatives Fiscal Analysis Department August 2016 Financing Education in Minnesota 2016-17
A FOLLOW-UP STUDY OF TEXAS TECH UNIVERSITY GRADUATES TO DETERMINE POSSIBLE FUTURE GOALS IN HOME ECONOMICS EDUCATION
 A FOLLOW-UP STUDY OF TEXAS TECH UNIVERSITY GRADUATES TO DETERMINE POSSIBLE FUTURE GOALS IN HOME ECONOMICS EDUCATION by PATRICIA ROBERTS PARTNEY, B.S. in H.E. A THESIS IN HOME ECONOMICS EDUCATION Submitted
SAMPLE AFFILIATION AGREEMENT
 SAMPLE AFFILIATION AGREEMENT AFFILIATION AGREEMENT FOR USE WITH A FOREIGN STUDY PROGRAM W I T N E S S E T H and WHEREAS, cordial relations exist between the United Stated of America and France; WHEREAS,