Segmentation Study of Tulsa Area Higher Education Needs Ages 36+ March Prepared for: Conducted by:
|
|
|
- Juliana Tyler
- 6 years ago
- Views:
Transcription
1 Segmentation Study of Tulsa Area Higher Education Needs Ages 36+ March 2004 * * * Prepared for: Tulsa Community College Tulsa, OK * * * Conducted by: Render, vanderslice & Associates Tulsa, Oklahoma Project #63304
2 TABLE OF CONTENTS INTRODUCTION CONCLUSIONS & RECOMMENDATIONS REVIEW OF FINDINGS (WITH GRAPHIC HIGHLIGHTS) APPENDICES: Copies of Questionnaire Cover Letter & Questionnaire Subgroup area map Appendix A Appendix B
3 INTRODUCTION
4 Introduction This report presents the results of a survey of Tulsa area residents regarding opinions concerning higher education needs. The study was conducted for Tulsa Community College to assist them in analyzing the general population by demographic segments. Subgroups were selected for review based on several factors, including the ability to distinctly market to these groups. The study was intended to determine needs for community college, barriers to entry, and preferred methods of communication for each segment. As a final step, segments would be summarized by size and characteristics in order to assist in setting strategies for target marketing. Research Method and Timing The survey was conducted by mail with a dollar bill incentive ( for a cup of coffee or soft drink on us while you complete the survey ). Approximately 3,750 people were invited to complete the survey. By the established cutoff date, a total of 1083 surveys were completed. Of these, 1047 were in the target age range. Approximately, 20 of these could not be classified either because race or location was not disclosed. Thus, this study presents the results of 1029 surveys of those ages over 35. Render,Vanderslice & Associates TCC Higher Education Study 4
5 Sample Composition Care was taken in the sample design so it is representative of all respondents within the framework of the project design. Tabulation Of The Data Upon receipt of all completed interviews, data was computer tabulated. and converted to graphic exhibits for easy interpretation. Results were then percentaged Report Content In addition to the Introduction, this report contains a Conclusions & Recommendations section, a Review of Findings with Graphic Highlights, and the Appendices. The Appendices consist of copies of the survey questionnaire and cover letter and a map of the Tulsa area divided into subgroups. Report users should be cautioned about placing greater reliability on the results than is warranted by the size and design of the sample or subsamples. Render,Vanderslice & Associates TCC Higher Education Study 5
6 CONCLUSIONS & RECOMMENDATIONS
7 Conclusions & Recommendations The following conclusions and recommendations are made from the outside point of view of the research firm as indicated by the findings of the survey. They are made without regard to present practices or policies of Tulsa Community College, and therefore, may not necessarily be compatible based on internal factors unknown to the research firm. The following are simply reflective of the significant results indicated by the participants in the survey. The rationale and findings leading to the conclusions may be found in the graphic section of the report. Because of the comprehensive nature of this study, only the most significant conclusions and recommendations will be noted. There are many other potential ramifications of the study. Some of the more significant findings of the study include: 1. As in the study of earlier groups, it continues to be apparent that there is a large group of students that are interested in college but do not complete a degree. This amounts to about 55% of the population. 2. Caucasians in outlying areas and areas other than South Tulsa represent the largest untapped market for TCC, followed by various ethnic minority groups. Render,Vanderslice & Associates TCC Higher Education Study 7
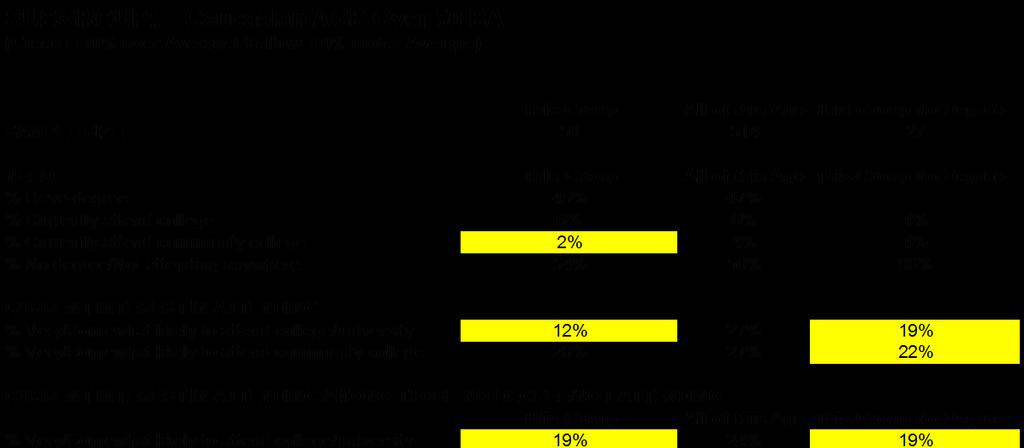
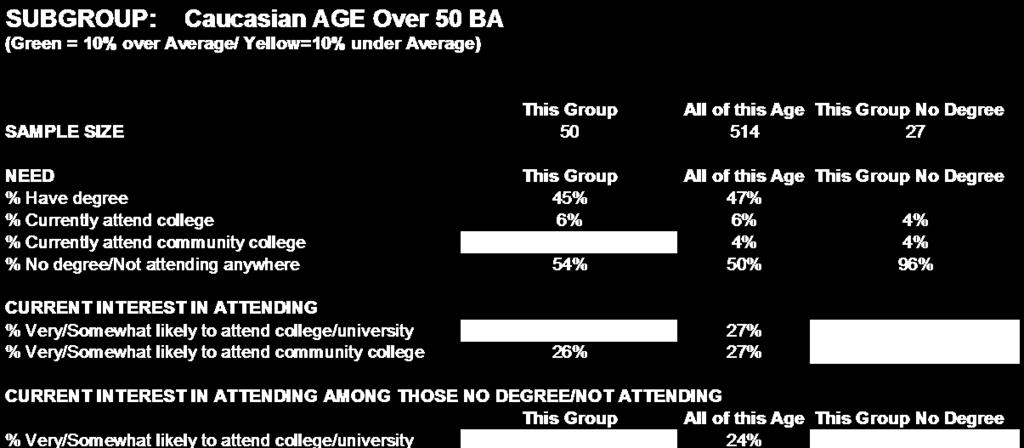
8 Conclusions & Recommendations 3. It is apparent that those who start some type of college studies at a young age (17-22) retain interest in completing a degree for a much longer time frame. 4. Caucasians in South Tulsa and Broken Arrow are by far the most likely to have degrees. Conversely, various minority groups and Caucasians from West, North, and East Tulsa, as well as outlying areas, are much less likely to complete a degree. 5. TCC s primary market appears to be those without a degree, especially those who have some college credit but not a degree. On the other hand, there is some interest in courses among those who have a degree. This is especially true among those over 50 years of age. 6. It is apparent that various factors reduce the percentage of citizens that actually follow through and complete college degrees. These factors also vary significantly by subgroups. Factors include: 7. Quality Perceptions While many get their start at a community college and then go onto a four-year institution, it is apparent some are concerned about the quality of community college. These older groups, however, are less likely to see quality as a barrier than the younger groups from the previous study. On the other hand, those from older groups often feel a community college does not offer the courses they are looking for (especially among those that already have their degree). Render,Vanderslice & Associates TCC Higher Education Study 8
9 Conclusions & Recommendations Among the subsegments, Native Americans and those Caucasian aged from South Tulsa and Broken Arrow are most likely to indicate concern about the quality/viability of community college. Cost Cost is a concern for many, especially those without degrees and those aged (with the exception of Caucasians from South Tulsa and Broken Arrow). Cost is also more of a concern for Hispanics than the other groups. Emphasizing the opportunities for scholarships, financial aid could alleviate this barrier. Methods of extended payment should be considered. Time Time is more of a concern for those in the year old age groups, most likely because more of them are still in the job force and have family obligations. Among subsegments, Hispanics aged over 50 years and Caucasians from both age groups from West Tulsa are more likely to see time as a problem. Later evening courses, weekend, and online classes are potential strategies. Experience/Comfort With College Those without degrees are far more likely to see lack of experience or comfort with college as a barrier than those with degrees. Lack of confidence in their abilities and not having prior college experience could be negated by an effective counseling or mentoring program that would raise Render,Vanderslice & Associates TCC Higher Education Study 9
10 Conclusions & Recommendations comfort levels among those who are easily overwhelmed by going to college. Accessibility Accessibility overall is not as important a barrier than others (perhaps because of the number of TCC campuses available), but it is a stronger concern for those over 50 years old than those aged Also, Hispanics and Caucasians from West Tulsa and outlying areas rate this barrier stronger than the other groups. 8. Reasons for desiring a degree varies significantly by age groups. Those are most pragmatic with two-thirds of this group saying they would complete a degree to help their employment situation. 9. As in younger groups, the top degree choices are business and medical related, but computer related fields are somewhat more popular in the over 35 year age groups than for younger people. 10. The best way to reach prospective students varies by subgroups. Using the Internet and reading the newspaper daily is higher among those with degrees, but those without degrees always read direct mail more. Also, as would be expected, those aged use the Internet more often, but use is definitely growing in the over 50 age group. Those over 50 years old read the newspaper and direct mail more often than other groups. Among subsegments, Caucasians from South Tulsa are more likely to use the Internet and read the newspaper daily, while African Americans are more likely to Render,Vanderslice & Associates TCC Higher Education Study 10
11 Conclusions & Recommendations always read direct mail. Campus visits are important to some groups, especially African Americans, Native Americans, and Caucasians from Central/East/North Tulsa over 50 years old. Finally, radio stations preferred differ among subsegments, but stations with news-talk genres stand out across the board. Render,Vanderslice & Associates TCC Higher Education Study 11
12 REVIEW OF FINDINGS WITH GRAPHIC HIGHLIGHTS
13 Census Comparison to Survey Results To determine how close this data was to actual census data, ethnicity and educational attainment was compared to census data from the Tulsa MSA (Metropolitan Statistical Area). (The Tulsa MSA includes Osage, Creek, Rogers, Wagoner, and Tulsa counties.) Survey data follows census data fairly closely, but Hispanics are somewhat underrepresented (this could relate to language barriers and suspicions about the intent of such surveys). Also the number of people with degrees is somewhat over represented in the survey likely because those with college experience are more likely to respond to a questionnaire about college. Render,Vanderslice & Associates TCC Higher Education Study 13
14 Tulsa MSA Population by Race versus Survey Results Caucasian 78% 86% African American Native American 8% 6% 6% 5% Tulsa MSA Survey Results Hispanic 2% 5% 0% 20% 40% 60% 80% 100% Note: Survey data from those over 35 only Render,Vanderslice & Associates TCC Higher Education Study 14
15 Tulsa MSA Population by Education versus Survey Results 28% Have a degree 45% Tulsa MSA Survey Results 72% No degree 55% 0% 20% 40% 60% 80% 100% Note: Survey data from those over 35 only Render,Vanderslice & Associates TCC Higher Education Study 15
16 Subgroups Selected for Analysis A total of 16 subgroups were selected for further analysis. While it might be best to further break out the ethnic groups by location, it was not practical due to the small size of subgroups. It should be noted there was a very small sample size for both age groups of Hispanics. Data for Hispanics should be referenced carefully. Render,Vanderslice & Associates TCC Higher Education Study 16
17 Size of Subgroups in Study Caucasian South Over 50 Caucasian South Caucasian Central/East/North Caucasian Central/East North Over 50 Caucasian Outlying Over 50 Caucasian Outlying Caucasian West Over 50 Caucasian BA Over 50 Caucasian BA Caucasian West African American Native American African American Over 50 Native American Over 50 Hispanic Over 50 Hispanic Render,Vanderslice & Associates TCC Higher Education Study 17
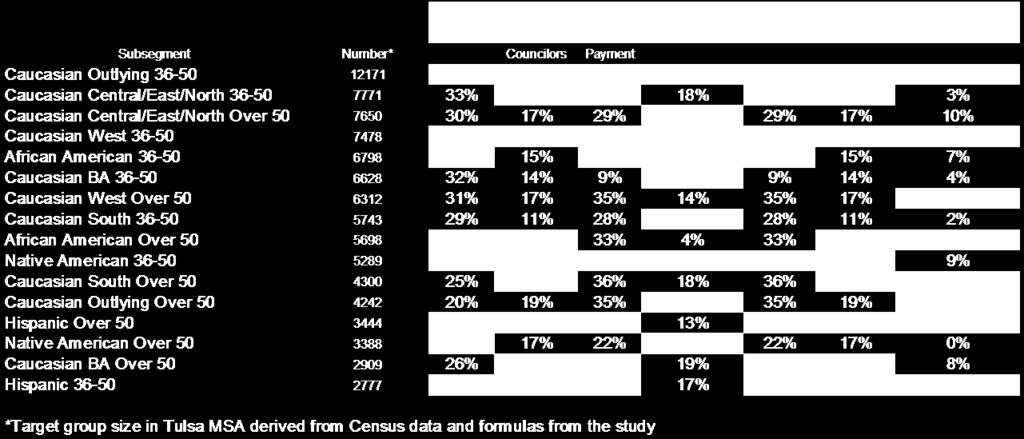
18 Size of Subgroups in the Tulsa MSA The size of Tulsa s MSA subgroups were determined by reviewing US Census data, based on population, age, ethnicity and location. A map of location definitions is shown in Appendix B. A formula was then used to determine the number of people within each subgroup who might be the best target for TCC. This formula is as follows: Population of subgroup times the percent of those within the subgroup with no degree, not presently attending college but saying they are interested in attending college, plus the population of the subgroup times one half of those within the subgroup with no degree, not presently attending college, and with little or no community college interest. Caucasians from outlying areas and areas other than South Tulsa are the biggest potential market, followed by various ethnic minority groups. Render,Vanderslice & Associates TCC Higher Education Study 18
19 Size of Subgroups Raw Population in Tulsa MSA Caucasian South Over 50 Caucasian Outlying Caucasian South Caucasian Central/East/North Over 50 Caucasian Central/East/North Caucasian West Over 50 Caucasian West Caucasian BA Caucasian Outlying Over 50 Caucasian BA Over 50 African American African American Over 50 Native American Native American Over 50 Hispanic Hispanic Over Note: Based on US Census data Render,Vanderslice & Associates TCC Higher Education Study 19
20 Size of Subgroups Target Group Size in Tulsa MSA (Those with no degree/not attending college and interested in CC plus half of those with no degree/not attending college with little/no CC interest) Caucasian Outlying Caucasian Central/East/North Caucasian Central/East/North Over 50 Caucasian West African American Caucasian BA Caucasian West Over 50 Caucasian South African American Over 50 Native American Caucasian South Over 50 Caucasian Outlying Over 50 Hispanic Over 50 Native American Over 50 Caucasian BA Over 50 Hispanic Note: Based on US Census data times factors from study Render,Vanderslice & Associates TCC Higher Education Study 20
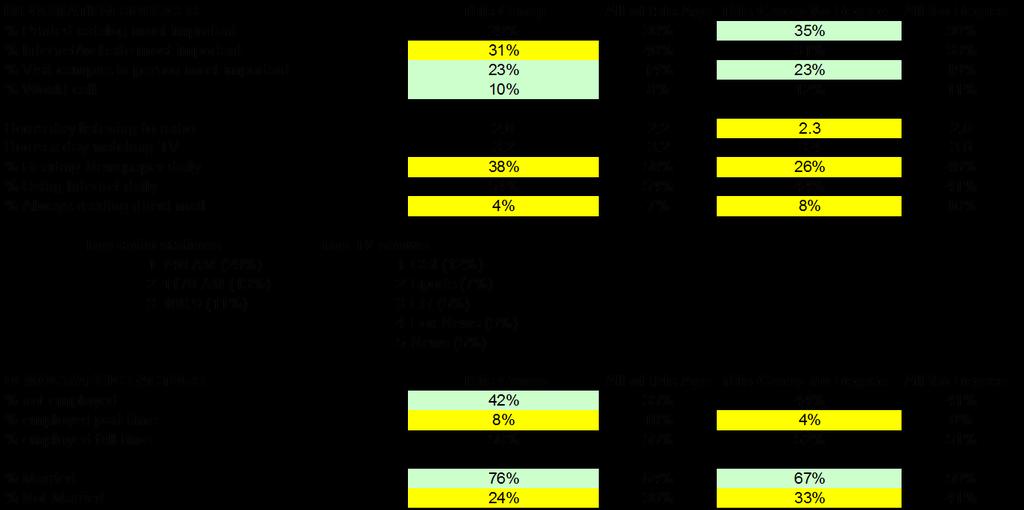
21 Basic Demographic Breakdown of the Sample Among those with degrees, 78% of year olds are employed full time and 74% are married. (The percentages vary further by the 16 subgroups.) Among the over 50 year olds with degrees, 60% are employed full time and 71% are married. (Again, the percentages vary by the 16 subgroups.) In both age groups, the number of people employed full time or married goes down when you look at those without degrees alone. For year olds without degrees, 64% are employed full time and 59% are married. For over 50 year olds without degrees, it falls to 61% and 59% respectively. Render,Vanderslice & Associates TCC Higher Education Study 21
22 Demographic Factors Among Year Olds Among Those With Degrees Not employed 13% Employed part time 9% Employed full time 78% Married 74% Not married 26% 0% 10% 20% 30% 40% 50% 60% 70% 80% 90% Render,Vanderslice & Associates TCC Higher Education Study 22
23 Demographic Factors Among Year Olds Among Those Without Degrees Not employed 23% Employed part time 13% Employed full time 64% Married 59% Not married 41% 0% 10% 20% 30% 40% 50% 60% 70% 80% Render,Vanderslice & Associates TCC Higher Education Study 23
24 Demographic Factors Among Over 50 Year Olds Among Those With Degrees Not employed 29% Employed part time 12% Employed full time 60% Married 71% Not married 29% 0% 10% 20% 30% 40% 50% 60% 70% 80% Render,Vanderslice & Associates TCC Higher Education Study 24
25 Demographic Factors Among Over 50 Year Olds Among Those Without Degrees Not employed 41% Employed part time 8% Employed full time 51% Married 59% Not married 41% 0% 10% 20% 30% 40% 50% 60% 70% Render,Vanderslice & Associates TCC Higher Education Study 25
26 % Employed Full Time by Subgroups Among Those With Degrees Caucasian-West Caucasian-Outlying Native American Caucasian-BA African American Over 50 Caucasian-South Hispanic Caucasian-Central/North/East Native American Over 50 Caucasian-Central/North/East Over 50 African American Caucasian-Outlying Over 50 Caucasian-South Over 50 Caucasian-West Over 50 Caucasian-BA Over 50 Hispanic Over 50 53% 50% 50% 67% 61% 57% 71% 71% 78% 76% 75% 75% 91% 89% 86% 84% 0% 10% 20% 30% 40% 50% 60% 70% 80% 90% 100% Render,Vanderslice & Associates TCC Higher Education Study 26
27 % Employed Full Time by Subgroups Among Those Without Degrees Caucasian-BA African American African American Over 50 Caucasian-West Caucasian-South Native American Caucasian-Outlying Caucasian-South Over 50 Caucasian-Central/North/East Caucasian-Outlying Over 50 Caucasian-BA Over 50 Hispanic Caucasian-West Over 50 Caucasian-Central/North/East Over 50 Hispanic Over 50 Native American Over 50 23% 52% 50% 49% 47% 45% 59% 59% 58% 61% 61% 69% 67% 67% 73% 71% 0% 10% 20% 30% 40% 50% 60% 70% 80% 90% Render,Vanderslice & Associates TCC Higher Education Study 27
28 % Married by Subgroups Hispanic Over 50 Caucasian-South Caucasian-BA Over 50 Caucasian-BA Hispanic Caucasian-South Over 50 Native American Caucasian-Outlying Caucasian-West Over 50 Caucasian-Outlying Over 50 Caucasian-Central/North/East Over 50 Caucasian-West Caucasian-Central/North/East African American Over 50 African American Native American Over 50 46% 44% 42% 59% 57% 54% 67% 66% 64% 64% 63% 76% 71% 70% 78% 92% 0% 20% 40% 60% 80% 100% Render,Vanderslice & Associates TCC Higher Education Study 28
29 Educational Need Among the sample of year olds, 45% have college degrees. Another 19% are currently attending college (this includes 7% who are currently attending community college). On the other hand, 48% of this age category do not have a degree and are not attending college. Among the sample of those over 50 years old, 47% have degrees. Another 10% are attending college (this includes 4% who are currently attending community college). There are 50% in this age group who do not have a degree and are not attending college. The percent with degrees varies by subgroups. Caucasians from South Tulsa and Broken Arrow are most likely to have degrees. African Americans, Native Americans and West Tulsans ages 36-50, and Hispanics over 50 years old are least likely. Hispanics over 50 years old are also most likely to have no degree and not be currently attending college. Render,Vanderslice & Associates TCC Higher Education Study 29
30 Need Among Year Olds Have degree 45% Currently attend college 12% Currently attend community college 7% No degree/not attending anywhere 48% 0% 10% 20% 30% 40% 50% Render,Vanderslice & Associates TCC Higher Education Study 30
31 Need Among Over 50 Year Olds Have degree 47% Currently attend college 6% Currently attend community college 4% No degree/not attending anywhere 50% 0% 10% 20% 30% 40% 50% 60% Render,Vanderslice & Associates TCC Higher Education Study 31
32 % With College Degrees Caucasian-South Over 50 Caucasian-South Caucasian-BA Over 50 Caucasian-BA Caucasian-Central/North/East Over 50 Hispanic Caucasian-Outlying Over 50 Caucasian-Central/North/East African American Over 50 Native American Over 50 Caucasian-West Over 50 Caucasian-Outlying African American Caucasian-West Native American Hispanic Over 50 15% 32% 32% 29% 25% 23% 36% 35% 40% 40% 39% 38% 45% 42% 65% 62% 0% 10% 20% 30% 40% 50% 60% 70% 80% Render,Vanderslice & Associates TCC Higher Education Study 32
33 % No Degree, Not Attending College Hispanic Over 50 Native American Caucasian-West Caucasian-West Over 50 66% 65% 77% 73% Caucasian-Outlying % African American Over 50 Caucasian-Outlying Over 50 Caucasian-Central/North/East Over 50 African American % 56% 62% 60% Native American Over 50 55% Caucasian-BA Over 50 Caucasian-BA % 53% Caucasian-Central/North/East Hispanic Caucasian-South Caucasian-South Over 50 30% 32% 40% 48% 0% 10% 20% 30% 40% 50% 60% 70% 80% 90% Render,Vanderslice & Associates TCC Higher Education Study 33
34 Intentions to Complete a College Degree As might be expected, stated intentions to complete a college degree decrease with age. On the other hand, it is interesting to note that those who start (I.e, get some college credit) remain more committed to the idea of getting a degree over time. Among those with some college credit (about 55% of the Oklahoma population) the majority claim interest in completing a degree even into retirement ages. Interest in community college is fairly high, especially among those aged with some college credit. Render,Vanderslice & Associates TCC Higher Education Study 34
35 Intentions to Get College Degree By Current Higher Educational Status AGE No degree/not attending/never attended 47% No degree/not attending/attended in the past 68% No degree/attending now 81% AGE Over 50 No degree/not attending/never attended 23% No degree/not attending/attended in the past 45% No degree/attending now 100% 0% 20% 40% 60% 80% 100% Render,Vanderslice & Associates TCC Higher Education Study 35
36 % Intending to Get College Degree By current higher educational status 81% 81% 73% 68% 58% 47% 45% No Degree/Not Attending/Attended in the Past No Degree/Not Attending/Never Attended 23% Over 50 Render,Vanderslice & Associates TCC Higher Education Study 36
37 Type of Degree Desired By Current Situation AGE No degree/not attending/never attended No degree/not attending/attended in the past No degree/attending now 31% 16% 23% 28% 45% 53% AGE Over 50 No degree/not attending/never attended No degree/not attending/attended in the past No degree/attending now 8% 15% 17% 20% 28% 80% 4 Year Degree+ 2 Year Degree 0% 20% 40% 60% 80% 100% Render,Vanderslice & Associates TCC Higher Education Study 37
38 % Interested in Community College By Current Situation AGE No degree/not attending/never attended 42% No degree/not attending/attended in the past No degree/attending now Have degree 13% 26% 52% AGE Over 50 No degree/not attending/never attended No degree/not attending/attended in the past No degree/attending now Have degree 6% 20% 24% 27% 0% 10% 20% 30% 40% 50% 60% Render,Vanderslice & Associates TCC Higher Education Study 38
39 Interest in Community College Among Those With No Degree/Not Attending/Never Attended Comparison Including Younger Age Groups % % % Over 50 20% 0% 10% 20% 30% 40% 50% 60% Render,Vanderslice & Associates TCC Higher Education Study 39
40 Interest in Community College Among Those With No Degree/Not Attending/Attended in the Past Comparison Including Younger Age Groups % % % Over 50 24% 0% 10% 20% 30% 40% 50% 60% 70% 80% Render,Vanderslice & Associates TCC Higher Education Study 40
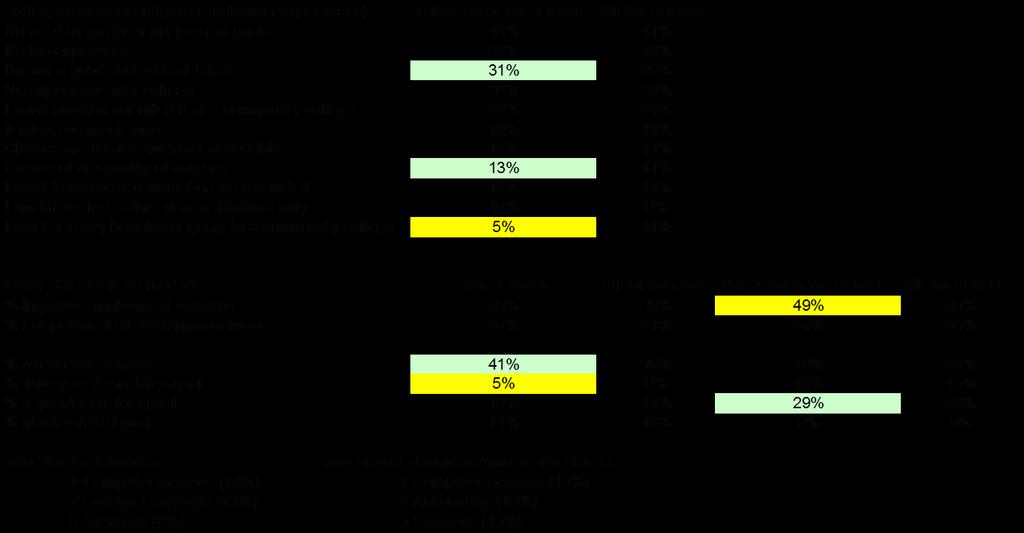
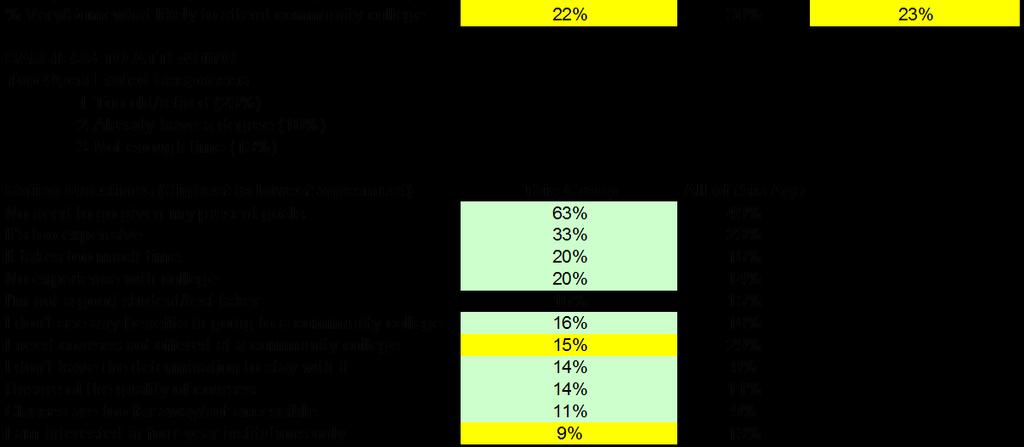
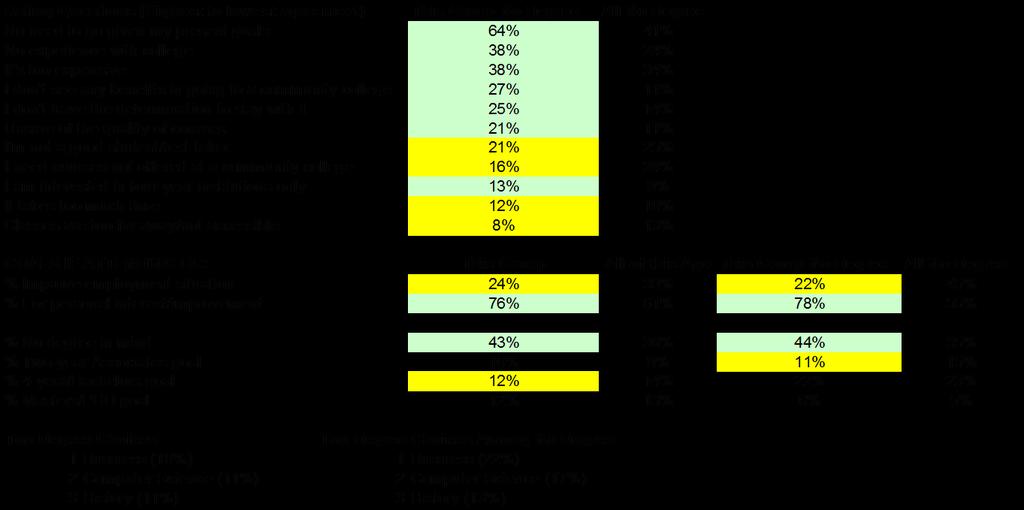
41 Barriers to Attending Community College An open-ended question was asked as to the primary reasons respondents may not attend community college. The primary reason given among year olds with degrees is that they already have their degree, followed by concerns that community college does not offer courses needed. Those in the same age category without degrees cited cost as the number one barrier, followed by lack of time. Among the over 50 year olds with degrees, already having a degree and being too old or retired were the top two responses. Among those without degrees, being too old or retired was number one barrier mentioned, followed by lack of time. Barriers differ greatly by subgroups. Over 50 year old Native Americans are most concerned that community college does not meet their needs or is not of high enough quality. Hispanics ages over 50 years old are most concerned about accessibility. Caucasians aged from West Tulsa with no degree and Hispanics with no degree are most concerned about cost. Render,Vanderslice & Associates TCC Higher Education Study 41
42 Top Barriers to Attending Community College Among Year Olds With Degrees (Responses to an open-ended question) Already have a degree 31% Do not offer courses needed 20% Not enough time No need 9% 13% Already went to a community college Go/planning to go to a different school Cost Not interested Too old/retired No further education plans 4% 4% 3% 2% 2% 2% 0% 5% 10% 15% 20% 25% 30% 35% Render,Vanderslice & Associates TCC Higher Education Study 42
43 Top Barriers to Attending Community College Among Year Olds Without Degrees (Responses to an open-ended question) Cost Not enough time Too old/retired Do not offer courses needed No need Not interested Already go/planning to go to a different school Want to spend time with family Health reasons 8% 6% 6% 5% 4% 3% 3% 13% 23% 0% 5% 10% 15% 20% 25% 30% Render,Vanderslice & Associates TCC Higher Education Study 43
44 Top Barriers to Attending Community College Among Over 50 Year Olds With Degrees (Responses to an open-ended question) Already have a degree 30% Too old/retired 18% Do not offer courses needed 13% Not enough time 11% Already go/planning to go to a different school Cost 3% 3% Not interested 3% 0% 5% 10% 15% 20% 25% 30% 35% Render,Vanderslice & Associates TCC Higher Education Study 44
45 Top Barriers to Attending Community College Among Over 50 Year Olds Without Degrees (Responses to an open-ended question) Too old/retired 38% Not enough time 17% Cost 11% Health reasons Not interested No need Already go/planning to go to a different school Already went to a community college 6% 5% 3% 2% 2% 0% 10% 20% 30% 40% 50% Render,Vanderslice & Associates TCC Higher Education Study 45
46 % Somewhat or Strongly Agreeing to Barrier Statements Among Year Olds With Degrees No need to go given my present goals I need courses not offered at a community college It takes too much time I am interested in four-year institutions only It's too expensive Unsure of the quality of courses I don't see any benefits in going to a CC I don't have the determination to stay with it No experience with college Classes are too far away/not accessible I'm not a good student/test taker 4% 3% 3% 2% 17% 15% 13% 13% 11% 52% 63% 0% 10% 20% 30% 40% 50% 60% 70% Render,Vanderslice & Associates TCC Higher Education Study 46
47 % Somewhat or Strongly Agreeing to Barrier Statements Among Year Olds Without Degrees It's too expensive No need to go given my present goals I need courses not offered at a community college No experience with college I'm not a good student/test taker It takes too much time Unsure of the quality of courses I am interested in four-year institutions only I don't have the determination to stay with it I don't see any benefits in going to a CC Classes are too far away/not accessible 15% 12% 12% 9% 8% 22% 22% 22% 28% 31% 38% 0% 10% 20% 30% 40% 50% Render,Vanderslice & Associates TCC Higher Education Study 47
48 % Somewhat or Strongly Agreeing to Barrier Statements Among Over 50 Year Olds With Degrees No need to go given my present goals I need courses not offered at a community college I am interested in four-year institutions only It takes too much time It's too expensive Unsure of the quality of courses I don't see any benefits in going to a CC I'm not a good student/test taker Classes are too far away/not accessible I don't have the determination to stay with it No experience with college 16% 13% 10% 10% 10% 6% 6% 5% 4% 35% 57% 0% 10% 20% 30% 40% 50% 60% 70% Render,Vanderslice & Associates TCC Higher Education Study 48
49 % Somewhat or Strongly Agreeing to Barrier Statements Among Over 50 Year Olds Without Degrees No need to go given my present goals It's too expensive I'm not a good student/test taker No experience with college I need courses not offered at a community college It takes too much time I don't have the determination to stay with it Classes are too far away/not accessible I don't see any benefits in going to a CC Unsure of the quality of courses I am interested in four-year institutions only 14% 13% 11% 11% 9% 19% 25% 24% 24% 34% 41% 0% 10% 20% 30% 40% 50% Render,Vanderslice & Associates TCC Higher Education Study 49
50 % Concerned about the Quality/Viability of Community College Among Those With No Degree (Average of Unsure of quality of courses and Need courses not offered at community college ) Native American Over 50 Native American Caucasian-South Caucasian-BA African American Caucasian-Central/North/East Over 50 Caucasian-West Caucasian-Outlying Caucasian-Outlying Over 50 Caucasian-BA Over 50 Caucasian-South Over 50 Caucasian-Central/North/East Hispanic Caucasian-West Over 50 Hispanic Over 50 African American Over 50 4% 14% 13% 19% 18% 18% 17% 21% 21% 20% 20% 22% 24% 23% 28% 33% 0% 10% 20% 30% 40% Note: among those with no degree Render,Vanderslice & Associates TCC Higher Education Study 50
51 % Concerned about College Experience Among those with No Degree (Average of No experience with college and I m not a good student/test taker ) Hispanic Caucasian-Outlying Caucasian-BA Over 50 Native American African American Over 50 Caucasian-South Over 50 Hispanic Over 50 Caucasian-Central/North/East Caucasian-West Caucasian-Outlying Over 50 Caucasian-West Over 50 Native American Over 50 Caucasian-Central/North/East Over 50 African American Caucasian-BA Caucasian-South % 19% 17% 17% 17% 15% 14% 29% 26% 25% 25% 30% 30% 29% 32% 42% 0% 5% 10% 15% 20% 25% 30% 35% 40% 45% 50% Render,Vanderslice & Associates TCC Higher Education Study 51
52 % Concerned about Community College Taking Too Much Time Among those with No Degree Hispanic Over 50 Caucasian-West Caucasian-West Over 50 Native American Caucasian-Outlying African American Over 50 Caucasian-Central/North/East Caucasian-South Over 50 Hispanic Caucasian-South Caucasian-Central/North/East Over 50 African American Caucasian-BA Over 50 Caucasian-Outlying Over 50 Native American Over 50 Caucasian-BA % 15% 13% 12% 12% 11% 17% 17% 20% 20% 19% 27% 23% 22% 50% 45% 0% 10% 20% 30% 40% 50% 60% Render,Vanderslice & Associates TCC Higher Education Study 52
53 % Concerned about the Accessibility of Community College Among those with No Degree Hispanic African American Over 50 Caucasian-West Caucasian-West Over 50 Caucasian-Outlying Over 50 Caucasian-Outlying Hispanic Over 50 Caucasian-South Over 50 Caucasian-Central/North/East Over 50 Native American Caucasian-BA Over 50 African American Caucasian-BA Caucasian-Central/North/East Caucasian-South Native American Over 50 0% 4% 3% 2% 9% 8% 7% 10% 14% 13% 13% 16% 15% 21% 21% 33% 0% 5% 10% 15% 20% 25% 30% 35% 40% Render,Vanderslice & Associates TCC Higher Education Study 53
54 % Concerned about the Cost of Community College Among Those with No Degree Hispanic Hispanic Over 50 Caucasian-West African American Caucasian-Outlying Native American Caucasian-Central/North/East Caucasian-BA Over 50 Caucasian-South Over 50 Caucasian-West Over 50 Caucasian-Outlying Over 50 African American Over 50 Caucasian-Central/North/East Over 50 Caucasian-South Native American Over 50 Caucasian-BA % 22% 29% 28% 36% 35% 35% 33% 41% 40% 38% 44% 43% 50% 50% 50% 0% 10% 20% 30% 40% 50% 60% Render,Vanderslice & Associates TCC Higher Education Study 54
55 % Concerned about Motivation for College Among those with No Degree (Average of No need to go given my present goals and I don t have the determination to stay with it ) Caucasian-BA Over 50 Hispanic African American Over 50 Hispanic Over 50 29% 37% 45% 42% Caucasian-South Over 50 28% Native American Caucasian-BA Caucasian-Outlying Caucasian-Central/North/East Over 50 27% 26% 26% 26% Caucasian-West Over 50 26% Caucasian-Outlying Over 50 Caucasian-South % 21% Caucasian-Central/North/East Caucasian-West Native American Over 50 African American % 8% 17% 21% 0% 10% 20% 30% 40% 50% Render,Vanderslice & Associates TCC Higher Education Study 55
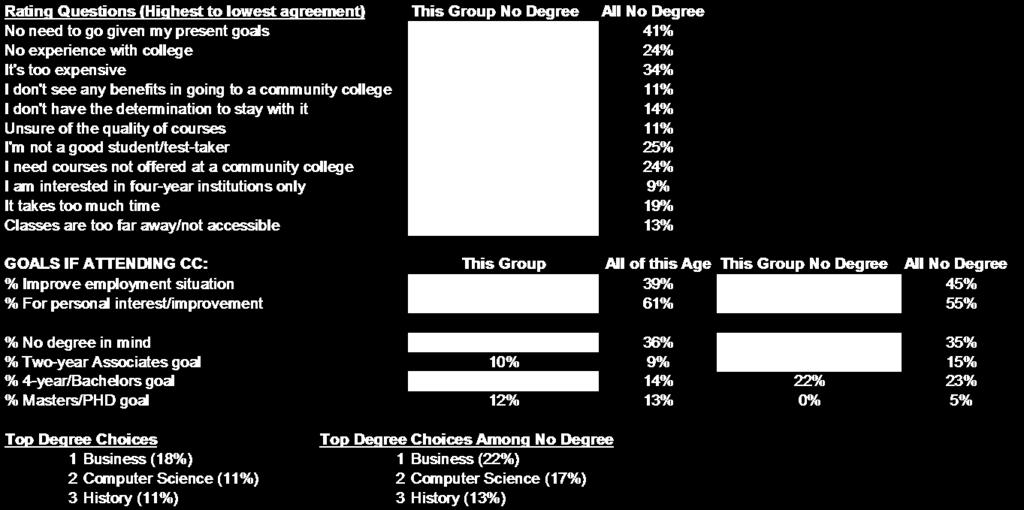
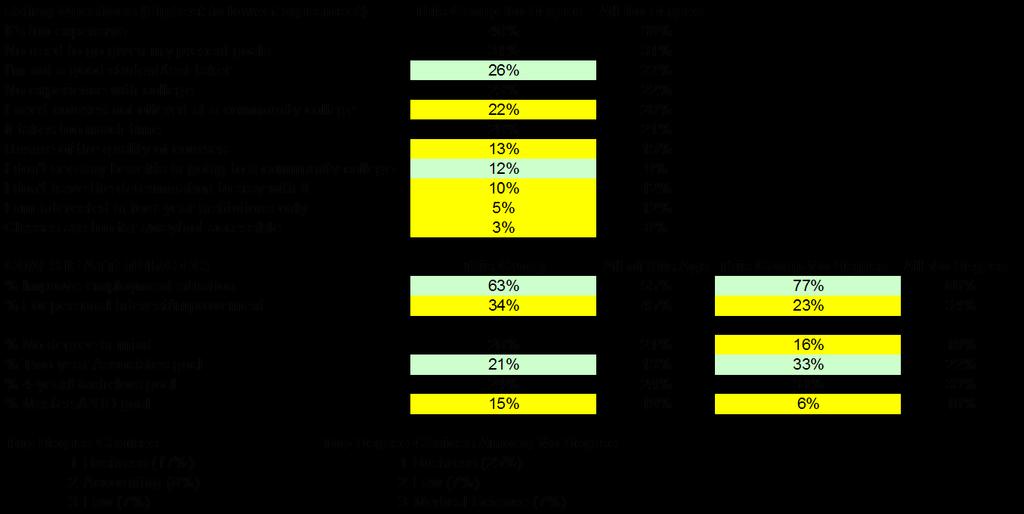
56 Goals if Attending Community College Those aged over 50 years old and those ages with degrees are more likely to attend community college for personal interests, while those ages with no degree are more likely to attend to improve their current employment situation. In terms of the type of degree desired, goals decline somewhat with age. Goals to achieve a masters degree peak at age group Goals to attend a four year degree peak at age group Goals to attend a two year degree peak at age group Render,Vanderslice & Associates TCC Higher Education Study 56
57 Goals if Attending Community College Among Year Olds With Degrees For personal interest/ improvement 59% Improve employment situation 41% Render,Vanderslice & Associates TCC Higher Education Study 57
58 Goals if Attending Community College Among Year Olds Without Degrees For personal interest/ improvement 34% Improve employment situation 66% Render,Vanderslice & Associates TCC Higher Education Study 58
59 Goals if Attending Community College Among Over 50 Year Olds With Degrees Improve employment situation 32% For personal interest/ improvement 68% Render,Vanderslice & Associates TCC Higher Education Study 59
60 Goals if Attending Community College Among Over 50 Year Olds Without Degrees For personal interest/ improvement 55% Improve employment situation 45% Render,Vanderslice & Associates TCC Higher Education Study 60
61 Eventual Degree Goal Among Year Olds With Degrees No degree in mind 25% Two-year Associates degree 2% Four-year Bachelors degree 13% Masters/PhD 33% 0% 10% 20% 30% 40% Render,Vanderslice & Associates TCC Higher Education Study 61
62 Eventual Degree Goal Among Year Olds Without Degrees No degree in mind 19% Two-year Associates degree 22% Four-year Bachelors degree 33% Masters/PhD 10% 0% 10% 20% 30% 40% Render,Vanderslice & Associates TCC Higher Education Study 62
63 Eventual Degree Goal Among Over 50 Year Olds With Degrees No degree in mind 37% Two-year Associates degree 3% Four-year Bachelors degree 5% Masters/PhD 22% 0% 10% 20% 30% 40% 50% Render,Vanderslice & Associates TCC Higher Education Study 63
64 Eventual Degree Goal Among Over 50 Year Olds Without Degrees No degree in mind 35% Two-year Associates degree 15% Four-year Bachelors degree 23% Masters/PhD 5% 0% 10% 20% 30% 40% Render,Vanderslice & Associates TCC Higher Education Study 64
65 Eventual Goal Degree Among Those With No Degree 2-Year 4-Year 43% Masters/PhD 39% 30% 33% 17% 22% 23% 13% 17% 10% 9% 15% Over 50 Render,Vanderslice & Associates TCC Higher Education Study 65
66 Degree Choices Respondents in all age categories are most likely to name various business, medical, or computer areas as their primary degree choice. (Medical includes both pre-med and support positions, including nursing and technicians.) Render,Vanderslice & Associates TCC Higher Education Study 66
67 Top Consolidated Degree Choices Among Year Olds Business 29% Medical 15% Computers 11% Liberal Arts Education Law Science Fine Arts 6% 6% 5% 5% 5% Engineering 2% Math 1% Other 6% 0% 5% 10% 15% 20% 25% 30% 35% Render,Vanderslice & Associates TCC Higher Education Study 67
68 Top Consolidated Degree Choices Among Year Olds Without Degrees Business 32% Medical 17% Computers 11% Liberal Arts Science Fine Arts Education Law Engineering 5% 5% 4% 4% 4% 3% Math 1% Other 6% 0% 10% 20% 30% 40% Render,Vanderslice & Associates TCC Higher Education Study 68
69 Top Consolidated Degree Choices Among Over 50 Year Olds Business 23% Computers 14% Medical Liberal Arts Fine Arts 10% 10% 11% Science 7% Education 5% Law Engineering 3% 3% Math 2% Other 5% 0% 5% 10% 15% 20% 25% 30% Render,Vanderslice & Associates TCC Higher Education Study 69
70 Top Consolidated Degree Choices Among Over 50 Year Olds Without Degrees Business 28% Medical Computers 14% 15% Liberal Arts Fine Arts 6% 7% Education 4% Law Engineering Math 2% 2% 2% Science 1% Other 9% 0% 5% 10% 15% 20% 25% 30% Render,Vanderslice & Associates TCC Higher Education Study 70
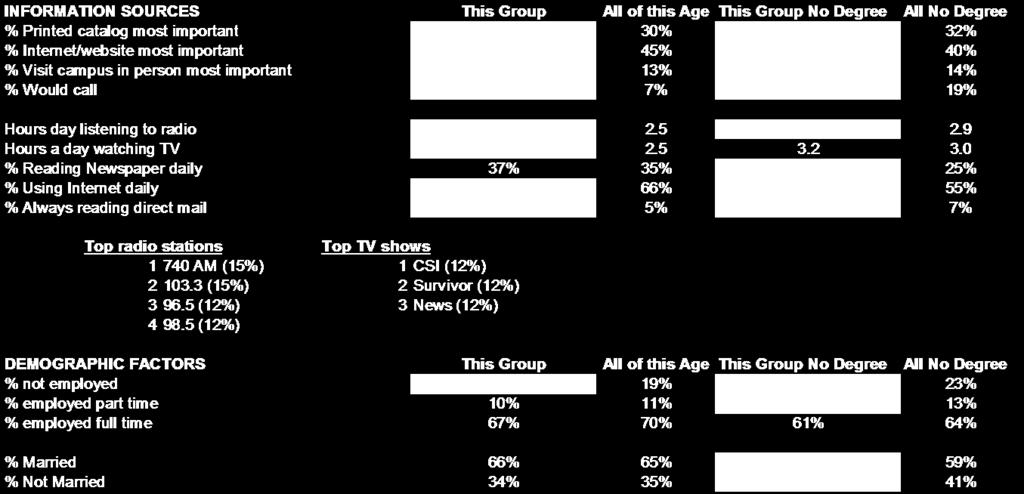
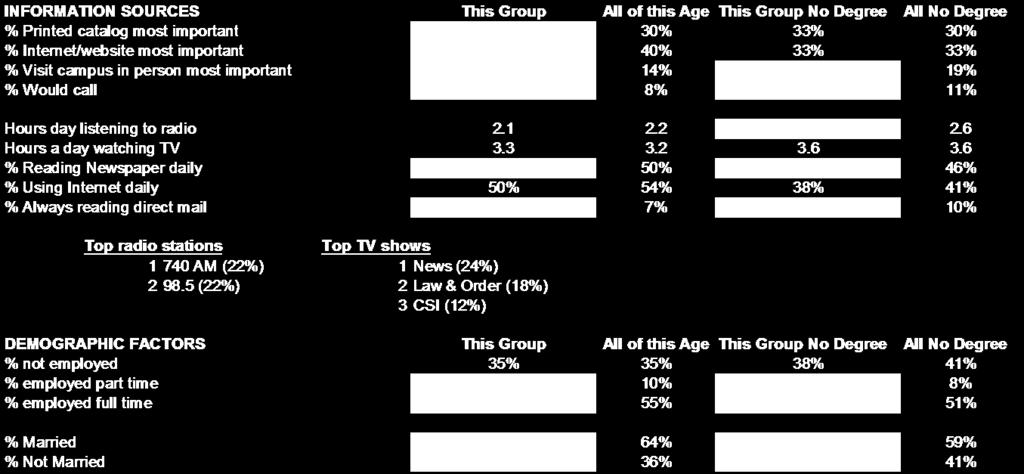
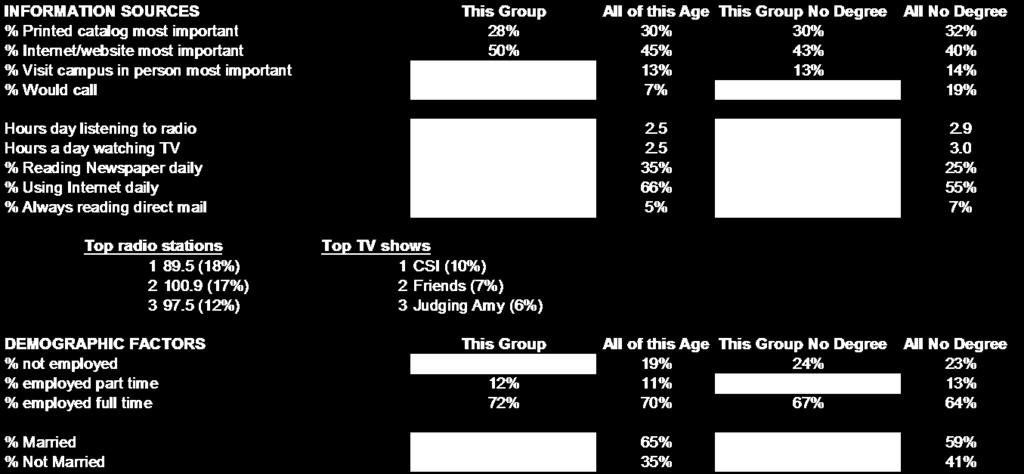
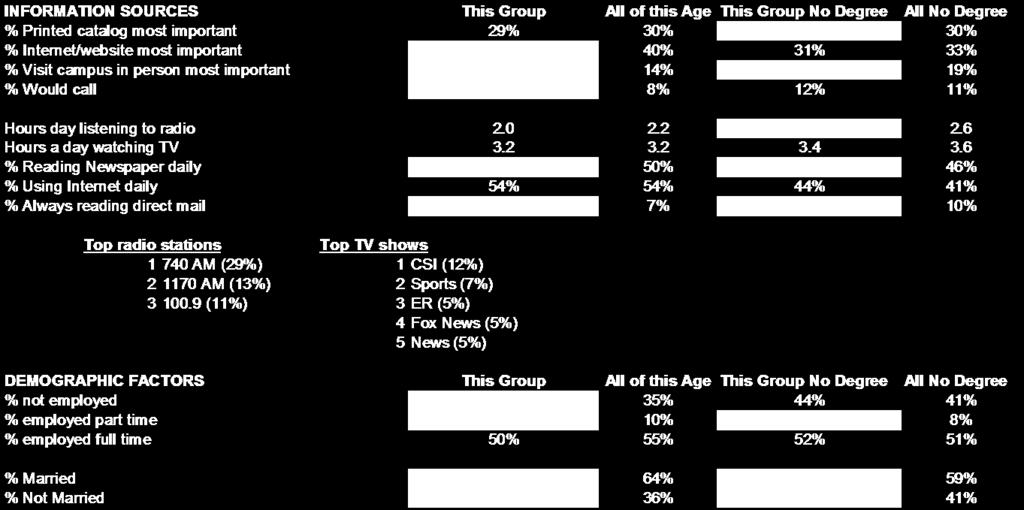
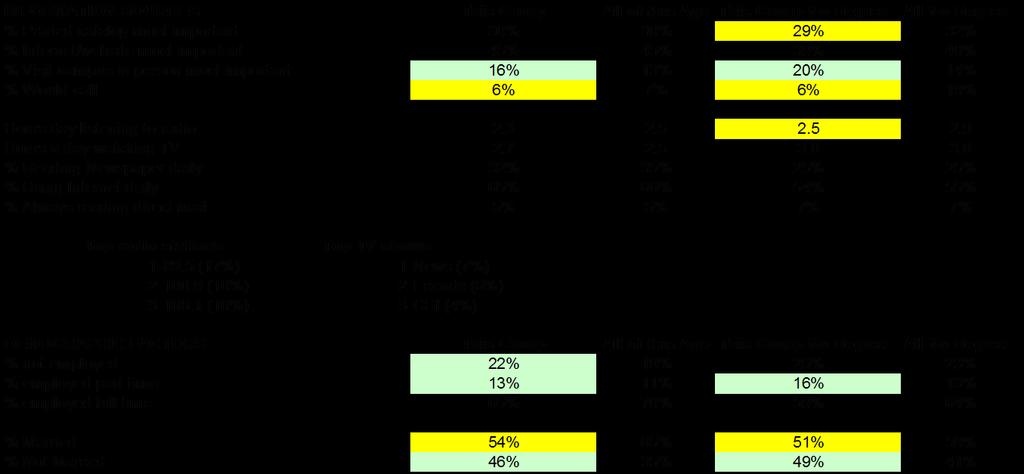
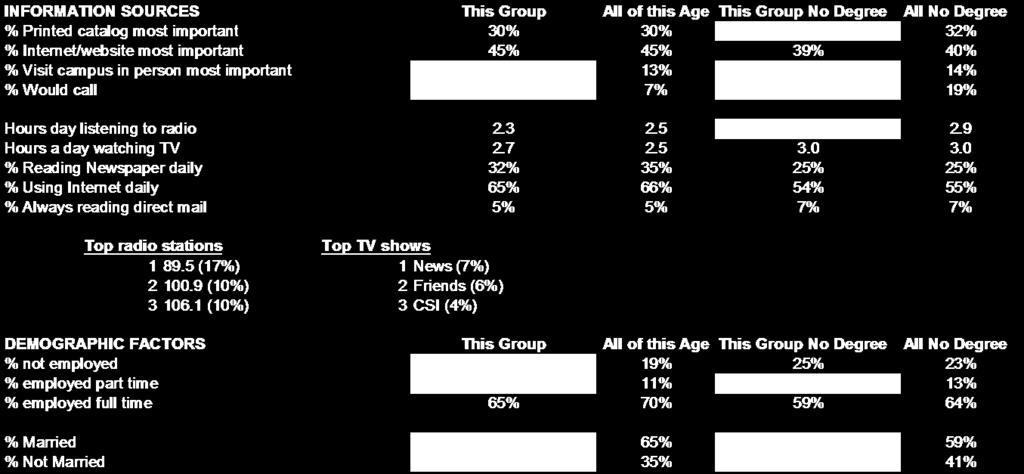
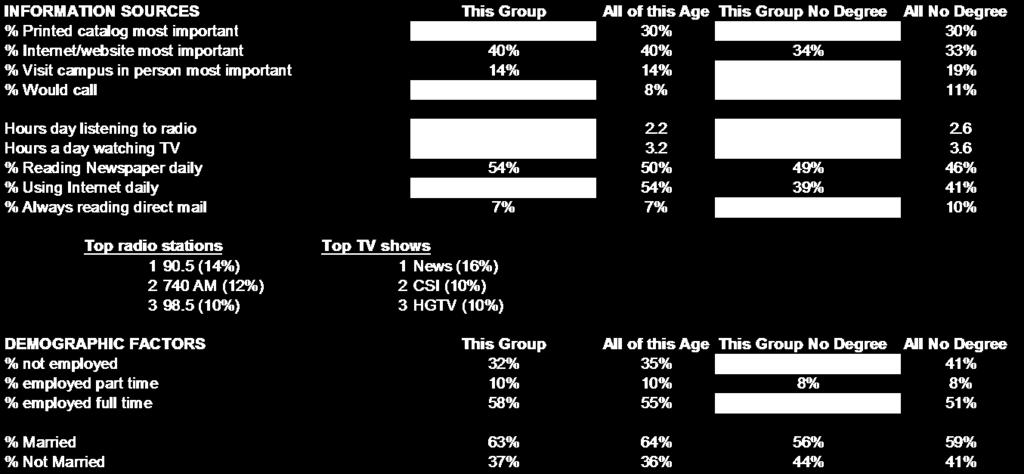
71 Information Sources On average, nearly three quarters of the sample say they use the Internet daily, while only one-fifth read the newspaper daily. Information sources also vary heavily by subgroups. For example, daily internet use declines with age, but not nearly as much as just one year ago. About half of those over 50 now say they use the internet. Internet use does vary significantly by specific subgroups. Newspaper readership is especially related to age, with the over 50 age group by far most likely to note reading the newspaper. Older age groups and various minority groups are more likely to say they always read direct mail. is more popular among Hispanics and year old Native Americans than other groups. Looking at information sources as it relates to information about community college, the Internet is most important overall, but becomes less important with age. Conversely, printed catalogs become more important with age. Render,Vanderslice & Associates TCC Higher Education Study 71
72 Information Sources Among Year Olds Use Internet daily 66% Read newspaper daily 35% Always read direct mail 5% 0% 10% 20% 30% 40% 50% 60% 70% 80% Render,Vanderslice & Associates TCC Higher Education Study 72
73 Information Sources Among Year Olds Without Degrees Use Internet daily 55% Read newspaper daily 25% Always read direct mail 7% 0% 10% 20% 30% 40% 50% 60% Render,Vanderslice & Associates TCC Higher Education Study 73
74 Information Sources Among Over 50 Year Olds Use Internet daily 54% Read newspaper daily 50% Always read direct mail 7% 0% 10% 20% 30% 40% 50% 60% Render,Vanderslice & Associates TCC Higher Education Study 74
75 Information Sources Among Over 50 Year Olds Without Degrees Read newspaper daily 46% Use Internet daily 41% Always read direct mail 10% 0% 10% 20% 30% 40% 50% Render,Vanderslice & Associates TCC Higher Education Study 75
76 Information Sources Use Internet Daily Comparisons Including Younger Age Groups % % % Over 50 54% 0% 10% 20% 30% 40% 50% 60% 70% 80% Render,Vanderslice & Associates TCC Higher Education Study 76
77 % Using the Internet Daily Among Those with No Degree Caucasian-BA Caucasian-South Hispanic Caucasian-Central/North/East Caucasian-West Over 50 Caucasian-Outlying Caucasian-South Over 50 African American Caucasian-BA Over 50 Native American Caucasian-Central/North/East Over 50 Caucasian-West Caucasian-Outlying Over 50 Native American Over 50 African American Over 50 Hispanic Over 50 9% 25% 40% 39% 39% 38% 44% 43% 53% 48% 46% 54% 53% 73% 69% 67% 0% 10% 20% 30% 40% 50% 60% 70% 80% Render,Vanderslice & Associates TCC Higher Education Study 77
78 Information Sources Read Newspaper Daily Comparisons Including Younger Age Groups % % % Over 50 50% 0% 10% 20% 30% 40% 50% 60% Render,Vanderslice & Associates TCC Higher Education Study 78
79 % Reading the Newspaper Daily Among Those with No Degree Caucasian-West Over 50 Caucasian-South Over 50 56% 52% Caucasian-Outlying Over 50 Caucasian-Central/North/East Over 50 49% 48% Hispanic Over 50 Native American Over 50 Native American Caucasian-South African American % 28% 30% 38% 45% Caucasian-BA Over 50 26% Caucasian-Central/North/East African American Over 50 25% 25% Caucasian-BA Caucasian-West Caucasian-Outlying % 23% 22% Hispanic % 0% 10% 20% 30% 40% 50% 60% Render,Vanderslice & Associates TCC Higher Education Study 79
80 Information Sources Always Read Direct Mail Comparisons Including Younger Age Groups Among Those With No Degree % % % Over 50 10% 0% 5% 10% 15% Render,Vanderslice & Associates TCC Higher Education Study 80
81 % Always Reading Direct Mail Among Those with No Degree African American Over 50 Hispanic Over 50 18% 25% Caucasian-West Native American Over 50 15% 18% African American Caucasian-West Over 50 Caucasian-South Over 50 Caucasian-Outlying Over 50 Caucasian-BA Over 50 8% 8% 8% 8% 14% Caucasian-Central/North/East % Caucasian-Central/North/East Over 50 Caucasian-Outlying % 5% Native American Caucasian-South Caucasian-BA % 2% 4% Hispanic % 0% 5% 10% 15% 20% 25% 30% Render,Vanderslice & Associates TCC Higher Education Study 81
82 Most Important Information Sources Relating to College Among Year Olds Internet/website 45% Printed catalog 30% Visit campus in person 13% Call campus 7% 0% 10% 20% 30% 40% 50% Render,Vanderslice & Associates TCC Higher Education Study 82
83 Most Important Information Sources Relating to College Among Over 50 Year Olds Internet/website 40% Printed catalog 30% Visit campus in person 14% Call campus 8% 0% 10% 20% 30% 40% 50% Render,Vanderslice & Associates TCC Higher Education Study 83
84 % Saying Campus Visit is Most Important Among Those With No Degrees African American Over 50 Native American Over 50 Caucasian-Central/North/East Over 50 Caucasian-BA Over 50 25% 25% 25% 23% Caucasian-West Over 50 23% Caucasian-Central/North/East Caucasian-West Native American Caucasian-Outlying Over 50 17% 20% 19% 18% African American % Caucasian-South Caucasian-South Over 50 13% 12% Hispanic Over 50 Caucasian-Outlying Hispanic Caucasian-BA % 0% 8% 11% 0% 5% 10% 15% 20% 25% 30% Note: among those with no degree Render,Vanderslice & Associates TCC Higher Education Study 84
85 Mass Media Use In general, year olds say they spend 2.7 hours per day watching TV. This increases to 3.2 for over 50 year olds. In addition, year olds say they spend 2.6 hours listening to radio. This drops to 2.3 hours for over 50 year olds. Mass media use also varies by subgroups. For year olds without degrees, radio stations 97.5 (Rock) and (Christian) are the favorite. This varies significantly by subgroup. Stations 740 AM (News/Talk) 92.9 (Adult Contemporary), and 98.5 (Country) are the most popular among over 50 year olds without degrees. Render,Vanderslice & Associates TCC Higher Education Study 85
86 Hours Spent Watching Television or Listening to Radio Among Year Olds Hours watching TV 2.7 Hours listening to radio Render,Vanderslice & Associates TCC Higher Education Study 86
87 Hours Spent Watching Television or Listening to Radio Among Over 50 Year Olds Hours watching TV 3.2 Hours listening to radio Render,Vanderslice & Associates TCC Higher Education Study 87
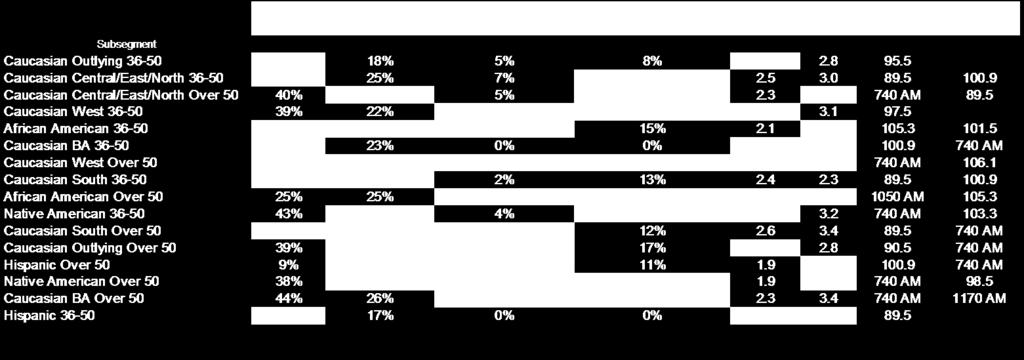
88 Hours Listening to the Radio Native American Hispanic Caucasian-Outlying African American Over 50 Caucasian-Outlying Over 50 Caucasian-West Caucasian-BA Caucasian-West Over 50 Caucasian-South Over 50 Caucasian-Central/North/East Caucasian-South Caucasian-BA Over 50 Caucasian-Central/North/East Over 50 African American Hispanic Over 50 Native American Over Note: among those with no degree Render,Vanderslice & Associates TCC Higher Education Study 88
89 Top Radio Stations Among Year Olds (Christian) 12% 89.5 (National Public Radio) 10% 97.5 (Rock) 9% 740 AM (News) 8% 95.5 (Country) 6% 1170 AM (News) 5% (Classic Rock) 5% 0% 5% 10% 15% Render,Vanderslice & Associates TCC Higher Education Study 89
90 Top Radio Stations Among Year Olds Without Degrees 97.5 (Rock) (Christian) 11% 11% 95.5 (Country) (Classic Rock) 7% 7% 740 AM (News) 6% (Today's Hits/Pop) 5% 89.5 (National Public Radio) 1170 AM (News) 92.9 (Adult Contemporary) (Alternative Rock) 4% 4% 4% 4% 0% 5% 10% 15% Render,Vanderslice & Associates TCC Higher Education Study 90
91 Top Radio Stations Among Over 50 Year Olds 740 AM (News) 19% 89.5 (National Public Radio) 11% 92.9 (Adult Contemporary) 8% 95.5 (Country) 6% (Oldies) 6% 98.5 (Country) 6% (Christian) 5% 0% 5% 10% 15% 20% 25% Render,Vanderslice & Associates TCC Higher Education Study 91
92 Top Radio Stations Among Over 50 Year Olds Without Degrees 740 AM (News) 16% 92.9 (Adult Contemporary) 98.5 (Country) 8% 8% 95.5 (Country) (Oldies) 7% 7% 99.5 (Country) 89.5 (National Public Radio) (Christian) 5% 5% 5% 90.5 (Christian) 96.5 (Adult Contemporary) 4% 4% 0% 5% 10% 15% 20% Render,Vanderslice & Associates TCC Higher Education Study 92
93 Top Radio Stations By Subgroups Year Olds: African American (Hip Hop/R&B) (Hip Hop/R&B) Hispanic 89.5 (National Public Radio) Native American 740 AM (News) (Classic Rock) Caucasian South 89.5 (National Public Radio) (Christian) Caucasian BA (Christian) 740 AM (News) Caucasian Central/East/North 89.5 (National Public Radio) (Christian)/106.1 (Oldies) Caucasian West 97.5 (Rock) (Christian)/103.3 (Classic Rock) Caucasian Outlying 95.5 (Country) 92.9 (Adult Contemporary)/97.5 (Rock) Over 50 Year Olds: African American (Hip Hop/R&B) 1050 AM (Nostalgia) Hispanic (Christian) 740 AM (News) Native American 740 AM (News) 98.5 (Country) Caucasian South 89.5 (National Public Radio) 740 AM (News) Caucasian BA 740 AM (News) 1170 AM (News) Caucasian Central/East/North 740 AM (News) 89.5 (National Public Radio) Caucasian West 740 AM (News) (Oldies) Caucasian Outlying 90.5 (Christian) 740 AM (News) Render,Vanderslice & Associates TCC Higher Education Study 93
94 Hours Watching Television Hispanic Over 50 African American Over 50 Hispanic Caucasian-Central/North/East Over 50 Caucasian-West Over 50 Native American Over 50 African American Caucasian-BA Over 50 Native American Caucasian-BA Caucasian-West Caucasian-Central/North/East Caucasian-South Over 50 Caucasian-Outlying Caucasian-Outlying Over 50 Caucasian-South Note: among those with no degree Render,Vanderslice & Associates TCC Higher Education Study 94
95 Top Television Shows Among Year Olds News 8% CSI 8% Friends 4% Survivor 4% Judging Amy 4% ER 3% Law & Order 3% 0% 2% 4% 6% 8% 10% Render,Vanderslice & Associates TCC Higher Education Study 95
96 Top Television Shows Among Over 50 Year Olds News CSI Law & Order HGTV Sports West Wing ER History Channel CNN Discovery Channel Game Shows Friends Judging Amy Fox News 2% 2% 2% 2% 2% 2% 2% 2% 3% 3% 4% 4% 9% 11% 0% 5% 10% 15% Render,Vanderslice & Associates TCC Higher Education Study 96
97 Detailed Data by Subgroups 97
98 Hispanic 98
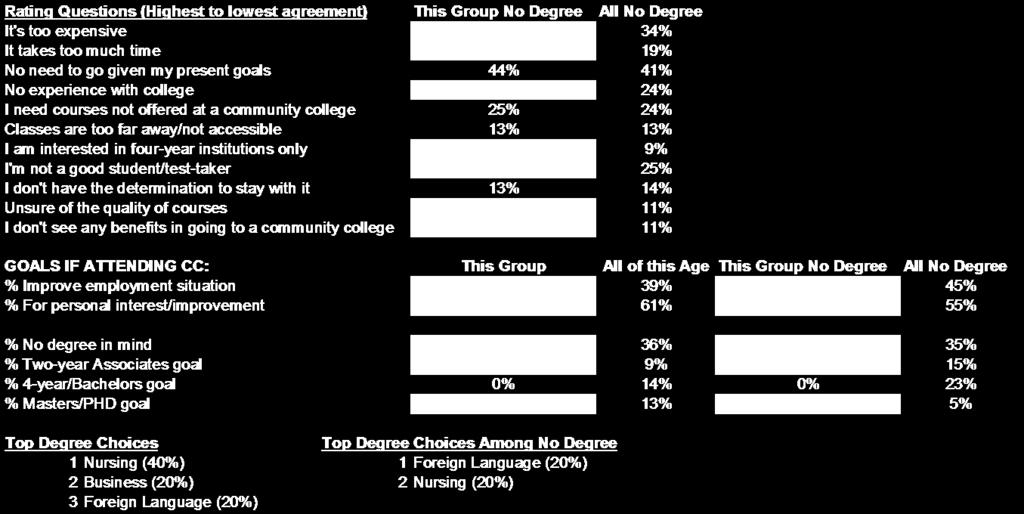
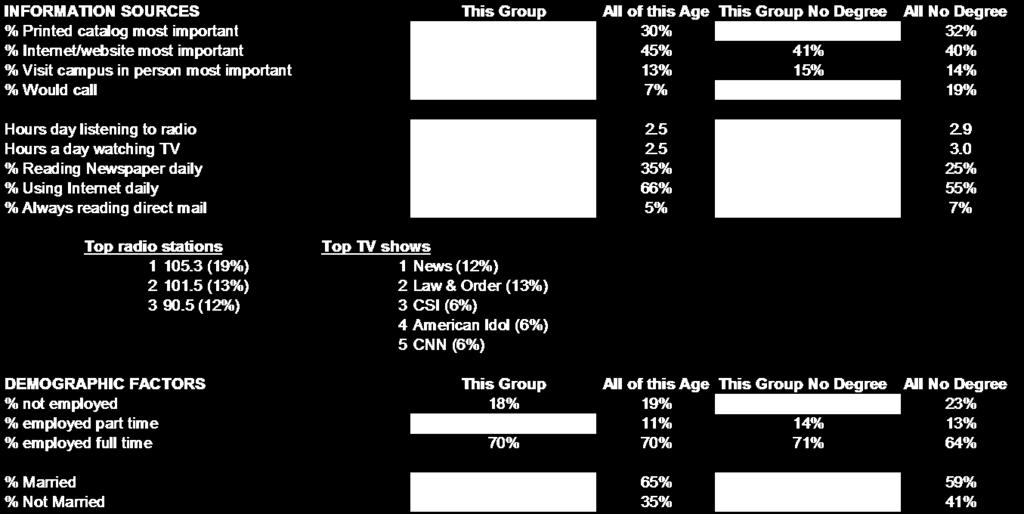
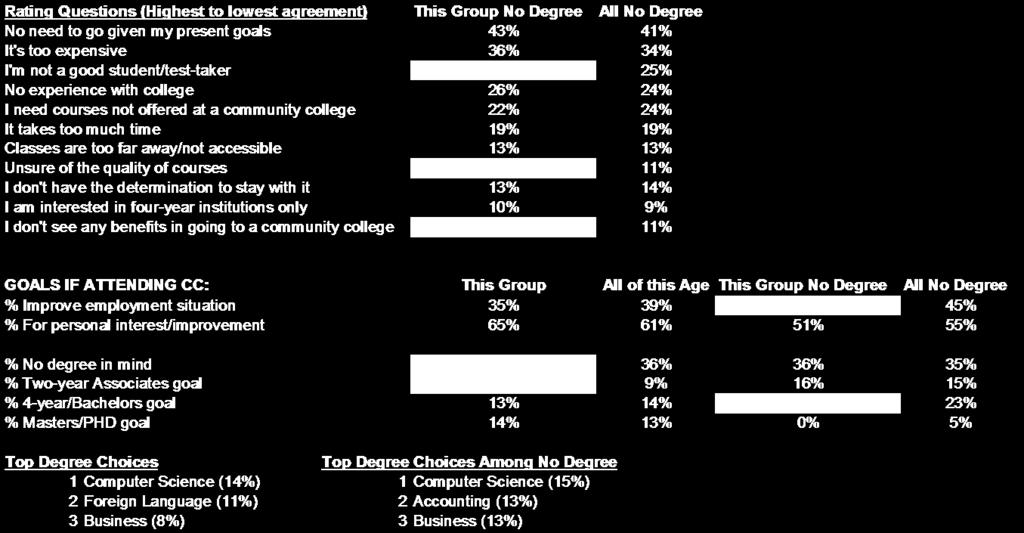
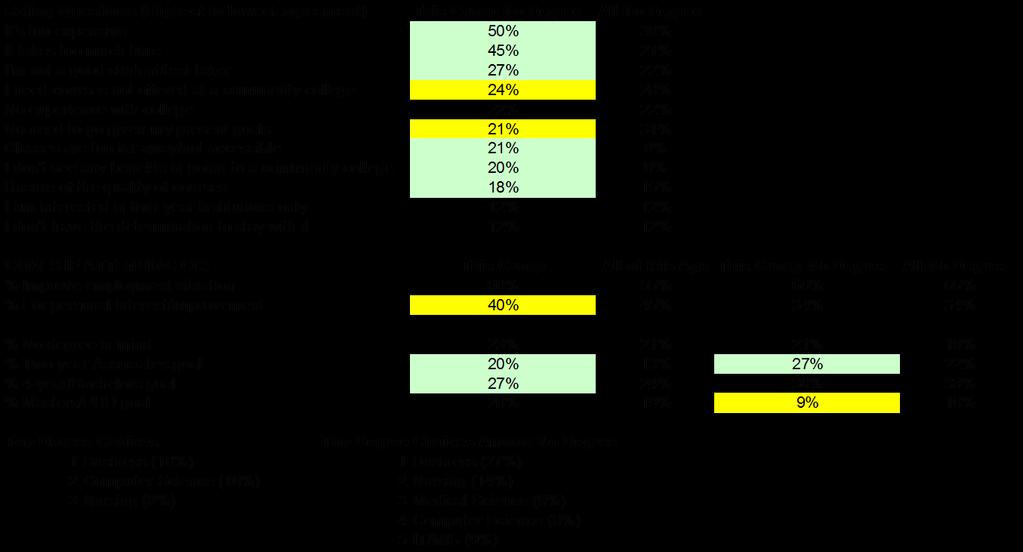
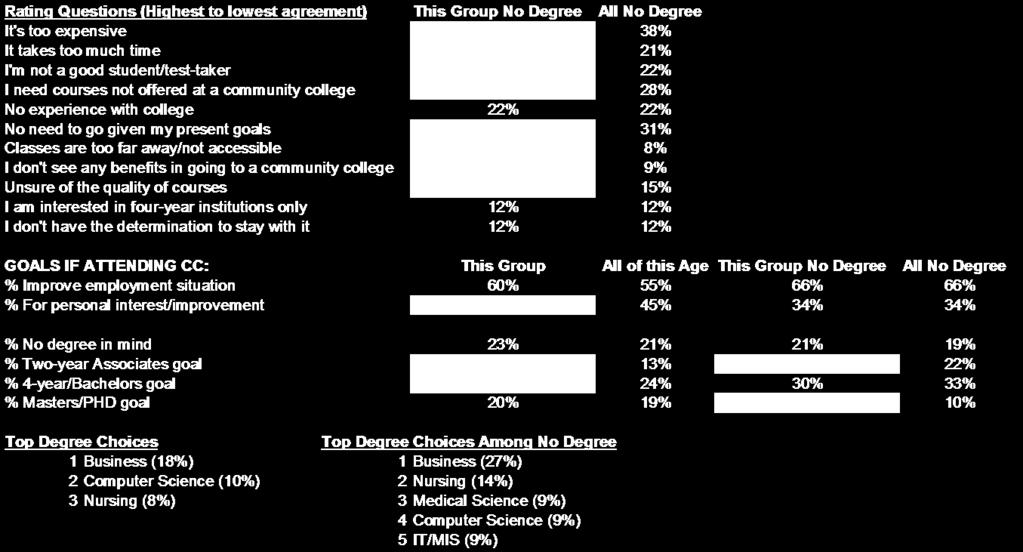
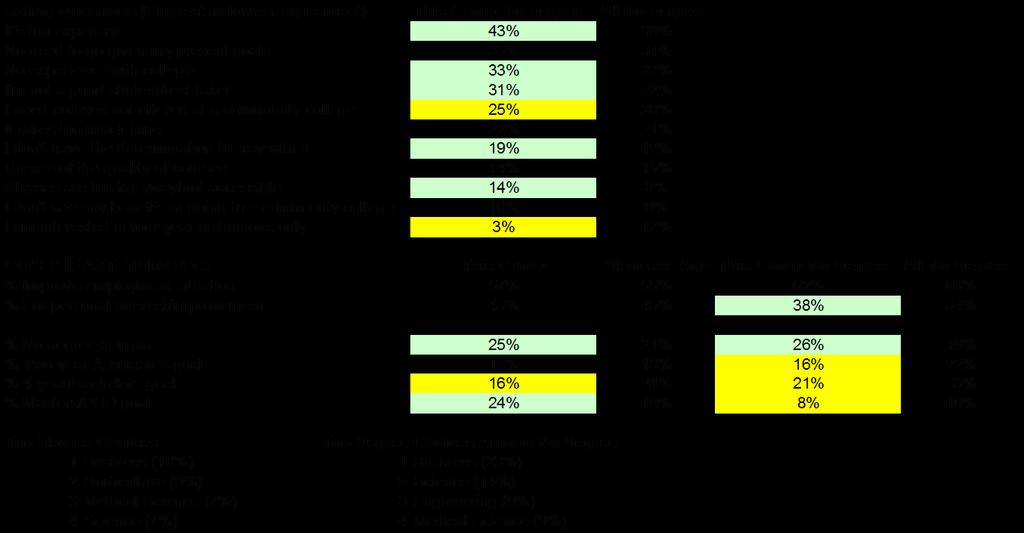
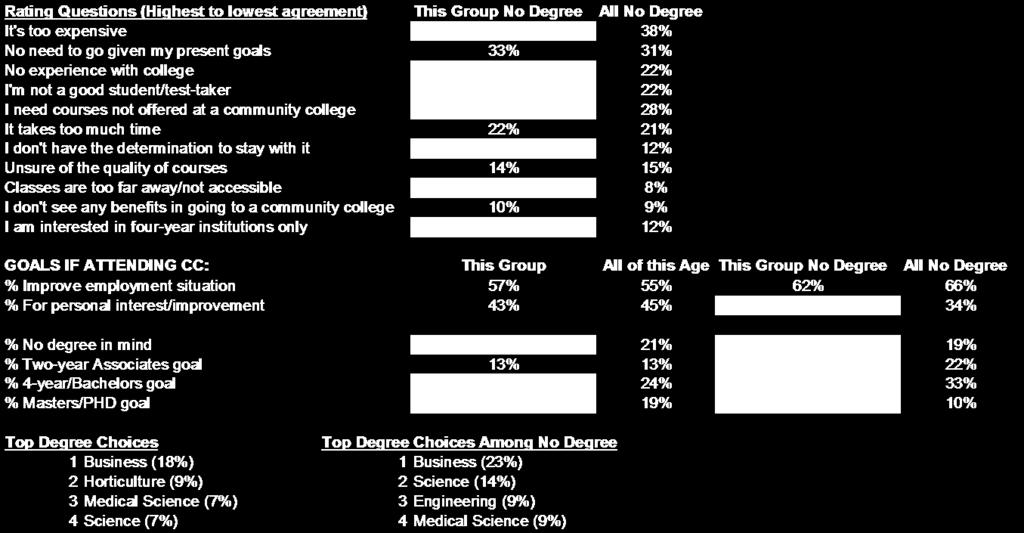
99 99 SUBGROUP: HISPANIC AGE (Green = 10% over Average/ Yellow=10% under Average) This Group All of this Age This Group No Degree All No Degree SAMPLE SIZE NEED This Group All of this Age This Group No Degree All No Degree % Have degree 40% 43% % Currently attend college 30% 12% 33% 13% % Currently attend community college 20% 7% 17% 11% % No degree/not attending anywhere 48% 67% 84% CURRENT INTEREST IN ATTENDING % Very/Somewhat likely to attend college/university 30% 40% 50% 41% % Very/Somewhat likely to attend community college 50% 36% 67% 43% CURRENT INTEREST IN ATTENDING AMONG THOSE NO DEGREE/NOT ATTENDING This Group All of this Age This Group No Degree All No Degree % Very/Somewhat likely to attend college/university 50% 47% 33% 47% % Very/Somewhat likely to attend community college 75% 49% 67% 49% BARRIERS TO ATTENDING Top Open Ended Responses 1 Not enough time (29%) 2 Already have a degree (14%) 3 Cost (14%) 4 No need (14%) 5 Language barrier (14%) Rating Questions (Highest to lowest agreement) This Group All of this Age No need to go given my present goals 60% 44% It's too expensive 60% 27% No experience with college 40% 14% Classes are too far away/not accessible 40% 7% I need courses not offered at a community college 20% 38% Unsure of the quality of courses 20% 14% It takes too much time 20% 20% I am interested in four-year institutions only 10% 17% I'm not a good student/test-taker 10% 13% I don't have the determination to stay with it 10% 9% I don't see any benefits in going to a community college 10% 10%
100 100
101 101
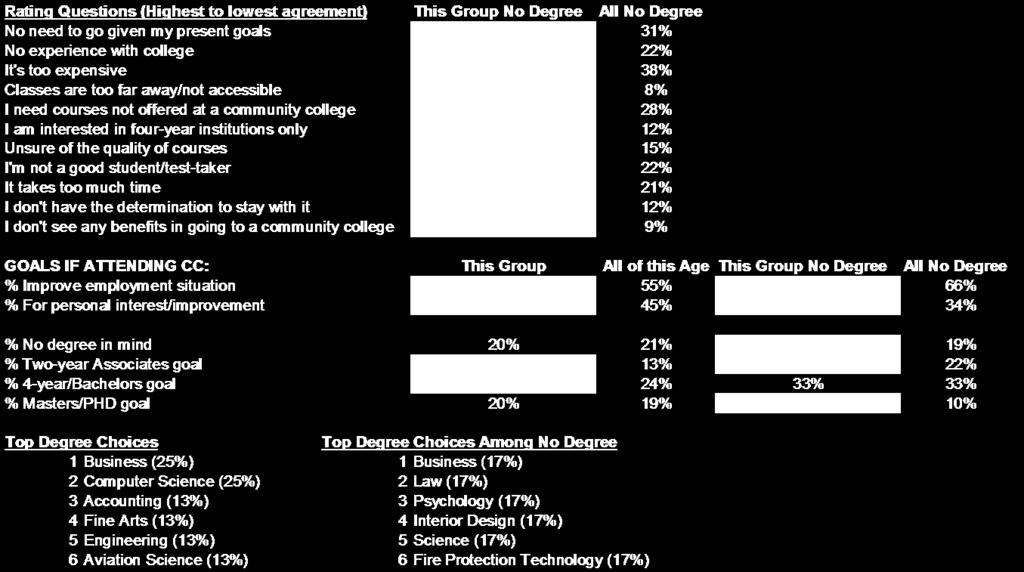
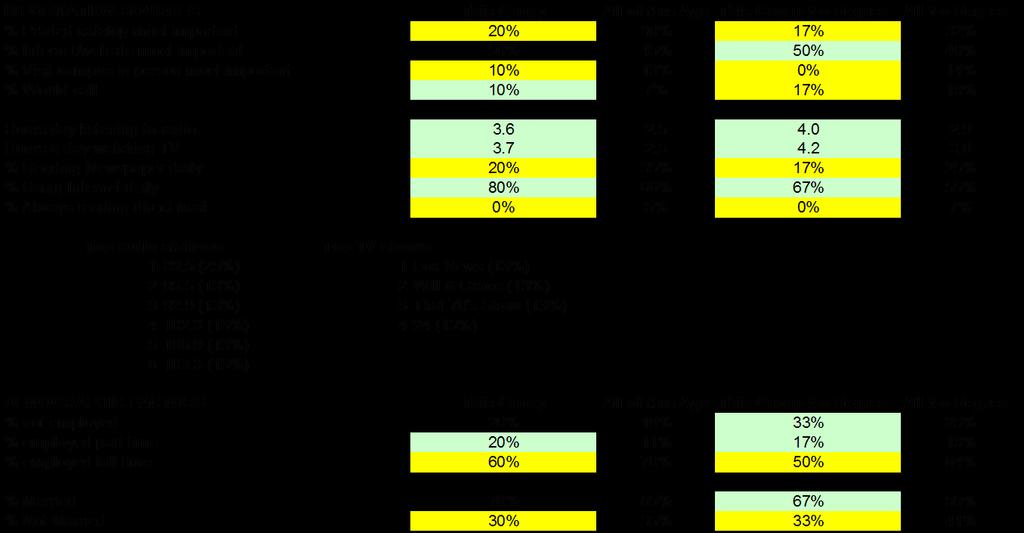
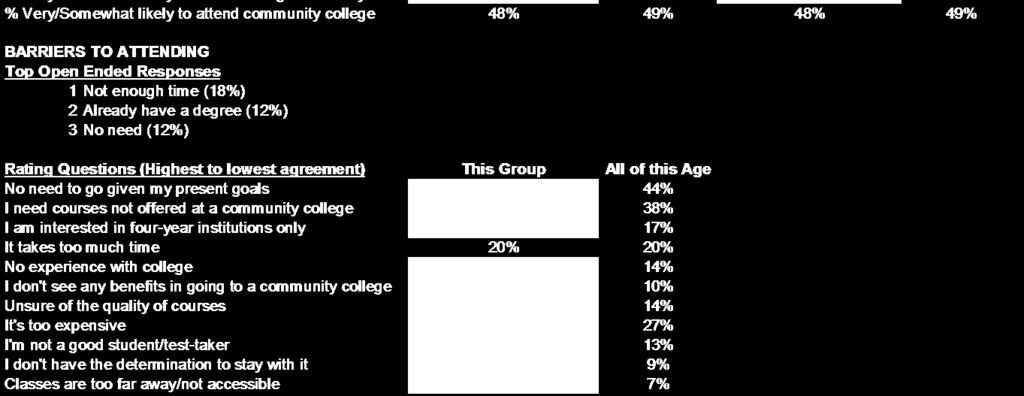
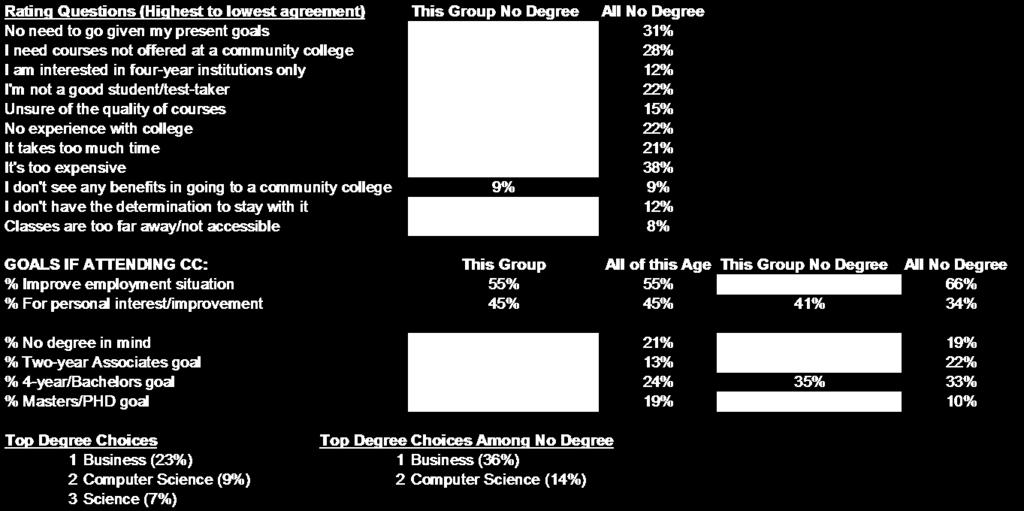
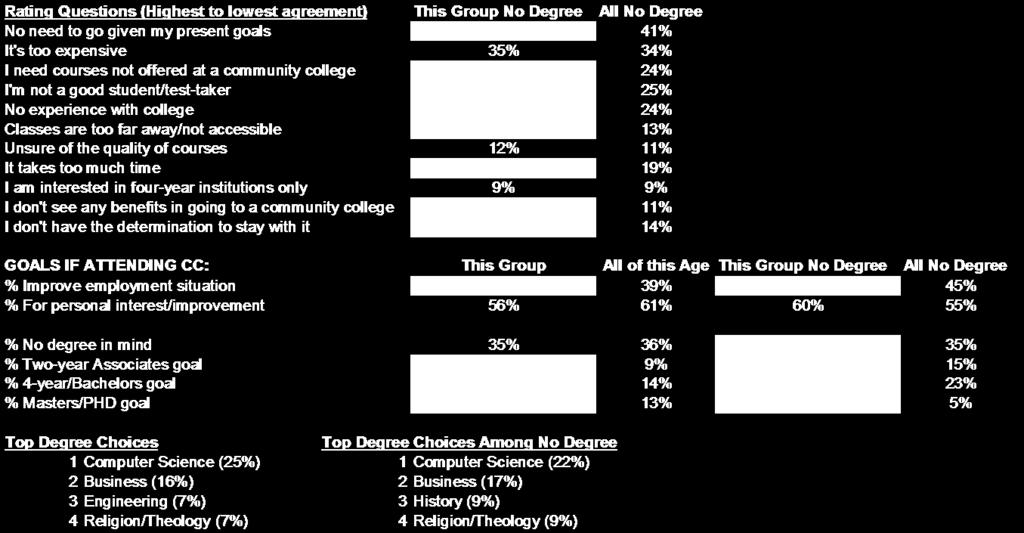
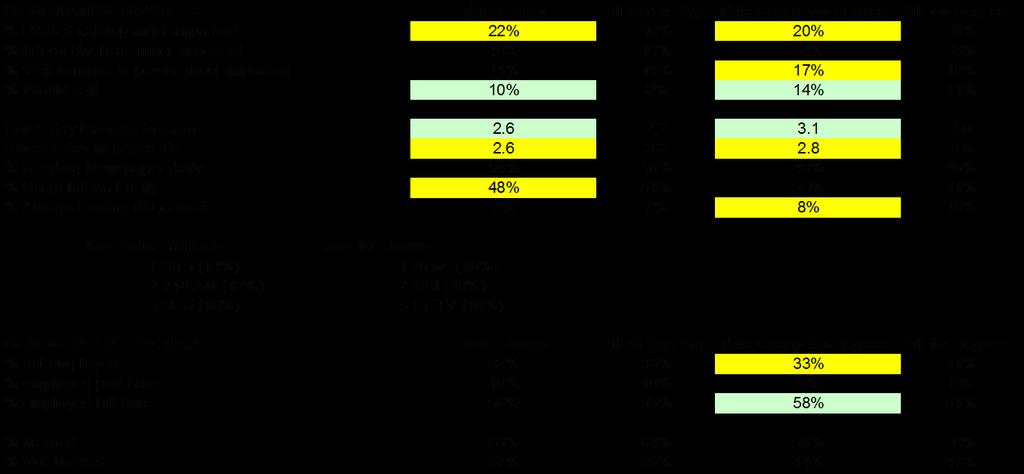
102 102 SUBGROUP: HISPANIC AGE Over 50 (Green = 10% over Average/ Yellow=10% under Average) This Group All of this Age This Group No Degree All No Degree SAMPLE SIZE NEED This Group All of this Age This Group No Degree All No Degree % Have degree 15% 47% % Currently attend college 8% 6% 9% 4% % Currently attend community college 0% 4% 0% 4% % No degree/not attending anywhere 77% 50% 91% 96% CURRENT INTEREST IN ATTENDING % Very/Somewhat likely to attend college/university 31% 27% 27% 24% % Very/Somewhat likely to attend community college 38% 27% 36% 29% CURRENT INTEREST IN ATTENDING AMONG THOSE NO DEGREE/NOT ATTENDING This Group All of this Age This Group No Degree All No Degree % Very/Somewhat likely to attend college/university 30% 24% 30% 25% % Very/Somewhat likely to attend community college 40% 30% 40% 30% BARRIERS TO ATTENDING Top Open Ended Responses 1 Too old/retired (44%) 2 Not enough time (22%) Rating Questions (Highest to lowest agreement) This Group All of this Age It's too expensive 44% 23% It takes too much time 44% 16% No need to go given my present goals 40% 49% No experience with college 33% 14% I need courses not offered at a community college 22% 29% Classes are too far away/not accessible 11% 9% I am interested in four-year institutions only 11% 13% I'm not a good student/test-taker 11% 15% I don't have the determination to stay with it 11% 9% Unsure of the quality of courses 0% 11% I don't see any benefits in going to a community college 0% 10%
103 103
104 104
105 African American 105
106 106 SUBGROUP: African American AGE (Green = 10% over Average/ Yellow=10% under Average) This Group All of this Age This Group No Degree All No Degree SAMPLE SIZE NEED This Group All of this Age This Group No Degree All No Degree % Have degree 29% 43% % Currently attend college 23% 12% 21% 13% % Currently attend community college 7% 7% 10% 11% % No degree/not attending anywhere 48% 79% 84% CURRENT INTEREST IN ATTENDING % Very/Somewhat likely to attend college/university 60% 40% 57% 41% % Very/Somewhat likely to attend community college 63% 36% 62% 43% CURRENT INTEREST IN ATTENDING AMONG THOSE NO DEGREE/NOT ATTENDING This Group All of this Age This Group No Degree All No Degree % Very/Somewhat likely to attend college/university 73% 47% 73% 47% % Very/Somewhat likely to attend community college 74% 49% 74% 49% BARRIERS TO ATTENDING Top Open Ended Responses 1 Cost (24%) 2 Not enough time (12%) 3 Do not offer courses needed (9%) 4 Already go/planning to go to a different school (9%) Rating Questions (Highest to lowest agreement) This Group All of this Age I need courses not offered at a community college 34% 38% It's too expensive 33% 27% I am interested in four-year institutions only 21% 17% No need to go given my present goals 21% 44% No experience with college 15% 14% Unsure of the quality of courses 11% 14% I'm not a good student/test-taker 8% 13% It takes too much time 8% 20% Classes are too far away/not accessible 5% 7% I don't have the determination to stay with it 3% 9% I don't see any benefits in going to a community college 3% 10%
107 107
108 108
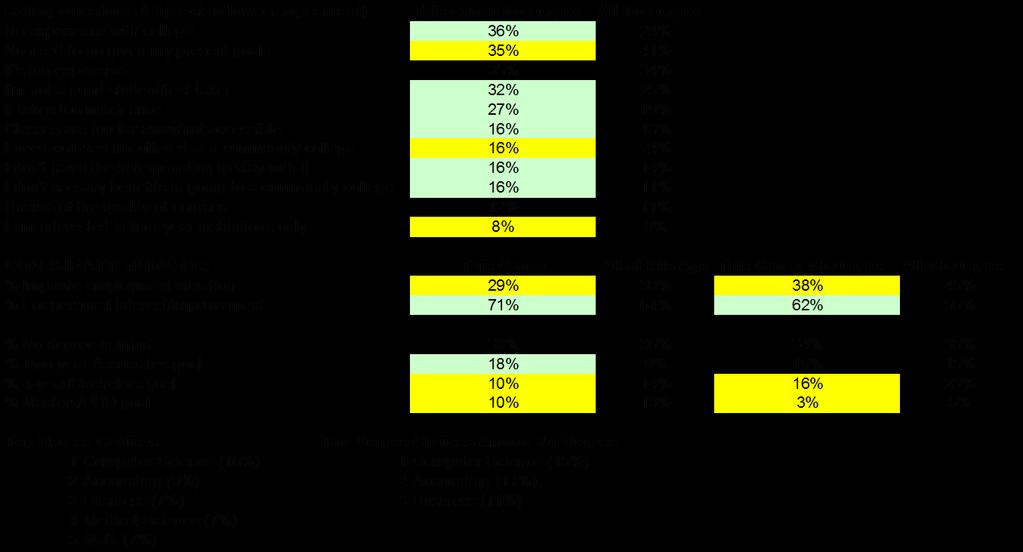
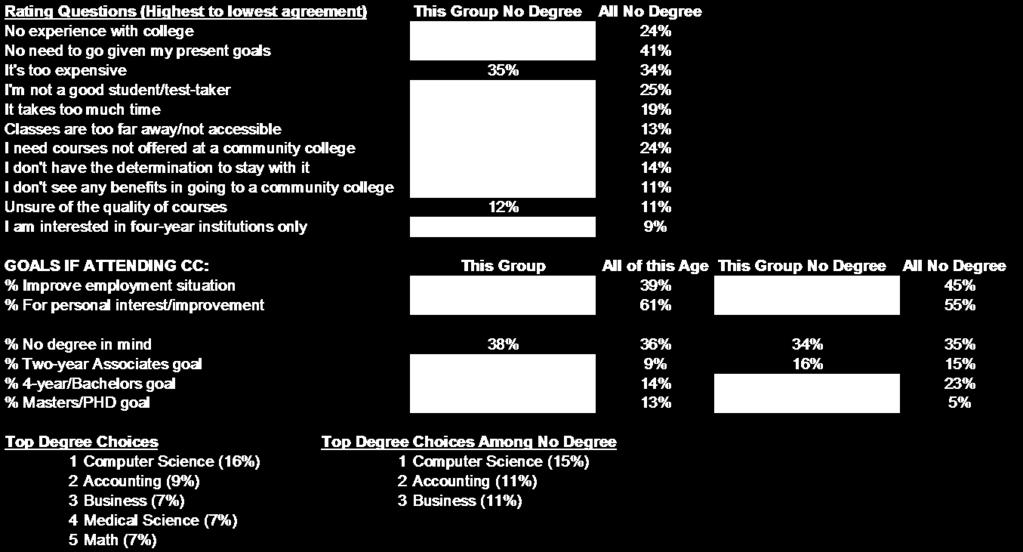
109 109 SUBGROUP: African American AGE Over 50 (Green = 10% over Average/ Yellow=10% under Average) This Group All of this Age This Group No Degree All No Degree SAMPLE SIZE NEED This Group All of this Age This Group No Degree All No Degree % Have degree 36% 47% % Currently attend college 4% 6% 6% 4% % Currently attend community college 4% 4% 6% 4% % No degree/not attending anywhere 62% 50% 94% 96% CURRENT INTEREST IN ATTENDING % Very/Somewhat likely to attend college/university 46% 27% 38% 24% % Very/Somewhat likely to attend community college 38% 27% 50% 29% CURRENT INTEREST IN ATTENDING AMONG THOSE NO DEGREE/NOT ATTENDING This Group All of this Age This Group No Degree All No Degree % Very/Somewhat likely to attend college/university 38% 24% 40% 25% % Very/Somewhat likely to attend community college 50% 30% 53% 30% BARRIERS TO ATTENDING Top Open Ended Responses 1 Already have a degree (22%) 2 Not interested (22%) Rating Questions (Highest to lowest agreement) This Group All of this Age No need to go given my present goals 36% 49% I'm not a good student/test-taker 23% 15% It's too expensive 20% 23% No experience with college 20% 14% I need courses not offered at a community college 20% 29% I don't have the determination to stay with it 16% 9% I don't see any benefits in going to a community college 16% 10% Classes are too far away/not accessible 13% 9% It takes too much time 12% 16% I am interested in four-year institutions only 8% 13% Unsure of the quality of courses 4% 11%
110 110
111 111
112 Native American 112
113 113 SUBGROUP: Native American AGE (Green = 10% over Average/ Yellow=10% under Average) This Group All of this Age This Group No Degree All No Degree SAMPLE SIZE NEED This Group All of this Age This Group No Degree All No Degree % Have degree 23% 43% % Currently attend college 7% 12% 4% 13% % Currently attend community college 3% 7% 4% 11% % No degree/not attending anywhere 73% 48% 96% 84% CURRENT INTEREST IN ATTENDING % Very/Somewhat likely to attend college/university 57% 40% 61% 41% % Very/Somewhat likely to attend community college 53% 36% 57% 43% CURRENT INTEREST IN ATTENDING AMONG THOSE NO DEGREE/NOT ATTENDING This Group All of this Age This Group No Degree All No Degree % Very/Somewhat likely to attend college/university 64% 47% 64% 47% % Very/Somewhat likely to attend community college 59% 49% 59% 49% BARRIERS TO ATTENDING Top Open Ended Responses 1 Cost (42%) 2 Already have a degree (8%) 3 Not enough time (8%) 4 Not interested (8%) Rating Questions (Highest to lowest agreement) This Group All of this Age I need courses not offered at a community college 39% 38% It's too expensive 38% 27% No need to go given my present goals 31% 44% I'm not a good student/test-taker 29% 13% I am interested in four-year institutions only 28% 17% It takes too much time 28% 20% No experience with college 25% 14% I don't have the determination to stay with it 21% 9% Unsure of the quality of courses 17% 14% I don't see any benefits in going to a community college 12% 10% Classes are too far away/not accessible 11% 7%
114 114
115 115
116 116 SUBGROUP: Native American AGE Over 50 (Green = 10% over Average/ Yellow=10% under Average) This Group All of this Age This Group No Degree All No Degree SAMPLE SIZE NEED This Group All of this Age This Group No Degree All No Degree % Have degree 35% 47% % Currently attend college 17% 6% 17% 4% % Currently attend community college 11% 4% 8% 4% % No degree/not attending anywhere 55% 50% 85% 96% CURRENT INTEREST IN ATTENDING % Very/Somewhat likely to attend college/university 33% 27% 25% 24% % Very/Somewhat likely to attend community college 42% 27% 42% 29% CURRENT INTEREST IN ATTENDING AMONG THOSE NO DEGREE/NOT ATTENDING This Group All of this Age This Group No Degree All No Degree % Very/Somewhat likely to attend college/university 30% 24% 30% 25% % Very/Somewhat likely to attend community college 50% 30% 50% 30% BARRIERS TO ATTENDING Top Open Ended Responses 1 Already have a degree (25%) 2 Too old/retired (25%) 3 Health reasons (25%) 4 Cost (25%) Rating Questions (Highest to lowest agreement) This Group All of this Age I need courses not offered at a community college 47% 29% I'm not a good student/test-taker 20% 15% No need to go given my present goals 19% 49% It's too expensive 13% 23% It takes too much time 13% 16% I am interested in four-year institutions only 13% 13% Unsure of the quality of courses 13% 11% No experience with college 7% 14% I don't have the determination to stay with it 7% 9% I don't see any benefits in going to a community college 7% 10% Classes are too far away/not accessible 0% 9%
117 117
118 118
119 Caucasian South 119
120 120 SUBGROUP: Caucasian AGE SOUTH (Green = 10% over Average/ Yellow=10% under Average) This Group All of this Age This Group No Degree All No Degree SAMPLE SIZE NEED This Group All of this Age This Group No Degree All No Degree % Have degree 62% 43% % Currently attend college 15% 12% 19% 13% % Currently attend community college 4% 7% 7% 11% % No degree/not attending anywhere 30% 48% 80% 84% CURRENT INTEREST IN ATTENDING % Very/Somewhat likely to attend college/university 30% 40% 31% 41% % Very/Somewhat likely to attend community college 29% 36% 41% 43% CURRENT INTEREST IN ATTENDING AMONG THOSE NO DEGREE/NOT ATTENDING This Group All of this Age This Group No Degree All No Degree % Very/Somewhat likely to attend college/university 37% 47% 37% 47% % Very/Somewhat likely to attend community college 44% 49% 44% 49% BARRIERS TO ATTENDING Top Open Ended Responses 1 Already have a degree (23%) 2 Not enough time (14%) 3 Do not offer courses needed (10%) Rating Questions (Highest to lowest agreement) This Group All of this Age No need to go given my present goals 55% 44% I need courses not offered at a community college 44% 38% It takes too much time 19% 20% I am interested in four-year institutions only 18% 17% It's too expensive 17% 27% Unsure of the quality of courses 14% 14% I don't have the determination to stay with it 7% 9% I'm not a good student/test-taker 6% 13% I don't see any benefits in going to a community college 6% 10% No experience with college 5% 14% Classes are too far away/not accessible 1% 7%
121 121
122 122
123 123 SUBGROUP: Caucasian AGE Over 50 SOUTH (Green = 10% over Average/ Yellow=10% under Average) This Group All of this Age This Group No Degree All No Degree SAMPLE SIZE NEED This Group All of this Age This Group No Degree All No Degree % Have degree 65% 47% % Currently attend college 6% 6% 4% 4% % Currently attend community college 4% 4% 4% 4% % No degree/not attending anywhere 32% 50% 96% 96% CURRENT INTEREST IN ATTENDING % Very/Somewhat likely to attend college/university 23% 27% 18% 24% % Very/Somewhat likely to attend community college 25% 27% 25% 29% CURRENT INTEREST IN ATTENDING AMONG THOSE NO DEGREE/NOT ATTENDING This Group All of this Age This Group No Degree All No Degree % Very/Somewhat likely to attend college/university 19% 24% 18% 25% % Very/Somewhat likely to attend community college 25% 30% 24% 30% BARRIERS TO ATTENDING Top Open Ended Responses 1 Too old/retired (31%) 2 Already have a degree (16%) 3 Not enough time (15%) Rating Questions (Highest to lowest agreement) This Group All of this Age No need to go given my present goals 56% 49% I need courses not offered at a community college 30% 29% It's too expensive 15% 23% It takes too much time 14% 16% I'm not a good student/test-taker 13% 15% I am interested in four-year institutions only 12% 13% Unsure of the quality of courses 11% 11% I don't see any benefits in going to a community college 10% 10% No experience with college 9% 14% I don't have the determination to stay with it 7% 9% Classes are too far away/not accessible 6% 9%
124 124
125 125
126 Caucasian BA 126
127 127
128 128
129 129
130 130
131 131
132 132
133 Caucasian Central/East/North 133
134 134 SUBGROUP: Caucasian AGE CENTRAL/EAST/NORTH (Green = 10% over Average/ Yellow=10% under Average) This Group All of this Age This Group No Degree All No Degree SAMPLE SIZE NEED This Group All of this Age This Group No Degree All No Degree % Have degree 38% 43% % Currently attend college 14% 12% 17% 13% % Currently attend community college 12% 7% 19% 11% % No degree/not attending anywhere 48% 48% 77% 84% CURRENT INTEREST IN ATTENDING % Very/Somewhat likely to attend college/university 40% 40% 35% 41% % Very/Somewhat likely to attend community college 33% 36% 35% 43% CURRENT INTEREST IN ATTENDING AMONG THOSE NO DEGREE/NOT ATTENDING This Group All of this Age This Group No Degree All No Degree % Very/Somewhat likely to attend college/university 43% 47% 42% 47% % Very/Somewhat likely to attend community college 46% 49% 45% 49% BARRIERS TO ATTENDING Top Open Ended Responses 1 Cost (17%) 2 Already have a degree (16%) 3 Not enough time (10%) 4 Do not offer courses needed (10%) Rating Questions (Highest to lowest agreement) This Group All of this Age No need to go given my present goals 41% 44% I need courses not offered at a community college 37% 38% It's too expensive 30% 27% It takes too much time 17% 20% I'm not a good student/test-taker 16% 13% I am interested in four-year institutions only 15% 17% Unsure of the quality of courses 15% 14% No experience with college 15% 14% I don't see any benefits in going to a community college 11% 10% I don't have the determination to stay with it 7% 9% Classes are too far away/not accessible 4% 7%
135 135
136 136
137 137 SUBGROUP: Caucasian AGE Over 50 CENTRAL/EAST/NORTH (Green = 10% over Average/ Yellow=10% under Average) This Group All of this Age This Group No Degree All No Degree SAMPLE SIZE NEED This Group All of this Age This Group No Degree All No Degree % Have degree 40% 47% % Currently attend college 7% 6% 3% 4% % Currently attend community college 5% 4% 5% 4% % No degree/not attending anywhere 58% 50% 97% 96% CURRENT INTEREST IN ATTENDING % Very/Somewhat likely to attend college/university 29% 27% 24% 24% % Very/Somewhat likely to attend community college 30% 27% 29% 29% CURRENT INTEREST IN ATTENDING AMONG THOSE NO DEGREE/NOT ATTENDING This Group All of this Age This Group No Degree All No Degree % Very/Somewhat likely to attend college/university 23% 24% 25% 25% % Very/Somewhat likely to attend community college 30% 30% 30% 30% BARRIERS TO ATTENDING Top Open Ended Responses 1 Too old/retired (32%) 2 Already have a degree (11%) 3 Not enough time (11%) Rating Questions (Highest to lowest agreement) This Group All of this Age No need to go given my present goals 44% 49% I need courses not offered at a community college 38% 29% It's too expensive 21% 23% It takes too much time 11% 16% No experience with college 11% 14% I'm not a good student/test-taker 11% 15% I don't have the determination to stay with it 11% 9% I am interested in four-year institutions only 10% 13% Unsure of the quality of courses 10% 11% Classes are too far away/not accessible 7% 9% I don't see any benefits in going to a community college 5% 10%
138 138
139 139
140 Caucasian West 140
141 141
142 142
143 143
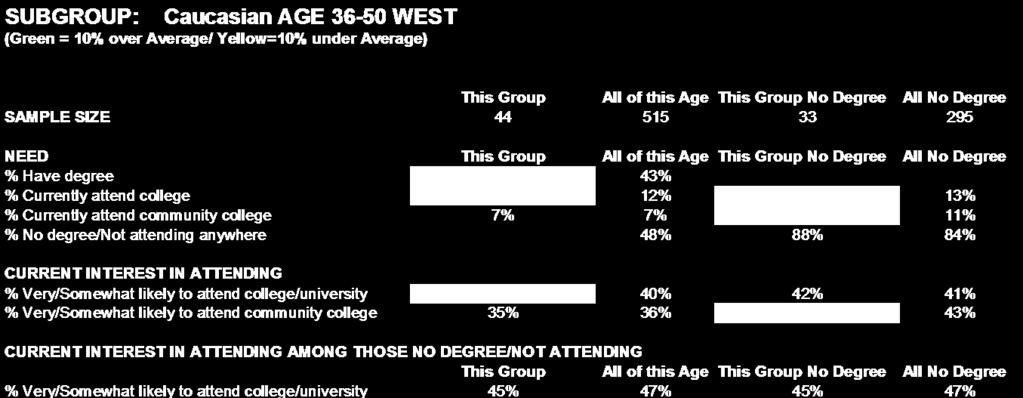
144 144 SUBGROUP: Caucasian AGE Over 50 WEST (Green = 10% over Average/ Yellow=10% under Average) This Group All of this Age This Group No Degree All No Degree SAMPLE SIZE NEED This Group All of this Age This Group No Degree All No Degree % Have degree 32% 47% % Currently attend college 4% 6% 3% 4% % Currently attend community college 4% 4% 6% 4% % No degree/not attending anywhere 65% 50% 97% 96% CURRENT INTEREST IN ATTENDING % Very/Somewhat likely to attend college/university 30% 27% 25% 24% % Very/Somewhat likely to attend community college 31% 27% 28% 29% CURRENT INTEREST IN ATTENDING AMONG THOSE NO DEGREE/NOT ATTENDING This Group All of this Age This Group No Degree All No Degree % Very/Somewhat likely to attend college/university 23% 24% 26% 25% % Very/Somewhat likely to attend community college 29% 30% 29% 30% BARRIERS TO ATTENDING Top Open Ended Responses 1 Too old/retired (24%) 2 Already have a degree (21%) 3 Not enough time (11%) 4 Cost (11%) Rating Questions (Highest to lowest agreement) This Group All of this Age No need to go given my present goals 38% 49% No experience with college 23% 14% It's too expensive 22% 23% It takes too much time 22% 16% I need courses not offered at a community college 20% 29% I'm not a good student/test-taker 20% 15% Unsure of the quality of courses 18% 11% Classes are too far away/not accessible 13% 9% I don't see any benefits in going to a community college 13% 10% I don't have the determination to stay with it 10% 9% I am interested in four-year institutions only 8% 13%
145 145
146 146
147 Caucasian Outlying 147
148 148 SUBGROUP: Caucasian AGE OUTLYING (Green = 10% over Average/ Yellow=10% under Average) This Group All of this Age This Group No Degree All No Degree SAMPLE SIZE NEED This Group All of this Age This Group No Degree All No Degree % Have degree 32% 43% % Currently attend college 5% 12% 5% 13% % Currently attend community college 4% 7% 5% 11% % No degree/not attending anywhere 48% 92% 84% CURRENT INTEREST IN ATTENDING % Very/Somewhat likely to attend college/university 30% 40% 32% 41% % Very/Somewhat likely to attend community college 38% 36% 42% 43% CURRENT INTEREST IN ATTENDING AMONG THOSE NO DEGREE/NOT ATTENDING This Group All of this Age This Group No Degree All No Degree % Very/Somewhat likely to attend college/university 34% 47% 34% 47% % Very/Somewhat likely to attend community college 43% 49% 43% 49% BARRIERS TO ATTENDING Top Open Ended Responses 1 Not enough time (17%) 2 Already have a degree (12%) 3 No need (12%) Rating Questions (Highest to lowest agreement) This Group All of this Age No need to go given my present goals 42% 44% I need courses not offered at a community college 33% 38% It's too expensive 33% 27% No experience with college 25% 14% I'm not a good student/test-taker 21% 13% It takes too much time 17% 20% I don't have the determination to stay with it 15% 9% Unsure of the quality of courses 14% 14% I am interested in four-year institutions only 10% 17% Classes are too far away/not accessible 10% 7% I don't see any benefits in going to a community college 9% 10%
149 149
150 150
151 151 SUBGROUP: Caucasian AGE Over 50 OUTLYING (Green = 10% over Average/ Yellow=10% under Average) This Group All of this Age This Group No Degree All No Degree SAMPLE SIZE NEED This Group All of this Age This Group No Degree All No Degree % Have degree 39% 47% % Currently attend college 3% 6% 3% 4% % Currently attend community college 3% 4% 3% 4% % No degree/not attending anywhere 60% 50% 97% 96% CURRENT INTEREST IN ATTENDING % Very/Somewhat likely to attend college/university 30% 27% 31% 24% % Very/Somewhat likely to attend community college 20% 27% 25% 29% CURRENT INTEREST IN ATTENDING AMONG THOSE NO DEGREE/NOT ATTENDING This Group All of this Age This Group No Degree All No Degree % Very/Somewhat likely to attend college/university 31% 24% 31% 25% % Very/Somewhat likely to attend community college 25% 30% 26% 30% BARRIERS TO ATTENDING Top Open Ended Responses 1 Too old/retired (33%) 2 Already have a degree (16%) 3 Not enough time (16%) Rating Questions (Highest to lowest agreement) This Group All of this Age No need to go given my present goals 58% 49% I need courses not offered at a community college 33% 29% It's too expensive 25% 23% I am interested in four-year institutions only 23% 13% I'm not a good student/test-taker 18% 15% It takes too much time 16% 16% Classes are too far away/not accessible 14% 9% No experience with college 11% 14% I don't see any benefits in going to a community college 10% 10% Unsure of the quality of courses 7% 11% I don't have the determination to stay with it 5% 9%
152 152
153 153
154 Summary of Select Factors
155 155
156 156
Status of Women of Color in Science, Engineering, and Medicine
 Status of Women of Color in Science, Engineering, and Medicine The figures and tables below are based upon the latest publicly available data from AAMC, NSF, Department of Education and the US Census Bureau.
Facts and Figures Office of Institutional Research and Planning
 Facts and Figures 2008-2009 Office of Institutional Research and Planning Office of Institutional Research Fall 2009 Facts at a Glance Credit Headcount Enrollments Headcount Ethnicity Headcount Percent
Educational Attainment
 A Demographic and Socio-Economic Profile of Allen County, Indiana based on the 2010 Census and the American Community Survey Educational Attainment A Review of Census Data Related to the Educational Attainment
An Empirical Analysis of the Effects of Mexican American Studies Participation on Student Achievement within Tucson Unified School District
 An Empirical Analysis of the Effects of Mexican American Studies Participation on Student Achievement within Tucson Unified School District Report Submitted June 20, 2012, to Willis D. Hawley, Ph.D., Special
Iowa School District Profiles. Le Mars
 Iowa School District Profiles Overview This profile describes enrollment trends, student performance, income levels, population, and other characteristics of the public school district. The report utilizes
Suggested Citation: Institute for Research on Higher Education. (2016). College Affordability Diagnosis: Maine. Philadelphia, PA: Institute for
. College Affordability Diagnosis: Maine. Philadelphia, PA: Institute for") MAINE Suggested Citation: Institute for Research on Higher Education. (2016). College Affordability Diagnosis: Maine. Philadelphia, PA: Institute for Research on Higher Education, Graduate School of Education,
MAINE Suggested Citation: Institute for Research on Higher Education. (2016). College Affordability Diagnosis: Maine. Philadelphia, PA: Institute for Research on Higher Education, Graduate School of Education,
Shelters Elementary School
 Shelters Elementary School August 2, 24 Dear Parents and Community Members: We are pleased to present you with the (AER) which provides key information on the 23-24 educational progress for the Shelters
Appendix K: Survey Instrument
 Journal of Southeast Asian American Education and Advancement Volume Article 12 2011 Appendix K: Survey Instrument Wayne E. Wright University of Texas, San Antonio, wewright@purdue.edu Sovicheth Boun The
1.0 INTRODUCTION. The purpose of the Florida school district performance review is to identify ways that a designated school district can:
 1.0 INTRODUCTION 1.1 Overview Section 11.515, Florida Statutes, was created by the 1996 Florida Legislature for the purpose of conducting performance reviews of school districts in Florida. The statute
U VA THE CHANGING FACE OF UVA STUDENTS: SSESSMENT. About The Study
 About The Study U VA SSESSMENT In 6, the University of Virginia Office of Institutional Assessment and Studies undertook a study to describe how first-year students have changed over the past four decades.
Financial aid: Degree-seeking undergraduates, FY15-16 CU-Boulder Office of Data Analytics, Institutional Research March 2017
 CU-Boulder financial aid, degree-seeking undergraduates, FY15-16 Page 1 Financial aid: Degree-seeking undergraduates, FY15-16 CU-Boulder Office of Data Analytics, Institutional Research March 2017 Contents
The number of involuntary part-time workers,
 University of New Hampshire Carsey School of Public Policy CARSEY RESEARCH National Issue Brief #116 Spring 2017 Involuntary Part-Time Employment A Slow and Uneven Economic Recovery Rebecca Glauber The
SASKATCHEWAN MINISTRY OF ADVANCED EDUCATION
 SASKATCHEWAN MINISTRY OF ADVANCED EDUCATION Report March 2017 Report compiled by Insightrix Research Inc. 1 3223 Millar Ave. Saskatoon, Saskatchewan T: 1-866-888-5640 F: 1-306-384-5655 Table of Contents
Like much of the country, Detroit suffered significant job losses during the Great Recession.
 36 37 POPULATION TRENDS Economy ECONOMY Like much of the country, suffered significant job losses during the Great Recession. Since bottoming out in the first quarter of 2010, however, the city has seen
Graduate Division Annual Report Key Findings
 Graduate Division 2010 2011 Annual Report Key Findings Trends in Admissions and Enrollment 1 Size, selectivity, yield UCLA s graduate programs are increasingly attractive and selective. Between Fall 2001
Principal vacancies and appointments
 Principal vacancies and appointments 2009 10 Sally Robertson New Zealand Council for Educational Research NEW ZEALAND COUNCIL FOR EDUCATIONAL RESEARCH TE RŪNANGA O AOTEAROA MŌ TE RANGAHAU I TE MĀTAURANGA
SAT Results December, 2002 Authors: Chuck Dulaney and Roger Regan WCPSS SAT Scores Reach Historic High
 ABOUT THE SAT 2001-2002 SAT Results December, 2002 Authors: Chuck Dulaney and Roger Regan WCPSS SAT Scores Reach Historic High The Scholastic Assessment Test (SAT), more formally known as the SAT I: Reasoning
Quantitative Study with Prospective Students: Final Report. for. Illinois Wesleyan University Bloomington, Illinois
 Quantitative Study with Prospective Students: Final Report for Illinois Wesleyan University Bloomington, Illinois September 25, 2007 Table of Contents INTRODUCTION & BACKGROUND 1-2 ASSIGNMENT 1 RESEARCH
Demographic Survey for Focus and Discussion Groups
 Appendix F Demographic Survey for Focus and Discussion Groups Demographic Survey--Lesbian, Gay, and Bisexual Discussion Group Demographic Survey Faculty with Disabilities Discussion Group Demographic Survey
Faculty Schedule Preference Survey Results
 Faculty Schedule Preference Survey Results Surveys were distributed to all 199 faculty mailboxes with information about moving to a 16 week calendar followed by asking their calendar schedule. Objective
Los Angeles City College Student Equity Plan. Signature Page
 Los Angeles City College Student Equity Plan Signature Page Los Angeles Community College Los Angeles City College President, Board of Trustees Date District Chancellor: College President: Academic Senate
Educational Management Corp Chef s Academy
 Educational Management Corp Chef s Academy Morrisville, North Carolina (Raleigh MSA) Exclusively Offered By: Porthaven Partners 8908 S. Yale Ave. Suite 400 Tulsa, OK 74137 Ryan Carter Partner P: 918.496.1464
Serving Country and Community: A Study of Service in AmeriCorps. A Profile of AmeriCorps Members at Baseline. June 2001
 Serving Country and Community: A Study of Service in AmeriCorps Cambridge, MA Lexington, MA Hadley, MA Bethesda, MD Washington, DC Chicago, IL Cairo, Egypt Johannesburg, South Africa A Profile of AmeriCorps
JOB OUTLOOK 2018 NOVEMBER 2017 FREE TO NACE MEMBERS $52.00 NONMEMBER PRICE NATIONAL ASSOCIATION OF COLLEGES AND EMPLOYERS
 NOVEMBER 2017 FREE TO NACE MEMBERS $52.00 NONMEMBER PRICE JOB OUTLOOK 2018 NATIONAL ASSOCIATION OF COLLEGES AND EMPLOYERS 62 Highland Avenue, Bethlehem, PA 18017 www.naceweb.org 610,868.1421 TABLE OF CONTENTS
Social Media Journalism J336F Unique Spring 2016
 Social Media Journalism J336F Unique 07865 Spring 2016 Class: Online Professor: Robert Quigley Office hours: T-TH 10:30 to noon and by appointment Email: robert.quigley@austin.utexas.edu Personal social
PUBLIC INFORMATION POLICY
 CALIFORNIA STATE POLYTECHNIC UNIVERSITY, POMONA Landscape Architecture College of Environmental Design PUBLIC INFORMATION POLICY Landscape Architecture Accreditation Board (LAAB) accredited programs are
OFFICE OF ENROLLMENT MANAGEMENT. Annual Report
 2014-2015 OFFICE OF ENROLLMENT MANAGEMENT Annual Report Table of Contents 2014 2015 MESSAGE FROM THE VICE PROVOST A YEAR OF RECORDS 3 Undergraduate Enrollment 6 First-Year Students MOVING FORWARD THROUGH
Undergraduates Views of K-12 Teaching as a Career Choice
 Undergraduates Views of K-12 Teaching as a Career Choice A Report Prepared for The Professional Educator Standards Board Prepared by: Ana M. Elfers Margaret L. Plecki Elise St. John Rebecca Wedel University
Transportation Equity Analysis
 2015-16 Transportation Equity Analysis Each year the Seattle Public Schools updates the Transportation Service Standards and bus walk zone boundaries for use in the upcoming school year. For the 2014-15
Student Support Services Evaluation Readiness Report. By Mandalyn R. Swanson, Ph.D., Program Evaluation Specialist. and Evaluation
 Student Support Services Evaluation Readiness Report By Mandalyn R. Swanson, Ph.D., Program Evaluation Specialist and Bethany L. McCaffrey, Ph.D., Interim Director of Research and Evaluation Evaluation
File Print Created 11/17/2017 6:16 PM 1 of 10
 Success - Key Measures Graduation Rate: 4-, 5-, and 6-Year 9. First-time, full-time entering, degree-seeking, students enrolled in a minimum of 12 SCH their first fall semester who have graduated from
TACOMA HOUSING AUTHORITY
 TACOMA HOUSING AUTHORITY CHILDREN s SAVINGS ACCOUNT for the CHILDREN of NEW SALISHAN, Tacoma, WA last revised July 10, 2014 1. SUMMARY The Tacoma Housing Authority (THA) plans to offer individual development
National Survey of Student Engagement (NSSE) Temple University 2016 Results
 Temple University 2016 Results") Introduction The National Survey of Student Engagement (NSSE) is administered by hundreds of colleges and universities every year (560 in 2016), and is designed to measure the amount of time and effort
Introduction The National Survey of Student Engagement (NSSE) is administered by hundreds of colleges and universities every year (560 in 2016), and is designed to measure the amount of time and effort
School Performance Plan Middle Schools
 SY 2012-2013 School Performance Plan Middle Schools 734 Middle ALternative Program @ Lombard, Principal Roger Shaw (Interim), Executive Director, Network Facilitator PLEASE REFER TO THE SCHOOL PERFORMANCE
THE PENNSYLVANIA STATE UNIVERSITY SCHREYER HONORS COLLEGE DEPARTMENT OF MATHEMATICS ASSESSING THE EFFECTIVENESS OF MULTIPLE CHOICE MATH TESTS
 THE PENNSYLVANIA STATE UNIVERSITY SCHREYER HONORS COLLEGE DEPARTMENT OF MATHEMATICS ASSESSING THE EFFECTIVENESS OF MULTIPLE CHOICE MATH TESTS ELIZABETH ANNE SOMERS Spring 2011 A thesis submitted in partial
2012 ACT RESULTS BACKGROUND
 Report from the Office of Student Assessment 31 November 29, 2012 2012 ACT RESULTS AUTHOR: Douglas G. Wren, Ed.D., Assessment Specialist Department of Educational Leadership and Assessment OTHER CONTACT
National Survey of Student Engagement Spring University of Kansas. Executive Summary
 National Survey of Student Engagement Spring 2010 University of Kansas Executive Summary Overview One thousand six hundred and twenty-one (1,621) students from the University of Kansas completed the web-based
CAMPUS PROFILE MEET OUR STUDENTS UNDERGRADUATE ADMISSIONS. The average age of undergraduates is 21; 78% are 22 years or younger.
 CAMPUS PROFILE MEET OUR STUDENTS Freshmen are defined here as all domestic students entering in fall quarter from high school. These statistics include information drawn from records available at UC Davis.
TULSA COMMUNITY COLLEGE
 TULSA COMMUNITY COLLEGE ANNUAL STUDENT ASSESSMENT REPORT 2002 2003 SUBMITTED TO THE OKLAHOMA STATE REGENTS FOR HIGHER EDUCATION NOVEMBER 2003 TCC Contact: Dr. John Kontogianes Executive Vice President
Cooking Matters at the Store Evaluation: Executive Summary
 Cooking Matters at the Store Evaluation: Executive Summary Introduction Share Our Strength is a national nonprofit with the goal of ending childhood hunger in America by connecting children with the nutritious
A Guide to Adequate Yearly Progress Analyses in Nevada 2007 Nevada Department of Education
 A Guide to Adequate Yearly Progress Analyses in Nevada 2007 Nevada Department of Education Note: Additional information regarding AYP Results from 2003 through 2007 including a listing of each individual
Descriptive Summary of Beginning Postsecondary Students Two Years After Entry
 NATIONAL CENTER FOR EDUCATION STATISTICS Statistical Analysis Report June 994 Descriptive Summary of 989 90 Beginning Postsecondary Students Two Years After Entry Contractor Report Robert Fitzgerald Lutz
Alabama
 Alabama 2012 Alabama Homeschooling Requirements: Approach Establish or enroll in a church school Hire a private tutor Compulsory Attendance Applies to children between the ages of 6 and 17. Parent of child
EDUCATIONAL ATTAINMENT
 EDUCATIONAL ATTAINMENT By 2030, at least 60 percent of Texans ages 25 to 34 will have a postsecondary credential or degree. Target: Increase the percent of Texans ages 25 to 34 with a postsecondary credential.
A Diverse Student Body
 A Diverse Student Body No two diversity plans are alike, even when expressing the importance of having students from diverse backgrounds. A top-tier school that attracts outstanding students uses this
TULSA COMMUNITY COLLEGE
 TULSA COMMUNITY COLLEGE ANNUAL STUDENT ASSESSMENT REPORT 2001 2002 SUBMITTED TO THE OKLAHOMA STATE REGENTS FOR HIGHER EDUCATION NOVEMBER 2002 TCC Contact: Dr. John Kontogianes Executive Vice President
Table of Contents. Internship Requirements 3 4. Internship Checklist 5. Description of Proposed Internship Request Form 6. Student Agreement Form 7
 Table of Contents Section Page Internship Requirements 3 4 Internship Checklist 5 Description of Proposed Internship Request Form 6 Student Agreement Form 7 Consent to Release Records Form 8 Internship
Proficiency Illusion
 KINGSBURY RESEARCH CENTER Proficiency Illusion Deborah Adkins, MS 1 Partnering to Help All Kids Learn NWEA.org 503.624.1951 121 NW Everett St., Portland, OR 97209 Executive Summary At the heart of the
UK Institutional Research Brief: Results of the 2012 National Survey of Student Engagement: A Comparison with Carnegie Peer Institutions
 UK Institutional Research Brief: Results of the 2012 National Survey of Student Engagement: A Comparison with Carnegie Peer Institutions November 2012 The National Survey of Student Engagement (NSSE) has
The University of North Carolina Strategic Plan Online Survey and Public Forums Executive Summary
 The University of North Carolina Strategic Plan Online Survey and Public Forums Executive Summary The University of North Carolina General Administration January 5, 2017 Introduction The University of
Effective Recruitment and Retention Strategies for Underrepresented Minority Students: Perspectives from Dental Students
 Critical Issues in Dental Education Effective Recruitment and Retention Strategies for Underrepresented Minority Students: Perspectives from Dental Students Naty Lopez, Ph.D.; Rose Wadenya, D.M.D., M.S.;
EXECUTIVE SUMMARY. Online courses for credit recovery in high schools: Effectiveness and promising practices. April 2017
 EXECUTIVE SUMMARY Online courses for credit recovery in high schools: Effectiveness and promising practices April 2017 Prepared for the Nellie Mae Education Foundation by the UMass Donahue Institute 1
Entrepreneurial Discovery and the Demmert/Klein Experiment: Additional Evidence from Germany
 Entrepreneurial Discovery and the Demmert/Klein Experiment: Additional Evidence from Germany Jana Kitzmann and Dirk Schiereck, Endowed Chair for Banking and Finance, EUROPEAN BUSINESS SCHOOL, International
A STUDY ON THE EFFECTS OF IMPLEMENTING A 1:1 INITIATIVE ON STUDENT ACHEIVMENT BASED ON ACT SCORES JEFF ARMSTRONG. Submitted to
 1:1 Initiative 1 Running Head: Effects of Adopting a 1:1 Initiative A STUDY ON THE EFFECTS OF IMPLEMENTING A 1:1 INITIATIVE ON STUDENT ACHEIVMENT BASED ON ACT SCORES By JEFF ARMSTRONG Submitted to The
Moving the Needle: Creating Better Career Opportunities and Workforce Readiness. Austin ISD Progress Report
 Moving the Needle: Creating Better Career Opportunities and Workforce Readiness Austin ISD Progress Report 2013 A Letter to the Community Central Texas Job Openings More than 150 people move to the Austin
An Introduction to School Finance in Texas
 An Introduction to School Finance in Texas May 12, 2010 Sheryl Pace TTARA Research Foundation space@ttara.org (512) 472-8838 Texas Public Education System 1,300 school districts (#1 in the nation) 1,025
What is related to student retention in STEM for STEM majors? Abstract:
 What is related to student retention in STEM for STEM majors? Abstract: The purpose of this study was look at the impact of English and math courses and grades on retention in the STEM major after one
African American Male Achievement Update
 Report from the Department of Research, Evaluation, and Assessment Number 8 January 16, 2009 African American Male Achievement Update AUTHOR: Hope E. White, Ph.D., Program Evaluation Specialist Department
Office of Institutional Effectiveness 2012 NATIONAL SURVEY OF STUDENT ENGAGEMENT (NSSE) DIVERSITY ANALYSIS BY CLASS LEVEL AND GENDER VISION
 DIVERSITY ANALYSIS BY CLASS LEVEL AND GENDER VISION") Office of Institutional Effectiveness 2012 NATIONAL SURVEY OF STUDENT ENGAGEMENT (NSSE) DIVERSITY ANALYSIS BY CLASS LEVEL AND GENDER VISION We seek to become recognized for providing bright and curious
Office of Institutional Effectiveness 2012 NATIONAL SURVEY OF STUDENT ENGAGEMENT (NSSE) DIVERSITY ANALYSIS BY CLASS LEVEL AND GENDER VISION We seek to become recognized for providing bright and curious
Get a Smart Start with Youth
 Toolkit work bene ts youth Get a Smart Start with Youth Y O U T H I N T R A N S I T I O N Toolkit Overview Using the Toolkit TOOLKIT OVERVIEW The core component of the Get a Smart Start & Take Charge Toolkit
Internship Program. Application Submission completed form to: Monica Mitry Membership and Volunteer Coordinator
 Internship Program The Museum of Arts and Sciences offers a variety of internships on a flexible and ongoing basis. Internships offer the opportunity to gain valuable, practical experience while receiving
Frank Phillips College. Accountability Report
 Frank Phillips College Accountability Report January 2016 Accountability System, January 2016 1 of 22 Participation - Key Measures Enrollment 1. Fall Headcount (Unduplicated) Fall 2000 Fall 2014 Fall 2015
Evaluation of a College Freshman Diversity Research Program
 Evaluation of a College Freshman Diversity Research Program Sarah Garner University of Washington, Seattle, Washington 98195 Michael J. Tremmel University of Washington, Seattle, Washington 98195 Sarah
THE ECONOMIC IMPACT OF THE UNIVERSITY OF EXETER
 THE ECONOMIC IMPACT OF THE UNIVERSITY OF EXETER Report prepared by Viewforth Consulting Ltd www.viewforthconsulting.co.uk Table of Contents Executive Summary... 2 Background to the Study... 6 Data Sources
CI at a Glance. ttp://www.csuci.edu/about/
 CSU Channel Islands CI at a Glance Youngest CSU Campus (founded in 2002) Location: Camarillo,Ventura County Enrollment: 6,900 students New residence hall, dining hall, and STEM facilities Research Station
10/6/2017 UNDERGRADUATE SUCCESS SCHOLARS PROGRAM. Founded in 1969 as a graduate institution.
 UNDERGRADUATE SUCCESS SCHOLARS PROGRAM THE UNIVERSITY OF TEXAS AT DALLAS Founded in 1969 as a graduate institution. Began admitting upperclassmen in 1975 and began admitting underclassmen in 1990. 1 A
Psychometric Research Brief Office of Shared Accountability
 August 2012 Psychometric Research Brief Office of Shared Accountability Linking Measures of Academic Progress in Mathematics and Maryland School Assessment in Mathematics Huafang Zhao, Ph.D. This brief
AGENDA ITEM VI-E October 2005 Page 1 CHAPTER 13. FINANCIAL PLANNING
 Page 1 CHAPTER 13. FINANCIAL PLANNING Subchapter F. FORMULA FUNDING AND TUITION CHARGED FOR REPEATED AND EXCESS HOURS OF UNDERGRADUATE STUDENTS Section 13.100. Purpose. 13.101. Authority 13.102. Definitions.
Charter School Performance Comparable to Other Public Schools; Stronger Accountability Needed
 April 2005 Report No. 05-21 Charter School Performance Comparable to Other Public Schools; Stronger Accountability Needed at a glance On average, charter school students are academically behind when they
WE GAVE A LAWYER BASIC MATH SKILLS, AND YOU WON T BELIEVE WHAT HAPPENED NEXT
 WE GAVE A LAWYER BASIC MATH SKILLS, AND YOU WON T BELIEVE WHAT HAPPENED NEXT PRACTICAL APPLICATIONS OF RANDOM SAMPLING IN ediscovery By Matthew Verga, J.D. INTRODUCTION Anyone who spends ample time working
Trends in College Pricing
 Trends in College Pricing 2009 T R E N D S I N H I G H E R E D U C A T I O N S E R I E S T R E N D S I N H I G H E R E D U C A T I O N S E R I E S Highlights Published Tuition and Fee and Room and Board
What Is The National Survey Of Student Engagement (NSSE)?
?") National Survey of Student Engagement (NSSE) 2000 Results for Montclair State University What Is The National Survey Of Student Engagement (NSSE)? US News and World Reports Best College Survey is due next
National Survey of Student Engagement (NSSE) 2000 Results for Montclair State University What Is The National Survey Of Student Engagement (NSSE)? US News and World Reports Best College Survey is due next
Bellevue University Admission Application
 Bellevue University Admission Application Bellevue University is an open admissions university. Once you submit your application, we will begin the process of evaluating your credits and developing your
Cooper Upper Elementary School
 LIVONIA PUBLIC SCHOOLS http://cooper.livoniapublicschools.org 215-216 Annual Education Report BOARD OF EDUCATION 215-16 Colleen Burton, President Dianne Laura, Vice President Tammy Bonifield, Secretary
Longitudinal Analysis of the Effectiveness of DCPS Teachers
 F I N A L R E P O R T Longitudinal Analysis of the Effectiveness of DCPS Teachers July 8, 2014 Elias Walsh Dallas Dotter Submitted to: DC Education Consortium for Research and Evaluation School of Education
Cooper Upper Elementary School
 LIVONIA PUBLIC SCHOOLS www.livoniapublicschools.org/cooper 213-214 BOARD OF EDUCATION 213-14 Mark Johnson, President Colleen Burton, Vice President Dianne Laura, Secretary Tammy Bonifield, Trustee Dan
Cypress College STEM² Program Application
 Academic Year 2016 2017 ********************************************************************************* INSTRUCTIONS Complete this application thoroughly and submit ONLINE OR IN PERSON. Make sure to
Paying for. Cosmetology School S C H O O L B E AU T Y. Financing your new life. beautyschoolnetwork.com pg 1
 Paying for Cosmetology School B E AU T Y S C H O O L Financing your new life. beautyschoolnetwork.com beautyschoolnetwork.com pg 1 B E AU T Y S C H O O L Table of Contents How to Pay for Cosmetology School...
(Includes a Detailed Analysis of Responses to Overall Satisfaction and Quality of Academic Advising Items) By Steve Chatman
 By Steve Chatman") Report #202-1/01 Using Item Correlation With Global Satisfaction Within Academic Division to Reduce Questionnaire Length and to Raise the Value of Results An Analysis of Results from the 1996 UC Survey
Report #202-1/01 Using Item Correlation With Global Satisfaction Within Academic Division to Reduce Questionnaire Length and to Raise the Value of Results An Analysis of Results from the 1996 UC Survey
Wisconsin 4 th Grade Reading Results on the 2015 National Assessment of Educational Progress (NAEP)
") Wisconsin 4 th Grade Reading Results on the 2015 National Assessment of Educational Progress (NAEP) Main takeaways from the 2015 NAEP 4 th grade reading exam: Wisconsin scores have been statistically flat
Wisconsin 4 th Grade Reading Results on the 2015 National Assessment of Educational Progress (NAEP) Main takeaways from the 2015 NAEP 4 th grade reading exam: Wisconsin scores have been statistically flat
Updated: December Educational Attainment
 Updated: Educational Attainment Among 25- to 29-year olds, the proportions who have attained a high school education, some college, or a bachelor s degree are all rising, according to longterm trends.
An Analysis of the El Reno Area Labor Force
 An Analysis of the El Reno Area Labor Force Summary Report for the El Reno Industrial Development Corporation and Oklahoma Department of Commerce David A. Penn and Robert C. Dauffenbach Center for Economic
STEM Academy Workshops Evaluation
 OFFICE OF INSTITUTIONAL RESEARCH RESEARCH BRIEF #882 August 2015 STEM Academy Workshops Evaluation By Daniel Berumen, MPA Introduction The current report summarizes the results of the research activities
SUNY Downstate Medical Center Brooklyn, NY
 C O L L E G E P R O F I L E - O V E R V I E W SUNY Downstate Medical Center Brooklyn, NY SUNY Health Science Center at Brooklyn, founded in 1858, is a public, upper-division institution. Its 13-acre campus
Report on Academic Recruitment, Hiring, and Attrition
 Report on 2015 2016 Academic Recruitment, Hiring, and Attrition Amanda L. Golbeck, Thomas H. Barr, and Colleen A. Rose Each year in academic mathematical sciences departments around the United States,
have professional experience before graduating... The University of Texas at Austin Budget difficulties
 1. Number of qualified applicants that are willing to move. 2. Pay A disconnect between what is wanted in the positions and the experience of the available pool Academic libraries move slowly. Too often
International Literacy Day and National Adult Education and Family Literacy Week TOOLKIT 2015
 International Literacy Day and National Adult Education and Family Literacy Week TOOLKIT 2015 ABOUT THIS TOOLKIT The media provides an important channel for getting the message out about the adult literacy
This course has been proposed to fulfill the Individuals, Institutions, and Cultures Level 1 pillar.
 FILM 1302: Contemporary Media Culture January 2015 SMU-in-Plano Course Description This course provides a broad overview of contemporary media as industrial and cultural institutions, exploring the key
Augusta University MPA Program Diversity and Cultural Competency Plan. Section One: Description of the Plan
 Augusta University MPA Program Diversity and Cultural Competency Plan Section One: Description of the Plan Over the past 20 years, the United States has gone through tremendous changes. Those changes include
National Survey of Student Engagement The College Student Report
 The College Student Report This is a facsimile of the NSSE survey (available at nsse.iub.edu/links/surveys). The survey itself is administered online. 1. During the current school year, about how often
Redirected Inbound Call Sampling An Example of Fit for Purpose Non-probability Sample Design
 Redirected Inbound Call Sampling An Example of Fit for Purpose Non-probability Sample Design Burton Levine Karol Krotki NISS/WSS Workshop on Inference from Nonprobability Samples September 25, 2017 RTI
MAINE 2011 For a strong economy, the skills gap must be closed.
 For a strong economy, the skills gap must be closed. 62% 36% 26% By 2020, jobs requiring a career certificate or college degree Skills gap Too few students make it through college. MEMBER Maine adults
CLASSROOM USE AND UTILIZATION by Ira Fink, Ph.D., FAIA
 Originally published in the May/June 2002 issue of Facilities Manager, published by APPA. CLASSROOM USE AND UTILIZATION by Ira Fink, Ph.D., FAIA Ira Fink is president of Ira Fink and Associates, Inc.,
Lesson M4. page 1 of 2
 Lesson M4 page 1 of 2 Miniature Gulf Coast Project Math TEKS Objectives 111.22 6b.1 (A) apply mathematics to problems arising in everyday life, society, and the workplace; 6b.1 (C) select tools, including
University of Maine at Augusta Augusta, ME
 C O L L E G E P R O F I L E - O V E R V I E W University of Maine at Augusta Augusta, ME U Maine at Augusta, founded in 1965, is a public university. Its 165-acre campus is located in Augusta, 50 miles
Annual Report to the Public. Dr. Greg Murry, Superintendent
 Annual Report to the Public Dr. Greg Murry, Superintendent 1 Conway Board of Education Ms. Susan McNabb Mr. Bill Clements Mr. Chuck Shipp Mr. Carl Barger Dr. Adam Lamey Dr. Quentin Washispack Mr. Andre
The First Annual Survey of the Community
 The Center for Community Studies at Jefferson Community College Presentation of Results: The First Annual Survey of the Community June, 2000 at Dr. Richard L. Halpin, Director Table of Contents Acknowledgements
AMERICA READS*COUNTS PROGRAM EVALUATION. School Year
 AMERICA READS*COUNTS PROGRAM EVALUATION School Year 2014-15 October 2015 ABOUT THE LEDUC CENTER FOR CIVIC ENGAGEMENT The University of Massachusetts Dartmouth seeks to prepare students for life as active
Teacher Supply and Demand in the State of Wyoming
 Teacher Supply and Demand in the State of Wyoming Supply Demand Prepared by Robert Reichardt 2002 McREL To order copies of Teacher Supply and Demand in the State of Wyoming, contact McREL: Mid-continent
Legacy of NAACP Salary equalization suits.
 Why tests, anyway? Legacy of NAACP Salary equalization suits. If you can t beat em, test em. Boom! Legacy of teacher tests NTE PRAXIS-II Pearson Content Examinations GRE ACT SAT All are statistically significantly