(Draft 1: Conservative estimates)
|
|
|
- Myron Cross
- 5 years ago
- Views:
Transcription
1 Summary of Dongchan Lee s new discoveries after the release of the TIMSS 2015 and PISA 2015 results on math, science, and readings & the historic impacts for the global math education and economy of all the nations Prepared by Dongchan Lee Date: Janaury 13 th, 2017 (Draft 1: Conservative estimates) All rights reserved by Dongchan Lee
 & 4 OTHERS (FROM THE TOTAL 84 COUNTRY DATA SET). TAIPEI MISSING LIE $82,700 $72,700 SGP y = 439.09e 0.")

2 GDP PER CAPITA BASED ON PPP IN 2015 s s NORMALIZED COMPOSITE MATH SCORES OF ALL TIMSS AND PISA MATH VS. GDP PER CAPITA BASED ON PPP IN 2015 AFTER 12 OUTLIERS (8 TOP OIL -RICHEST COUNTRIES & VIETNAM) & 4 OTHERS (FROM THE TOTAL 84 COUNTRY DATA SET). TAIPEI MISSING LIE $82,700 $72,700 SGP y = e x R² = An amazing power of reducing the math poverty in the developed nations (the OECD level nations) by 20-30%. $62,700 $52,700 $42,700 $32,700 $22,700 $12,700 DOM SLV KGZ USA CHE IRL AUT NLD DEU SWEAUS DNK CAN ISL BEL GBR FIN FRA NZL ITA ISRESP MLT CZE CYP SVN PRT LTU SVK EST GRC MYS KAZ POL HUN RUS LVA CHL PAN URY HRV ARG ROM MUS TUR IRN MEX AZE BGR BRA MNE CRI THA COL DZAMKD LBN SRB PER TUN ALB MNG IDN JOR KSV GEO UKR MAR PHL $2, JPN HKG KOR Counttries in the regression Expon. (Counttries in the regression) You empower the math poorest out of their stangnations. The result is that you all get richer than all you richer friends that you envy. Except that you make this happen in a few or several decades instead of years. NORMALIZED COMPOSITE MATH SCORES OF ALL TIMSS AND PISA When the log is converted to the normal linear space growths.
3 LOG OF GDP PER CAPITA BASED ON PPP IN 2015 $143,489 NORMALIZED COMPOSITE MATH SCORES OF ALL TIMSS AND PISA MATH VS. LOG OF GDP PER CAPITA BASED ON PPP IN 2015 AFTER 12 OUTLIERS (8 TOP OIL-RICHEST COUNTRIES & VIETNAM) & 4 OTHERS (FROM THE TOTAL 84 COUNTRY DATA SET). TAIPEI MISSING MAC The red arrow is the math chasm between the top math countries and poorest math countries in the entire PISA and TIMSS tests $53,144 $19,683 $7,290 DOM SLV KGZ CHE USA IRL DEU NLD DNK AUT ISL SWEAUSCAN BEL FRA GBR FIN NZL ITA ISR ESP CYP MLT SVN CZE PRT LTU SVK EST MYS GRC KAZ POL HUN RUS LVA CHL PAN URY HRV ARG ROM MUS TUR IRN MEX AZEBGR BRA THA MNE CRI DZA LBN COL MKD SRB PER TUN MNG JOR ALB IDN MAR PHL KSV GEO UKR MMU1 math boost ~ 1.35 STDEV, which occupy more than ½ of the entire PISA-TIMSS math range worldwide. LIE JPN HKG KOR SGP y = e x R² = Counttries in the regression Expon. (Counttries in the regression) $2, To reduce the math poverty (about PISA math 420 cut off point) by 20-30% in the developed nations ~ is roughly the arrow growth you see here. NORMALIZED COMPOSITE MATH SCORES OF ALL TIMSS AND PISA
4 Summary of Dongchan Lee s new discoveries after the release of the TIMSS 2015 and PISA 2015 results on math, science, and readings 1) Math skills Income per capita: Math 1 STDEV of math growth ~ times GDP per capita growths in PPP 2) All developed Englihs speaking countries and most of the Latin American countries have the stronger reading scores than math scores by large margins. 3) The difference of the math scores reading scores can explain the income growths better than the mean school years if we exclude 3-6 outliers (5-10% of the participating number of nations). 4) All developed English speaking countries and most of the Latin American countries have the stronger reading scores than math scores by large margins. 5) As years go by, the impact of the relative strength of math over reading skills tend to impact the GDP per capita more strongly, about 50-75% of the overall impact levels of the math average scores to the income per capita.
5 Summary of Dongchan Lee s new discoveries after the release of the TIMSS 2015 and PISA 2015 results on math 1) The results of the PISA 2015, TIMSS 2015, and the overall patterns of the math score growths past years show that most developed nations are stagnating. 2) The overall lost years of math growth in the USA, South Korea, etc. for instance, show that the estimated GDP loss to these nations are at least 2-5 years of the annual GDP over the next half a century. (in upcoming paper). 3) In spite of the fast rise of the technology-based education, including that for mathematics in most of the developed countries, obviously the technology can t solve the math EDU stagnations. There must be alternatives. NOTE: if the governments stay as they have been, the history of the past years clearly show that there are little chances for them to raise their national math average. The technology has limits. Only MMU1 can show the first signs of evidences so that all can move forward after the initial more evidences in the developed nations rise.

 as")
6 MMU1 (Mini Mini USL1) proposals to Americas 2017 Ending Math Poverty With Dongchan Lee To raise nationally this takes years normally. 25% 25% 25% 25% Very quickly The Best math 50% (with the school teachers) as appetizers ~ 1.35 STDEV advances The Worst math 50% with Dongchan Lee
7 PISA & TIMSS math (the 2 Olympics or World Cup of math and science education assessments in the world) growth stagnations or even collapses : the average math and percentile distributions of PISA (15 years) & TIMSS (20 years) & why MMU1 by Dongchan Lee can change these all quickly 7 English-speaking developed countries, Latin American countries, and 3 of Asian Tigers Dongchan Lee, All rights reserved
8
9 MMU1 is all about following the yellow arrow. MMU1 pilots are to boost the math poverty to end the math poverty: from the low 25 percentile to about 25 percentile to get the first flavor of what this is going to be like to the national governments that can fully commit and support the MMU1 initiatives. As such, this will focus first on the math poorest % of the student population in each participating cities, states, or counries.
10 See the quasi-flat growths of these nations for 12 years in PISA overall. The yellow arrow is roughly the efficiency slope boost in MMU1 level operations.
 Thailand Spain Ireland Latvia Croatia Chinese Taipei United Kingdom Switzerland Jordan Luxembourg OECD average-30 Austria")
11 Qatar Albania Georgia Moldova Romania Peru Israel Malta Bulgaria Portugal Italy Montenegro Brazil Russia Colombia Mexico Poland Macao (China) Tunisia Indonesia Chile Estonia Turkey Trinidad and Tobago Slovenia Germany Singapore Norway Greece Japan Hong Kong (China) Thailand Spain Ireland Latvia Croatia Chinese Taipei United Kingdom Switzerland Jordan Luxembourg OECD average-30 Austria Denmark United States Lithuania Uruguay Korea France Hungary Canada Belgium Sweden Slovak Republic Costa Rica Netherlands Czech Republic United Arab Emirates Iceland Australia New Zealand Finland Viet Nam Score-point difference Years it take to growth 1 Standard Deviation Average three-year trend in mathematics across PISA assessments The largest math EDU collapse in 2015 for the developed nations, including 100% of the Asian Tigers and most of the English speaking nations


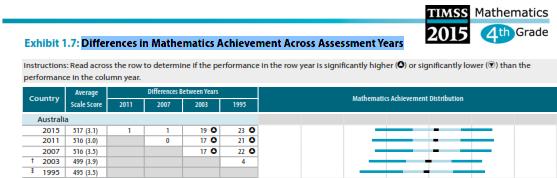
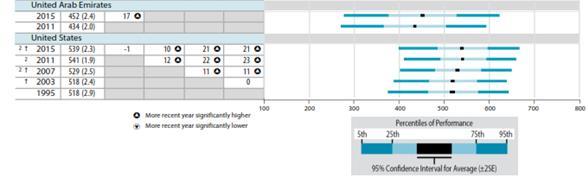
12 Quasi-horizontal TIMSS math growths past 20 years and what MMU1 is equivalent to do if implemented (Yellow Arrows) TIMSS Math grade 4 th slow growths TIMSS Math grade 8 th slow growths
13 Years it tkes to grow math average by 1 Standard Deviation Annualized PISA math growths till PISA 2015 Years it tkes to grow math average by 1 Standard Deviation Annualized PISA math growths till PISA These show how many generations are needed to even boost the national math by 40-80% of what MMU1 can do. Years it take to have the national math average growth by 0.5 Standard Deviation (PISA ) in English, Spanish, Portuguese, or Korean speaking countries Years it take to have the national math average growth by 0.5 Standard Deviation (PISA ) Average Annual Math score change (as % of 1 Standard Deviation or PISA 100 ponts) Years it take to have the national math average growth by 1 Standard Deviation (PISA ) in English, Spanish, Portuguese, or Korean speaking countries Years it take to have the national math average growth by 1 Standard Deviation (PISA ) Average Annual Math score change (as % of 1 Standard Deviation or PISA 100 ponts) PISA countries for math (for the average math growth trends ) PISA countries for math (for the average math growth trends )
14 The stagnations of the math growths of TIMSS grades 4 and 8 in all English speaking developed countries and some others in the next page. They are all vertical. The YELLOW ARROW is what MMU1 focuses on: to empower the math poorer 25 percentile to the 75 percentile very rapidly for the fully supporting, committed nations.
15

16 The stagnations of the math growths of PISA math in all English speaking developed countries and some others in the next page. They are all horizontal. The YELLOW ARROW is what MMU1 focuses on vertically: to empower the math poorer 25 percentile to the 75 percentile very rapidly for the fully supporting, committed nations.
17 PISA math scores PISA math scores 700 United States: PISA math trajectories: Math poverty levels & percentile distributions (entire history) 700 AUSTRALIA: PISA math trajectories: Math poverty levels & percentile distributions (entire history) math 95 percentile 600 math 95 percentile Years (15 years of PISA) math 75 percentile Average PISA math scores over time math 25 percentile math 5 percentile Years (15 years of PISA) math 75 percentile Average PISA math scores over time math 25 percentile (Math Poverty) math 5 percentile (Extreme Math Poverty) The red arrow is the math chasm between the top math countries and poorest math countries in the entire PISA and TIMSS tests
18 PISA math scores PISA math scores United Kingdom: PISA math trajectories: Math poverty levels & percentile distributions (entire history) CANADA: PISA math trajectories: Math poverty levels & percentile distributions (entire history) math 95 percentile math 95 percentile math 75 percentile math 75 percentile Average PISA math scores over time math 25 percentile math 5 percentile Average PISA math scores over time math 25 percentile math 5 percentile The red arrow is the math chasm between the top math countries and poorest math countries in the entire PISA and TIMSS tests Years (15 years of PISA) Years (15 years of PISA)
19 PISA math scores NEW ZEALAND: PISA math trajectories: Math poverty levels & percentile distributions (entire history) math 95 percentile math 75 percentile Average PISA math scores over time math 25 percentile math 5 percentile The red arrow is the math chasm between the top math countries and poorest math countries in the entire PISA and TIMSS tests Years (15 years of PISA)
20 PISA math growths : Latin American countries
21 PISA math scores 600 Brazil: PISA math trajectories: Math poverty levels & percentile distributions (entire history) math 95 percentile math 75 percentile Average PISA math scores over time math 25 percentile The red arrow is the math chasm between the top math countries and poorest math countries in the entire PISA and TIMSS tests math 5 percentile Years (15 years of PISA)
22 How much can the dominance of math average over that of reading average can impact the GDP per capita as time goes on?
23 PISA math scores PISA math scores CHILE: PISA math trajectories: Math poverty levels & percentile distributions (entire history) MEXICO: PISA math trajectories: Math poverty levels & percentile distributions (entire history) math 95 percentile math 75 percentile Average PISA math scores over time math 25 percentile math 5 percentile math 95 percentile math 75 percentile Average PISA math scores over time math 25 percentile math 5 percentile The red arrow is the math chasm between the top math countries and poorest math countries in the entire PISA and TIMSS tests Years (15 years of PISA) Years (15 years of PISA)
24 PISA math scores PISA math scores 550 COSTA RICA: PISA math trajectories: Math poverty levels & percentile distributions (entire history) 600 URUGUAY: PISA math trajectories: Math poverty levels & percentile distributions (entire history) 550 math 95 percentile math 95 percentile math 75 percentile Average PISA math scores over time math 75 percentile Average PISA math scores over time math 25 percentile The red arrow is the math chasm between the top math countries and poorest math countries in the entire PISA and TIMSS tests 350 math 25 percentile 300 math 5 percentile 300 math 5 percentile Years (15 years of PISA) Years (15 years of PISA)
25 Country Time math 95 percentile math 75 percentile Average PISA math smath 25 percentile (math 5 percentile (E Australia Australia Australia Australia Australia Australia Country Time math 95 percentile math 75 percentile Average PISA math smath 25 percentile math 5 percentile Canada Canada Canada Canada Canada Canada Country Time math 95 percentile math 75 percentile Average PISA math smath 25 percentile math 5 percentile Ireland Ireland Ireland Ireland Ireland Ireland Country Time math 95 percentile math 75 percentile Average PISA math smath 25 percentile math 5 percentile New Zealand New Zealand New Zealand New Zealand New Zealand New Zealand Country Time math 95 percentile math 75 percentile Average PISA math smath 25 percentile math 5 percentile United Kingdom United Kingdom United Kingdom United Kingdom United Kingdom United Kingdom Country Time math 95 percentile math 75 percentile Average PISA math smath 25 percentile math 5 percentile United States United States United States United States United States United States Country Time math 95 percentile math 75 percentile Average PISA math smath 25 percentile math 5 percentile Trinidad and To Trinidad and To 2012 Trinidad and To Country Time math 95 percentile math 75 percentile Average PISA math smath 25 percentile math 5 percentile United Arab Em United Arab Em Country Time math 95 percentile math 75 percentile Average PISA math smath 25 percentile math 5 percentile Singapore Singapore Singapore Country Time math 95 percentile math 75 percentile Average PISA math smath 25 percentile math 5 percentile Hong Kong SAR Hong Kong SAR Hong Kong SAR Hong Kong SAR Hong Kong SAR Hong Kong SAR Country Time math 95 percentile math 75 percentile Average PISA math smath 25 percentile math 5 percentile Argentina Argentina 2001 Argentina 2003 Argentina Argentina Argentina Argentina 2015 Country Time math 95 percentile math 75 percentile Average PISA math smath 25 percentile math 5 percentile Brazil Brazil Brazil Brazil Brazil Brazil Country Time math 95 percentile math 75 percentile Average PISA math smath 25 percentile math 5 percentile Chile Chile 2003 Chile Chile Chile Chile Country Time math 95 percentile math 75 percentile Average PISA math smath 25 percentile math 5 percentile Colombia 2000 Colombia 2003 Colombia Colombia Colombia Colombia Country Time math 95 percentile math 75 percentile Average PISA math smath 25 percentile math 5 percentile Costa Rica 2000 Costa Rica 2003 Costa Rica 2006 Costa Rica Costa Rica Costa Rica Country Time math 95 percentile math 75 percentile Average PISA math smath 25 percentile math 5 percentile Dominican Repu Country Time math 95 percentile math 75 percentile Average PISA math smath 25 percentile math 5 percentile Mexico Mexico Mexico Mexico Mexico Mexico Country Time math 95 percentile math 75 percentile Average PISA math smath 25 percentile math 5 percentile Uruguay 2000 Uruguay Uruguay Uruguay Uruguay Uruguay Source: OECD s PISA data for PISA math growths :
26 PISA math growths : Asian Tigers: developed countries
27 Years it tkes to grow math average by 1 Standard Deviation Annualized PISA math growths till PISA 2015 Years it take to have the national math average growth by 1 Standard Deviation (PISA ) of the Eastern Asian countries Years it take to have the national math average growth by 1 Standard Deviation (PISA ) Average Annual Math score change (as % of 1 Standard Deviation or PISA 100 ponts) Macao (China) Indonesia Singapore Japan Hong Kong (China) Thailand Chinese Taipei OECD average-30 Korea Viet Nam -6.0 PISA countries for math (for the average math growth trends )
28 Years it tkes to grow math average by 1 Standard Deviation Annualized PISA math growths till PISA 2015 Years it take to have the national math average growth by 0.5 Standard Deviation (PISA ) of the Eastern Asian countries Years it take to have the national math average growth by 1 Standard Deviation (PISA ) Average Annual Math score change (as % of 1 Standard Deviation or PISA 100 ponts) Macao (China) Indonesia Singapore Japan Hong Kong (China) Thailand Chinese Taipei OECD average-30 Korea Viet Nam -6.0 PISA countries for math (for the average math growth trends )
29 PISA Math scores & percentile distributions 750 South Korea's PISA math score trajectories and the math poverty distributions PISA: Distribution of Mathematics Scores: 95th Percentile Score [LO.PISA.MAT.P95] The red arrow is the math chasm between the top math countries and poorest math countries in the entire PISA and TIMSS tests PISA math years PISA: Distribution of Mathematics Scores: 75th Percentile Score [LO.PISA.MAT.P75] PISA: Mean performance on the mathematics scale [LO.PISA.MAT] PISA: Distribution of Mathematics Scores: 25th Percentile Score [LO.PISA.MAT.P25] PISA: Distribution of Mathematics Scores: 5th Percentile Score [LO.PISA.MAT.P05]
30 PISA math scores PISA math scores SINGAPORE: PISA math trajectories: Math poverty levels & percentile distributions (entire history) 750 HONG KONG: PISA math trajectories: Math poverty levels & percentile distributions (entire history) math 95 percentile 700 math 95 percentile math 75 percentile 600 math 75 percentile Average PISA math scores over time Average PISA math scores over time math 25 percentile math 25 percentile 450 math 5 percentile math 5 percentile Years (15 years of PISA) Years (15 years of PISA)
31 How much can the dominance of math average over that of reading average can impact the GDP per capita as time goes on?
32 reading score PISA 2015 reading score PISA 2015 science score PISA Math vs. Science. pisa 2015 y = x R² = Science vs. Reading. pisa y = x R² = Math vs. Reading. pisa y = x R² = math scores PISA Science scores PISA math test PISA 2015 Source: OECD, PISA 2015 Database, Tables I.2.4a, I.2.6, I.2.7, I.4.4a and I.5.4a.
33 PISA 2015 average of Science & Reading 600 Correlations between PISA 2015 Math vs. the average of Reading & Science y = x R² = Chile Uruguay Trinidad and Tobago Peru Brazil Mexico Costa Rica Colombia Finland New Zealand Australia United Kingdom Portugal United States Spain CABA (Argentina) Canada Singapore Japan Hong Kong (China) Macao (China) Chinese Taipei Korea B-S-J-G (China) 400 2) All developed Englihs speaking countries and most of the Latin American countries have the stronger reading scores than math scores by large margins. 350 Dominican Republic 0.5 STDEV PISA 2015 Math score
 Singapore Hong Kong (China) Korea Japan Macao (China) Chinese Taipei")
34 PISA 2015 average of Science & Reading Correlations and dominance between PISA 2015 Math vs. Reading in Americas vs. Eastern Asia 600 Finland Canada y = x R² = New Zealand 500 Uruguay Trinidad and Tobago Chile Australia United Kingdom Portugal United States Spain CABA (Argentina) Singapore Hong Kong (China) Korea Japan Macao (China) Chinese Taipei B-S-J-G (China) 450 Mexico Costa Rica Colombia Peru Brazil 400 Dominican Republic STDEV PISA 2015 Math score Source: OECD, PISA 2015 Database, Tables I.2.4a, I.2.6, I.2.7, I.4.4a and I.5.4a.

35 Math crisis: English-speaking countries

36 2) All developed Englihs speaking countries and most of the Latin American countries have the stronger reading scores than math scores by large margins.
37 In PISA (2012), the shares of math poverty (low performers) are much higher than that of Reading poverty Indonesia Peru Colombia Qatar Jordan Brazil Tunisia Argentina Albania Costa Rica Peru Qatar Kazakhstan Indonesia Argentina Malaysia Albania Colombia Brazil Jordan Tunisia Uruguay Montenegro Mexico Bulgaria Romania United Arab Serbia Chile Thailand Costa Rica Slovak Republic Israel Sweden Greece Russian Federation Luxembourg Turkey Lithuania Slovenia Iceland Hungary Italy Austria France Portugal Croatia Spain OECD average Latvia Czech Republic United Kingdom United States New Zealand Norway Belgium Denmark Germany Australia Netherlands Switzerland Liechtenstein Chinese Taipei Macao-China Finland Canada Poland Singapore Japan Ireland Viet Nam Estonia Korea Hong Kong-China Shanghai-China Montenegro Uruguay Mexico Malaysia Chile Thailand United Arab Emirates Kazakhstan Bulgaria Turkey Romania Serbia Greece Israel Croatia Hungary Slovak Republic Sweden Lithuania United States Portugal Italy Luxembourg Russian Federation Spain OECD average New Zealand France Norway United Kingdom Iceland Czech Republic Slovenia Latvia Australia Belgium Austria Germany Ireland Denmark Netherlands Poland Viet Nam Liechtenstein Canada Chinese Taipei Switzerland Finland Japan Macao-China Estonia Korea Hong Kong-China Singapore Shanghai-China % Math poverty (Low performers Below Level 1) of 40% or more: 22 countries Below level 1 Level 1 Percentage of low performers (Level 1 or below) in Mathematics Less math poverty than 20%: 22 countries / economies Source: Figure % Reading poverty of 40% or more: 14 countries Below Level 1b Level 1b Level 1a Much less Reading poverty of 20% or less: 34 countries / economies Percentage of low performers (Level 1a or below) in reading
38 In the following regressions, you have to be aware that the typical correlation or growth coefficients of GDP per capita vs. the Mean school years is about R^2 ~ For instance, according to Hanushek & Woessmann s regressions about the linear correlation between these 2 factors without including cognitive skills at all, the growth coefficient is about 0.35 and the R^2 ~ 0.25 (meaning that the mean school year alone can explain only about 25% of the GDP per capita grwoths (at least based on their regression based on 50 countries between ). Keeping this in mind that the PISA math reading score difference against the GDP per capita based on PPP leads to about similar magnitude of R^2 when about 3-5 outliers are taken out.
39 How much can the dominance of math average over that of reading average can impact the GDP per capita as time goes on?
40 Math overall average of PISA math impacts on GDP per capita $132,860 PISA MATH READING S OVERALL SCORE ( ) VS. LOG OF GDP PER CAPITA, PPP (CURRENT INTERNATIONAL $) 2015 AFTER REMOVING 6 OUTLIER COUNTRIES (OUT OF THE 77 TOTAL COUNTRIES) QAT LUX $132,860 PISA math - Reading overall scores ( ) vs. log of GDP per capita, PPP (current international $) 2015 after removing 6 outliers (out of the 77 total countries) y = 15832e x R² = $49,208 y = 26466e x R² = $49,208 y = 26466e x R² = $18,225 LBN AZE $18,225 y = 35261e x R² = $6,750 $6,750 KGZ $2, $2,

41 After eliminating typically 3, 4, or 6 outliers out of about participating nations over the last 12 years ( PISA math and reading)
42 . Log of GDP per capita, PPP (current international $) in 2015 Time lag in 0 years No significant changes PISA 2015 difference of Math - Reading vs. Log of GDP per capita, PPP (current international $) in 2015 after excluding 5 outliers $78,732 $29,160 y = 27658e x R² = $10,800 $4, Math - Reading score difference
43 log of GDP per capita, PPP (current international $) in 2015 Time lag in 3 years PISA 2012's difference betwen math - readingscores vs. log of GDP per capita, PPP (current international $) in 2015 after 4 outliers exludded out of the 59 countries Qatar Luxembourg $98,415 y = 31066e x R² = $36,450 Kazakhstan $13,500 Vietnam $5, PISA 2012's difference betwen math - reading scores
44 log of GDP per capita based on PPP 2015 Time lag in 6 years PISA 2009's difference between math - reading scores vs. log of GDP per capita, PPP (current international $) in 2015, after removing 4 outliers $148,803 $55,112 y = 28685e x R² = $20,412 $7,560 $2, PISA 2009's difference between math - reading scores
45 GDP per capita based on PPP in 2015 GDP per capita based on PPP in 2015 Time lag in 9 years PISA 2006 difference between the math - Reading vs. GDP per capita, PPP (current international $) in 2015 after removing 4 outliers $149,591 PISA 2006 difference between the math - Reading vs. GDP per capita, PPP (current international $) in 2015 after removing 3 outliers $148,803 Qatar y = 28324e x R² = $55,404 $55,112 y = 28324e x R² = $20,412 Serbia Azerbaijan $20,520 $7,560 Kyrgyz Republic $7, PISA 2006 Math - Reading score s $2, PISA 2006 Math - Reading score difference
46 LOG OF GDP PER CAPITA, PPP Time lag in 12 years with the district GDP per capita without 3 outliers in 2015 PISA 2003'S DIFFERENCE BETWEEN MATH - READING VS. LOG OF GDP PER CAPITA, PPP (CURRENT INTERNATIONAL $) IN 2015, EXCLUDING 3 OUTLIERS Macao SAR, China Luxembourg Liechtenstein y = 32032e x R² = $58,320 $21,600 Brazil United States Australia United Kingdom Greece Norway Switzerland Hong Kong SAR, China Ireland Austria Netherlands Sweden Canada Germany Denmark Belgium Iceland Finland France New Zealand Italy Japan Spain Korea, Rep. Czech Republic Portugal Uruguay Turkey Mexico Poland Latvia Thailand Hungary Serbia Slovak Republic Russian Federation Tunisia Indonesia $8, PISA'S MATH - READING SCORE DIFFERENCE IN PISA 2003
47 Key conclusions
48 Solutions: USL (Unified Super Learning), starting with MMU1 (Mini Mini USL1 as a series of pilot studies to convince all to end the math poverty rapidy)


49 MMU1 (Mini Mini USL1, Sep-Oct 2016) USL original pilot studies (Oct 2013, Jan-Feb 2014) By Dongchan Lee Far beyond the efficiencies of the best math apps, the best math average nations The best way to end the global math poverty in 2-5 years The best way to end the global poverty in years, not just extreme poverty in years
 vs. the typical school math gains 30% -->61% in 1.5 month 30%-->71% in 1.5 month 30%-->80% in 1.")

50 % of correct answers in the exams % of score gains per x days: Learning speed comparisons: the typical USL pilot study results (10-50x faster than usual) vs. the typical school math gains 30% -->61% in 1.5 month 30%-->71% in 1.5 month 30%-->80% in 1.5 month 35% -->60% in 1 month 35%-->70% in 1 month 34-->80% in 1 month 40%-->60% 40%-->70% USL slower USL average USL faster 100% 90% 1 class minutes USL 80% A A A Evidences 70% C C C 60% F F F 50% 40% 30% 20% months of the regular math classes 10% 0% Days needed for the regular school math tests
 for the grades 3, 4, and 5 USL 1.")

51 Rule of thumb for MMU1: very rapid rise of the worst math students to the best half students (Pilot studies summary) 25% 25% The Best 50% (with the school teachers) MMU1 (Mini Mini USL1) from 2 good private schools with Dongchan Lee USL 1.5: basic advances MMU1 in El Alba (a good private school in Momostenango) for the grades 3, 4, and 5 USL 1.0 ITEC of UVG (the best school of the state of Solola, Guatemala) for the grade 1 Still using only ~ 4-8% of the original original USL capacity of 2014 USL 0.5: the best scenario without USL 25% 25% The Worst 50% with Dongchan Lee ~ years needed normally, nationally The rise of the school average: ~ 1.35 STDEV: Guatemala F Average of the CA o NY of the USA. Grade 3, 5 Grade 4 ~ years needed normally, nationally Test 1 Test 2 The rise of the school average: ~ 1 STDEV: Guatemala F the average of the highest average 4 Latin American countries ~ years needed normally, nationally The rise of the school average: ~ 0.5 STDEV: Colombia, Argentina, Brazil, Ecuador D the average of the highest average 4 Latin American countries
52 Ending Math Poverty MMU1 (Mini Mini USL1) proposals to Americas 2017 Ending Poverty With Dongchan Lee Sustainable Growths 25% Very quickly The Best math 50% (with the school teachers) Evidence-based only 25% as appetizers Massive Math boosts by MMU1 Public-Private Partnership 25% 25% ~ 1.35 STDEV advances The Worst math 50% with Dongchan Lee 100% internet-based (~100% tablet or computer-based) Charged from Solar Panels Purified Water from Solar panels With the national & state governments & MOEs of the English, Spanish, Portuguesespeaking countries first. with the UN
53 Invite Dongchan Lee To run MMU1 Pilot studies In your country With your Ministries Of Edu Support him. Fund him. Help him end the math poverty. Give him media publicities. Bring him philanthropists. To end the poverty. To make USL go global. Bring him Investors. Faster than anyone else can.. In the entire world. Make him demonstrate to the UNESCO To the General Assembly of the UN. Help him create his own 1 NGO per country Help him accelerate the SDGs of the UN far faster than currently possible.

54
Department of Education and Skills. Memorandum
 Department of Education and Skills Memorandum Irish Students Performance in PISA 2012 1. Background 1.1. What is PISA? The Programme for International Student Assessment (PISA) is a project of the Organisation
Overall student visa trends June 2017
 Overall student visa trends June 2017 Acronyms Acronyms FSV First-time student visas The number of visas issued to students for the first time. Visas for dependants and Section 61 applicants are excluded
Introduction Research Teaching Cooperation Faculties. University of Oulu
 University of Oulu Founded in 1958 faculties 1 000 students 2900 employees Total funding EUR 22 million Among the largest universities in Finland with an exceptionally wide scientific base Three universities
Twenty years of TIMSS in England. NFER Education Briefings. What is TIMSS?
 NFER Education Briefings Twenty years of TIMSS in England What is TIMSS? The Trends in International Mathematics and Science Study (TIMSS) is a worldwide research project run by the IEA 1. It takes place
National Academies STEM Workforce Summit
 National Academies STEM Workforce Summit September 21-22, 2015 Irwin Kirsch Director, Center for Global Assessment PIAAC and Policy Research ETS Policy Research using PIAAC data America s Skills Challenge:
Students with Disabilities, Learning Difficulties and Disadvantages STATISTICS AND INDICATORS
 Students with Disabilities, Learning Difficulties and Disadvantages STATISTICS AND INDICATORS CENTRE FOR EDUCATIONAL RESEARCH AND INNOVATION Students with Disabilities, Learning Difficulties and Disadvantages
PIRLS. International Achievement in the Processes of Reading Comprehension Results from PIRLS 2001 in 35 Countries
 Ina V.S. Mullis Michael O. Martin Eugenio J. Gonzalez PIRLS International Achievement in the Processes of Reading Comprehension Results from PIRLS 2001 in 35 Countries International Study Center International
Impact of Educational Reforms to International Cooperation CASE: Finland
 Impact of Educational Reforms to International Cooperation CASE: Finland February 11, 2016 10 th Seminar on Cooperation between Russian and Finnish Institutions of Higher Education Tiina Vihma-Purovaara
The Rise of Populism. December 8-10, 2017
 The Rise of Populism December 8-10, 2017 The Rise of Populism LIST OF PARTICIPATING SCHOOL Byron College B Arsakeio Tositseio Lykeio Ekalis A Tositseio Arsakeio Lykeio Ekalis QSI Tbilisi Ionios School
Measuring up: Canadian Results of the OECD PISA Study
 Measuring up: Canadian Results of the OECD PISA Study The Performance of Canada s Youth in Science, Reading and Mathematics 2015 First Results for Canadians Aged 15 Measuring up: Canadian Results of the
Universities as Laboratories for Societal Multilingualism: Insights from Implementation
 Universities as Laboratories for Societal Multilingualism: Insights from Implementation Dr. Thomas Vogel Europa-Universität Viadrina vogel@europa-uni.de The Agenda 1. Language policy issues 2. The global
HIGHLIGHTS OF FINDINGS FROM MAJOR INTERNATIONAL STUDY ON PEDAGOGY AND ICT USE IN SCHOOLS
 HIGHLIGHTS OF FINDINGS FROM MAJOR INTERNATIONAL STUDY ON PEDAGOGY AND ICT USE IN SCHOOLS Hans Wagemaker Executive Director, IEA Nancy Law Director, CITE, University of Hong Kong SITES 2006 International
PROGRESS TOWARDS THE LISBON OBJECTIVES IN EDUCATION AND TRAINING
 COMMISSION OF THE EUROPEAN COMMUNITIES Commission staff working document PROGRESS TOWARDS THE LISBON OBJECTIVES IN EDUCATION AND TRAINING Indicators and benchmarks 2008 This publication is based on document
TIMSS Highlights from the Primary Grades
 TIMSS International Study Center June 1997 BOSTON COLLEGE TIMSS Highlights from the Primary Grades THIRD INTERNATIONAL MATHEMATICS AND SCIENCE STUDY Most Recent Publications International comparative results
Welcome to. ECML/PKDD 2004 Community meeting
 Welcome to ECML/PKDD 2004 Community meeting A brief report from the program chairs Jean-Francois Boulicaut, INSA-Lyon, France Floriana Esposito, University of Bari, Italy Fosca Giannotti, ISTI-CNR, Pisa,
Improving education in the Gulf
 Improving education in the Gulf 39 Improving education in the Gulf Educational reform should focus on outcomes, not inputs. Michael Barber, Mona Mourshed, and Fenton Whelan Having largely achieved the
CHAPTER 3 CURRENT PERFORMANCE
 CHAPTER 3 current 3-1 3. Current Performance The examination of the performance of the n education system begins with an analysis of how students have fared over time, and in comparison with other countries,
15-year-olds enrolled full-time in educational institutions;
 CHAPTER 4 SAMPLE DESIGN TARGET POPULATION AND OVERVIEW OF THE SAMPLING DESIGN The desired base PISA target population in each country consisted of 15-year-old students attending educational institutions
Teaching Practices and Social Capital
 D I S C U S S I O N P A P E R S E R I E S IZA DP No. 6052 Teaching Practices and Social Capital Yann Algan Pierre Cahuc Andrei Shleifer October 2011 Forschungsinstitut zur Zukunft der Arbeit Institute
DEVELOPMENT AID AT A GLANCE
 DEVELOPMENT AID AT A GLANCE STATISTICS BY REGION 2. AFRICA 217 edition 2.1. ODA TO AFRICA - SUMMARY 2.1.1. Top 1 ODA receipts by recipient USD million, net disbursements in 21 2.1.3. Trends in ODA 1 Ethiopia
EXECUTIVE SUMMARY. TIMSS 1999 International Mathematics Report
 EXECUTIVE SUMMARY TIMSS 1999 International Mathematics Report S S Executive Summary In 1999, the Third International Mathematics and Science Study (timss) was replicated at the eighth grade. Involving
Science and Technology Indicators. R&D statistics
 2014 Science and Technology Indicators R&D statistics Science and Technology Indicators R&D statistics 2014 Published by NIFU Nordic Institute for Studies in Innovation, Research and Education Address
GHSA Global Activities Update. Presentation by Indonesia
 GHSA Global Activities Update Presentation by Indonesia as the GHSA chair in 2016 2016 Global Activities JEE Process Action Packages Coordination Jakarta Call for Action A Systemic Network Model : Coordination
Education: Setting the Stage. Abhijit V. Banerjee and Esther Duflo Lecture , Spring 2011
 Education: Setting the Stage Abhijit V. Banerjee and Esther Duflo Lecture 9 14.73, Spring 2011 1 Educating Yaprak The story of a kurdish girl who goes to boarding school after education is made compulsory
Challenges for Higher Education in Europe: Socio-economic and Political Transformations
 Challenges for Higher Education in Europe: Socio-economic and Political Transformations Steinhardt Institute NYU 15 June, 2017 Peter Maassen US governance of higher education EU governance of higher
Advances in Aviation Management Education
 Advances in Aviation Management Education by Dr. Dale Doreen, Director International Aviation MBA Program John Molson School of Business Concordia University 15 th Annual Canadian Aviation Safety Seminar
RELATIONS. I. Facts and Trends INTERNATIONAL. II. Profile of Graduates. Placement Report. IV. Recruiting Companies
 I. Facts and Trends II. Profile of Graduates III. International Placement Statistics IV. Recruiting Companies mir.ie.edu After the graduation of our 4th intake of the Master in International Relations
EXECUTIVE SUMMARY. TIMSS 1999 International Science Report
 EXECUTIVE SUMMARY TIMSS 1999 International Science Report S S Executive Summary In 1999, the Third International Mathematics and Science Study (timss) was replicated at the eighth grade. Involving 41 countries
16-17 NOVEMBER 2017, MOSCOW, RUSSIAN FEDERATION OVERVIEW PRESENTATION
 16-17 NOVEMBER 2017, MOSCOW, RUSSIAN FEDERATION OVERVIEW PRESENTATION Tuberculosis is the leading infectious killer Current actions and investments are falling far short ENDING TB IN THE SUSTAINABLE DEVELOPMENT
qwertyuiopasdfghjklzxcvbnmq wertyuiopasdfghjklzxcvbnmqw ertyuiopasdfghjklzxcvbnmqwer tyuiopasdfghjklzxcvbnmqwerty
 qwertyuiopasdfghjklzxcvbnmq wertyuiopasdfghjklzxcvbnmqw ertyuiopasdfghjklzxcvbnmqwer tyuiopasdfghjklzxcvbnmqwerty ANNEX 3: SOURCES, METHODS AND TECHNICAL NOTES uiopasdfghjklzxcvbnmqwertyui opasdfghjklzxcvbnmqwertyuiop
Eye Level Education. Program Orientation
 Eye Level Education Program Orientation Copyright 2010 Daekyo America, Inc. All Rights Reserved. Eye Level is the key to self-directed learning. We nurture: problem solvers critical thinkers life-long
The European Higher Education Area in 2012:
 PRESS BRIEFING The European Higher Education Area in 2012: Bologna Process Implementation Report EURYDI CE CONTEXT The Bologna Process Implementation Report is the result of a joint effort by Eurostat,
The Survey of Adult Skills (PIAAC) provides a picture of adults proficiency in three key information-processing skills:
 provides a picture of adults proficiency in three key information-processing skills:") SPAIN Key issues The gap between the skills proficiency of the youngest and oldest adults in Spain is the second largest in the survey. About one in four adults in Spain scores at the lowest levels in
SPAIN Key issues The gap between the skills proficiency of the youngest and oldest adults in Spain is the second largest in the survey. About one in four adults in Spain scores at the lowest levels in
International House VANCOUVER / WHISTLER WORK EXPERIENCE
 International House VANCOUVER / WHISTLER WORK EXPERIENCE 2 3 work experience At IH Vancouver, we understand that language acquisition is only the first step in achieving your career goals. With this in
Business Students. AACSB Accredited Business Programs
 AACSB Accredited Business Programs Business Students Study Abroad Office: 32 Sayre Drive, Coxe Hall, 1 st Floor Phone: 610-758-4877 Fax: 610-758-5156 Website: www.lehigh.edu/studyabroad Email: incis@lehigh.edu
HARVARD GLOBAL UPDATE. October 1-2, 2014
 HARVARD GLOBAL UPDATE October 1-2, 2014 All photos are part of the Office of International Education s annual photography contest and were taken by Harvard undergraduates engaged in study, work, internship,
OCW Global Conference 2009 MONTERREY, MEXICO BY GARY W. MATKIN DEAN, CONTINUING EDUCATION LARRY COOPERMAN DIRECTOR, UC IRVINE OCW
 OCW Global Conference 2009 MONTERREY, MEXICO BY GARY W. MATKIN DEAN, CONTINUING EDUCATION LARRY COOPERMAN DIRECTOR, UC IRVINE OCW 200 institutional members in the OCWC Over 8,200 courses posted Over 130
RECOMMENDED CITATION: Pew Research Center, October, 2014, People in Emerging Markets Catch Up to Advanced Economies in Life Satisfaction
 NUMBERS, FACTS AND TRENDS SHAPING THE WORLD FOR RELEASE OCTOBER 30, 2014 FOR FURTHER INFORMATION ON THIS REPORT: Katie Simmons, Senior Researcher Richard Wike, Director, Global Attitudes Research Russ
The International Coach Federation (ICF) Global Consumer Awareness Study
 Global Consumer Awareness Study") www.pwc.com The International Coach Federation (ICF) Global Consumer Awareness Study Summary of the Main Regional Results and Variations Fort Worth, Texas Presentation Structure 2 Research Overview 3 Research
www.pwc.com The International Coach Federation (ICF) Global Consumer Awareness Study Summary of the Main Regional Results and Variations Fort Worth, Texas Presentation Structure 2 Research Overview 3 Research
Problem-Driven Iterative Adaptation (PDIA) and Education System Reform
 and Education System Reform") Problem-Driven Iterative Adaptation (PDIA) and Education System Reform Michael Woolcock Lead Social Development Specialist Development Research Group World Bank Making Education Systems Work Sydney, February
Problem-Driven Iterative Adaptation (PDIA) and Education System Reform Michael Woolcock Lead Social Development Specialist Development Research Group World Bank Making Education Systems Work Sydney, February
Summary and policy recommendations
 Skills Beyond School Synthesis Report OECD 2014 Summary and policy recommendations The hidden world of professional education and training Post-secondary vocational education and training plays an under-recognised
Target 2: Connect universities, colleges, secondary schools and primary schools
 Target 2: Connect universities, colleges, secondary schools and primary schools with ICTs Target 2: Connect universities, colleges, secondary schools and primary schools with ICTs 1 Introduction Governments
How to Search for BSU Study Abroad Programs
 How to Search for BSU Study Abroad Programs Ways to Research Your BSU Options: Visit our website at http://studyabroad.bsu.edu Browse the print brochures outside of our office Speak to students who have
The Conference Center. of the Americas. at the Biltmore Hotel. Miami, Florida
 The Conference Center of the Americas at the Biltmore Hotel Miami, Florida March 7-8, 2001 B R I E F I N G B O O K Acknowledgments This Briefing Book was prepared by the Partnership for Educational Revitalization
Building State Capability for Policy Implementation
 Building State Capability for Policy Implementation MICHAEL WOOLCOCK DEVELOPMENT RESEARCH GROUP, WORLD BANK DEC POLICY RESEARCH TALK WASHINGTON, DC JUNE 5, 2017 Free download available at: http://bsc.cid.harvard.edu/building-state-capability-evidence-analysis-action
international PROJECTS MOSCOW
 international PROJECTS MOSCOW Lomonosov Moscow State University, Faculty of Journalism INTERNATIONAL EXCHANGES Journalism & Communication Partners IHECS Lomonosov Moscow State University, Faculty of Journalism
SOCRATES PROGRAMME GUIDELINES FOR APPLICANTS
 SOCRATES PROGRAMME GUIDELINES FOR APPLICANTS The present document contains a description of the financial support available under all parts of the Community action programme in the field of education,
SOCIO-ECONOMIC FACTORS FOR READING PERFORMANCE IN PIRLS: INCOME INEQUALITY AND SEGREGATION BY ACHIEVEMENTS
 Tamara I. Petrova, Daniel A. Alexandrov SOCIO-ECONOMIC FACTORS FOR READING PERFORMANCE IN PIRLS: INCOME INEQUALITY AND SEGREGATION BY ACHIEVEMENTS BASIC RESEARCH PROGRAM WORKING PAPERS SERIES: EDUCATION
May To print or download your own copies of this document visit Name Date Eurovision Numeracy Assignment
 1. An estimated one hundred and twenty five million people across the world watch the Eurovision Song Contest every year. Write this number in figures. 2. Complete the table below. 2004 2005 2006 2007
No. 11. Table of Contents
 No. 11 Educational Assessments in Latin America: Current Progress and Future Challenges by Laurence Wolff* June 1998 Laurence Wolff is an education consultant at the Inter- American Development Bank in
Berkeley International Office Survey
 Berkeley International Office Survey 1. What is your gender? Male 64.8% 308 Female 35.2% 167 2. What is your age? 17-20 0.0% 0 21-24 17.9% 85 25-30 56.6% 269 31-35 19.2% 91 36+ 6.3% 30 1 of 40 3. What
REFLECTIONS ON THE PERFORMANCE OF THE MEXICAN EDUCATION SYSTEM
 DIRECTORATE FOR EDUCATION REFLECTIONS ON THE PERFORMANCE OF THE MEXICAN EDUCATION SYSTEM DAVID HOPKINS 1, ELPIDA AHTARIDOU, PETER MATTHEWS, CHARLES POSNER AND DIANA TOLEDO FIGUEROA 2 LONDON CENTRE FOR
SECTION 2 APPENDICES 2A, 2B & 2C. Bachelor of Dental Surgery
 Cardiff University College of Biomedical and Life Sciences School of Dentistry Entry 2017 SECTION 2 APPENDICES 2A, 2B & 2C Bachelor of Dental Surgery Admissions Policy for Undergraduate Courses Entry 2017
The development of national qualifications frameworks in Europe
 European Centre for the Development of Vocational Training WORKING PAPER No 8 The development of national qualifications frameworks in Europe Luxembourg: Publications Office of the European Union, 2010
IAB INTERNATIONAL AUTHORISATION BOARD Doc. IAB-WGA
 GROUP A EDUCATION, TRAINING AND QUALIFICATION MINUTES OF THE MEETING HELD ON 28 AUGUST 2006 IN QUÉBEC CANADA 1. Welcome and Apologies Christian AHRENS opened the meeting welcoming everyone. Apologies had
The ELSA Moot Court Competition on WTO Law
 The ELSA Moot Court Competition on WTO Law SWOT Analysis and Strategy 2012/2013 Table of Contents 1. A SWOT Analysis Basic information 2. The past decade of EMC2 a review 3. Present Situation the product
The Achievement Gap in California: Context, Status, and Approaches for Improvement
 The Achievement Gap in California: Context, Status, and Approaches for Improvement Eva L. Baker, EdD - University of California, Los Angeles, Center for Research on Evaluation, Standards, and Student Testing
EQE Candidate Support Project (CSP) Frequently Asked Questions - National Offices
 Frequently Asked Questions - National Offices") EQE Candidate Support Project (CSP) Frequently Asked Questions - National Offices What is the EQE Candidate Support Project (CSP)? What is the distribution of Professional Representatives within EPC member
EQE Candidate Support Project (CSP) Frequently Asked Questions - National Offices What is the EQE Candidate Support Project (CSP)? What is the distribution of Professional Representatives within EPC member
James H. Williams, Ed.D. CICE, Hiroshima University George Washington University August 2, 2012
 James H. Williams, Ed.D. jhw@gwu.edu CICE, Hiroshima University George Washington University August 2, 2012 Very poor country, but rapidly growing economy Access has improved, especially at primary Lower
HAAGA-HELIA University of Applied Sciences. Education, Research, Business Development
 HAAGA-HELIA University of Applied Sciences Education, Research, Business Development Finnish Education System 24 Universities of Applied Sciences 15 Universities Professional Master Degrees 1 1,5 5 4 3
Rethinking Library and Information Studies in Spain: Crossing the boundaries
 Rethinking Library and Information Studies in Spain: Crossing the boundaries V IRGINIA O RTIZ- R EPISO U NIVERSIDAD C ARLOS III DE M ADRID D EPARTAMENTO DE B IBLIOTECONOMIA Y D OCUMENTACIÓN Barcelona,
Tailoring i EW-MFA (Economy-Wide Material Flow Accounting/Analysis) information and indicators
 information and indicators") Tailoring i EW-MFA (Economy-Wide Material Flow Accounting/Analysis) information and indicators to developing Asia: increasing research capacity and stimulating policy demand for resource productivity Chika
Tailoring i EW-MFA (Economy-Wide Material Flow Accounting/Analysis) information and indicators to developing Asia: increasing research capacity and stimulating policy demand for resource productivity Chika
International Branches
 Indian Branches Chandigarh Punjab Haryana Odisha Kolkata Bihar International Branches Bhutan Nepal Philippines Russia South Korea Australia Kyrgyzstan Singapore US Ireland Kazakastan Georgia Czech Republic
The development of ECVET in Europe
 European Centre for the Development of Vocational Training WORKING PAPER No 14 The development of ECVET in Europe (2011) Luxembourg: Publications Office of the European Union, 2012 The development of
Financiación de las instituciones europeas de educación superior. Funding of European higher education institutions. Resumen
 Financiación de las instituciones europeas de educación superior Funding of European higher education institutions 1 Thomas Estermann Head of Unit Governance, Autonomy and Funding European University Association
OHRA Annual Report FY15
 Contents Director s Statement... 3 Our Organization... 4 Institutional Review Board Operations... 5 Quality Improvement Program... 6 Program Metrics... 7 Highlights... 14 2 P a g e Director s Statement
Information Session on Overseas Internships Career Center, SAO, HKUST 1 Dec 2016
 Information Session on Overseas Internships 2016-17 Career Center, SAO, HKUST 1 Dec 2016 Agenda Mailing lists subscription Overseas Internship Programs (summer and year-round) Sponsorship Schemes Things
The recognition, evaluation and accreditation of European Postgraduate Programmes.
 1 The recognition, evaluation and accreditation of European Postgraduate Programmes. Sue Lawrence and Nol Reverda Introduction The validation of awards and courses within higher education has traditionally,
Supplementary Report to the HEFCE Higher Education Workforce Framework
 Supplementary Report to the HEFCE Higher Education Workforce Framework based on the international Changing Academic Profession (CAP) Study William Locke and Alice Bennion Centre for Higher Education Research
JAMK UNIVERSITY OF APPLIED SCIENCES
 WELCOME ON EXCHANGE TO JAMK UNIVERSITY OF APPLIED SCIENCES SCHOOL OF TECHNOLOGY WWW.JAMK.FI 1 JYVÄSKYLÄ WHERE? Central Finland in the lake district of Finland 270 kilometres north of Helsinki (capital
OHRA Annual Report FY16
 Contents Director s Statement... 3 Our Organization... 4 Institutional Review Board Operations... 5 Quality Improvement Program... 6 Program Metrics... 7 Highlights... 133 What's Ahead......16 2 P a g
Educational system gaps in Romania. Roberta Mihaela Stanef *, Alina Magdalena Manole
 Available online at www.sciencedirect.com ScienceDirect Procedia - Social and Behavioral Scien ce s 93 ( 2013 ) 794 798 3rd World Conference on Learning, Teaching and Educational Leadership (WCLTA-2012)
Information needed to facilitate the clarity, transparency and understanding of mitigation contributions
 Climate Change Expert Group Paper No.2017(1) Information needed to facilitate the clarity, transparency and understanding of mitigation contributions Sara Moarif (IEA) May 2017 Unclassified COM/ENV/EPOC/IEA/SLT(2017)1
National Pre Analysis Report. Republic of MACEDONIA. Goce Delcev University Stip
 National Pre Analysis Report Republic of MACEDONIA Goce Delcev University Stip The European Commission support for the production of this publication does not constitute an endorsement of the contents
In reviewing progress since 2000, this regional
 United Nations Educational, Scientific and Cultural Organization EFA Global Monitoring Report 2 0 1 5 Regional overview: East Asia and the Pacific United Nations Educational, Scientific and Cultural Organization
intsvy: An R Package for Analysing International Large-Scale Assessment Data
 intsvy: An R Package for Analysing International Large-Scale Assessment Data Daniel H. Caro University of Oxford Przemyslaw Biecek University of Warsaw Abstract This paper introduces intsvy, an R package
DISCUSSION PAPER. In 2006 the population of Iceland was 308 thousand people and 62% live in the capital area.
 Increasing Employment of Older Workers through Lifelong Learning Discussion Paper Jón Torfi Jónasson Institute of Social Science Research, University of Iceland Introduction This Peer Review is concerned
Academic profession in Europe
 Current changes in Finnish academic profession Timo Aarrevaara Professor, HEGOM University of Helsinki Academic profession in Europe The academic profession is a critical part of the future of knowledge-based
Inspiring Science Education European Union Project
 Inspiring Science Education European Union Project Dr. Mihaela Garabet 1,2, Ana Maria Bâldea 1, Prof. Radu Jugureanu 1 (1) SIVECO ROMANIA (2) National College Grigore Moisil, Bucharest, Romania Victoria
APPENDIX 2: TOPLINE QUESTIONNAIRE
 183 PEW SOCIAL & DEMOGRAPHIC TRENDS APPENDIX 2: TOPLINE QUESTIONNAIRE PEW RESEARCH CENTER ASIAN-AMERICAN SURVEY FINAL TOPLINE JAN. 3-MARCH 27, Chinese Filipino Indian Japanese Korean Vietnamese N 3,511
ehealth Governance Initiative: Joint Action JA-EHGov & Thematic Network SEHGovIA DELIVERABLE Version: 2.4 Date:
 ehealth Governance Initiative: Joint Action JA-EHGov & Thematic Network SEHGovIA DELIVERABLE JA D4.1.1 Strategy & Policy Alignment Documents I WP4 (JA) - Policy Development and Strategy Alignment Version:
EDUCATION. Department of International Environment and Development Studies, Noragric
 EDUCATION Department of International Environment and Development Studies, Noragric Making friends for life 2 NORWEGIAN UNIVERSITY OF LIFE SCIENCES Bachelor Study Programmes International Environment and
TERTIARY EDUCATION BOOM IN EU COUNTRIES: KEY TO ENHANCING COMPETITIVENESS OR A WASTE OF RESOURCES?
 Studia Ekonomiczne. Zeszyty Naukowe Uniwersytetu Ekonomicznego w Katowicach ISSN 2083-8611 Nr 271 2016 Uniwersytet Warszawski Wydział Nauk Ekonomicznych Katedra Makroekonomii i Teorii Handlu Zagranicznego
LANGUAGE DIVERSITY AND ECONOMIC DEVELOPMENT. Paul De Grauwe. University of Leuven
 Preliminary draft LANGUAGE DIVERSITY AND ECONOMIC DEVELOPMENT Paul De Grauwe University of Leuven January 2006 I am grateful to Michel Beine, Hans Dewachter, Geert Dhaene, Marco Lyrio, Pablo Rovira Kaltwasser,
Conversions among Fractions, Decimals, and Percents
 Conversions among Fractions, Decimals, and Percents Objectives To reinforce the use of a data table; and to reinforce renaming fractions as percents using a calculator and renaming decimals as percents.
RECOGNITION OF THE PREVIOUS UNIVERSITY DEGREE
 RECOGNITION OF THE PREVIOUS UNIVERSITY DEGREE You must request for the recognition of your bachelor diploma at the Czech University which provides similar study modules. If you studied in economic field,
Collaborative Partnerships
 Collaborative Partnerships Building Effective Sponsored Student Programs By Craig E. Hastings A publication of NAFSA: Association of International Educators, 2012 This publication is available on the NAFSA
Using 'intsvy' to analyze international assessment data
 Oxford University Centre for Educational Assessment Using 'intsvy' to analyze international assessment data Professional Development and Training Course: Analyzing International Large-Scale Assessment
Building Bridges Globally
 Building Bridges Globally New Faculty Brown Bag April 2015 Global Affairs Organization Mission: The office of Global Affairs advances UC Davis internationalization strategy to enhance its global impact
MODERNISATION OF HIGHER EDUCATION PROGRAMMES IN THE FRAMEWORK OF BOLOGNA: ECTS AND THE TUNING APPROACH
 EUROPEAN CREDIT TRANSFER AND ACCUMULATION SYSTEM (ECTS): Priorities and challenges for Lithuanian Higher Education Vilnius 27 April 2011 MODERNISATION OF HIGHER EDUCATION PROGRAMMES IN THE FRAMEWORK OF
North American Studies (MA)
") North American Studies (MA) Master Discover the world at Leiden University Type Language City Master English Leiden Taking an integrated approach to the study of the United States, the MA North American
North American Studies (MA) Master Discover the world at Leiden University Type Language City Master English Leiden Taking an integrated approach to the study of the United States, the MA North American
Language. Name: Period: Date: Unit 3. Cultural Geography
 Name: Period: Date: Unit 3 Language Cultural Geography The following information corresponds to Chapters 8, 9 and 10 in your textbook. Fill in the blanks to complete the definition or sentence. Note: All
GREAT Britain: Film Brief
 GREAT Britain: Film Brief Prepared by Rachel Newton, British Council, 26th April 2012. Overview and aims As part of the UK government s GREAT campaign, Education UK has received funding to promote the
International Perspectives on Retention and Persistence
 Walden University ScholarWorks Office of Institutional Research and Assessment Publications Academic and Administrative Units 6-2014 International Perspectives on Retention and Persistence Gary J. Burkholder
TESL/TESOL Certification
 TESL/TESOL Certification Teaching English as a Second Language Certificate inlingua Victoria TESL/TESOL Courses are recognized by TESL Canada inlingua Victoria College of Languages 101-910 Government Street
Setting the Scene and Getting Inspired
 Setting the Scene and Getting Inspired Inclusive Education and Schools Sheldon Shaeffer Save the Children Learning Event Inclusive Education: From Theoretical Concept to Effective Practice Bangkok, Thailand
Philip Hallinger a & Arild Tjeldvoll b a Hong Kong Institute of Education. To link to this article:
 This article was downloaded by: [Hong Kong Institute of Education] On: 03 September 2012, At: 00:14 Publisher: Routledge Informa Ltd Registered in England and Wales Registered Number: 1072954 Registered
Young Leaders Program
 2018-2019 YLP-MEXT Scholarship Program Young Leaders Program School of Government School of Local Governance A World of Opportunities for Young Leaders Message from the Program Director The Young Leaders
MEASURING GENDER EQUALITY IN EDUCATION: LESSONS FROM 43 COUNTRIES
 GIRL Center Research Brief No. 2 October 2017 MEASURING GENDER EQUALITY IN EDUCATION: LESSONS FROM 43 COUNTRIES STEPHANIE PSAKI, KATHARINE MCCARTHY, AND BARBARA S. MENSCH The Girl Innovation, Research,
A comparative study on cost-sharing in higher education Using the case study approach to contribute to evidence-based policy
 A comparative study on cost-sharing in higher education Using the case study approach to contribute to evidence-based policy Tuition fees between sacred cow and cash cow Conference of Vlaams Verbond van