Institution Name: College Of Southern Maryland Date 8/30/2010. Year Accredited/Reaffirmed: 2006 This Report Covers Years:
|
|
|
- Georgina Pearson
- 6 years ago
- Views:
Transcription
1 Association of Collegiate Business Schools and Programs (ACBSP) Associate Degree Commission Accredited Institutions Quality Assurance (QA) Report (Rev H December 2009) Institution Name: College Of Southern Maryland Date 8/30/2010 Address: 8730 Mitchell Road, LaPlata MD Year Accredited/Reaffirmed: 2006 This Report Covers Years: List All Accredited Programs (as they appear in your catalog): Business Administration A.S. Management Development A. A. S. Accounting A.A.S. List all campuses that a student can earn a business degree from your institution: LaPlata, Leonardtown, Prince Frederick Person completing report Name: Rex Bishop Phone:
2 address: ACBSP Champion name: ACBSP Co-Champion name: Rex Bishop Mike Green A. Faculty Qualifications 1. Complete the following tables for new full-time and part-time faculty members only since last Report (Table VI): TABLE VI New Full-time and Part-time Faculty Qualifications (Use enclosed table at the end of this document) ******Please see attached Table VI - Part Time Faculty Table VI - Part Time Faculty Name Teaching Fields Courses Taught Earned Degrees Other Professional ACBSP Qualifications Certifications Armstrong, Jeffrey ACC ACC 2010 B.S. Business Enrolled Agent (EA), B plus 2 Professional HR Dennis, Stacy BAD/ECN BAD 1330, ECN 1015 MBA M Faust, Frank ECN ECN 2010, ECN 2020 MBA M Howard, Dave BAD BAD 1330 B.S. CMIS, MS Management M Kabia, Richard ECN ECN 2010 M.A. Economics, B.A. Economics and Business M
3 Lohn, Victoria Hodge ACC ACC 2010 M.S. Forensic Accounting, B.S. Accounting CPA, Certified Fraud Examiner Mudd, Frank BAD BAD 2700 MBA M Padgett, Donovon ECN ACC 2681, ECN 1015, MBA M ECN 2020 Richardson, Mike BAD/ECN BAD 1330, ECN 2010 M.S. Org. Mgt. M M Table VI - Full Time Faculty Name Teaching Fields Courses Taught Earned Degrees Other Professional Certifications Williams, William BAD/ ECN ECN 1015, BAD 1210, M.S. Industrial Relations, B.S. Hospitality and BAD 1780 Institutional Management ACBSP Qualifications M B. Curriculum 1. List any existing accredited associate degree programs/curricula that have been substantially revised since your last report and attach a Table VII Curriculum Summary for each program. None 2. List any new degree programs that have been developed and attach a Table VII Curriculum Summary for each new program since your last report. ********Hospitality Management A.A.S. Please see attached
4 Table VII Hospitality Management Curriculum Summary Credits required: 63 Associate in Applied Science degree Professional Component: 18 credits 28.6% ACC 2010 Principles of Accounting I (3) a ACC 2020 Principles of Accounting II (3) a ACC 2340 Cost Accounting or ACC 2681 Business Finance (3) h BAD 2070 Business Law (3) e BAD 2700 Human Resource Management (3) i Mathematics (College Algebra or Higher) (3) c General Education: 18 credits 28.6 % ENG 1010 English Composition (3) a ENV 1300 Environmental Science (3) f ENG 2050 Business and Technical Writing (3) a COM 1250 Interpersonal Communication (3) a COM 1350 Intercultural Communication (3) a, b, c ECN 1015 Business in a Market Economy (3) b, d, e, h, j Major: 27 credits 42.9% HPM 1015 Introduction to Hospitality (3) HPM 1310 Managing Service in Hospitality (3) HPM 110 Front Office Operations (3) HPM 1210 Food and Beverage (3) HPM 2310 MIS for Hospitality (3) HPM 1120 Housekeeping and Facilities Operation (3) HPM 2110 Supervision in the Hospitality Industry (3) HPM 2210 Marketing in the Hospitality Industry (3) HPM 2910 Cooperative Education (3) 3. List any accredited programs that have been terminated since your last report. None C. Organization 1. List any organizational or administrative personnel changes within the business unit since your last report. 2. ********Criminal Justice has been transferred to the Social Science Division. This reorganization does not affect the three ACBSP accredited programs.
5 3. List all new sites where students can earn an accredited business degree (off-campus or on campus, on-line) that have been added since your last report? None D. Conditions/Notes/Opportunity for Improvement (OFI) to be Addressed (Either for accreditation or from feedback by commissioners for the Quality Assurance Report) None Please explain and provide the necessary documentation/evidence for addressing each condition/note/ofi since your last report. E. Program Outcomes List program outcomes for each accredited program. *****Please see attached E. Program Outcomes (part 1 of 3) ACCOUNTING (AAS) Intended Program Outcomes: First Outcome: Students shall be able to write effective business reports Second Outcome: Students shall be able to communicate effectively face to face and in groups. Third Outcome: Students shall be able to utilize computer software to accomplish routine accounting tasks. Fourth Outcome: Students shall be able to analyze financial statements to determine a company s strengths and weaknesses. Fifth Outcome: Students shall be able to record common business transactions manually and online.
6 E. Program Outcomes (part 2 of 3) BUSINESS ADMINISTRATION (AS) Intended Program Outcomes: First Outcome: Students shall be prepared to transfer into a business administration or business-related baccalaureate program at a 4-year College or University. Second Outcome: Students shall be able to communicate effectively orally. Third Outcome: Students shall be able to communicate effectively in writing. Fourth Outcome: Students shall be able to apply mathematics skills. Fifth Outcome: Students shall be able to apply critical thinking. Sixth Outcome: Students shall be able to use business software packages. Seventh Outcome: Students shall be able to demonstrate understanding of economic principles. E. Program Outcomes (part 3 of 3) MANAGEMENT DEVELOPMENT (AAS)
7 Intended Program Outcomes: First Outcome: Students shall be able to interrelate positively with a business work team. Second Outcome: Students shall be able to practice effective problem-solving skills. Third Outcome: Students shall be able to use business software packages. Fourth Outcome: Students shall be able to practice accurate mathematical procedures. Fifth Outcome: Students shall be able to practice sound interpersonal communication skills. Sixth Outcome: Students shall be able to effectively utilize accounting systems. Seventh Outcome: Students shall be able to demonstrate understanding of economic principles. Eighth Outcome: Students shall be able to practice effective written communication skills. F. Performance Results *****Please see attached
8 F. Performance Results Table I - Student Learning Results Accounting AAS Degree Performance Indicator Definition 1. Student Learning Results To help students succeed, community colleges must both assess skills and remediate deficiencies before students take more than 25 percent of the credits in business programs. Analysis of Results Performance Measure (Competency) Description of Measurement Instrument Areas of Success Analysis and Results of Trend for 3-5 Years (See Graphs) 1a. Average writing score equal to or greater than 80%. 1b. Average writing score higher than national average: (113.9 in 2004) (113.7 in 2005). 1c. Average GPA for composition equal to or greater than 2.5 Written portion of Capstone Accounting. Exercise, (Internal), (Summative). Writing score on Academic Profile Test from E.T.S. (External), (Comparative). Program graduates GPA for courses in composition. (External), (Summative). Average score exceeded target in 4 out of 5 years. Average score beat the national average in 4 out of 5 semesters. Graduate GPAs target in all years Large drop in Will adopt Language Dept. scoring rubric for writing in Intro to Business course. Fell short in Spring Began requiring writing exercises in all Accounting courses. Dropping since Will adopt scoring rubric for writing in Intro to Business course. No data yet = 90.7% 2007 = 95.6% 2008 = 93.9% 2009 = 97.1% 2010 = 79.5% (Graph 1a) Average score rose to beat the national average. Test no longer offered by E.T.S. No further data. Spring 04 =114.7 Fall 04 =115.2 Spring 05 =111.1 Fall 05 = Spring 06 = (Graph 1b) No data yet = = = = = 2.8 (Graph 1c) Table I Student Learning Results Accounting AAS Degree Graphs 1a, 1b, & 1c
9 1b - Average Academic Profile Writing Scores vs. National Norm Average Score Sp 04 Fa 04 Sp 05 Fa 05 Sp 06 Score Target Semester Table I - Student Learning Results Accounting AAS Degree Performance Indicator Definition 1. Student Learning Results To help students succeed, community colleges must both assess skills and remediate deficiencies before students take more than 25 percent of the credits in business programs. Analysis of Results Performance Measure Description of Measurement Areas of Success Analysis and Results of Trend for 3-5 Years
10 (Competency) Instrument (See Graphs) 1d. for writing equal to or greater than 3.5. Employer surveys of student performance (External), (Formative). target in all years. Dropped in Began requiring writing exercises in all Accounting courses. rose to 5.0 by 2006, and has remained there = = = = = 5.0 1e. for writing items equal to or greater than f. Average GPA for communication equal to or greater than 2.5 General Education Graduate Surveys asking students how well they were taught skills. (Internal) (Summative) Program graduates GPA for courses in communication. (External), (Summative). target in all years. Graduate GPAs target in all years Dropped in Began requiring writing exercises in all Accounting courses. Five year decline in graduate GPA in communication. Exploring how to add presentations to capstone. rose to 4.9 in Will continue to monitor. (Graph 1d) 2006 = = = = = 4.6 (Graph 1e) None yet = = = = = 3.2 (Graph 1f) Table I Student Learning Results Accounting AAS Degree Graphs 1d, 1e, & 1f
11 Table I - Student Learning Results Accounting AAS Degree Performance Indicator Definition 1. Student Learning Results To help students succeed, community colleges must both assess skills and remediate deficiencies before students take more than 25 percent of the credits in business programs. Analysis of Results Performance Measure Description of Measurement Areas of Success Analysis and Results of Trend for 3-5 Years
12 (Competency) Instrument (See Graphs) 1g. for communication equal to or greater than 3.5. Employer surveys of student performance (External), (Formative). target in all years. Fell in Added graded presentations in many business courses. Rating rose in 2008 and = = = = = 5.0 1h. for communication items equal to or greater than i. Average general ledger set-up score equal to or greater than 80%. General Education Graduate Surveys asking students how well they were taught skills. (Internal) (Summative) Computer-graded set-up exercise in ACC 2015 course. (External) (Formative) target in all years. target in all years. Dropped in Added graded presentations in many business courses. Fell in Upgraded the software in ACC 2015 to a more user-friendly version. Rose in 2007 through Will continue to monitor. Rose in 2009 and Table I Student Learning Results Accounting AAS Degree Graphs 1g, 1h, & 1i (Graph 1g) 2006 = = = = = 4.3 (Graph 1h) 2006 = 99.5% 2007 = 99.0% 2008 = 98.2% 2009 = 98.9% 2010 = 99.0% (Graph 1i)

13 Table I - Student Learning Results Accounting AAS Degree Performance Indicator Definition 1. Student Learning Results To help students succeed, community colleges must both assess skills and remediate deficiencies before students take more than 25 percent of the credits in business programs. Analysis of Results Performance Measure Description of Measurement Areas of Success Analysis and Results of Trend for 3-5 Years
14 (Competency) Instrument (See Graphs) 1j. for computer skills equal to or greater than 3.5. Employer surveys of student performance (External), (Formative). target in all years. Fell in Upgraded the software in ACC 2015 and BAD 1330 to more user-friendly Rose in 2009 and = = = = = 5.0 (Graph 1j) 1k. for computer items equal to or greater than l. Average financial ratio calculation score equal to or greater than 80%. General Education Graduate Surveys asking students how well they were taught skills. (Internal) (Summative) Ratio portion of Capstone Acctg. Exercise, (Internal), (Summative). target in all years. Average score exceeded target in all 5 years. versions. Rating rose steadily over the last five years. Dropped in Added math prerequisites to many business and accounting courses. No action needed = = = = = 4.3 (Graph 1k) Rose again in Will continue to monitor. Table I Student Learning Results Accounting AAS Degree Graphs 1j, 1k, & 1l 2006 = 92.3% 2007 = 96.4% 2008 = 91.9% 2009 = 88.6% 2010 = 90.8% (Graph 1l)
15 Table I - Student Learning Results Accounting AAS Degree Performance Indicator Definition 1. Student Learning Results To help students succeed, community colleges must both assess skills and remediate deficiencies before students take more than 25 percent of the credits in business programs. Analysis of Results Performance Measure Description of Measurement Areas of Success Analysis and Results of Trend for 3-5 Years
16 (Competency) Instrument (See Graphs) 1m. Average analysis score equal to or greater than 80%. Analysis portion of Capstone Acctg. Exercise, (Internal), (Summative). Average score exceeded target in 4 of 5 years. Fell to target level in Began requiring ratio analysis in ACC 2010/2020. Average score rose well above target in 2007 and beyond = 80.0% 2007 = 90.0% 2008 = 97.3% 2009 = 91.4% 2010 = 94.5% 1n. Average math score higher than national average: (112.7 in 2004) (112.6 in 2005). 1o. Average critical thinking score higher than national average: (110.3 in 2004/5) (110.0 in 2005/6). Math score on Academic Profile Test from E.T.S. (External), (Comparative). Critical Thinking score on Academic Profile Test from E.T.S. (External), (Comparative). Average score beat the national average in 3 out of 5 semesters. Average score beat the national average in the first and last semesters. Fell short in Fall Added math prerequisites to many department courses. Fell below target in Began requiring ratio analysis in ACC 2010/2020. Average score rose to beat the national average. Test no longer offered by E.T.S. No further data. Average score rose to beat the national average. Test no longer offered by E.T.S. No further data. Table I Student Learning Results Accounting AAS Degree Graphs 1m, 1n, & 1o (Graph 1m) Spring 04 =114.8 Fall 04 =112.5 Spring 05 =112.1 Fall 05 = Spring 06 = (Graph 1n) Spring 04 =111.0 Fall 04 =109.6 Spring 05 =105.4 Fall 05 = Spring 06 = (Graph 1o)
17 1n - Average Academic Profile Math Scores vs. National Norm Average Score Sp 04 Fa 04 Sp 05 Fa 05 Sp 06 Score Target Semester 1o - Average Academic Profile Critical Thinking Scores vs. National Norm Average Score Sp 04 Fa 04 Sp 05 Fa 05 Sp 06 Score Target Semester Table I - Student Learning Results Accounting AAS Degree Performance Indicator Definition 1. Student Learning Results To help students succeed, community colleges must both assess skills and remediate deficiencies before students take more than 25 percent of the credits in business programs. Analysis of Results Performance Measure Description of Measurement Areas of Success Analysis and Results of Trend for 3-5 Years
18 (Competency) Instrument (See Graphs) 1p. for math skills equal to or greater than 3.5. Employer surveys of student performance (External), (Formative). target in all years. Dropped in Added math prerequisites to many department courses. Rose to 5.0 in subsequent years = = = = = 5.0 1q. for math items equal to or greater than r. for reasoning items equal to or greater than 3.5. General Education Graduate Surveys asking students how well they were taught skills. (Internal) (Summative) General Education Graduate Surveys asking students how well they were taught skills. (Internal) (Summative) target in all years. target in all years. Slight drop in 2008 and Added math prerequisites to many department courses. Fell in Began requiring ratio analysis in ACC 2010/2020. recovered in 2009 and rose to 4.7 in 2008, and has remained well above target. Table I Student Learning Results Accounting AAS Degree Graphs 1p, 1q, & 1r (Graph 1p) 2006 = = = = = 4.8 (Graph 1q) 2006 = = = = = 4.6 (Graph 1r)
19 Table I - Student Learning Results Accounting AAS Degree Performance Indicator Definition 1. Student Learning Results To help students succeed, community colleges must both assess skills and remediate deficiencies before students take more than 25 percent of the credits in business programs. Analysis of Results
20 Performance Measure (Competency) 1s. for accounting equal to or greater than t. Average score for General Ledger Set-up equal to or greater than 80%. Description of Measurement Instrument Employer surveys of student performance (External), (Formative). Computer graded exercise in the Automated Accounting course. (External), (Formative). Areas of Success Rating exceeded target in all years. Scores far exceeded target score in all years. Analysis and Fell in Added math prerequisites to ACC courses. Began requiring ratio analysis in ACC 2010 / Dropped for three straight years. Upgraded software in ACC 2015 to a more user-friendly version. Results of Rating recovered in 2008 and subsequent years. Scores rose again for two years. Trend for 3-5 Years (See Graphs) 2006 = = = = = 5.0 (Graph 1s) 2006 = 99.5% 2007 = 99.0% 2008 = 98.2% 2009 = 98.9% 2010 = 99.0% (Graph 1t) Table I Student Learning Results Accounting AAS Degree Graphs 1s & 1t
21 Table I - Student Learning Results Business Administration AS Degree Performance Indicator Definition 1. Student Learning Results To help students succeed, community colleges must both assess skills and remediate deficiencies before students take more than 25 percent of the credits in business programs. Analysis of Results Performance Measure (Competency) Description of Measurement Instrument Areas of Success Analysis and Results of Trend for 3-5 Years (See Graphs)
22 1u. 70% or more of graduates will report they were well prepared for transfer 1v. 50% or more of graduates will report they have transferred to a four-year college. 1w. Average GPA for communication equal to or greater than 2.5 Maryland Higher Education Grad Follow-up Survey. (External) (Summative) Maryland Higher Education Grad Follow-up Survey. (External) (Summative) Program graduates GPA for courses in communication. (External), (Summative). Target percentage met in all three surveys. Target percentage met in all three surveys. Graduate GPAs target in all years Fell in Students are now required to see an advisor before reaching 18 and 36 credits earned. Dropped in Students are now required to see an advisor before reaching 18 and 36 credits earned. Dropped for three straight years. Added presentations to many business courses. n/a New survey does not break out results by programs. n/a New survey does not break out results by programs. Recovered in Will continue to monitor = 90.0% 2002 = 100.0% 2005 = 70.0% (Graph 1u) No further data = 76.9% 2002 = 62.5% 2005 = 57.9% (Graph 1v) No further data = = = = = 3.4 (Graph 1w) Table I Student Learning Results Business Administration AS Degree Graphs 1u, 1v, & 1w
23 1u - Grads Reporting Good Transfer Preparation on Follow-up Survey 1v - Grads Who Have Transferred to a Four-year College Percentage Percent Target Percentage Percent Target Year Year Table I - Student Learning Results Business Administration AS Degree Performance Indicator Definition 1. Student Learning Results To help students succeed, community colleges must both assess skills and remediate deficiencies before students take more than 25 percent of the credits in business programs. Analysis of Results Performance Description of Areas of Analysis and Results of Trend for 3-5
24 Measure (Competency) 1x. for communication equal to or greater than y. for communication items equal to or greater than z. Average GPA for composition equal to or greater than 2.5 Measurement Instrument Employer surveys of student performance (External), (Formative). General Education Graduate Surveys asking students how well they were taught skills. (Internal) (Summative) Program graduates GPA for courses in composition. (External), (Summative). Success Years (See Graphs) Dropped in Ratings 2005 = 4.9 Added student rebounded in 2006 = 5.0 target in all years. presentations to 2008 and = 3.8 many business 2008 = 5.0 courses = 5.0 target in all years. Graduate GPAs target in all years Fell in Added student presentations to many business courses. Dropped below 3.0. Will adopt Language Dept. scoring rubric for writing in Intro to Business course. rose above 4.0 in 2008 and beyond. (Graph 1x) 2006 = = = = = 4.1 (Graph 1y) No data yet = = = = = 2.8 (Graph 1z) Table I Student Learning Results Business Administration AS Degree Graphs 1x, 1y, & 1z

25 Table I - Student Learning Results Business Administration AS Degree Performance Indicator Definition 1. Student Learning Results To help students succeed, community colleges must both assess skills and remediate deficiencies before students take more than 25 percent of the credits in business programs. Analysis of Results Performance Measure Description of Measurement Areas of Success Analysis and Results of Trend for 3-5 Years
26 (Competency) Instrument (See Graphs) 1aa. for writing equal to or greater than 3.5. Employer surveys of student performance (External), (Formative). target in all years. Fell in Added English prerequisites to many department courses. Rating rose in three subsequent years = = = = = 5.0 1ab. for writing items equal to or greater than ac. Average writing score higher than national average: (113.9 in 2004) (113.7 in 2005). General Education Graduate Surveys asking students how well they were taught skills. (Internal) (Summative) Writing score on Academic Profile Test from E.T.S. (External), (Comparative). target in all years. Matched national norms in 2004, and exceeded them by Fell for three years. Will adopt Language Dept. scoring rubric for writing in Intro to Business course. Fell below the national norm in Added English prerequisites to many department courses. (Graph 1aa) No data yet = = = = = 4.3 (Graph 1ab) Average score rose on later tests until it beat the national norm. Test no longer offered by E.T.S. No further data. Spring 04 =113.9 Fall 04 =111.4 Spring 05 =112.0 Fall 05 = Spring 06 = (Graph 1ac) Table I Student Learning Results Business Administration AS Degree Graphs 1aa, 1ab, & 1ac
27 1ac - Average Academic Profile Writing Scores vs. National Norm Average Score Sp 04 Fa 04 Sp 05 Fa 05 Sp 06 Score Target Year Table I - Student Learning Results Business Administration AS Degree Performance Indicator Definition 1. Student Learning Results To help students succeed, community colleges must both assess skills and remediate deficiencies before students take more than 25 percent of the credits in business programs. Performance Measure Description of Measurement Analysis of Results Areas of Success Analysis and Results of Trend for 3-5 Years
28 (Competency) Instrument (See Graphs) 1ad. for math equal to or greater than 3.5. Employer surveys of student performance (External), (Formative). target in all years. Fell in Added Math prerequisites to many department courses. Rose above 4.0 in following years = = = = = 5.0 1ae. for math items equal to or greater than af. Average math score higher than national average: (112.7 in 2004) (112.6 in 2005). General Education Graduate Surveys asking students how well they were taught skills. (Internal) (Summative) Math score on Academic Profile Test from E.T.S. (External), (Comparative). target in all years. Average score was above the national norm in three of five semesters Dropped in Added Math prerequisites to many department courses. Fell below the norm in Added Math prerequisites to many department courses. Rose above 4.0 in three subsequent years. Scores rose above the norm in Test no longer offered by E.T.S. No further data. (Graph 1ad) 2006 = = = = = 4.3 (Graph 1ae) Spring 04 =115.9 Fall 04 =111.6 Spring 05 =116.5 Fall 05 = Spring 06 = (Graph 1af) Table I Student Learning Results Business Administration AS Degree Graphs 1ad, 1ae, & 1af
29 1af - Average Academic Profile Math Scores vs. National Norm Average Score Sp 04 Fa 04 Sp 05 Fa 05 Sp 06 Score Target Semester Table I - Student Learning Results Business Administration AS Degree Performance Indicator Definition 1. Student Learning Results To help students succeed, community colleges must both assess skills and remediate deficiencies before students take more than 25 percent of the credits in business programs. Analysis of Results Performance Measure Description of Measurement Areas of Success Analysis and Results of Trend for 3-5 Years
30 (Competency) Instrument (See Graphs) 1ag. for critical thinking items equal to or greater than 3.5. General Education Graduate Surveys asking students how well they were taught skills. (Internal) target in all years. Dropped in Added financial analysis and industry analysis exercises to many department Scores rose for two years. Will continue to monitor = = = = = 4.2 (Graph 1ag) 1ah. Avg critical thinking score higher than national average: (110.3 in 2004/5) (110.0 in 2005/6). 1ai. for computer items equal to or greater than 3.5. (Summative) Critical Thinking score on Academic Profile Test from E.T.S. (External), (Comparative). General Education Graduate Surveys asking students how well they were taught skills. (Internal) (Summative) Average score was above the national norm in three of five semesters target in all years. courses. Fell below the norm in College-wide info literacy committee formed to improve instruction. Ratings dropped for two years. Upgraded the software in ACC 2015 and BAD 1330 to be more user friendly. Scores rose above the norm in Test no longer offered by E.T.S. No further data. Ratings came back up in 2009, but fell again. Will continue to monitor. Spring 04 =110.6 Fall 04 =107.3 Spring 05 =114.0 Fall 05 = Spring 06 = (Graph 1ah) 2006 = = = = = 3.7 (Graph 1ai) Table I Student Learning Results Business Administration AS Degree Graphs 1ag, 1ah, & 1ai

31 1ah - Average Academic Profile Critical Thinking Scores vs. National Norm Average Score Sp 04 Fa 04 Sp 05 Fa 05 Sp 06 Score Target Semester Table I - Student Learning Results Business Administration AS Degree Performance Indicator Definition 1. Student Learning Results To help students succeed, community colleges must both assess skills and remediate deficiencies before students take more than 25 percent of the credits in business programs. Analysis of Results Performance Measure Description of Measurement Areas of Success Analysis and Results of Trend for 3-5 Years
32 (Competency) Instrument (See Graphs) 1aj. for computer skills equal to or greater than 3.5. Employer surveys of student performance (External), (Formative). target in all years. Fell in Upgraded the software in ACC 2015 and BAD 1330 to more user-friendly Ratings rose to 5.0 and remained there for three years = = = = = 5.0 (Graph 1aj) 1ak. for economics items equal to or greater than 3.5. General Education Graduate Surveys asking students how well they were taught skills. (Internal) (Summative) target in all years. versions. Dropped in Added tougher prerequisites of math and reading to ECN courses. rose steadily after changes = = = = = 4.8 (Graph 1ak) Table I Student Learning Results Business Administration AS Degree Graphs 1aj & 1ak
33 Table I - Student Learning Results Management Development AAS Degree Performance Indicator Definition 1. Student Learning Results To help students succeed, community colleges must both assess skills and remediate deficiencies before students take more than 25 percent of the credits in business programs. Analysis of Results Performance Measure Description of Measurement Areas of Success Analysis and Results of Trend for 3-5 Years
34 (Competency) Instrument (See Graphs) 1al. for interpersonal items equal to or greater than 3.5. General Education Graduate Surveys asking students how well they were taught skills. target in all years. Dropped in Added group projects to some courses. Ratings rose in 2007, but tapered off afterwards. Will continue to monitor = = = = = 4.3 1am. for interpersonal skills equal to or greater than an. for Math items equal to or greater than 3.5. (Internal)(Summa.) Employer surveys of student performance (External), (Formative). General Education Graduate Surveys asking students how well they were taught skills. (Internal)(Summa.) target in all years. target in all years. Fell in Added group projects to some courses. Dropped in Added math prerequisites to many courses in the department. Recovered in 2006 and all following years. Average math ratings rose in 2008, but fell again. Will continue to monitor. (Graph 1al) 2005 = = = = = 5.0 (Graph 1am) 2006 = = = = = 3.8 (Graph 1an) Table I Student Learning Results Mgmnt. Development AAS Degree Graphs 1al, 1am, & 1an
35 Table I - Student Learning Results Management Development AAS Degree Performance Indicator Definition 1. Student Learning Results To help students succeed, community colleges must both assess skills and remediate deficiencies before students take more than 25 percent of the credits in business programs. Analysis of Results Performance Description of Areas of Analysis and Results of Trend for 3-5
36 Measure (Competency) 1ao. for Reasoning items equal to or greater than 3.5. Measurement Instrument General Education Graduate Surveys asking students how well they were taught skills. (Internal)(Summa.) Success Years (See Graphs) Dropped in Ratings rose in 2006 = 4.3 Added financial 2008, but fell 2007 = 4.3 target in all years. analysis and again. Will 2008 = 4.5 industry analysis continue to 2009 = 4.3 exercises to many monitor = 4.2 courses. (Graph 1ao) 1ap. Average general ledger set-up score equal to or greater than 80%. Computer-graded set-up exercise in ACC 2015 course. (External) (Formative) Average score target in all years. Fell in 2007 and Upgraded software in ACC 2015 to a more user-friendly version. Rose again in 2009 and = 99.5% 2007 = 99.0% 2008 = 98.2% 2009 = 98.9% 2010 = 99.0% (Graph 1ap) 1aq. for Computer items equal to or greater than 3.5. General Education Graduate Surveys asking students how well they were taught skills. (Internal)(Summa.) target in all years. Dropped in Upgraded the software in ACC 2015 and BAD 1330 to be more user friendly. Rating rose in 2008, but fell again in last two years. Will continue to monitor = = = = = 4.0 (Graph 1aq) Table I Student Learning Results Mgmnt. Development AAS Degree Graphs 1ao, 1ap, & 1aq
37 Table I - Student Learning Results Management Development AAS Degree Performance Indicator Definition 1. Student Learning Results To help students succeed, community colleges must both assess skills and remediate deficiencies before students take more than 25 percent of the credits in business programs. Analysis of Results Performance Description of Areas of Analysis and Results of Trend for 3-5
38 Measure (Competency) 1ar. for computer skills equal to or greater than as. for math items equal to or greater than at. for math skills equal to or greater than 3.5. Measurement Instrument Employer surveys of student performance (External), (Formative). General Education Graduate Surveys asking students how well they were taught skills. (Internal) (Summative) Employer surveys of student performance (External), (Formative). Success Years (See Graphs) Fell in 2006 Ratings rose in 2006 = 4.1 Upgraded the 2007 and all 2007 = 4.4 software in ACC following years = and BAD 2009 = to be more 2010 = 5.0 user-friendly. (Graph 1ar) target in all years. target in all years. target in all years. Dropped in Added math prerequisites to many department courses. Fell below 4.0 in 2004 and Added math prerequisites to many department courses. Rose in 2008, but fell again in 2009 and Will continue to monitor. Recovered in 2006 and beyond = = = = = 3.8 (Graph 1as) 2004 = = = = = 5.0 (Graph 1at) Table I Student Learning Results Mgmnt. Development AAS Degree Graphs 1ar, 1as, & 1at
39 Table I - Student Learning Results Management Development AAS Degree Performance Indicator Definition 1. Student Learning Results To help students succeed, community colleges must both assess skills and remediate deficiencies before students take more than 25 percent of the credits in business programs. Performance Measure Description of Measurement Analysis of Results Areas of Success Analysis and Results of Trend for 3-5 Years
40 (Competency) Instrument (See Graphs) 1au. for communication equal to or greater than 3.5. Employer surveys of student performance (External), (Formative). target in all years. Dropped in Added student presentations to many business courses. Ratings rose to maximum score in 2009 and = = = = = 5.0 1av. for interpersonal items equal to or greater than aw. Average GPA for communication courses equal to or greater than 2.5 General Education Graduate Surveys asking students how well they were taught skills. (Internal) (Summative) Program graduates GPA for communications courses. (External), (Summative). target in all years. Graduate GPAs target in all years Fell in Added student presentations to many business courses. Declined since Added student presentations to many business courses. Rose in 2007, but slid again in 2008 and Leveled off in Will continue to monitor. Finally rose again in Will continue to monitor. (Graph 1au) 2006 = = = = = 4.3 (Graph 1av) 2004 = = = = = 3.2 (Graph 1aw) Table I Student Learning Results Mgmnt. Development AAS Degree Graphs 1au, 1av, & 1aw
41 Table I - Student Learning Results Management Development AAS Degree Performance Indicator Definition 1. Student Learning Results To help students succeed, community colleges must both assess skills and remediate deficiencies before students take more than 25 percent of the credits in business programs. Analysis of Results Performance Measure Description of Measurement Areas of Success Analysis and Results of Trend for 3-5 Years
42 (Competency) Instrument (See Graphs) 1ax. for accounting skills equal to or greater than 3.5. Employer surveys of student performance (External), (Formative). target in all years. Fell in Added math prerequisites to Accounting courses. Ratings recovered in = = = = = 5.0 1ay. for economics items equal to or greater than az. Average general ledger set-up score equal to or greater than 80%. General Education Graduate Surveys asking students how well they were taught skills. (Internal) (Summative) Computer-graded set-up exercise in ACC 2015 course. (External) (Formative) target in all years. target in all years. Dropped in Added math and English prerequisites to economics courses. Fell in Upgraded the software in ACC 2015 to a more user-friendly version. Recovered in 2008, but slid again in 2009 and Will continue to monitor. Rose for two straight years.. (Graph 1ax) 2006 = = = = = 4.3 (Graph 1ay) 2006 = 99.5% 2007 = 99.0% 2008 = 98.2% 2009 = 98.9% 2010 = 99.0% (Graph 1az) Table I Student Learning Results Mgmnt. Development AAS Degree Graphs 1ax, 1ay, & 1az
43 Table I - Student Learning Results Management Development AAS Degree Performance Indicator Definition 1. Student Learning Results To help students succeed, community colleges must both assess skills and remediate deficiencies before students take more than 25 percent of the credits in business programs. Analysis of Results Performance Measure Description of Measurement Areas of Success Analysis and Results of Trend for 3-5 Years
44 (Competency) Instrument (See Graphs) 1ba. for writing equal to or greater than 3.5. Employer surveys of student performance (External), (Formative). target in all years. Dropped in Added English prerequisites to economics courses. Achieved maximum ratings in 2008 and subsequent years = = = = = 5.0 1bb. for writing items equal to or greater than bc. Average GPA for composition courses equal to or greater than 2.5 General Education Graduate Surveys asking students how well they were taught skills. (Internal) (Summative) Program graduates GPA for courses in composition. (External), (Summative). target in all years. Graduate GPAs target in all years Dropped in Added English prerequisites to economics courses. Fell in 2005 and again in Added English prerequisites to economics courses. Ratings rose in 2008, but fell again in 2009 and Will continue to monitor. Rose in 2008, but will need to monitor because averages rise and fall. (Graph 1ba) 2006 = = = = = 4.3 (Graph 1bb) 2004 = = = = = 3.0 (Graph 1bc) Table I Student Learning Results Mgmnt. Development AAS Degree Graphs 1ba, 1bb, & 1bc
45 Table II - Student and Stakeholder-Focused Results Performance Indicator 2. Student- and Stakeholder-Focused Results Definition Each academic unit must demonstrate linkages to business practitioners and organizations, which are current and significant, including an advisory board. Analysis of Results Performance Description of Areas of Analysis and Action Results of Trend for 3-5
46 Measure (Competency) 2a. 70% of Graduates will express satisfaction with their preparation for employment. 2b. 50% of Graduates will report that they are employed fulltime. Measurement Instrument Maryland Higher Education Commission Graduate Followup Surveys. (External) (Summative) Maryland Higher Education Commission Graduate Followup Surveys. (External) (Summative) Success Taken Years (See Graphs) Fell in n/a 2000 = 75.0% Added tougher New survey 2002 = 89.6% prerequisites to many does not break 2005 = 73.1% courses. Upgraded out results by (Graph 2a) computer software. programs. No further data. Added critical thinking exercises. Added student presentations. Now require advising before reaching 18 and 36 credits earned. Percentage target in all surveys. Percentage target in all surveys. Dropped in A college advisor was assigned to work directly with the dept. Now require advising before reaching 18 and 36 credits earned. n/a New survey does not break out results by programs = 77.8% 2002 = 61.1% 2005 = 67.6% (Graph 2b) No further data. Table II - Student and Stakeholder-Focused Results Graphs 2a and 2b
47 2a - Graduates Satisfied with Preparation for Employment 2b - Graduates Reporting Full-time Employment Percentage Satisfied Percent Target Percentage Employed Percent Target Year Year Table II - Student and Stakeholder-Focused Results Performance Indicator 2. Student- and Stakeholder-Focused Results Definition Each academic unit must demonstrate linkages to business practitioners and organizations, which are current and significant, including an advisory board. Analysis of Results Performance Description of Areas of Analysis and Action Results of Trend for 3-5
48 Measure (Competency) 2c. 70% of Graduates from the Business Administration transfer program will express satisfaction with their preparation for transfer. 2d. 50% of Graduates from the Business Administration transfer program will report that they have transferred to a four-year college. Measurement Instrument Maryland Higher Education Commission Graduate Followup Surveys. (External) (Summative) Maryland Higher Education Commission Graduate Followup Surveys. (External) (Summative) Success Taken Years (See Graphs) Percentage Dropped in n/a 2000 = 90.0% met or A college advisor was New survey 2002 = 100.0% assigned to work does not break 2005 = 70.0% target in all directly with the dept. out results by (Graph 2c) surveys. Now require advising programs. No further data. before reaching 18 and 36 credits earned. Percentage target in all surveys. Fell in 2002 and A college advisor was assigned to work directly with the dept. Now require advising before reaching 18 and 36 credits earned. n/a New survey does not break out results by programs = 76.9% 2002 = 62.5% 2005 = 57.8% (Graph 2d) No further data. Table II - Student and Stakeholder-Focused Results Graphs 2c and 2d
49 2c - Graduates Satisfied with Preparation for Transfer 2d - Graduates Reporting Transfer to a Four-Year College Percentage Satisfied Percent Target Percentage Transferred Percent Target Year Year Table II - Student and Stakeholder-Focused Results Performance Indicator 2. Student- and Stakeholder-Focused Results Definition Each academic unit must demonstrate linkages to business practitioners and organizations, which are current and significant, including an advisory board. Analysis of Results Performance Description of Areas of Analysis and Action Results of Trend for 3-5
50 Measure (Competency) 2e. for writing items equal to or greater than f. for Math items equal to or greater than 3.5. Measurement Instrument General Education Graduate Surveys asking students how well they were taught skills. (Internal) (Summative) General Education Graduate Surveys asking students how well they were taught skills. (Internal) (Summative) Success Taken Years (See Graphs) target in all years. target in all years. Dropped in Added English prerequisites to many department courses. Required writing exercises in all Accounting courses. Dropped in Added Math prerequisites to many department courses. Rose in 2008 and 2009, but fell again in Will continue to monitor. Rose for three straight years, but dropped again in Will need to keep monitoring = = = = = 4.4 (Graph 2e) 2006 = = = = = 4.4 (Graph 2f) Table II - Student and Stakeholder-Focused Results Graphs 2e and 2f
51 Table II - Student and Stakeholder-Focused Results Performance Indicator 2. Student- and Stakeholder-Focused Results Definition Each academic unit must demonstrate linkages to business practitioners and organizations, which are current and significant, including an advisory board. Analysis of Results
52 Performance Measure (Competency) 2g. for computer items equal to or greater than h. for writing equal to or greater than 3.5. Description of Measurement Instrument General Education Graduate Surveys asking students how well they were taught skills. (Internal) (Summative) Employer surveys of student performance (External), (Formative). Areas of Success target in all years. target in all years. Analysis and Action Taken Fell in 2007 and Upgraded software in ACC 2015 and BAD 1330 to more userfriendly versions. Dropped in Added English prerequisites to many department courses. Required writing exercises in all Accounting courses. Results of Leveled off in 2009 and Will continue to monitor. Rose in 2008 and remained at maximum for three years straight.. Trend for 3-5 Years (See Graphs) 2006 = = = = = 4.0 (Graph 2g) 2006 = = = = = 5.0 (Graph 2h) Table II - Student and Stakeholder-Focused Results Graphs 2g and 2h
53 Table II - Student and Stakeholder-Focused Results Performance Indicator 2. Student- and Stakeholder-Focused Results Definition Each academic unit must demonstrate linkages to business practitioners and organizations, which are current and significant, including an advisory board. Analysis of Results
54 Performance Measure (Competency) 2i. for Math equal to or greater than j. for computers equal to or greater than 3.5. Description of Measurement Instrument Employer surveys of student performance (External), (Formative). Employer surveys of student performance (External), (Formative). Areas of Success target in all years. target in all years. Analysis and Action Taken Fell in Added Math prerequisites to many department courses. Dropped in Upgraded software in ACC 2015 and BAD 1330 to more userfriendly versions. Results of Rose in 2008 and all following years to the maximum rating. Rose in 2008 and all following years to the maximum rating. Trend for 3-5 Years (See Graphs) 2006 = = = = = 5.0 (Graph 2i) 2006 = = = = = 5.0 (Graph 2j) Table II - Student and Stakeholder-Focused Results Graphs 2i and 2j
55 Table III Budgetary, Financial, and Market Results Performance Indicator 3. Budgetary, Financial, and Market Performance Results Definition Adequate financial resources are vital to ensuring an outstanding faculty and teaching environment. The resources budgeted for and allocated to business units should be adequate to fund the necessary technology and training to allow students to develop the requisite competencies for business environments. Analysis of Results
56 Performance Measure (Competency) 3a. The Business Department budget should increase with growing enrollment. 3b. The percent of change in the budget should mirror the percent of change in enrollment Description of Measurement Instrument Track the budget over time for increases. (Internal) (Summative) Compare % changes in the budget to % changes in enrollment over time. (Internal) (Comparative) Areas of Success The budget rose for three straight years until Budget rose with enrollment until the department reorganized. Analysis and Action Taken The budget decreased in 2008 because a faculty member left and was not replaced. In 2009 the department was decreased when Criminal Justice moved to a new division. One full-time faculty member resigned in 2008 and was not replaced. Criminal Justice left the department in Adding Hospitality and Tourism program. Results of Budget should grow again as we add a new program for Hospitality and Tourism. Too early to see the impact of the new program. Will continue to monitor. Trend for 3-5 Years (See Graphs) 2005 = 1,489, = 1,618, = 1,752, = 1,727, = 1,515,024 (Graph 3a.) 2006 = 8.7% 2007 = 8.3% 2008 = -1.4% 2009 =-12.3% (Graph 3b.) Table III Budgetary, Financial, and Market Performance Results Graphs 3a and 3b
 Description of Measurement Instrument Definition Adequate financial")

57 Table III Budgetary, Financial, and Market Results Performance Indicator 3. Budgetary, Financial, and Market Performance Results Performance Measure (Competency) Description of Measurement Instrument Definition Adequate financial resources are vital to ensuring an outstanding faculty and teaching environment. The resources budgeted for and allocated to business units should be adequate to fund the necessary technology and training to allow students to develop the requisite competencies for business environments. Analysis of Results Analysis and Action Results of Taken Areas of Success Trend for 3-5 Years (See Graphs)
58 3c. Dollars per student should remain stable, or increase over time. 3d. The Business Dept. budget should remain stable, or increase, as a percent of the college's academic budget over time. Department budget divided by student enrollment. (Internal) (Summative) Department budget divided by collegewide academic budget. (Internal) (Summative) Dollars per student rose until the department reorganized in 2008 / Percentage remained stable until the department reorganized in 2008 / One full-time faculty member resigned and was not replaced, and Criminal Justice was sent to another division. A new program, Hospitality and Tourism has been added. One full-time faculty member resigned and was not replaced, and Criminal Justice was sent to another division. A new program, Hospitality and Tourism has been added. Too early to see the impact of adding back a program to replace the Criminal Justice program which left. Too early to see the impact of adding back a program to replace the Criminal Justice program which left = 1, = 1, = 1, = 1, = 1,237 (Graph 3c.) 2006 = 7.5% 2007 = 7.5% 2008 = 7.0% 2009 = 5.8% (Graph 3d.) Table III Budgetary, Financial, and Market Performance Results Graphs 3c and 3d
 Description of Measurement Instrument Definition Adequate financial")

59 Table III Budgetary, Financial, and Market Results Performance Indicator 3. Budgetary, Financial, and Market Performance Results Performance Measure (Competency) Description of Measurement Instrument Definition Adequate financial resources are vital to ensuring an outstanding faculty and teaching environment. The resources budgeted for and allocated to business units should be adequate to fund the necessary technology and training to allow students to develop the requisite competencies for business environments. Analysis of Results Analysis and Action Results of Taken Areas of Success Trend for 3-5 Years (See Graphs)
60 3e. Department enrollments should increase annually. Track enrollment over time. Enrollment increased in four of five years. Enrollment leveled off in Drops occurred in the Accounting and Management areas. Increased access for students in remote campuses by offering more courses online. Had advisors push Accounting in Leonardtown. New marketing brochures created. Too soon to see the impact of efforts to increase the program enrollments = = = = = 1225 (Graph 3e.) Table III Budgetary, Financial, and Market Performance Results Graph 3e

61 Table IV Faculty- and Staff-Focused Results 4. Faculty and Staff Focused Results Faculty and staff-focused results examine how well the organization creates and maintains a positive, productive, learning-centered work environment for business faculty and staff. Performance Measure (Competency) 4a. Overall rating by faculty for institutional climate will be equal to or greater than the national norm. 4b. As a measure of productivity, faculty will exceed requirements for their rank for Description of Measurement Instrument Personal Assessment of the College Environment Survey (PACE) (External) (Summative) Average total points for professional development and professional service on faculty Areas of Success Faculty satisfaction national norm in the first four surveys, but fell below the norm of 3.6 in 2009 Faculty productivity exceeded rank requirements (9 points) in all three years. Analysis of Results Analysis and Action Taken Ratings by the faculty fell for three straight surveys. A new VP of academic affairs has been appointed, and several new division heads. While exceeding the 9-point requirement, 2008 was still the lowest year. More opportunities became available for faculty Results of Too early to gauge the impact of new leadership. Productivity rose in Trend for 3-5 Years (See Graphs) 2001 = = = = = 3.5 (Graph 4a) 2005 = = = = = 21 (Graph 4b)
 (Formative) development as the college reorganized in 2008.")
62 professional development and professional service development plans vs. requirement for professor rank. (Internal) (Formative) development as the college reorganized in Table IV - Faculty- and Staff-Focused Results Graphs 4a and 4b Table IV Faculty- and Staff-Focused Results
63 4. Faculty and Staff Focused Results Faculty and staff-focused results examine how well the organization creates and maintains a positive, productive, learning-centered work environment for business faculty and staff. Performance Measure (Competency) 4c. Faculty turnover should remain below 10% annually. Description of Measurement Instrument Full-time Faculty turnover as percentage of Fulltime faculty. (Internal) (Formative) Areas of Success No faculty turnover in four of five years Analysis of Results Analysis and Action Taken One full-time faculty member resigned in Department was reorganized without the need to replace the vacant position. Results of Department was reorganized with cost savings. Trend for 3-5 Years (See Graphs) 2006 = 0% 2007 = 8% 2008 = 0% 2009 = 0% 2010 = 0% (Graph 4c) Table IV - Faculty- and Staff-Focused Results Graph 4c


64 Table V Organizational Performance Results 5. Organizational Effectiveness Results Organizational effectiveness results examine attainment of organizational goals. Each business unit must have a systematic reporting mechanism for each business program that charts enrollment patterns, student retention, student academic success, and other characteristics reflecting students' performance. Analysis of Results Performance Description of Areas of Analysis and Action Results of Trend for 3-5
65 Measure (Competency) 5a. Enrollment in Business courses should increase each year. Measurement Instrument Track enrollment by program and department total each fall. (Internal) (Summative) Success Taken Years (See Graphs) Enrollment Enrollment leveled off Too early to see 2005 = 1072 increased in in the impact of 2006 = 1151 four of five Drops occurred in the efforts to 2007 = 1190 years. Accounting and increase the 2008 = 1229 Management areas. program 2009 = 1225 Increased access for enrollments. (Graph 5a) students in remote campuses by offering more courses online. Had advisors push Accounting in Leonardtown. New marketing brochures created. Table V Organizational Performance Results Graph 5a

66 Table V Organizational Performance Results 5. Organizational Effectiveness Results Organizational effectiveness results examine attainment of organizational goals. Each business unit must have a systematic reporting mechanism for each business program that charts enrollment patterns, student retention, student academic success, and other characteristics reflecting students' performance.
67 Performance Measure (Competency) 5b. The number of graduates in each program should increase each year. Description of Measurement Instrument Track graduates by program and department total each fall. (Internal) (Summative) Areas of Success The number of graduates increased for the last three years. Analysis of Results Analysis and Action Taken Graduate counts fell in Increased access for students in remote campuses by offering more courses online. Had advisors push Accounting in Leonardtown. Created new marketing brochures. Results of The number of graduates rose again in Trend for 3-5 Years (See Graphs) 2006 = = = = = 178 (Graph 5b) Table V Organizational Performance Results Graph 5b

68 Table V Organizational Performance Results 5. Organizational Effectiveness Results Organizational effectiveness results examine attainment of organizational goals. Each business unit must have a systematic reporting mechanism for each business program that charts enrollment patterns, student retention, student academic success, and other characteristics reflecting students' performance. Analysis of Results Performance Description of Areas of Analysis and Action Results of Trend for 3-5
69 Measure (Competency) 5c. The percentage of graduates reporting that they are employed or have transferred should be greater than 70% 5d. At least 50% of Graduates from the Business Administration transfer program will report that they have transferred to a four-year college. Measurement Instrument Maryland Higher Education Commission Graduate Follow-up Surveys. (External) (Summative) Maryland Higher Education Commission Graduate Follow-up Surveys. (External) (Summative) Success Taken Years (See Graphs) Percentage dropped in n/a 2000 = 88.9% New survey 2002 = 77.8% A college advisor was does not break 2005 = 78.4% assigned to work out results by (Graph 5c) directly with the dept. programs. No further data. Now require advising before reaching 18 and 36 credits earned. Percentage exceeded target in all surveys. Percentage target in all surveys. Fell in 2002 and A college advisor was assigned to work directly with the dept. Now require advising before reaching 18 and 36 credits earned. n/a New survey does not break out results by programs = 76.9% 2002 = 62.5% 2005 = 57.8% (Graph 5d) No further data. Table V Organizational Performance Results Graphs 5c and 5d
70 Percent 5c - Percent of Graduates Reporting Employment or Transfer (Total and by Program Year DEPT ACC BAD MGT Target Percent 5d - Graduates Reporting Transfer to a Four-Year College Year Percent Target Year DEPT ACC BAD MGT Target Table V Organizational Performance Results 5. Organizational Effectiveness Results Organizational effectiveness results examine attainment of organizational goals. Each business unit must have a systematic reporting mechanism for each business program that charts enrollment patterns, student retention, student academic success, and other characteristics reflecting students' performance.
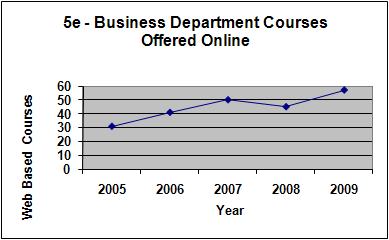
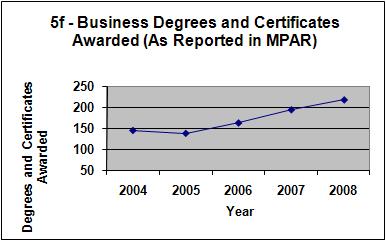
71 Performance Measure (Competency) 5e. The department will offer more courses online each year to improve student access. 5f. The department will increase the number of Associate Degrees and Certificates awarded in the Business program area. Description of Measurement Instrument Count of online course sections each year. (Internal) (Summative) Item 19a. on the Maryland Performance Accountability Report (MPAR). (Internal) (Summative) Areas of Success Count increased in four of five years. Degrees and Certificates increased in the last three years. Analysis of Results Analysis and Action Taken Count did not increase in Training in Web CT course delivery was offered to more part-time instructors. Number awarded dropped in 2004 and Increased access for students in remote campuses by offering more courses online. New marketing brochures created. Results of Count increased in Awards increased in 2006 and beyond.. Trend for 3-5 Years (See Graphs) 2005 = = = = = 57 (Graph 5e) 2004 = = = = = 218 (Graph 5f) Table V Organizational Performance Results Graphs 5e and 5f
72
SORRELL COLLEGE OF BUSINESS
 43 The vision of the Sorrell College of Business is to be the first choice for higher business education students in their quest to succeed in a dynamic and global economy. Sorrell College of Business
Standards and Criteria for Demonstrating Excellence in BACCALAUREATE/GRADUATE DEGREE PROGRAMS
 Standards and Criteria for Demonstrating Excellence in BACCALAUREATE/GRADUATE DEGREE PROGRAMS World Headquarters 11520 West 119th Street Overland Park, KS 66213 USA USA Belgium Perú acbsp.org info@acbsp.org
SORRELL COLLEGE OF BUSINESS
 66. SORRELL COLLEGE OF BUSINESS SORRELL COLLEGE OF BUSINESS The Sorrell College of Business supports the Troy University mission by preparing our diverse student body to become ethical professionals equipped
Colorado State University Department of Construction Management. Assessment Results and Action Plans
 Colorado State University Department of Construction Management Assessment Results and Action Plans Updated: Spring 2015 Table of Contents Table of Contents... 2 List of Tables... 3 Table of Figures...
TREATMENT OF SMC COURSEWORK FOR STUDENTS WITHOUT AN ASSOCIATE OF ARTS
 Articulation Agreement REGIS UNIVERSITY Associate s to Bachelor s Program PURPOSE The purpose of the agreement is to enable SMC students who transfer to Regis with an Associate of Arts to be recognized
Shelters Elementary School
 Shelters Elementary School August 2, 24 Dear Parents and Community Members: We are pleased to present you with the (AER) which provides key information on the 23-24 educational progress for the Shelters
ARIZONA STATE UNIVERSITY PROPOSAL TO ESTABLISH A NEW GRADUATE DEGREE
 ARIZONA STATE UNIVERSITY PROPOSAL TO ESTABLISH A NEW GRADUATE DEGREE DEGREE PROGRAM Gollege/School(s) offering this degree: W. P. Carey School of Business Unit(s) within college/school responsible for
TRANSFER ARTICULATION AGREEMENT between DOMINICAN COLLEGE and BERGEN COMMUNITY COLLEGE
 TRANSFER ARTICULATION AGREEMENT between DOMINICAN COLLEGE and BERGEN COMMUNITY COLLEGE General Stipulations students who graduate with an A.A., A.A.S. or A.S. degree in specified programs (see attached
World s Best Workforce Plan
 2017-18 World s Best Workforce Plan District or Charter Name: PiM Arts High School, 4110-07 Contact Person Name and Position Matt McFarlane, Executive Director In accordance with Minnesota Statutes, section
Differential Tuition Budget Proposal FY
 Differential Tuition Budget Proposal FY 2013-2014 MPA Differential Tuition Subcommittee MPA Faculty This document presents the budget proposal of the MPA Differential Tuition Subcommittee (MPADTS) for
Program Information on the Graduate Certificate in Alcohol and Drug Abuse Studies (CADAS)
") Program Information on the Graduate Certificate in Alcohol and Drug Abuse Studies (CADAS) This program is designed for students who have either: 1) completed a Master s degree or higher qualification from
Program Information on the Graduate Certificate in Alcohol and Drug Abuse Studies (CADAS) This program is designed for students who have either: 1) completed a Master s degree or higher qualification from
Evaluation of Teach For America:
 EA15-536-2 Evaluation of Teach For America: 2014-2015 Department of Evaluation and Assessment Mike Miles Superintendent of Schools This page is intentionally left blank. ii Evaluation of Teach For America:
Center for International Studies
 Center for International Studies Phone: (512) 245-2339 Office: Lampasas 503 Fax: (512) 245-7857 Web: http://www.txstate.edu/internationalstudies/ Degree Programs Offered BAIS, major in International Studies
ARTICULATION AGREEMENT
 ARTICULATION AGREEMENT between Associate of Sciences in Engineering Technologies and The Catholic University of America School of Engineering Bachelor of Science with Majors in: Biomedical Engineering
Department of Education School of Education & Human Services Master of Education Policy Manual
 Department of Education School of Education & Human Services Master of Education Policy Manual Prepared by: Dr. Stacey Brown-Hobbs Elizabeth C. Monahan, PDS Liaison Edited by: Carolyn L. Cook, Director
College of Engineering and Applied Science Department of Computer Science
 College of Engineering and Applied Science Department of Computer Science Guidelines for Doctor of Philosophy in Engineering Focus Area: Security Last Updated April 2017 I. INTRODUCTION The College of
TABLE OF CONTENTS Credit for Prior Learning... 74
 TABLE OF CONTENTS Credit for Prior Learning... 74 Credit by Examination...74 Specific Course Credit...74 General Education and Associate Degree Credit by Exam...74 Advanced Placement (AP) Examination:
Personnel Administrators. Alexis Schauss. Director of School Business NC Department of Public Instruction
 Personnel Administrators Alexis Schauss Director of School Business NC Department of Public Instruction Delivering Bad News in a Good Way Planning Allotments are NOT Allotments Budget tool New Allotted
BENCHMARK TREND COMPARISON REPORT:
 National Survey of Student Engagement (NSSE) BENCHMARK TREND COMPARISON REPORT: CARNEGIE PEER INSTITUTIONS, 2003-2011 PREPARED BY: ANGEL A. SANCHEZ, DIRECTOR KELLI PAYNE, ADMINISTRATIVE ANALYST/ SPECIALIST
ACBSP Related Standards: #3 Student and Stakeholder Focus #4 Measurement and Analysis of Student Learning and Performance
 Graduate Business Student Course Evaluations Baselines July 12, 2011 W. Kleintop Process: Student Course Evaluations ACBSP Related Standards: #3 Student and Stakeholder Focus #4 Measurement and Analysis
PROVIDENCE UNIVERSITY COLLEGE
 BACHELOR OF BUSINESS ADMINISTRATION (BBA) WITH CO-OP (4 Year) Academic Staff Jeremy Funk, Ph.D., University of Manitoba, Program Coordinator Bruce Duggan, M.B.A., University of Manitoba Marcio Coelho,
Program Assessment and Alignment
 Program Assessment and Alignment Lieutenant Colonel Daniel J. McCarthy, Assistant Professor Lieutenant Colonel Michael J. Kwinn, Jr., PhD, Associate Professor Department of Systems Engineering United States
Online Master of Business Administration (MBA)
") Online Master of Business Administration (MBA) Dear Prospective Student, Thank you for contacting the University of Maryland s Robert H. Smith School of Business. By requesting this brochure, you ve taken
Online Master of Business Administration (MBA) Dear Prospective Student, Thank you for contacting the University of Maryland s Robert H. Smith School of Business. By requesting this brochure, you ve taken
Chaffey College Program Review Report
 Program Review Title: Program Code: Review Type: Type: Chaffey College Program Review Report Accounting, Financial Services, and Real Estate 502 - ACCOUNTING AND FINANCIAL SERVICES Instructional SLO's
RECRUITMENT AND EXAMINATIONS
 CHAPTER V: RECRUITMENT AND EXAMINATIONS RULE 5.1 RECRUITMENT Section 5.1.1 Announcement of Examinations RULE 5.2 EXAMINATION Section 5.2.1 Determination of Examinations 5.2.2 Open Competitive Examinations
Annual Report Accredited Member
 International Assembly for Collegiate Business Education Annual Report Accredited Member Institution: Academic Business Unit: Palm Beach Atlantic University Rinker School of Business Academic Year: 2013-14
MANAGEMENT, BS. Administration. Policies Academic Policies. Admissions & Policies. Termination from the Major. . University Consortium
 Management, BS MANAGEMENT, BS Banner Code: BU-BS-MGMT Academic Advising Phone: 70-99-880 Email: masonbus@gmu.edu Administration Richard Klimoski, Chair, Management Area and Director, Faculty Research The
VOL VISION 2020 STRATEGIC PLAN IMPLEMENTATION
 VOL VISION 2020 STRATEGIC PLAN IMPLEMENTATION CONTENTS Vol Vision 2020 Summary Overview Approach Plan Phase 1 Key Initiatives, Timelines, Accountability Strategy Dashboard Phase 1 Metrics and Indicators
AFROTC FORM 48 YOUR PLAN TO GRADUATE ON TIME
 AFROTC FORM 48 YOUR PLAN TO GRADUATE ON TIME PURPOSE: The academic plan is designed to ensure each applicant meets graduation and program completion requirements in a realistic manner. Once the academic
Academic Catalog Programs & Courses Manchester Community College
 2016 2017 Academic Catalog Programs & Courses Manchester Community College 1 Accounting and Business Administration Transfer, A.S. Program Design The Accounting and Business Administration Transfer associate
Individual Interdisciplinary Doctoral Program Faculty/Student HANDBOOK
 Individual Interdisciplinary Doctoral Program at Washington State University 2017-2018 Faculty/Student HANDBOOK Revised August 2017 For information on the Individual Interdisciplinary Doctoral Program
Cooper Upper Elementary School
 LIVONIA PUBLIC SCHOOLS http://cooper.livoniapublicschools.org 215-216 Annual Education Report BOARD OF EDUCATION 215-16 Colleen Burton, President Dianne Laura, Vice President Tammy Bonifield, Secretary
College of Court Reporting
 College of Court Reporting Campus Effectiveness Plan 2016-2017 Reporting Period: July 1, 2016 to June 30, 2017 College of Court Reporting 455 West Lincolnway Valparaiso, Indiana 46385 (219) 531-1459 www.ccr.edu
Doctoral GUIDELINES FOR GRADUATE STUDY
 Doctoral GUIDELINES FOR GRADUATE STUDY DEPARTMENT OF COMMUNICATION STUDIES Southern Illinois University, Carbondale Carbondale, Illinois 62901 (618) 453-2291 GUIDELINES FOR GRADUATE STUDY DEPARTMENT OF
Chapter 4 Grading and Academic Standards
 Chapter 4 Grading and Academic Standards 2014-2015 Shasta College Catalog Chapter 4 Grading and Academic Standards Audit Please see Chapter 2 Admission and Enrollment Information for details. Grading It
CONNECTICUT GUIDELINES FOR EDUCATOR EVALUATION. Connecticut State Department of Education
 CONNECTICUT GUIDELINES FOR EDUCATOR EVALUATION Connecticut State Department of Education October 2017 Preface Connecticut s educators are committed to ensuring that students develop the skills and acquire
Transfer Guide
 Listed as one of the Best Business Schools in the Princeton Review 2008 Edition Springfield, Missouri Transfer Guide 20 20 For Potential Business Students Planning to Transfer From: Mineral Area College
ACCREDITATION STANDARDS
 ACCREDITATION STANDARDS Description of the Profession Interpretation is the art and science of receiving a message from one language and rendering it into another. It involves the appropriate transfer
JOB OUTLOOK 2018 NOVEMBER 2017 FREE TO NACE MEMBERS $52.00 NONMEMBER PRICE NATIONAL ASSOCIATION OF COLLEGES AND EMPLOYERS
 NOVEMBER 2017 FREE TO NACE MEMBERS $52.00 NONMEMBER PRICE JOB OUTLOOK 2018 NATIONAL ASSOCIATION OF COLLEGES AND EMPLOYERS 62 Highland Avenue, Bethlehem, PA 18017 www.naceweb.org 610,868.1421 TABLE OF CONTENTS
Programme Specification and Curriculum Map for Foundation Year
 Programme Specification and Curriculum Map for Foundation Year 1. Programme title Foundation Year 2. Awarding institution Middlesex University 3. Teaching institution Middlesex University 4. Programme
July 17, 2017 VIA CERTIFIED MAIL. John Tafaro, President Chatfield College State Route 251 St. Martin, OH Dear President Tafaro:
 July 17, 2017 VIA CERTIFIED MAIL John Tafaro, President Chatfield College 20918 State Route 251 St. Martin, OH 45118 Dear President Tafaro: This letter is formal notification of action taken by the Higher
Master of Science (MS) in Education with a specialization in. Leadership in Educational Administration
 in Education with a specialization in. Leadership in Educational Administration") Master of Science (MS) in Education with a specialization in Leadership in Educational Administration Effective October 9, 2017 Master of Science (MS) in Education with a specialization in Leadership in
Master of Science (MS) in Education with a specialization in Leadership in Educational Administration Effective October 9, 2017 Master of Science (MS) in Education with a specialization in Leadership in
Field Experience and Internship Handbook Master of Education in Educational Leadership Program
 Field Experience and Internship Handbook Master of Education in Educational Leadership Program Together we Shape the Future through Excellence in Teaching, Scholarship, and Leadership College of Education
Chapter 9 The Beginning Teacher Support Program
 Chapter 9 The Beginning Teacher Support Program Background Initial, Standard Professional I (SP I) licenses are issued to teachers with fewer than three years of appropriate teaching experience (normally
University of North Dakota
 ARTICULATION AGREEMENT AND TRANSFER GUIDE University of North Dakota and Spokane Falls Community College - - - - ARTICULATION AGREEMENT University of North Dakota and Spokane Falls Community College University
Comprehensive Student Services Program Review
 Comprehensive Student Services Program Review 2014-2015 Extended Opportunity Programs & Services (EOPS) and Cooperative Agencies Resources for Education (CARE) Mission Statement: Mt. San Jacinto College
MSW Application Packet
 Stephen F. Austin State University Master of Social Work Program Accredited by: The Council on Social Work Education MSW Application Packet P. O. Box 6104, SFA Station 420 East Starr Avenue Nacogdoches,
Guidelines for the Use of the Continuing Education Unit (CEU)
") Guidelines for the Use of the Continuing Education Unit (CEU) The UNC Policy Manual The essential educational mission of the University is augmented through a broad range of activities generally categorized
Guidelines for the Use of the Continuing Education Unit (CEU) The UNC Policy Manual The essential educational mission of the University is augmented through a broad range of activities generally categorized
Field Experience Management 2011 Training Guides
 Field Experience Management 2011 Training Guides Page 1 of 40 Contents Introduction... 3 Helpful Resources Available on the LiveText Conference Visitors Pass... 3 Overview... 5 Development Model for FEM...
HEALTH INFORMATION ADMINISTRATION Bachelor of Science (BS) Degree (IUPUI School of Informatics) IMPORTANT:
 Degree (IUPUI School of Informatics) IMPORTANT:") HEALTH INFORMATION ADMINISTRATION Bachelor of Science (BS) Degree (IUPUI School of Informatics) IMPORTANT: THIS DRAFT IS MEANT FOR PRELIMINARY PLANNING PURPOSES ONLY. TO PLAN FULLY FOR THIS DEGREE, YOU
HEALTH INFORMATION ADMINISTRATION Bachelor of Science (BS) Degree (IUPUI School of Informatics) IMPORTANT: THIS DRAFT IS MEANT FOR PRELIMINARY PLANNING PURPOSES ONLY. TO PLAN FULLY FOR THIS DEGREE, YOU
2007 No. xxxx EDUCATION, ENGLAND. The Further Education Teachers Qualifications (England) Regulations 2007
 Regulations 2007") Please note: these Regulations are draft - they have been made but are still subject to Parliamentary Approval. They S T A T U T O R Y I N S T R U M E N T S 2007 No. xxxx EDUCATION, ENGLAND The Further
Please note: these Regulations are draft - they have been made but are still subject to Parliamentary Approval. They S T A T U T O R Y I N S T R U M E N T S 2007 No. xxxx EDUCATION, ENGLAND The Further
Title Columbus State Community College's Master Planning Project (Phases III and IV) Status COMPLETED
 Status COMPLETED") The Higher Learning Commission Action Project Directory Columbus State Community College Project Details Title Columbus State Community College's Master Planning Project (Phases III and IV) Status COMPLETED
The Higher Learning Commission Action Project Directory Columbus State Community College Project Details Title Columbus State Community College's Master Planning Project (Phases III and IV) Status COMPLETED
African American Male Achievement Update
 Report from the Department of Research, Evaluation, and Assessment Number 8 January 16, 2009 African American Male Achievement Update AUTHOR: Hope E. White, Ph.D., Program Evaluation Specialist Department
UNIVERSITY OF BALTIMORE
 UNIVERSITY OF BALTIMORE 9114/06 DOCUMENT N: COURSE AND PROGRAM DEVELOPMENT COVER SHEET See Course and Program Development Policy and Procedures for Instructions I SCHOOL: LAW X MSB [J YGCLA [J Contact
Undergraduate Program Guide. Bachelor of Science. Computer Science DEPARTMENT OF COMPUTER SCIENCE and ENGINEERING
 Undergraduate Program Guide Bachelor of Science in Computer Science 2011-2012 DEPARTMENT OF COMPUTER SCIENCE and ENGINEERING The University of Texas at Arlington 500 UTA Blvd. Engineering Research Building,
Program Elements Definitions and Structure
 Program Elements Definitions and Structure Types of Programs MATC offers numerous courses, programs, and training opportunities designed to meet the needs of the Milwaukee area community. There are currently
Biological Sciences, BS and BA
 Student Learning Outcomes Assessment Summary Biological Sciences, BS and BA College of Natural Science and Mathematics AY 2012/2013 and 2013/2014 1. Assessment information collected Submitted by: Diane
UoS - College of Business Administration. Master of Business Administration (MBA)
") UoS - College of Business Administration Master of Business Administration (MBA) Introduction The College of Business Administration (CoBA) at the University of Sharjah (UoS) has grown rapidly over the
UoS - College of Business Administration Master of Business Administration (MBA) Introduction The College of Business Administration (CoBA) at the University of Sharjah (UoS) has grown rapidly over the
APAC Accreditation Summary Assessment Report Department of Psychology, James Cook University
 APAC Accreditation Summary Assessment Report Department of Psychology, James Cook University Higher Education Provider James Cook University, Department of Psychology Date of determination 20 December
Computer Science Self-Study Report for APC Review Fall 2007
 Computer Science Self-Study Report for APC Review Fall 2007 I. Program Mission, Goals, and Context A. What is the mission of the program? How does the program mission support university/college missions
Assumption University Five-Year Strategic Plan ( )
") Assumption University Five-Year Strategic Plan (2014 2018) AU Strategies for Development AU Five-Year Strategic Plan (2014 2018) Vision, Mission, Uniqueness, Identity and Goals Au Vision Assumption University
Assumption University Five-Year Strategic Plan (2014 2018) AU Strategies for Development AU Five-Year Strategic Plan (2014 2018) Vision, Mission, Uniqueness, Identity and Goals Au Vision Assumption University
DOCTOR OF PHILOSOPHY IN POLITICAL SCIENCE
 Doctor of Philosophy in Political Science 1 DOCTOR OF PHILOSOPHY IN POLITICAL SCIENCE Work leading to the degree of Doctor of Philosophy (PhD) is designed to give the candidate a thorough and comprehensive
TRENDS IN. College Pricing
 2008 TRENDS IN College Pricing T R E N D S I N H I G H E R E D U C A T I O N S E R I E S T R E N D S I N H I G H E R E D U C A T I O N S E R I E S Highlights 2 Published Tuition and Fee and Room and Board
University of Toronto
 University of Toronto OFFICE OF THE VICE PRESIDENT AND PROVOST Governance and Administration of Extra-Departmental Units Interdisciplinarity Committee Working Group Report Following approval by Governing
Department of Geography Bachelor of Arts in Geography Plan for Assessment of Student Learning Outcomes The University of New Mexico
 Department of Geography Bachelor of Arts in Geography Plan for Assessment of Student Learning Outcomes The University of New Mexico A. College, Department and Date 1. College: College of Arts & Sciences
Fall Semester Year 1: 15 hours
 Four-Year Graduation Plan - Courses and Critical Benchmarks The following is a sample course of study. It is the Student s responsibility to ensure that all program requirements are met. This guide is
EDUCATIONAL ATTAINMENT
 EDUCATIONAL ATTAINMENT By 2030, at least 60 percent of Texans ages 25 to 34 will have a postsecondary credential or degree. Target: Increase the percent of Texans ages 25 to 34 with a postsecondary credential.
Tentative School Practicum/Internship Guide Subject to Change
 04/2017 1 Tentative School Practicum/Internship Guide Subject to Change Practicum and Internship Packet For Students, Interns, and Site Supervisors COUN 6290 School Counseling Practicum And COUN 6291 School
Cooper Upper Elementary School
 LIVONIA PUBLIC SCHOOLS www.livoniapublicschools.org/cooper 213-214 BOARD OF EDUCATION 213-14 Mark Johnson, President Colleen Burton, Vice President Dianne Laura, Secretary Tammy Bonifield, Trustee Dan
Procedures for Academic Program Review. Office of Institutional Effectiveness, Academic Planning and Review
 Procedures for Academic Program Review Office of Institutional Effectiveness, Academic Planning and Review Last Revision: August 2013 1 Table of Contents Background and BOG Requirements... 2 Rationale
U VA THE CHANGING FACE OF UVA STUDENTS: SSESSMENT. About The Study
 About The Study U VA SSESSMENT In 6, the University of Virginia Office of Institutional Assessment and Studies undertook a study to describe how first-year students have changed over the past four decades.
Goal #1 Promote Excellence and Expand Current Graduate and Undergraduate Programs within CHHS
 Goal #1 Promote Excellence and Expand Current Graduate and Undergraduate Programs within CHHS Objectives Actions Outcome Responsibility Objective 1 Develop innovative alternative methodologies for educational
Module Title: Managing and Leading Change. Lesson 4 THE SIX SIGMA
 Module Title: Managing and Leading Change Lesson 4 THE SIX SIGMA Learning Objectives: At the end of the lesson, the students should be able to: 1. Define what is Six Sigma 2. Discuss the brief history
BUSINESS INFORMATION SYSTEMS PhD PROGRAM DESCRIPTION AND DOCTORAL STUDENT MANUAL
 BUSINESS INFORMATION SYSTEMS PhD PROGRAM DESCRIPTION AND DOCTORAL STUDENT MANUAL MSU Major Code: 6024 Michigan State University Eli Broad College of Business Updated February 19, 2015 Note: Program applicants
DISTRICT ASSESSMENT, EVALUATION & REPORTING GUIDELINES AND PROCEDURES
 SCHOOL DISTRICT NO. 20 (KOOTENAY-COLUMBIA) DISTRICT ASSESSMENT, EVALUATION & REPORTING GUIDELINES AND PROCEDURES The purpose of the District Assessment, Evaluation & Reporting Guidelines and Procedures
Multiple Measures Assessment Project - FAQs
 Multiple Measures Assessment Project - FAQs (This is a working document which will be expanded as additional questions arise.) Common Assessment Initiative How is MMAP research related to the Common Assessment
The Ohio State University Library System Improvement Request,
 The Ohio State University Library System Improvement Request, 2005-2009 Introduction: A Cooperative System with a Common Mission The University, Moritz Law and Prior Health Science libraries have a long
Accounting 312: Fundamentals of Managerial Accounting Syllabus Spring Brown
 Class Hours: MW 3:30-5:00 (Unique #: 02247) UTC 3.102 Professor: Patti Brown, CPA E-mail: patti.brown@mccombs.utexas.edu Office: GSB 5.124B Office Hours: Mon 2:00 3:00pm Phone: (512) 232-6782 TA: TBD TA
Academic Advising Manual
 Academic Advising Manual Revised 17 July 2013 1 Academic Advising Manual Table of Contents I. Academic Advising Mission Statement. 3 II. Goals and Responsibilities of Advisors and Students 3-5 III. Characteristics
Massachusetts Juvenile Justice Education Case Study Results
 Massachusetts Juvenile Justice Education Case Study Results Principal Investigator: Thomas G. Blomberg Dean and Sheldon L. Messinger Professor of Criminology and Criminal Justice Prepared by: George Pesta
Prince2 Foundation and Practitioner Training Exam Preparation
 Prince2 Foundation and Practitioner Training Exam Preparation Prince2 is the UK Government Best Practice standard and is widely recognized and used for effective Project management methodology and tools.
Master of Science in Taxation (M.S.T.) Program
 Program") The W. Edwards Deming School of Business Master of Science in Taxation (M.S.T.) Program REV. 01-2017 CATALOG SUPPLEMENT (A Non-Resident Independent Study Degree Program) The University s School of Business
The W. Edwards Deming School of Business Master of Science in Taxation (M.S.T.) Program REV. 01-2017 CATALOG SUPPLEMENT (A Non-Resident Independent Study Degree Program) The University s School of Business
AGENDA ITEM VI-E October 2005 Page 1 CHAPTER 13. FINANCIAL PLANNING
 Page 1 CHAPTER 13. FINANCIAL PLANNING Subchapter F. FORMULA FUNDING AND TUITION CHARGED FOR REPEATED AND EXCESS HOURS OF UNDERGRADUATE STUDENTS Section 13.100. Purpose. 13.101. Authority 13.102. Definitions.
1. Faculty responsible for teaching those courses for which a test is being used as a placement tool.
 Studies Addressing Content-Related Validity Materials needed 1. A listing of prerequisite knowledge and skills for each of the courses for which a test is being used as a placement tool, i.e., identify
REGISTRATION. Enrollment Requirements. Academic Advisement for Registration. Registration. Sam Houston State University 1
 Sam Houston State University 1 REGISTRATION Enrollment Requirements (p. 1) Academic Advisement for Registration (p. 1) Registration (p. 1) Change of Schedule (Adding and Dropping Courses) (p. 2) Resignations
Rules of Procedure for Approval of Law Schools
 Rules of Procedure for Approval of Law Schools Table of Contents I. Scope and Authority...49 Rule 1: Scope and Purpose... 49 Rule 2: Council Responsibility and Authority with Regard to Accreditation Status...
Envision Success FY2014-FY2017 Strategic Goal 1: Enhancing pathways that guide students to achieve their academic, career, and personal goals
 Strategic Goal 1: Enhancing pathways that guide students to achieve their academic, career, and personal goals Institutional Priority: Improve the front door experience Identify metrics appropriate to
Post-Master s Certificate in. Leadership for Higher Education
 Post-Master s Certificate in Leadership for Higher Education Effective July 10, 2017 Post-Master s Certificate in Leadership for Higher Education This post-master s certificate program is offered in the
Number/Type Term Minimum Contact Term Maximum Contact 11-Week Term Contact. Discussion, quiz, projects. Discussion, quiz, projects
 Section 1. Proposed Course Outline (A general statement of course content that informs class syllabus construction. Once approved, all sections of a given course must include this content, no matter which
SELF-STUDY QUESTIONNAIRE FOR REVIEW of the COMPUTER SCIENCE PROGRAM
 Disclaimer: This Self Study was developed to meet the goals of the CAC Session at the 2006 Summit. It should not be considered as a model or a template. ABET Computing Accreditation Commission SELF-STUDY
KOMAR UNIVERSITY OF SCIENCE AND TECHNOLOGY (KUST)
") Course Title COURSE SYLLABUS for ACCOUNTING INFORMATION SYSTEM ACCOUNTING INFORMATION SYSTEM Course Code ACC 3320 No. of Credits Three Credit Hours (3 CHs) Department Accounting College College of Business
Course Title COURSE SYLLABUS for ACCOUNTING INFORMATION SYSTEM ACCOUNTING INFORMATION SYSTEM Course Code ACC 3320 No. of Credits Three Credit Hours (3 CHs) Department Accounting College College of Business
GETTING READY FOR THE U A GUIDE FOR TRANSFERRING TO THE UNIVERSITY OF UTAH FOR BYU-IDAHO STUDENTS. How To Use This Guide.
 A GUIDE FOR TRANSFERRING TO THE UNIVERSITY OF UTAH FOR FOR BRIGHAM YOUNG UNIVERSITY IDAHO STUDENTS 2016-2017 GETTING READY FOR THE U A GUIDE FOR TRANSFERRING TO THE UNIVERSITY OF UTAH FOR BYU-IDAHO STUDENTS
CURRICULUM PROCEDURES REFERENCE MANUAL. Section 3. Curriculum Program Application for Existing Program Titles (Procedures and Accountability Report)
") CURRICULUM PROCEDURES REFERENCE MANUAL Section 3 Curriculum Program Application for Existing Program Titles (Procedures and Accountability Report) (Associate in Applied Science, Diploma, and Certificate
CURRICULUM PROCEDURES REFERENCE MANUAL Section 3 Curriculum Program Application for Existing Program Titles (Procedures and Accountability Report) (Associate in Applied Science, Diploma, and Certificate
What Is The National Survey Of Student Engagement (NSSE)?
?") National Survey of Student Engagement (NSSE) 2000 Results for Montclair State University What Is The National Survey Of Student Engagement (NSSE)? US News and World Reports Best College Survey is due next
National Survey of Student Engagement (NSSE) 2000 Results for Montclair State University What Is The National Survey Of Student Engagement (NSSE)? US News and World Reports Best College Survey is due next
1.0 INTRODUCTION. The purpose of the Florida school district performance review is to identify ways that a designated school district can:
 1.0 INTRODUCTION 1.1 Overview Section 11.515, Florida Statutes, was created by the 1996 Florida Legislature for the purpose of conducting performance reviews of school districts in Florida. The statute
ASSESSMENT OF STUDENT LEARNING OUTCOMES WITHIN ACADEMIC PROGRAMS AT WEST CHESTER UNIVERSITY
 ASSESSMENT OF STUDENT LEARNING OUTCOMES WITHIN ACADEMIC PROGRAMS AT WEST CHESTER UNIVERSITY The assessment of student learning begins with educational values. Assessment is not an end in itself but a vehicle
Colorado s Unified Improvement Plan for Schools for Online UIP Report
 Colorado s Unified Improvement Plan for Schools for 2015-16 Online UIP Report Organization Code: 2690 District Name: PUEBLO CITY 60 Official 2014 SPF: 1-Year Executive Summary How are students performing?
Majors, Minors & Certificate Programs 34 The Majors 35 The Minors & Certificate Programs 36
 Table of Contents Page Academic Policies 4 Office of the Dean of Undergraduate & Graduate Studies 5 School Deans 5 College Academic Policies/Degree Requirements 6 Core Curriculum Class of 2020 9 Frequently
About the College Board. College Board Advocacy & Policy Center
 15% 10 +5 0 5 Tuition and Fees 10 Appropriations per FTE ( Excluding Federal Stimulus Funds) 15% 1980-81 1981-82 1982-83 1983-84 1984-85 1985-86 1986-87 1987-88 1988-89 1989-90 1990-91 1991-92 1992-93
Georgia State University Official Transcript Statement of Authenticity
 Georgia State University Office of the Registrar - Transcripts P.O. Box 4017 Atlanta, Ga. 30302 Phone: 404-413-2600 http://www.gsu.edu/registrar/ To: Re: Keely Harris keelybharris@gmail.com Transcript