Community College Survey of Student Engagement (CCSSE) Spring 2008
|
|
|
- Harvey Rogers
- 5 years ago
- Views:
Transcription


1 Center Community College Survey of Student Engagement (CCSSE) Spring 2008 Benchmarks of Effective Educational Practice
2 Community College Survey of Student Engagement 2008 Institutional Report Benchmarks of Effective Educational Practice The Community College Survey of Student Engagement (CCSSE) utilizes a set of five benchmarks of effective educational practice in community colleges. These benchmarks allow member institutions, with missions focused on teaching, learning, and student success, to gauge and monitor their performance in areas that are truly central to their work. In addition, participating colleges have the opportunity to make appropriate and useful comparisons between their performance and that of other groups of similar colleges. Community colleges differ significantly even dramatically from one another on variables including size, location, resources, enrollment patterns, and student characteristics. It is important to take these differences into account when interpreting benchmark scores especially when making institutional comparisons. Furthermore, the Community College Survey of Student Engagement has adopted an official policy on Responsible Uses of CCSSE Data. Please review the policy, which is provided as an appendix to this report. CCSSE s Benchmarks The five benchmarks encompass 38 engagement items from the CCSSE survey that reflect many of the most important aspects of the student experience. These institutional practices and student behaviors are some of the most powerful contributors to effective teaching, learning, student retention, and student success. As before, CCSSE has used this year a 3-year cohort of participating colleges (2006 through 2008) in all of its data analyses, including the computation of benchmark scores. 1 This cohort is referred to as the 2008 CCSSE Cohort throughout all reports and documentation. This approach increases the total number of institutions and students contributing to the national dataset, which in turn increases the reliability of the overall results. In addition, the 3-year cohort approach minimizes the impact, in any given year, of statewide consortia participation. The benchmarks are briefly described below. Active and Collaborative Learning Students learn more when they are actively involved in their education and have opportunities to think about and apply what they are learning in different settings. Through collaboration with others to solve problems or master challenging content, students develop valuable skills that prepare them to deal with the kinds of situations and problems they will encounter in the workplace, community, and their personal lives. The seven survey items that contribute to this benchmark are these: During the current school year, how often have you Asked questions in class or contributed to class discussions Made a class presentation Worked with other students on projects during class Worked with classmates outside of class to prepare class assignments Tutored or taught other students (paid or voluntary) Participated in a community-based project as a part of a regular course Discussed ideas from your readings or classes with others outside of class (students, family members, co-workers, etc.) 1 For returning participants, the college s most recent year of participation is included in data analyses. For example, if a college participated in 2007 and 2008, only the 2008 data would be used in the 3-year cohort Institutional Report: Benchmarks of Effective Educational Practice Page 1 of 5
3 Student Effort Students own behaviors contribute significantly to their learning and the likelihood that they will successfully attain their educational goals. Time on task is a key variable, and there are a variety of settings and means through which students may apply themselves to the learning process. Associated with this benchmark are eight survey items indicating student behavior in these terms: During the current school year, how often have you Prepared two or more drafts of a paper or assignment before turning it in Worked on a paper or project that required integrating ideas or information from various sources Come to class without completing readings or assignments (reverse coded) Used peer or other tutoring Used skill labs Used a computer lab During the current school year How many books did you read on your own (not assigned) for personal enjoyment or academic enrichment How many hours did you spend in a typical week preparing for class (studying, reading, writing, rehearsing or other activities related to your program) Academic Challenge Challenging intellectual and creative work is central to student learning and collegiate quality. Ten items from The Community College Student Report correspond to components of academic challenge including the nature and amount of assigned academic work, the complexity of cognitive tasks presented to students, and the standards faculty members use to evaluate student performance. Specifically, Academic Challenge includes the following items: During the current school year, how often have you Worked harder than you thought you could to meet an instructor s standards or expectations How much does your coursework at this college emphasize Analyzing the basic elements of an idea, experience, or theory Synthesizing and organizing ideas, information, or experiences in new ways Making judgments about the value or soundness of information, arguments, or methods Applying theories or concepts to practical problems or in new situations Using information you have read or heard to perform a new skill During the current school year How many assigned textbooks, manuals, books, or book-length packs of course readings did you read How many papers or reports of any length did you write To what extent have your examinations challenged you to do your best work How much does this college emphasize Encouraging you to spend significant amounts of time studying Student-Faculty Interaction The more contact students have with their teachers, the more likely they are to learn effectively and to persist toward achievement of their educational goals. Personal interaction with faculty members strengthens students connections to the college and helps them focus on their academic progress. Working with an instructor on a project or serving with faculty members on a college committee lets students see first hand how experts identify and solve practical problems. Through such interactions, faculty members become role models, mentors, and guides for continuous, lifelong learning. The six items used in this benchmark are about students experience in these areas: During the current school year, how often have you Used to communicate with an instructor Discussed grades or assignments with an instructor Talked about career plans with an instructor or advisor Discussed ideas from your readings or classes with instructors outside of class Received prompt feedback (written or oral) from instructors on your performance Worked with instructors on activities other than coursework Support for Learners Students perform better and are more satisfied at colleges that are committed to their success and 2008 Institutional Report: Benchmarks of Effective Educational Practice Page 2 of 5
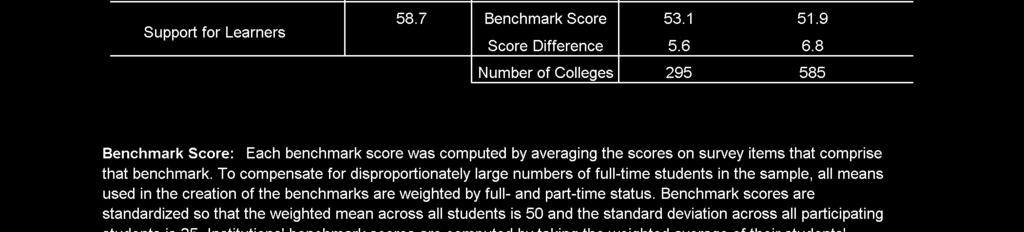
4 cultivate positive working and social relationships among different groups on campus. Community college students also benefit from services targeted to assist them with academic and career planning, academic skill development, and other issues that may affect both learning and retention. The seven survey items contributing to this benchmark include the following: How much does this college emphasize Providing the support you need to help you succeed at this college Encouraging contact among students from different economic, social, and racial or ethnic backgrounds Helping you cope with your non-academic responsibilities (work, family, etc.) Providing the support you need to thrive socially Providing the financial support you need to afford your education During the current school year, how often have you Used academic advising/ planning services Used career counseling services Understanding and Using Benchmarks What are benchmark scores? Benchmark scores provide a useful way to look at an institution s data by creating groups of conceptually related items that address key areas of student engagement. As described above, these areas are active and collaborative learning, student effort, academic challenge, student-faculty interaction, and support for learners. These are five areas that have been shown through research to be important in high-quality educational practice. Through examining empirical results of factor analytic models and with input from its Technical Advisory Panel, CCSSE grouped survey items related to each of these areas. In order to create the benchmark scores, the survey items associated with each benchmark are first rescaled so that all items are on the same scale (0 to 1). Next, the benchmark scores are computed by averaging the scores of the related survey items. Finally, the scores are standardized around the mean of the 3-year cohort so that respondents scores have a mean of 50, weighted by full- and part-time attendance status, and a standard deviation of 25. Benchmark scores are then computed by averaging the scores on the associated items. Rescaling scores increases the value of the scores in the following two ways: 1) all of the benchmarks are on the same scale, enabling comparisons across benchmarks; and 2) the scores provide information about how an individual institution is doing relative to other institutions. Having scores on the same scale makes comparisons across benchmarks more meaningful than comparisons using raw scores. The limitation of using raw scores is illustrated by the fact that there are some aspects of student engagement that will nearly always take place with greater frequency than others. For example, students may typically engage in activities such as homework more frequently than they engage in talking with instructors about career plans, so raw scores will always be higher for homework than for talking with instructors. Without knowing what a typical score is for each of these engagement areas, college faculty and staff have little basis for determining where their institutional strengths and weaknesses may lie. Knowing that all benchmarks are on the same scale makes it immediately obvious that a particular college s scores are either above or below those for other participating schools. Knowing that the mean is at 50 across all students in the sample enhances the score s usefulness for benchmarking, as the score contains information about whether an institution s performance is better or worse than average and how much better or worse. For example, benchmark scores of 55 on Student Effort and 42 on Student- Faculty Interaction would indicate to a college that the institution is performing relatively better in regard to Student Effort than in regard to Student- Faculty Interaction. Further, the benchmark scores allow the college to understand that the results are above the average for participating institutions on one benchmark and below average on the other. Thus the data may be used both to identify relative strengths and to zero in on areas in which the college may need to improve. What can a college do with the benchmarks? There are a number of ways college leaders might choose to use the benchmark scores and the comparison information provided in this report Institutional Report: Benchmarks of Effective Educational Practice Page 3 of 5
5 Examples are provided below: A starting point for understanding your campus findings Multiple pages of survey data presented at the individual item level may be daunting. Where does one start when there are over 150 items addressing a variety of topics? The benchmark scores provide a manageable starting point for reviewing and understanding your CCSSE data. For example, suppose that you have a college mission statement that expresses a commitment to faculty involvement with students. But, you note that the college s student-faculty interaction benchmark score is lower than those for the comparison group and for the 2008 CCSSE Cohort. Therefore, you decide that this is the area you want to target for improvement. To help you understand more precisely what the differences are, CCSSE suggests that you drill down to the item level, look at the percentage of students responding in each category, and compare the responses to those in your comparison groups. This will allow you to identify the specific items that are problem areas, and then target these areas, creating appropriate initiatives to build student-faculty interaction. Understanding the big picture CCSSE reports data for important breakout groups for each benchmark, enabling college leaders to review how their colleges are performing overall, by part- and full-time attendance status, and by credit hours earned. This view provides the big picture of student engagement and involvement. Talking points Benchmark scores are designed to help colleges investigate student engagement in key areas that according to research contribute to effective educational practice (Chickering and Gamson, 1987). Colleges can use these scores to prompt dialogue about effective teaching and learning. Scores likewise can be used to focus attention on programs and policies that may be in need of improvement and on those worthy of celebration. Institutional comparisons Until recently, community and technical colleges have had little opportunity to make valid and appropriate crossinstitutional comparisons, particularly with regard to important dimensions of teaching and learning. Many national surveys do not employ strict sampling protocols, thus making comparisons less meaningful and potentially inappropriate. CCSSE employs a strict sampling protocol which allows for appropriate crossinstitutional comparisons. CCSSE controls the sample selection, thereby ensuring that all class sections have equal chances of being selected. What this means is that no college has the opportunity to skew the results by sampling only highly engaging classes, and therefore, every college is on the same playing field. Colleges can target areas that need improvement both by considering their own institutional aspirations and priorities and by comparing their benchmark scores with groups of similar colleges. After identifying other colleges that are high performers on a particular benchmark, a college can initiate communication to explore the educational practices that may be contributing to enhanced effectiveness at benchmark institutions. Subsequent analyses Any or all of the benchmark scores can be used as variables in subsequent analyses using the CCSSE student record data for your college, which was provided with your Institutional Report. The benchmark scores can also be used in conjunction with traditional institutional data, such as grades and demographic data, to understand the factors that really matter in student success. POLICY STATEMENT ON RESPONSIBLE USES OF CCSSE DATA In accessing the CCSSE database and using the CCSSE data search tools, the user agrees to the following CCSSE policy positions regarding responsible and appropriate uses of the survey data. CCSSE supports uses of survey data for benchmarking effective educational practices, for targeting and monitoring progress in quality improvement, and for public reporting in ways that serve to increase understanding of collegiate quality and to support institutional efforts to improve undergraduate student learning and retention. CCSSE especially supports public reporting of student engagement results in ways that enable thoughtful, responsible institutional comparisons while encouraging and celebrating institutional diversity. CCSSE does not support the use of student 2008 Institutional Report: Benchmarks of Effective Educational Practice Page 4 of 5
6 engagement survey results for the purpose of ranking community and technical colleges. Such uses would obscure complex dimensions of institutional performance and student behavior. Because of differences in institutional focus, student characteristics, and resources, comparisons of survey results from two single institutions serve little constructive purpose and may in fact be wholly inappropriate. CCSSE s data search tools therefore provide group comparisons, using aggregated data from at least three institutions. Appropriate interpretation of survey data will take into account the institutional context (mission, size, urbanicity, program mix, and so on) as well as the characteristics of a particular institution s student population for example, the proportions of full- vs. part-time students, traditional collegeage vs. non-traditional-age students, students who are academically under-prepared as they enter the institution, and students with various educational goals Institutional Report: Benchmarks of Effective Educational Practice Page 5 of 5
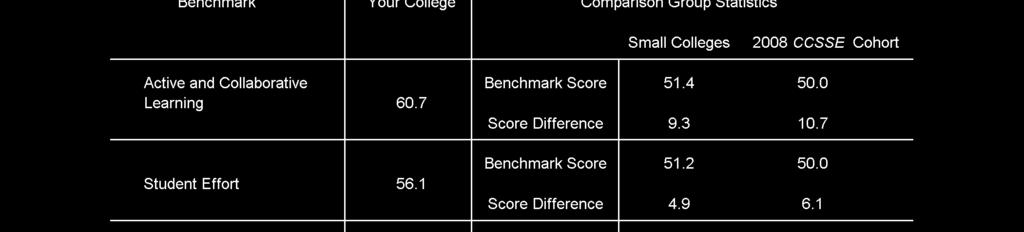
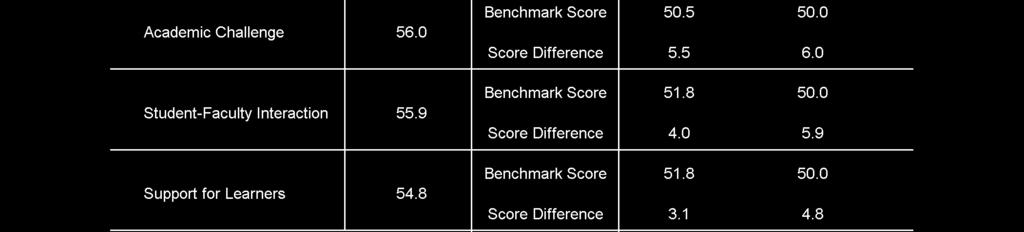
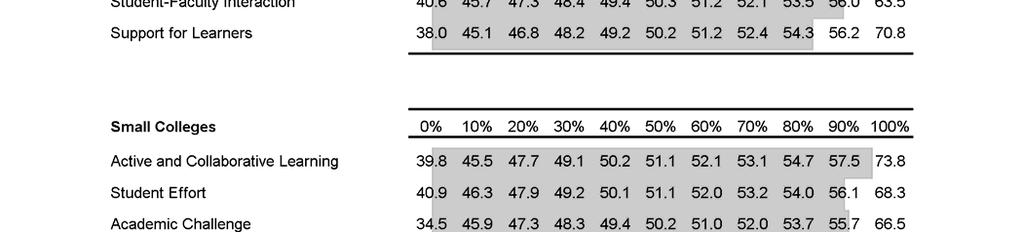
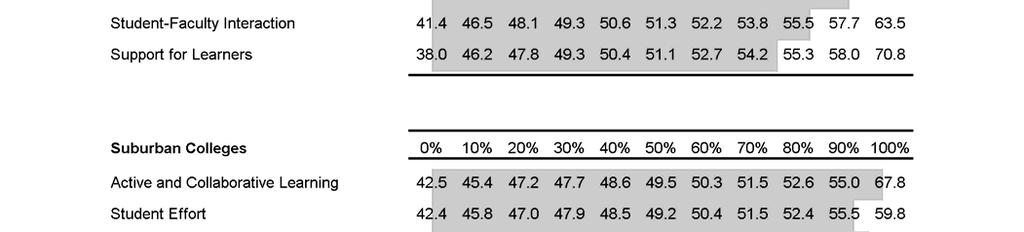
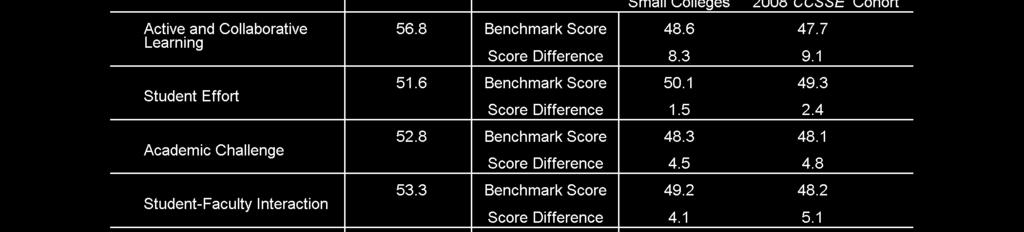
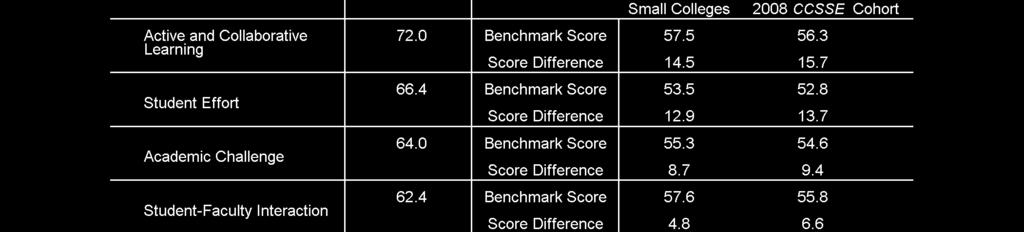
7 Compton Center Summary On the following pages, the CCSSE Benchmarks of Effective Educational Practice are summarized for Center, with comparisons against standardized scores for other Small Colleges and the Hispanic Student Success (HSS) consortium. Benchmark results are further disaggregated by enrollment status (parttime/full-time) and credit hour status (fewer than 30 units/30+ units). Details on how to read different aspects of the report are found on the next page. To quickly review, the five CCSSE benchmarks are: Active and Collaborative Learning Student Effort Academic Challenge Student-Faculty Interaction Support for Learners Compton Center is above the CCSSE cohort average and other small colleges with respect to all five benchmarks. Areas where Compton scored especially high was in Active and Collaborative Learning (page B1). Results remain positive when the survey responses are disaggregated by enrollment status or credit status. Full-time students and students who have earned more than 30 units scored much higher than part-time and lower-unit (newer) students. Compared to the HSS consortium, Compton also scored highly in all five measures, especially in Active and Collaborative Learning. The HSS consortium comparison is not contained in this document but is available on the El Camino College website. By interpreting the deciles report found on page B2, over 95% of institutions in the CCSSE cohort scored below ECC Compton Center in Active and Collaborative Learning. About 90% of the cohort scored below Compton Center in Student Effort, Academic Challenge and Student-Faculty Interaction, while over 80% scored below Support for Learners. Results were nearly as good when comparing to other Small Colleges.
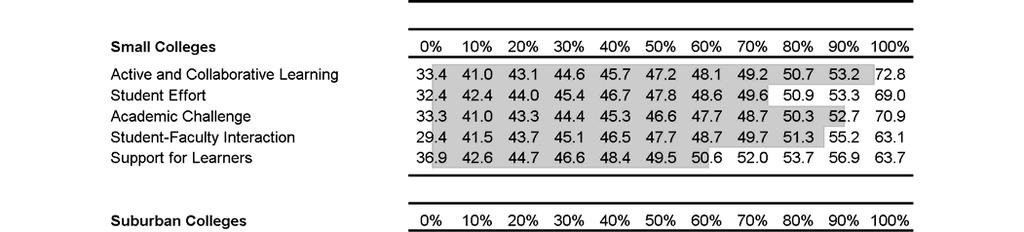
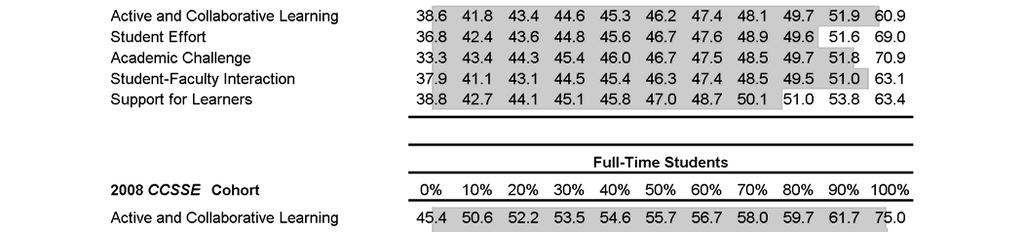
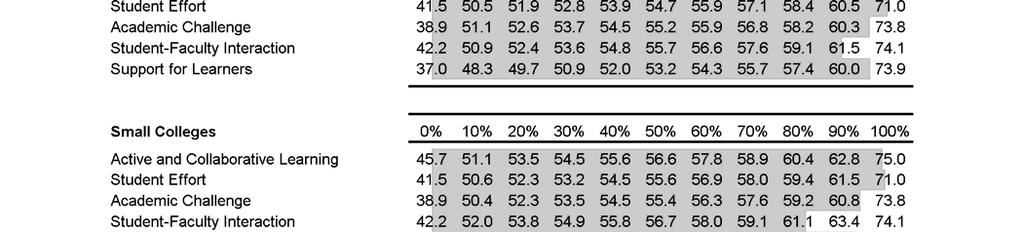
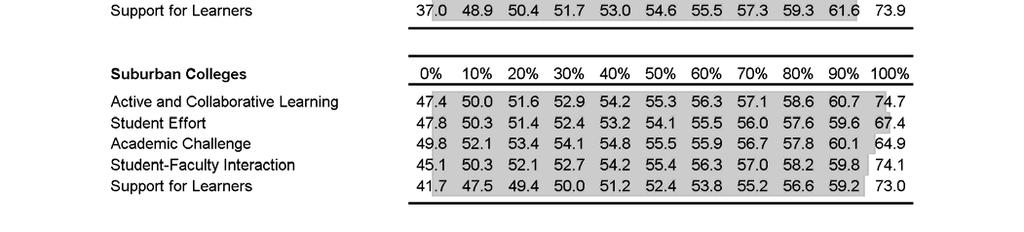
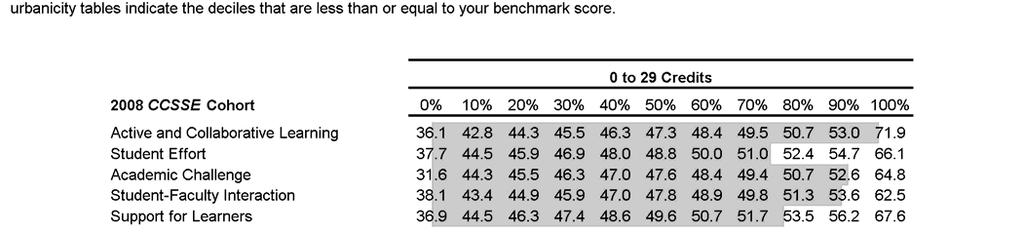
8 Benchmark Reports This section contains nine reports presenting data for all students, for students by enrollment status (e.g., part- and full-time), and for students by credit hour status (0 to 29 and 30+ credits). The first report, on page B1, is a Summary Table of scores for all students on each of the five benchmarks: 1) Active and Collaborative Learning, 2) Student Effort, 3) Academic Challenge, 4) Student-Faculty Interactions, and 5) Support for Learners for your institution, a comparison group, and the 2008 CCSSE Cohort. The CCSSE Benchmark Deciles Report, on page B2, highlights the five benchmark deciles for all students at your institution. Deciles are percentile scores that divide the frequency of benchmark scores into ten equal groups. A percentile represents the point at or below which a specified percentage of the college benchmark scores fall. For example, the 60 th percentile represents the point at or below which 60 percent of the college benchmark scores fall for the respective comparison group. Deciles are listed for the 2008 CCSSE Cohort and for each appropriate breakdown according to college size and urbanicity. To help you gauge your college s performance relative to the comparison groups, the shaded area on the tables indicate the deciles that are less than or equal to your benchmark scores. The third report Bar Charts and Benchmark Item Composition uses bar charts to represent the data provided in the summary table, for all students for each benchmark (pp. B3 - B7). In addition, it provides a listing of items from The Community College Student Report making up that particular benchmark (e.g., Active and Collaborative Learning), the means associated with each item and whether your college s mean is above or below the mean for the comparison group as well as the 2008 CCSSE Cohort. The next series of reports, found on pages B8 through B19, contain the same reports described above broken down by enrollment status for your institution, a comparison group, and the 2008 CCSSE Cohort. The final set of reports, pages B20 through B31, highlight data for all students by credit hour status for your institution, a comparison group, and the 2008 CCSSE Cohort. Please note that for consortium reports (such as for Hispanic Student Success), there are no deciles reports, and the page numbers will not correspond to those listed above.

9 B1
10 B2
11 Active and Collaborative Learning Bar Charts and Benchmark Item Composition - All Students description Description - Students learn more when they are actively involved in their education and have opportunities to think about and apply what they are learning in different settings. Through collaborating with others to solve problems or master challenging content, students develop valuable skills that prepare them to deal with the kinds of situations and problems they will encounter in the workplace, the community, and their personal lives. All Students B3

12 Student Effort Bar Charts and Benchmark Item Composition - All Students description Description - Students' own behaviors contribute significantly to their learning and the likelihood that they will successfully attain their educational goals. All Students B4
13 Academic Challenge Bar Charts and Benchmark Item Composition - All Students description Description - Challenging intellectual and creative work is central to student learning and collegiate quality. Ten survey items address the nature and amount of assigned academic work, the complexity of cognitive tasks presented to students, and the standards faculty members use to evaluate student performance. All Students B5

14 Student-Faculty Interaction Bar Charts and Benchmark Item Composition - All Students description Description - In general, the more contact students have with their teachers, the more likely they are to learn effectively and persist toward achievement of their educational goals. Through such interactions, faculty members become role models, mentors, and guides for continuous, lifelong learning. All Students B6
15 Support for Learners Bar Charts and Benchmark Item Composition - All Students description Description - Students perform better and are more satisfied at colleges that are committed to their success and cultivate positive working and social relationships among different groups on campus. All Students B7
16 B8
17 B9
18 description Active and Collaborative Learning Bar Charts and Benchmark Item Composition - Part-Time Students Description - Students learn more when they are actively involved in their education and have opportunities to think about and apply what they are learning in different settings. Through collaborating with others to solve problems or master challenging content, students develop valuable skills that prepare them to deal with the kinds of situations and problems they will encounter in the workplace, the community, and their personal lives. Part-Time B10

19 Student Effort Bar Charts and Benchmark Item Composition - Part-Time Students description Description - Students' own behaviors contribute significantly to their learning and the likelihood that they will successfully attain their educational goals. Part-Time B11

20 description Academic Challenge Bar Charts and Benchmark Item Composition - Part-Time Students Description - Challenging intellectual and creative work is central to student learning and collegiate quality. Ten survey items address the nature and amount of assigned academic work, the complexity of cognitive tasks presented to students, and the standards faculty members use to evaluate student performance. Part-Time B12

21 description Student-Faculty Interaction Bar Charts and Benchmark Item Composition - Part-Time Students Description - In general, the more contact students have with their teachers, the more likely they are to learn effectively and persist toward achievement of their educational goals. Through such interactions, faculty members become role models, mentors, and guides for continuous, lifelong learning. Part-Time B13
22 Support for Learners Bar Charts and Benchmark Item Composition - Part-Time Students description Description - Students perform better and are more satisfied at colleges that are committed to their success and cultivate positive working and social relationships among different groups on campus. Part-Time B14
23 description Active and Collaborative Learning Bar Charts and Benchmark Item Composition - Full-Time Students Description - Students learn more when they are actively involved in their education and have opportunities to think about and apply what they are learning in different settings. Through collaborating with others to solve problems or master challenging content, students develop valuable skills that prepare them to deal with the kinds of situations and problems they will encounter in the workplace, the community, and their personal lives. Full-Time B15
24 Student Effort Bar Charts and Benchmark Item Composition - Full-Time Students description Description - Students' own behaviors contribute significantly to their learning and the likelihood that they will successfully attain their educational goals. Full-Time B16
25 description Academic Challenge Bar Charts and Benchmark Item Composition - Full-Time Students Description - Challenging intellectual and creative work is central to student learning and collegiate quality. Ten survey items address the nature and amount of assigned academic work, the complexity of cognitive tasks presented to students, and the standards faculty members use to evaluate student performance. Full-Time B17
26 description Student-Faculty Interaction Bar Charts and Benchmark Item Composition - Full-Time Students Description - In general, the more contact students have with their teachers, the more likely they are to learn effectively and persist toward achievement of their educational goals. Through such interactions, faculty members become role models, mentors, and guides for continuous, lifelong learning. Full-Time B18
27 Support for Learners Bar Charts and Benchmark Item Composition - Full-Time Students description Description - Students perform better and are more satisfied at colleges that are committed to their success and cultivate positive working and social relationships among different groups on campus. Full-Time B19
28 B20
29 B21

30 description Active and Collaborative Learning Bar Charts and Benchmark Item Composition - 0 to 29 Credits Students Description - Students learn more when they are actively involved in their education and have opportunities to think about and apply what they are learning in different settings. Through collaborating with others to solve problems or master challenging content, students develop valuable skills that prepare them to deal with the kinds of situations and problems they will encounter in the workplace, the community, and their personal lives. 0 to 29 Credits B22
31 description Student Effort Bar Charts and Benchmark Item Composition - 0 to 29 Credits Students Description - Students' own behaviors contribute significantly to their learning and the likelihood that they will successfully attain their educational goals. 0 to 29 Credits B23

32 description Academic Challenge Bar Charts and Benchmark Item Composition - 0 to 29 Credits Students Description - Challenging intellectual and creative work is central to student learning and collegiate quality. Ten survey items address the nature and amount of assigned academic work, the complexity of cognitive tasks presented to students, and the standards faculty members use to evaluate student performance. 0 to 29 Credits B24
33 description Student-Faculty Interaction Bar Charts and Benchmark Item Composition - 0 to 29 Credits Students Description - In general, the more contact students have with their teachers, the more likely they are to learn effectively and persist toward achievement of their educational goals. Through such interactions, faculty members become role models, mentors, and guides for continuous, lifelong learning. 0 to 29 Credits B25

34 description Support for Learners Bar Charts and Benchmark Item Composition - 0 to 29 Credits Students Description - Students perform better and are more satisfied at colleges that are committed to their success and cultivate positive working and social relationships among different groups on campus. 0 to 29 Credits B26

35 description Active and Collaborative Learning Bar Charts and Benchmark Item Composition Credits Students Description - Students learn more when they are actively involved in their education and have opportunities to think about and apply what they are learning in different settings. Through collaborating with others to solve problems or master challenging content, students develop valuable skills that prepare them to deal with the kinds of situations and problems they will encounter in the workplace, the community, and their personal lives. 30+ Credits B27
36 description Student Effort Bar Charts and Benchmark Item Composition Credits Students Description - Students' own behaviors contribute significantly to their learning and the likelihood that they will successfully attain their educational goals. 30+ Credits B28
37 description Academic Challenge Bar Charts and Benchmark Item Composition Credits Students Description - Challenging intellectual and creative work is central to student learning and collegiate quality. Ten survey items address the nature and amount of assigned academic work, the complexity of cognitive tasks presented to students, and the standards faculty members use to evaluate student performance. 30+ Credits B29

38 description Student-Faculty Interaction Bar Charts and Benchmark Item Composition Credits Students Description - In general, the more contact students have with their teachers, the more likely they are to learn effectively and persist toward achievement of their educational goals. Through such interactions, faculty members become role models, mentors, and guides for continuous, lifelong learning. 30+ Credits B30

39 description Support for Learners Bar Charts and Benchmark Item Composition Credits Students Description - Students perform better and are more satisfied at colleges that are committed to their success and cultivate positive working and social relationships among different groups on campus. 30+ Credits B31
NATIONAL SURVEY OF STUDENT ENGAGEMENT (NSSE)
") NATIONAL SURVEY OF STUDENT ENGAGEMENT (NSSE) 2008 H. Craig Petersen Director, Analysis, Assessment, and Accreditation Utah State University Logan, Utah AUGUST, 2008 TABLE OF CONTENTS Executive Summary...1
NATIONAL SURVEY OF STUDENT ENGAGEMENT (NSSE) 2008 H. Craig Petersen Director, Analysis, Assessment, and Accreditation Utah State University Logan, Utah AUGUST, 2008 TABLE OF CONTENTS Executive Summary...1
ABET Criteria for Accrediting Computer Science Programs
 ABET Criteria for Accrediting Computer Science Programs Mapped to 2008 NSSE Survey Questions First Edition, June 2008 Introduction and Rationale for Using NSSE in ABET Accreditation One of the most common
NATIONAL SURVEY OF STUDENT ENGAGEMENT
 NATIONAL SURVEY OF STUDENT ENGAGEMENT 2010 Benchmark Comparisons Report OFFICE OF INSTITUTIONAL RESEARCH & PLANNING To focus discussions about the importance of student engagement and to guide institutional
BENCHMARK TREND COMPARISON REPORT:
 National Survey of Student Engagement (NSSE) BENCHMARK TREND COMPARISON REPORT: CARNEGIE PEER INSTITUTIONS, 2003-2011 PREPARED BY: ANGEL A. SANCHEZ, DIRECTOR KELLI PAYNE, ADMINISTRATIVE ANALYST/ SPECIALIST
2005 National Survey of Student Engagement: Freshman and Senior Students at. St. Cloud State University. Preliminary Report.
 National Survey of Student Engagement: Freshman and Senior Students at St. Cloud State University Preliminary Report (December, ) Institutional Studies and Planning National Survey of Student Engagement
National Survey of Student Engagement
 National Survey of Student Engagement Report to the Champlain Community Authors: Michelle Miller and Ellen Zeman, Provost s Office 12/1/2007 This report supplements the formal reports provided to Champlain
UK Institutional Research Brief: Results of the 2012 National Survey of Student Engagement: A Comparison with Carnegie Peer Institutions
 UK Institutional Research Brief: Results of the 2012 National Survey of Student Engagement: A Comparison with Carnegie Peer Institutions November 2012 The National Survey of Student Engagement (NSSE) has
NATIONAL SURVEY OF STUDENT ENGAGEMENT
 NATIONAL SURVEY OF STUDENT ENGAGEMENT (NSSE 2004 Results) Perspectives from USM First-Year and Senior Students Office of Academic Assessment University of Southern Maine Portland Campus 780-4383 Fall 2004
What Is The National Survey Of Student Engagement (NSSE)?
?") National Survey of Student Engagement (NSSE) 2000 Results for Montclair State University What Is The National Survey Of Student Engagement (NSSE)? US News and World Reports Best College Survey is due next
National Survey of Student Engagement (NSSE) 2000 Results for Montclair State University What Is The National Survey Of Student Engagement (NSSE)? US News and World Reports Best College Survey is due next
Office of Institutional Effectiveness 2012 NATIONAL SURVEY OF STUDENT ENGAGEMENT (NSSE) DIVERSITY ANALYSIS BY CLASS LEVEL AND GENDER VISION
 DIVERSITY ANALYSIS BY CLASS LEVEL AND GENDER VISION") Office of Institutional Effectiveness 2012 NATIONAL SURVEY OF STUDENT ENGAGEMENT (NSSE) DIVERSITY ANALYSIS BY CLASS LEVEL AND GENDER VISION We seek to become recognized for providing bright and curious
Office of Institutional Effectiveness 2012 NATIONAL SURVEY OF STUDENT ENGAGEMENT (NSSE) DIVERSITY ANALYSIS BY CLASS LEVEL AND GENDER VISION We seek to become recognized for providing bright and curious
National Survey of Student Engagement Spring University of Kansas. Executive Summary
 National Survey of Student Engagement Spring 2010 University of Kansas Executive Summary Overview One thousand six hundred and twenty-one (1,621) students from the University of Kansas completed the web-based
Assessment for Student Learning: Institutional-level Assessment Board of Trustees Meeting, August 23, 2016
 KPI SUMMARY REPORT Assessment for Student Learning: -level Assessment Board of Trustees Meeting, August 23, 2016 BACKGROUND Assessment for Student Learning is a key performance indicator aligned to the
National Survey of Student Engagement Executive Snapshot 2010
 National Survey of Student Engagement Executive Snapshot 2010 Dear Colleague: This document presents some key findings from your institution's participation in the 2010 National Survey of Student Engagement.
National Survey of Student Engagement (NSSE)
") 2008 NSSE National Survey of Student Engagement (NSSE) Understanding SRU Student Engagement Patterns of Evidence NSSE Presentation Overview What is student engagement? What do we already know about student
2008 NSSE National Survey of Student Engagement (NSSE) Understanding SRU Student Engagement Patterns of Evidence NSSE Presentation Overview What is student engagement? What do we already know about student
National Survey of Student Engagement at UND Highlights for Students. Sue Erickson Carmen Williams Office of Institutional Research April 19, 2012
 National Survey of Student Engagement at Highlights for Students Sue Erickson Carmen Williams Office of Institutional Research April 19, 2012 April 19, 2012 Table of Contents NSSE At... 1 NSSE Benchmarks...
NATIONAL SURVEY OF STUDENT ENGAGEMENT
 NATIONAL SURVEY OF STUDENT ENGAGEMENT (NSSE 2002) Perspectives from USM First-Year and Senior Students Office of Academic Assessment University of Southern Maine Portland Campus 780-4383 January 2003 NSSE:
NCEO Technical Report 27
 Home About Publications Special Topics Presentations State Policies Accommodations Bibliography Teleconferences Tools Related Sites Interpreting Trends in the Performance of Special Education Students
2009 National Survey of Student Engagement. Oklahoma State University
 Office of University Assessment and Testing Jeremy Penn, Ph.D., Director Chris Ray, Ph.D., Assistant Director uat@okstate.edu (405) 744-6687 Contributions to this report were made by Tom Gross and Lihua
learning collegiate assessment]
![learning collegiate assessment]](/thumbs/71/66063392.jpg "learning collegiate assessment]") [ collegiate learning assessment] INSTITUTIONAL REPORT 2005 2006 Kalamazoo College council for aid to education 215 lexington avenue floor 21 new york new york 10016-6023 p 212.217.0700 f 212.661.9766
[ collegiate learning assessment] INSTITUTIONAL REPORT 2005 2006 Kalamazoo College council for aid to education 215 lexington avenue floor 21 new york new york 10016-6023 p 212.217.0700 f 212.661.9766
Carolina Course Evaluation Item Bank Last Revised Fall 2009
 Carolina Course Evaluation Item Bank Last Revised Fall 2009 Items Appearing on the Standard Carolina Course Evaluation Instrument Core Items Instructor and Course Characteristics Results are intended for
Longitudinal Analysis of the Effectiveness of DCPS Teachers
 F I N A L R E P O R T Longitudinal Analysis of the Effectiveness of DCPS Teachers July 8, 2014 Elias Walsh Dallas Dotter Submitted to: DC Education Consortium for Research and Evaluation School of Education
National Survey of Student Engagement (NSSE)
") National Survey of Student Engagement (NSSE) (First-Year and Senior Students) Response Rates: Spring 2003 51% Spring 2007 79% Spring 2010 64% Spring 2014 60% This is a facsimile of the U.S. English version
National Survey of Student Engagement (NSSE) (First-Year and Senior Students) Response Rates: Spring 2003 51% Spring 2007 79% Spring 2010 64% Spring 2014 60% This is a facsimile of the U.S. English version
Educational Attainment
 A Demographic and Socio-Economic Profile of Allen County, Indiana based on the 2010 Census and the American Community Survey Educational Attainment A Review of Census Data Related to the Educational Attainment
Centre for Evaluation & Monitoring SOSCA. Feedback Information
 Centre for Evaluation & Monitoring SOSCA Feedback Information Contents Contents About SOSCA... 3 SOSCA Feedback... 3 1. Assessment Feedback... 4 2. Predictions and Chances Graph Software... 7 3. Value
The Condition of College & Career Readiness 2016
 The Condition of College and Career Readiness This report looks at the progress of the 16 ACT -tested graduating class relative to college and career readiness. This year s report shows that 64% of students
CONNECTICUT GUIDELINES FOR EDUCATOR EVALUATION. Connecticut State Department of Education
 CONNECTICUT GUIDELINES FOR EDUCATOR EVALUATION Connecticut State Department of Education October 2017 Preface Connecticut s educators are committed to ensuring that students develop the skills and acquire
National Collegiate Retention and. Persistence-to-Degree Rates
 National Collegiate Retention and Persistence-to-Degree Rates Since 1983, ACT has collected a comprehensive database of first-to-second-year retention rates and persistence-to-degree rates. These rates
National Survey of Student Engagement (NSSE) Temple University 2016 Results
 Temple University 2016 Results") Introduction The National Survey of Student Engagement (NSSE) is administered by hundreds of colleges and universities every year (560 in 2016), and is designed to measure the amount of time and effort
Introduction The National Survey of Student Engagement (NSSE) is administered by hundreds of colleges and universities every year (560 in 2016), and is designed to measure the amount of time and effort
TULSA COMMUNITY COLLEGE
 TULSA COMMUNITY COLLEGE ANNUAL STUDENT ASSESSMENT REPORT 2001 2002 SUBMITTED TO THE OKLAHOMA STATE REGENTS FOR HIGHER EDUCATION NOVEMBER 2002 TCC Contact: Dr. John Kontogianes Executive Vice President
OFFICE OF ENROLLMENT MANAGEMENT. Annual Report
 2014-2015 OFFICE OF ENROLLMENT MANAGEMENT Annual Report Table of Contents 2014 2015 MESSAGE FROM THE VICE PROVOST A YEAR OF RECORDS 3 Undergraduate Enrollment 6 First-Year Students MOVING FORWARD THROUGH
Access Center Assessment Report
 Access Center Assessment Report The purpose of this report is to provide a description of the demographics as well as higher education access and success of Access Center students at CSU. College access
10/6/2017 UNDERGRADUATE SUCCESS SCHOLARS PROGRAM. Founded in 1969 as a graduate institution.
 UNDERGRADUATE SUCCESS SCHOLARS PROGRAM THE UNIVERSITY OF TEXAS AT DALLAS Founded in 1969 as a graduate institution. Began admitting upperclassmen in 1975 and began admitting underclassmen in 1990. 1 A
National Survey of Student Engagement The College Student Report
 The College Student Report This is a facsimile of the NSSE survey (available at nsse.iub.edu/links/surveys). The survey itself is administered online. 1. During the current school year, about how often
ACADEMIC ALIGNMENT. Ongoing - Revised
 ACADEMIC ALIGNMENT Sandra Andrews December 2012 Erin Busscher, John Dersch, William Faber, Lorraine Fortuna, Laurie Foster, Wilfred Gooch, Fiona Hert, Diane Patrick, Paula Sullivan and Vince James Part
Evaluation of a College Freshman Diversity Research Program
 Evaluation of a College Freshman Diversity Research Program Sarah Garner University of Washington, Seattle, Washington 98195 Michael J. Tremmel University of Washington, Seattle, Washington 98195 Sarah
Testimony to the U.S. Senate Committee on Health, Education, Labor and Pensions. John White, Louisiana State Superintendent of Education
 Testimony to the U.S. Senate Committee on Health, Education, Labor and Pensions John White, Louisiana State Superintendent of Education October 3, 2017 Chairman Alexander, Senator Murray, members of the
George Mason University Graduate School of Education Education Leadership Program. Course Syllabus Spring 2006
 George Mason University Graduate School of Education Education Leadership Program Course Syllabus Spring 2006 COURSE NUMBER AND TITLE: EDLE 610: Leading Schools and Communities (3 credits) INSTRUCTOR:
The University of North Carolina Strategic Plan Online Survey and Public Forums Executive Summary
 The University of North Carolina Strategic Plan Online Survey and Public Forums Executive Summary The University of North Carolina General Administration January 5, 2017 Introduction The University of
Institution-Set Standards: CTE Job Placement Resources. February 17, 2016 Danielle Pearson, Institutional Research
 Institution-Set Standards: CTE Job Placement Resources February 17, 2016 Danielle Pearson, Institutional Research Standard 1.B.3 states: The institution establishes institution-set standards for student
STUDENT LEARNING ASSESSMENT REPORT
 STUDENT LEARNING ASSESSMENT REPORT PROGRAM: Sociology SUBMITTED BY: Janine DeWitt DATE: August 2016 BRIEFLY DESCRIBE WHERE AND HOW ARE DATA AND DOCUMENTS USED TO GENERATE THIS REPORT BEING STORED: The
Engineers and Engineering Brand Monitor 2015
 Engineers and Engineering Brand Monitor 2015 Key Findings Prepared for Engineering UK By IFF Research 7 September 2015 We gratefully acknowledge the support of Pearson in delivering this study Contact
Tentative School Practicum/Internship Guide Subject to Change
 04/2017 1 Tentative School Practicum/Internship Guide Subject to Change Practicum and Internship Packet For Students, Interns, and Site Supervisors COUN 6290 School Counseling Practicum And COUN 6291 School
Miami-Dade County Public Schools
 ENGLISH LANGUAGE LEARNERS AND THEIR ACADEMIC PROGRESS: 2010-2011 Author: Aleksandr Shneyderman, Ed.D. January 2012 Research Services Office of Assessment, Research, and Data Analysis 1450 NE Second Avenue,
Multiple Measures Assessment Project - FAQs
 Multiple Measures Assessment Project - FAQs (This is a working document which will be expanded as additional questions arise.) Common Assessment Initiative How is MMAP research related to the Common Assessment
MEASURING GENDER EQUALITY IN EDUCATION: LESSONS FROM 43 COUNTRIES
 GIRL Center Research Brief No. 2 October 2017 MEASURING GENDER EQUALITY IN EDUCATION: LESSONS FROM 43 COUNTRIES STEPHANIE PSAKI, KATHARINE MCCARTHY, AND BARBARA S. MENSCH The Girl Innovation, Research,
Student Engagement and Cultures of Self-Discovery
 Student Engagement and Cultures of Self-Discovery Dr. Debra Dawson The University of Western Ontario London, Ontario Canada Outline What is student engagement? NSSE benchmarks What were some of the key
University of Toronto Mississauga Degree Level Expectations. Preamble
 University of Toronto Mississauga Degree Level Expectations Preamble In December, 2005, the Council of Ontario Universities issued a set of degree level expectations (drafted by the Ontario Council of
Welcome to the session on ACCUPLACER Policy Development. This session will touch upon common policy decisions an institution may encounter during the
 Welcome to the session on ACCUPLACER Policy Development. This session will touch upon common policy decisions an institution may encounter during the development or reevaluation of a placement program.
Mathematics Program Assessment Plan
 Mathematics Program Assessment Plan Introduction This assessment plan is tentative and will continue to be refined as needed to best fit the requirements of the Board of Regent s and UAS Program Review
Delaware Performance Appraisal System Building greater skills and knowledge for educators
 Delaware Performance Appraisal System Building greater skills and knowledge for educators DPAS-II Guide for Administrators (Assistant Principals) Guide for Evaluating Assistant Principals Revised August
University-Based Induction in Low-Performing Schools: Outcomes for North Carolina New Teacher Support Program Participants in
 University-Based Induction in Low-Performing Schools: Outcomes for North Carolina New Teacher Support Program Participants in 2014-15 In this policy brief we assess levels of program participation and
Biological Sciences, BS and BA
 Student Learning Outcomes Assessment Summary Biological Sciences, BS and BA College of Natural Science and Mathematics AY 2012/2013 and 2013/2014 1. Assessment information collected Submitted by: Diane
TIMSS ADVANCED 2015 USER GUIDE FOR THE INTERNATIONAL DATABASE. Pierre Foy
 TIMSS ADVANCED 2015 USER GUIDE FOR THE INTERNATIONAL DATABASE Pierre Foy TIMSS Advanced 2015 orks User Guide for the International Database Pierre Foy Contributors: Victoria A.S. Centurino, Kerry E. Cotter,
Volunteer State Community College Strategic Plan,
 Volunteer State Community College Strategic Plan, 2005-2010 Mission: Volunteer State Community College is a public, comprehensive community college offering associate degrees, certificates, continuing
MGMT 3280: Strategic Management
 MGMT 3280: Strategic Management Professor Nicholas J. Bailey Office: Friday 290B Sec 02: TR 9:30-10:45am Denny 120 Tel: (801) 628-8648 Sec 03: TR 11:00am-12:15pm Storrs 155 Email: nicholas.bailey@grad.moore.sc.edu
Getting Ready for the Work Readiness Credential: A Guide for Trainers and Instructors of Jobseekers
 Getting Ready for the Work Readiness Credential: A Guide for Trainers and Instructors of Jobseekers October 2005 Getting Ready for the Work Readiness Credential: A Guide for Trainers and Instructors of
TULSA COMMUNITY COLLEGE
 TULSA COMMUNITY COLLEGE ANNUAL STUDENT ASSESSMENT REPORT 2002 2003 SUBMITTED TO THE OKLAHOMA STATE REGENTS FOR HIGHER EDUCATION NOVEMBER 2003 TCC Contact: Dr. John Kontogianes Executive Vice President
Principal vacancies and appointments
 Principal vacancies and appointments 2009 10 Sally Robertson New Zealand Council for Educational Research NEW ZEALAND COUNCIL FOR EDUCATIONAL RESEARCH TE RŪNANGA O AOTEAROA MŌ TE RANGAHAU I TE MĀTAURANGA
Race, Class, and the Selective College Experience
 Race, Class, and the Selective College Experience Thomas J. Espenshade Alexandria Walton Radford Chang Young Chung Office of Population Research Princeton University December 15, 2009 1 Overview of NSCE
State Parental Involvement Plan
 A Toolkit for Title I Parental Involvement Section 3 Tools Page 41 Tool 3.1: State Parental Involvement Plan Description This tool serves as an example of one SEA s plan for supporting LEAs and schools
When Student Confidence Clicks
 When Student Confidence Clicks Academic Self-Efficacy and Learning in HE Fabio R. Aricò 1 ACKNOWLEDGEMENTS UEA-HEFCE Widening Participation Teaching Fellowship HEA Teaching Development Grant Scheme 2 ETHICAL
IBCP Language Portfolio Core Requirement for the International Baccalaureate Career-Related Programme
 IBCP Language Portfolio Core Requirement for the International Baccalaureate Career-Related Programme Name Student ID Year of Graduation Start Date Completion Due Date May 1, 20 (or before) Target Language
NDPC-SD Data Probes Worksheet
 NDPC-SD Data Probes Worksheet This worksheet from the National Dropout Prevention Center for Students with Disabilities (NDPC- SD) is an optional tool to help schools organize multiple years of student
Developing Highly Effective Industry Partnerships: Co-op to Capstone Courses
 Developing Highly Effective Industry Partnerships: Co-op to Capstone Courses Chris Plouff Assistant Director Assistant Professor & Sebastian Chair School of Engineering Today s Objectives What does a highly
Karla Brooks Baehr, Ed.D. Senior Advisor and Consultant The District Management Council
 Karla Brooks Baehr, Ed.D. Senior Advisor and Consultant The District Management Council This paper aims to inform the debate about how best to incorporate student learning into teacher evaluation systems
Growth of empowerment in career science teachers: Implications for professional development
 Growth of empowerment in career science teachers: Implications for professional development Presented at the International Conference of the Association for Science Teacher Education (ASTE) in Hartford,
The number of involuntary part-time workers,
 University of New Hampshire Carsey School of Public Policy CARSEY RESEARCH National Issue Brief #116 Spring 2017 Involuntary Part-Time Employment A Slow and Uneven Economic Recovery Rebecca Glauber The
Practices Worthy of Attention Step Up to High School Chicago Public Schools Chicago, Illinois
 Step Up to High School Chicago Public Schools Chicago, Illinois Summary of the Practice. Step Up to High School is a four-week transitional summer program for incoming ninth-graders in Chicago Public Schools.
Table of Contents. Internship Requirements 3 4. Internship Checklist 5. Description of Proposed Internship Request Form 6. Student Agreement Form 7
 Table of Contents Section Page Internship Requirements 3 4 Internship Checklist 5 Description of Proposed Internship Request Form 6 Student Agreement Form 7 Consent to Release Records Form 8 Internship
Early Warning System Implementation Guide
 Linking Research and Resources for Better High Schools betterhighschools.org September 2010 Early Warning System Implementation Guide For use with the National High School Center s Early Warning System
Math Pathways Task Force Recommendations February Background
 Math Pathways Task Force Recommendations February 2017 Background In October 2011, Oklahoma joined Complete College America (CCA) to increase the number of degrees and certificates earned in Oklahoma.
Graduation Initiative 2025 Goals San Jose State
 Graduation Initiative 2025 Goals San Jose State Metric 2025 Goal Most Recent Rate Freshman 6-Year Graduation 71% 57% Freshman 4-Year Graduation 35% 10% Transfer 2-Year Graduation 36% 24% Transfer 4-Year
Evaluation of Teach For America:
 EA15-536-2 Evaluation of Teach For America: 2014-2015 Department of Evaluation and Assessment Mike Miles Superintendent of Schools This page is intentionally left blank. ii Evaluation of Teach For America:
CERTIFICATE OF HIGHER EDUCATION IN CONTINUING EDUCATION. Relevant QAA subject benchmarking group:
 CERTIFICATE OF HIGHER EDUCATION IN CONTINUING EDUCATION Awarding Institution: The University of Reading Teaching Institution: The University of Reading Relevant QAA subject benchmarking group: Faculty
Value of Athletics in Higher Education March Prepared by Edward J. Ray, President Oregon State University
 Materials linked from the 5/12/09 OSU Faculty Senate agenda 1. Who Participates Value of Athletics in Higher Education March 2009 Prepared by Edward J. Ray, President Oregon State University Today, more
STUDENT ASSESSMENT AND EVALUATION POLICY
 STUDENT ASSESSMENT AND EVALUATION POLICY Contents: 1.0 GENERAL PRINCIPLES 2.0 FRAMEWORK FOR ASSESSMENT AND EVALUATION 3.0 IMPACT ON PARTNERS IN EDUCATION 4.0 FAIR ASSESSMENT AND EVALUATION PRACTICES 5.0
Classroom Assessment Techniques (CATs; Angelo & Cross, 1993)
") Classroom Assessment Techniques (CATs; Angelo & Cross, 1993) From: http://warrington.ufl.edu/itsp/docs/instructor/assessmenttechniques.pdf Assessing Prior Knowledge, Recall, and Understanding 1. Background
Classroom Assessment Techniques (CATs; Angelo & Cross, 1993) From: http://warrington.ufl.edu/itsp/docs/instructor/assessmenttechniques.pdf Assessing Prior Knowledge, Recall, and Understanding 1. Background
Executive Summary. Osan High School
 Pacific: Korea Mr. Morgan Nugent, Principal Unit 2037 APO, AP 96278-2039 Document Generated On December 9, 2014 TABLE OF CONTENTS Introduction 1 Description of the School 2 School's Purpose 3 Notable Achievements
Davidson College Library Strategic Plan
 Davidson College Library Strategic Plan 2016-2020 1 Introduction The Davidson College Library s Statement of Purpose (Appendix A) identifies three broad categories by which the library - the staff, the
EDIT 576 (2 credits) Mobile Learning and Applications Fall Semester 2015 August 31 October 18, 2015 Fully Online Course
 Mobile Learning and Applications Fall Semester 2015 August 31 October 18, 2015 Fully Online Course") GEORGE MASON UNIVERSITY COLLEGE OF EDUCATION AND HUMAN DEVELOPMENT INSTRUCTIONAL DESIGN AND TECHNOLOGY PROGRAM EDIT 576 (2 credits) Mobile Learning and Applications Fall Semester 2015 August 31 October
GEORGE MASON UNIVERSITY COLLEGE OF EDUCATION AND HUMAN DEVELOPMENT INSTRUCTIONAL DESIGN AND TECHNOLOGY PROGRAM EDIT 576 (2 credits) Mobile Learning and Applications Fall Semester 2015 August 31 October
Delaware Performance Appraisal System Building greater skills and knowledge for educators
 Delaware Performance Appraisal System Building greater skills and knowledge for educators DPAS-II Guide (Revised) for Teachers Updated August 2017 Table of Contents I. Introduction to DPAS II Purpose of
Summary: Impact Statement
 Summary: Impact Statement 2015-16 The following table summarises the attainment and progress gaps over the past two years by the new national performance measures. National data is not yet available and
Running Head GAPSS PART A 1
 Running Head GAPSS PART A 1 Current Reality and GAPSS Assignment Carole Bevis PL & Technology Innovation (ITEC 7460) Kennesaw State University Ed.S. Instructional Technology, Spring 2014 GAPSS PART A 2
Graduate Division Annual Report Key Findings
 Graduate Division 2010 2011 Annual Report Key Findings Trends in Admissions and Enrollment 1 Size, selectivity, yield UCLA s graduate programs are increasingly attractive and selective. Between Fall 2001
Physics/Astronomy/Physical Science. Program Review
 Physics/Astronomy/Physical Science Program Review June 2017 Modesto Junior College Instructional Program Review June 2017 Contents Executive Summary... 2 Program Overview... 3 Program Overview... 3 Response
Bellehaven Elementary
 Overall istrict: Albuquerque Public Schools Grade Range: KN-05 Code: 1229 School Grade Report Card 2013 Current Standing How did students perform in the most recent school year? are tested on how well
Unit 3. Design Activity. Overview. Purpose. Profile
 Unit 3 Design Activity Overview Purpose The purpose of the Design Activity unit is to provide students with experience designing a communications product. Students will develop capability with the design
KDE Comprehensive School. Improvement Plan. Harlan High School
 KDE Comprehensive School Improvement Plan Harlan Independent Britt Lawson, Principal 420 E Central St Harlan, KY 40831 Document Generated On December 22, 2014 TABLE OF CONTENTS Introduction 1 Executive
EDIT 576 DL1 (2 credits) Mobile Learning and Applications Fall Semester 2014 August 25 October 12, 2014 Fully Online Course
 Mobile Learning and Applications Fall Semester 2014 August 25 October 12, 2014 Fully Online Course") GEORGE MASON UNIVERSITY COLLEGE OF EDUCATION AND HUMAN DEVELOPMENT GRADUATE SCHOOL OF EDUCATION INSTRUCTIONAL DESIGN AND TECHNOLOGY PROGRAM EDIT 576 DL1 (2 credits) Mobile Learning and Applications Fall
GEORGE MASON UNIVERSITY COLLEGE OF EDUCATION AND HUMAN DEVELOPMENT GRADUATE SCHOOL OF EDUCATION INSTRUCTIONAL DESIGN AND TECHNOLOGY PROGRAM EDIT 576 DL1 (2 credits) Mobile Learning and Applications Fall
1.0 INTRODUCTION. The purpose of the Florida school district performance review is to identify ways that a designated school district can:
 1.0 INTRODUCTION 1.1 Overview Section 11.515, Florida Statutes, was created by the 1996 Florida Legislature for the purpose of conducting performance reviews of school districts in Florida. The statute
PCG Special Education Brief
 PCG Special Education Brief Understanding the Endrew F. v. Douglas County School District Supreme Court Decision By Sue Gamm, Esq. and Will Gordillo March 27, 2017 Background Information On January 11,
Basic Skills Initiative Project Proposal Date Submitted: March 14, Budget Control Number: (if project is continuing)
") Basic Skills Initiative Project Proposal 2016-2017 Date Submitted: March 14, 2016 Check One: New Proposal: Continuing Project: X Budget Control Number: (if project is continuing) Control # 87-413 - EOPS
Basic Skills Initiative Project Proposal 2016-2017 Date Submitted: March 14, 2016 Check One: New Proposal: Continuing Project: X Budget Control Number: (if project is continuing) Control # 87-413 - EOPS
Approval Authority: Approval Date: September Support for Children and Young People
 Document Title: Pupil Premium Policy Purpose: To set out the principles of the Pupil Premium Award, how it is received and how it has been spent in the last year and to evaluate the impact Summary: The
Kelso School District and Kelso Education Association Teacher Evaluation Process (TPEP)
") Kelso School District and Kelso Education Association 2015-2017 Teacher Evaluation Process (TPEP) Kelso School District and Kelso Education Association 2015-2017 Teacher Evaluation Process (TPEP) TABLE
Kelso School District and Kelso Education Association 2015-2017 Teacher Evaluation Process (TPEP) Kelso School District and Kelso Education Association 2015-2017 Teacher Evaluation Process (TPEP) TABLE
WORK OF LEADERS GROUP REPORT
 WORK OF LEADERS GROUP REPORT ASSESSMENT TO ACTION. Sample Report (9 People) Thursday, February 0, 016 This report is provided by: Your Company 13 Main Street Smithtown, MN 531 www.yourcompany.com INTRODUCTION
Interpreting ACER Test Results
 Interpreting ACER Test Results This document briefly explains the different reports provided by the online ACER Progressive Achievement Tests (PAT). More detailed information can be found in the relevant
Wildlife, Fisheries, & Conservation Biology
 Department of Wildlife, Fisheries, & Conservation Biology The Department of Wildlife, Fisheries, & Conservation Biology in the College of Natural Sciences, Forestry and Agriculture offers graduate study
Descriptive Summary of Beginning Postsecondary Students Two Years After Entry
 NATIONAL CENTER FOR EDUCATION STATISTICS Statistical Analysis Report June 994 Descriptive Summary of 989 90 Beginning Postsecondary Students Two Years After Entry Contractor Report Robert Fitzgerald Lutz
Middle School Curriculum Guide
 Middle School Curriculum Guide 2017-2018 Our Mission Westside School prepares students for the world by challenging them to achieve academic success and by connecting their human spirit and imagination
Procedures for Academic Program Review. Office of Institutional Effectiveness, Academic Planning and Review
 Procedures for Academic Program Review Office of Institutional Effectiveness, Academic Planning and Review Last Revision: August 2013 1 Table of Contents Background and BOG Requirements... 2 Rationale