Geospatial Visual Analytics Tutorial. Gennady Andrienko & Natalia Andrienko
|
|
|
- Sheena Sherman
- 6 years ago
- Views:
Transcription

1 Geospatial Visual Analytics Tutorial Gennady Andrienko & Natalia Andrienko
2 Outline Visual Analytics Introduction - Definition of Visual Analytics - Roots - What is new? Where are we now? - Live demo of current visualisation techniques - Example of visual analytics: evacuation scheduling - Example of visual analytics: analysis of movement Where should we go? - The visual analytics example: what is lacking? - Visual analytics for spatial decision support Conclusion 2
3 Outline Visual Analytics Introduction - Definition of Visual Analytics - Roots - What is new? Where are we now? - Live demo of current visualisation techniques - Example of visual analytics: evacuation scheduling - Example of visual analytics: analysis of movement Where should we go? - The visual analytics example: what is lacking? - Visual analytics for spatial decision support Conclusion 3


4 Definition of Visual Analytics Visual analytics. Introduction Visual Analytics is the science of analytical reasoning facilitated by interactive visual interfaces. People use visual analytics tools and techniques to Synthesize information and derive insight from massive, dynamic, ambiguous, and often conflicting data Detect the expected and discover the unexpected Provide timely, defensible, and understandable assessments Communicate assessment effectively for action The book (IEEE Computer Society 2005) is available at in PDF form 4


5 Emergence of Visual Analytics Visual analytics. Introduction Initially driven by the USA Homeland Security but now has a much broader scope and impact 5


6 Conferences, symposia, workshops University courses and seminars Research programs 6
7 Grand Challenges Visual analytics. Introduction The need to analyse and make sense of overwhelming amounts of complex, disparate, conflicting, and dynamic data and information - Requires human judgement - People must collaborate and share information and knowledge The scalability challenge - Information scalability: the capability to extract relevant information from massive data streams - Visual scalability: the capability to effectively display massive data sets - Display scalability: effective use of everything from wall-sized to phone-sized displays - Human scalability: scale from single users to collaborative environments - Software scalability: the capability of a software system to interactively manipulate large data sets 7
8 Focus of Visual Analytics Visual analytics. Introduction The science of analytical reasoning but what kind of reasoning? Given: massive, dynamic, ambiguous, and often conflicting data Required: - Synthesise information and derive insight - Detect the expected and discover the unexpected - Provide timely, defensible, and understandable assessments Analytical reasoning = data information knowledge explanation (interpreted data) (for myself) (for others) Focus: interactive visual interfaces that enable this process 8
9 Visual analytics. Introduction Roots of Visual Analytics Visualisation - information visualisation - scientific visualisation - geographic visualisation use of graphics and images for decoration for illustration for communication for exploration, discovery, and ideation Current standard: highly interactive interfaces Recent trends: Combine visualisation with data mining Incorporate database and data warehousing technologies in order to handle very large and complex data 9
10 Visual analytics. Introduction Visualisation vs. Visual Analytics Visualisation: Visual analytics: Interactive visual interfaces Interactive visual interfaces o to stimulate insight into data: data information knowledge detect the expected and discover the unexpected in massive, dynamic, ambiguous, and often conflicting data Reasoning and synthesis of information and knowledge are implicit o to facilitate analytical reasoning: data information knowledge explanation detect the expected and discover the unexpected in massive, dynamic, ambiguous, and often conflicting data - provide understandable assessments - communicate assessments effectively Information, knowledge, and reasoning must be made explicit 10
11 A Field for Multidisciplinary Research Visual analytics. Introduction Visual Analytics Analytical reasoning - How to maximise human capacity to perceive, understand, Cognitive science and reason about complex and dynamic data and situations? Knowledge Management Artificial intelligence (?) Visual representations and interaction techniques - How to augment cognitive reasoning with perceptual reasoning through visual representations and interaction? Data representations and transformations Data Mining: numeric data, texts, images, video - How to transform data into a representation that is Database Science appropriate to the analytical task and effectively conveys the important content? GI Science Production, presentation, and dissemination - How to convey analytical results in meaningful ways to various audiences? Visualisation Human-Computer Interaction Knowledge Management Knowledge Visualisation Communication Sciences Artificial Intelligence (?) 11
12 Visual analytics. Introduction Artificial Intelligence and Visual Analytics Artificial Intelligence Typology of knowledge - Ontologies: kinds of entities and how they are related - Actions, situations, events - Procedural knowledge Knowledge representation Knowledge engineering Reasoning Modelling of uncertainty and confidences Explanation Learning Visual Analytics Must build upon an understanding of - the reasoning process - analytical artefacts (e.g. patterns) Requires knowledge capture (tacit knowledge explicit knowledge) - Pre-existing knowledge involved in analysis and reasoning - New knowledge resulting from analysis Requires knowledge representation Requires modelling of uncertainty and confidences Requires building of explanations 12
13 Outline Visual Analytics Introduction - Definition of Visual Analytics - Roots - What is new? Where are we now? - Live demo of current visualisation techniques - Example of visual analytics: evacuation scheduling - Example of visual analytics: analysis of movement Where should we go? - The visual analytics example: what is lacking? - Visual analytics for spatial decision support Conclusion 13
 Interactive")


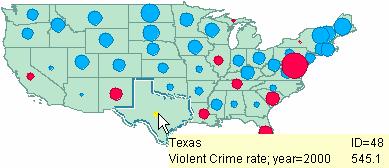
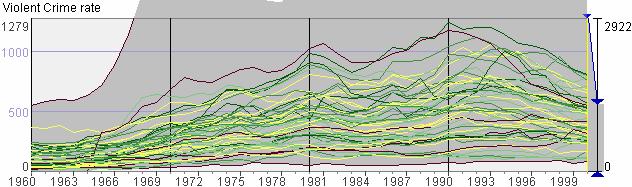
14 Current visualisation techniques 1) Interactive and dynamic data displays Visual Analytics: Where are we now? Visual comparison Access to data 14 Time controls and animation

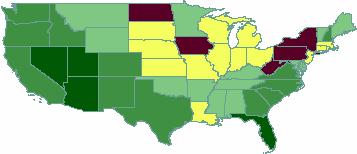
15 Current visualisation techniques 2) Coordinated complementary views Visual Analytics: Where are we now? 15
 Interactive")

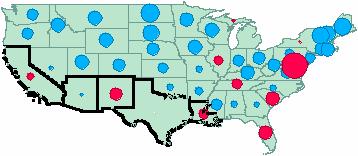
16 Current visualisation techniques 3) Interactive dynamic querying Visual Analytics: Where are we now? 16


17 Current visualisation techniques 4) Interactive data transformations Visual Analytics: Where are we now? 17

")

18 Visual Analytics: Where are we now? Current visualisation techniques 5) Integration of visual and computational analysis methods 18

19 Details: Natalia and Gennady Andrienko Exploratory Analysis of Spatial and Temporal Data A Systematic Approach Approx. 715 p. 282 illus., 37 in colour., Hardcover, 139,05 Springer-Verlag, December 2005, ISBN sample chapter, online demos and tutorials 19


20 Visual Analytics: Where are we now? Example of visual analytics: evacuation scheduling 20
21 Outline Introduction Problem analysis and task-oriented design Example work scenario User-controlled schedule modification Conclusion 21
22 Emergency evacuation problem Time-critical decision problems Require high efficiency Involve much data Complex Problems involving geographical space and time Ill-defined Depend on tacit knowledge and criteria No adequate computer representation for geographic space Computational methods Synergy required! Human expert Background knowledge Understanding of geographical space Experience Intuition 22

23 Approach produces Draft solution Background knowledge Understanding of geographical space Experience Intuition assesses Input: data, goals, criteria, guides produces Vehicle Vehicle home base Source Source name Destination Destination name Start End Item Item class name Operation ID ID ID class Number ID of items Pick Up 41 Children clinics 75 Children clinics 60 Braun and Co 00:00:00 00:00:04 0 EMPTY 1 Deliver 41 Children clinics 75 Children clinics 60 Braun and Co 00:00:00 00:00:04 0 EMPTY 1 Pick Up 41 Children clinics 60 Braun and Co 68 St. John Hospital 00:00:04 00:00:30 21 invalids who cannot seat 2 Deliver 41 Children clinics 60 Braun and Co 68 St. John Hospital 00:00:04 00:00:30 21 invalids who cannot seat 2 Pick Up 41 Children clinics 68 St. John Hospital 22 St. Peter Hospital 00:00:51 00:00:54 0 EMPTY 1 Deliver 41 Children clinics 68 St. John Hospital 22 St. Peter Hospital 00:00:51 00:00:54 0 EMPTY 1 Pick Up 41 Children clinics 22 St. Peter Hospital 40 Spa healing house 00:00:54 00:01:22 21 invalids who cannot seat 2 Deliver 41 Children clinics 22 St. Peter Hospital 40 Spa healing house 00:00:54 00:01:22 21 invalids who cannot seat 2 Pick Up 102 City coach park 109 City coach park 60 Braun and Co 00:00:00 00:00:05 0 EMPTY 1 Deliver 102 City coach park 109 City coach park 60 Braun? and Co 00:00:00 00:00:05 0 EMPTY 1 Pick Up 102 City coach park 60 Braun and Co 50 Exhibition hall 00:00:05 00:00:18 10 general people or children 50 Deliver 102 City coach park 60 Braun and Co 50 Exhibition hall 00:00:05 00:00:18 10 general people or children 50 Pick Up 102 City coach park 50 Exhibition hall 32 Kindergarten 00:00:28 00:00:34 0 EMPTY 1 Deliver 102 City coach park 50 Exhibition hall 32 Kindergarten 00:00:28 00:00:34 0 EMPTY 1 Pick Up 102 City coach park 32 Kindergarten 41 Descartes School 00:00:34 00:00:51 10 general people or children 50 Deliver 102 City coach park 32 Kindergarten 41 Descartes School 00:00:34 00:00:51 10 general people or children 50 Pick Up 48 City coach park 109 City coach park 60 Braun and Co 00:00:00 00:00:05 0 EMPTY 1 Deliver 48 City coach park 109 City coach park 60 Braun and Co 00:00:00 00:00:05 0 EMPTY 1 Pick Up 48 City coach park 60 Braun and Co 49 Leonardo School 00:00:05 00:00:18 10 general people or children 50 Deliver 48 City coach park 60 Braun and Co 49 Leonardo School 00:00:05 00:00:18 10 general people or children 50 Pick Up 48 City coach park 49 Leonardo School 5 Frings Gymnasium 00:00:28 00:00:33 0 EMPTY 1 Deliver 48 City coach park 49 Leonardo School 5 Frings Gymnasium 00:00:28 00:00:33 0 EMPTY 1 Pick Up 48 City coach park 5 Frings Gymnasium 41 Descartes School 00:00:33 00:00:48 10 general people or children 50 Deliver 48 City coach park 5 Frings Gymnasium 41 Descartes School 00:00:33 00:00:48 10 general people or children 50 Pick Up 78 City Gennady coach park & 109 Natalia City coach park Andrienko 21 Kindergarten 00:00:00 00:00:05 0 EMPTY 1 Deliver 78 City coach park 109 City coach park 21 Kindergarten 00:00:00 00:00:05 0 EMPTY 1 Pick Up 78 City coach park 21 Kindergarten 50 Exhibition hall 00:00:05 00:00:19 10 general people or children 20 Deliver 78 City coach park 21 Kindergarten 50 Exhibition hall 00:00:05 00:00:19 10 general people or children 20 Pick Up 78 City coach park 50 Exhibition hall 18 Albert College 00:00:29 00:00:35 0 EMPTY 1 Deliver 78 City coach park 50 Exhibition hall 18 Albert College 00:00:29 00:00:35 0 EMPTY 1 Pick Up 78 City coach park 18 Albert College 42 Riverside hall 00:00:35 00:00:52 10 general people or children 50 Deliver 78 City coach park 18 Albert College 42 Riverside hall 00:00:35 00:00:52 10 general people or children 50 Pick Up 117 Bus travel company 110 Bus travel company 60 Braun and Co 00:00:00 00:00:06 0 EMPTY 1 Deliver 117 Bus travel company 110 Bus travel company 60 Braun and Co 00:00:00 00:00:06 0 EMPTY 1 Pick Up 117 Bus travel company 60 Braun and Co 42 Riverside hall 00:00:06 00:00:23 10 general people or children 100 Deliver 117 Bus travel company 60 Braun and Co 42 Riverside hall 00:00:06 00:00:23 10 general people or children 100 Improved solution assesses Accepted solution Requires visualisation! 23
24 Outline Introduction Problem analysis and task-oriented design Example work scenario User-controlled schedule modification Conclusion 24
25 Emergency evacuation problem Several categories of people - General public; critically sick or injured people; disabled people who can/cannot sit, prisoners, Multiple source locations - Number of people of different categories - Time constraints (e.g. latest allowed departure time) Multiple destinations - Suitability and capacity for different categories Different types of vehicles - E.g. buses, ambulance cars, police vans, - Suitability and capacity for different people categories Task: - divide people into groups fitting in available types of vehicles - assign the groups to suitable destinations - find appropriate vehicles to deliver them - set the times for the trips of the vehicles 25
26 Scheduling Algorithm For transportation problems, heuristic methods work better than deterministic approaches We apply Breeder Genetic Algorithm (devised by Bartling & Muehlenbein) Extended functionality as compared to typical tools for business applications: - Divides the total number of people in a location into groups fitting in available vehicles - Chooses an appropriate destination for each group Any-time method: - valid solution exists at any moment - while the quality is progressively improved as the algorithm continues its work 26
27 Algorithm output.g. 14 source locations 4692 people 6 categories 105 vehicles 7 vehicle types 25 destinations No time to inspect all the orders! Cannot be summarized in a few indicators! 400 transportation orders OrderId SourceName DestName ItemClass Number VhclId VhclType VhclHBName StartTime EndTime 12-4 St. John Hospital St. Peter Hospital LEER University clinics 00:32:40 00:40: Braun and Co Exhibition hall general people or children City coach park 00:11:00 00:20: Albert College Descartes School general people or children City coach park 00:31:00 00:50: Braun and Co Rehabilitation Centre critically sick or injured people Children Clinics 00:05:00 00:11: City coach park ABC mall LEER City coach park 00:00:00 00:11: Beethoven Gymnasiu Galileo College general people or children City coach park 00:48:20 01:11: City coach park ABC mall LEER City coach park 00:00:00 00:11: St. Peter Hospital University clinics invalids who cannot seat University clinics 00:08:00 00:16: Kindergarten Plato Gympasium general people or children City coach park 00:33:20 00:50: Albert College City hall general people or children City coach park 00:37:00 00:43: City coach park Real school LEER City coach park 00:00:00 00:13: ABC mall Leonardo School general people or children City coach park 00:12:00 00:21: City hall Albert College LEER City coach park 00:44:40 00:50: Elder home Children Clinics sabled people using wheelchairs Bus travel company 00:27:40 00:36: Bus travel company AAlbert College LEER Bus travel company 00:00:00 00:11: Braun and Co City hall general people or children City coach park 00:11:00 00:23: Children Clinics Braun and Co LEER Children Clinics 00:00:00 00:05: Braun and Co Helmholtz Gymnasium general people or children City coach park 00:11:00 00:24: Beethoven Gymnasiu St. Teresa's school general people or children City coach park 00:28:40 00:44: St.Joseph's basic sch Helmholtz Gymnasium general people or children City coach park 00:34:20 00:44: Elder home Children clinics invalids who cannot seat St. John Hospital 00:26:20 00:33: Jailhouse Prison LEER Jailhouse 00:00:00 00:46: St. Peter Hospital Braun and Co LEER St. Peter Hospital 00:00:00 00:08: Braun and Co Children clinics critically sick or injured people University clinics 00:16:00 00:22:2 6-2 Braun and Co Children clinics invalids who cannot seat St. Peter Hospital 00:17:20 00:23: Exhibition hall Albert College LEER City coach park 00:22:00 00:37: City hall Albert College LEER City coach park 00:25:20 00:31: Braun and Co City hall general people or children City coach park 00:13:20 00:25: City coach park Braun and Co LEER City coach park 00:00:00 00:11: Helmholtz GymnasiumSt.Joseph's basic scho LEER City coach park 00:45:40 00:53: City hall Albert College LEER City coach park 00:25:00 00:31: University clinics St. Peter Hospital LEER Children Clinics 00:47:00 00:55: City coach park Braun and Co LEER City coach park 00:00:00 00:11: Albert College Heighbourhood House general people or children City coach park 00:56:00 01:08:2 27
28 Schedule evaluation Questions to be answered: Does the plan achieve the goal? Goal: all people are timely delivered to appropriate destination places by appropriate vehicles Is it feasible? Is it rational? 28
29 Possible problems Undelivered people Late deliveries w.r.t. time constraints Use of improper vehicles Delivery to improper places Overuse of resources Multiple vehicles in same place Can emerge due to lack or deficiency of resources Require human to find appropriate corrective measures (additional vehicles, additional or intermediate destinations, ) Excluded by the algorithm, but correctness should be demonstrated May be a problem or an advantage; requires human s local knowledge Idle vehicles Choice of distant destinations Lower priority; may be examined when time permits Low use of vehicle capacities Effectiveness problems (i.e. goal not attained) Feasibility problems Rationality problems 29
30 Requirements The presence or absence of effectiveness and feasibility problems must be immediately visible In case of problems, the reasons must be immediately seen or easy to find out - Undelivered people, use of improper destinations lack of suitable destinations - Late deliveries, use of improper vehicles deficiency of suitable vehicles - Multiple vehicles in same place: examine each place individually It must be possible to spot and explore rationality problems when time permits 30


31 Visual Analytics Approach Visual Analytics Mantra by D.Keim: Analyze First Show the Important Zoom, Filter and Analyze Further Details on Demand Input data Interactive visual interfaces Scheduling algorithm Schedule Computational analysis module Secondary data User s evaluation feedback Queries 31
32 Outline Introduction Problem analysis and task-oriented design Example work scenario User-controlled schedule modification Conclusion 32


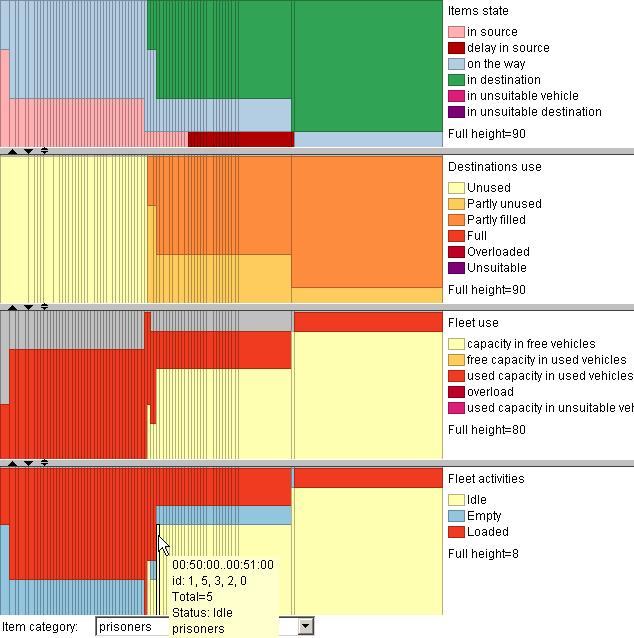
33 Analyze First Show the Important ummary display of the transportation progress: Signals of problems: Some people are not delivered will be seen here Reason: lack of destinations Delay in transportation will be seen here Reason: not enough vehicles Not always the reason is evident 33


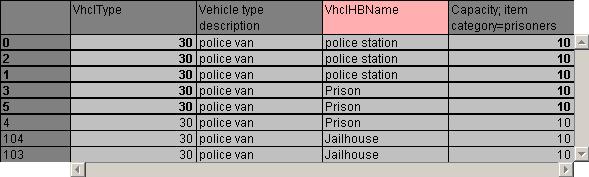
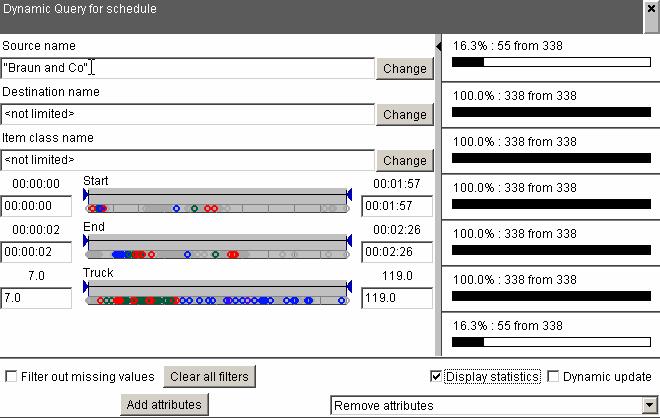
34 Zoom, Filter and Analyze Further Find a non-evident reason for a delay But they will be here while we need them here! The return trip takes 47 minutes At this time we shall have 5 free vehicles! This is the earliest possible time for taking the remaining prisoners 34

35 Details on demand 35

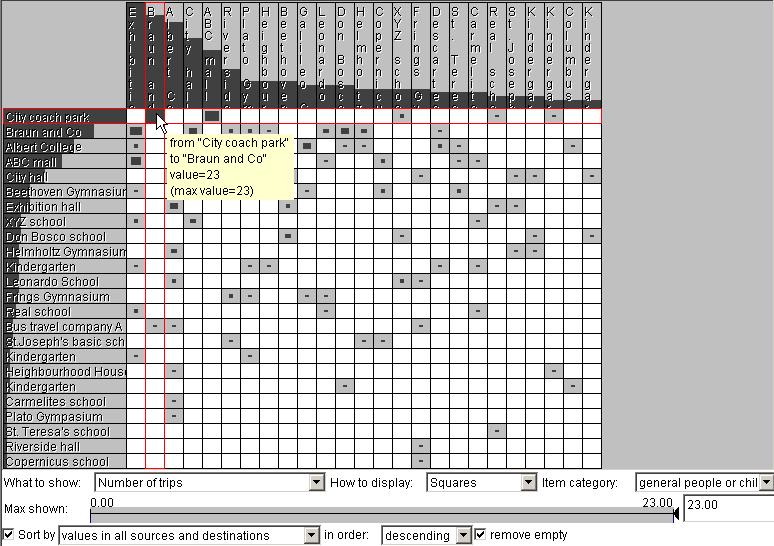
36 Zoom, Filter and Analyze Further So many trips to Braun and Co! How are they distributed in time? Check the feasibility 23 buses come simultaneously! permutable matrix shows the numbers of trips between pairs of locations but this is a big chemical plant with a large parking 36

37 Details on demand 37

38 Zoom, Filter and Analyze Further Assess the rationality But it is hard to see anything when we focus on the general people The choice of the destinations for the critically sick and injured persons seems quite reasonable 38


39 Zoom, Filter and Analyze Further Assess the rationality (continued) -shaped signs: Number of items Some people will be moved quite far Travel time while the capacities in the closer destinations are not fully used The planner may wish to change this if the time permits! 39
40 Outline Introduction Problem analysis and task-oriented design Example work scenario User-controlled schedule modification Conclusion 40
41 Reasons for Schedule Modification Undelivered people - Requires finding additional destinations Unacceptable delays - Requires finding additional vehicles or closer destinations (possibly, intermediate) Multiple vehicles in same place - The planner may shift some orders forward in time Non-rational choice of destinations and use of capacities in destinations - The planner may exclude distant places Situation changes after the evacuation started - New people appear, some destinations become unavailable (e.g. roads blocked), some vehicles get out of use, trips take longer than expected, 41
42 General Procedure Divide the orders into fixed and modifiable - by people category (e.g. critically sick fixed, prisoners modifiable) - by time: fix all trips starting before t in particular, for adapting to the changing situation - by source location (e.g. from Braun and Co modifiable) - by a combination of these criteria Update the input data - Add data about new sources, people, resources - Remove unavailable resources - Correct the travel times Re-run the scheduling algorithm (it is appropriately designed) 42
43 Conclusion Solving complex problems related to space & time requires a synergy between computers and human experts Visual analytics methods can support this We did a task-oriented design of VA tools for schedule assessment We verified the adequacy of the tools Trials with professional users are in preparation Details: Gennady Andrienko, Natalia Andrienko, Ulrich Bartling Visual Analytics Approach to User-Controlled Evacuation Scheduling IEEE Visual Analytics Science and Technology (VAST 2007) Proceedings, IEEE Computer Society Press, 2007, pp


44 Visual Analytics: Where are we now? Example of visual analytics: analysis of movement 44

45 Data (example) Positions of a private car from 03/12/06 till now N;Time;Lat;Long;Height;Course;Speed;PDOP;State;NSat 8;22/03/07 08:51:52; ; ; 67.6;345.4;21.817;3.8;1808;4 9;22/03/07 08:51:56; ; ; 68.4;35.6;14.223;3.8;1808;4 10;22/03/07 08:51:59; ; ; 68.3;112.7;25.298;3.8;1808;4 11;22/03/07 08:52:03; ; ; 68.8;119.8;32.447;3.8;1808;4 12;22/03/07 08:52:06; ; ; 68.1;124.1;30.058;3.8;1808;4 13;22/03/07 08:52:09; ; ; 67.9;117.7;34.003;3.8;1808;4 14;22/03/07 08:52:12; ; ; 66.9;117.5;37.151;3.8;1808;4 15;22/03/07 08:52:15; ; ; 67.0;99.2;39.188;3.8;1808;4 16;22/03/07 08:52:18; ; ; 68.8;90.6;41.170;3.8;1808;4 17;22/03/07 08:52:21; ; ; 71.1;82.0;35.058;3.8;1808;4 18;22/03/07 08:52:24; ; ; 68.6;117.1;11.371;3.8;1808;4 About 90,000 positions by 15/08/2007 (used in examples); more than 110,000 by now 45


46 The positions in time 46
47 Task (example) Investigate the movement behaviour of the car owner: - Detect and interpret typical trips: sources, destinations, routes, intermediate stops, purposes, - Find out the typical times of the trips - If possible, interpret also atypical trips Problems: - no explicit trips in the data but just positions - no meaningful places but latitudes and longitudes Places and trips have to be defined through data analysis! We know that the positions were recorded only while the car moved. Otherwise, the data could be filtered to remove sequences of records made in the same place (using an appropriate distance threshold). 47

48 Data preprocessing (one-time operation in DB) Original data: <t, x, y> Results of preprocessing: Points are arranged into sequences (NEXTTIME field) DIFFTIME and DISTANCE to the next position, DX, DY Derived speed, course, acceleration and turn in each point Additional temporal components are easy to extract from the database: day of week, day of year, decade of month We separated time-consuming data pre-processing (needs to be performed only once!) from rapid analysis and aggregation procedures (that take just few seconds) 48

 by")
49 A new galaxy? (points are plotted according to DX & DY) An artefact of the straight line filtering (threshold = 20 meters) by the data collection software 49
50 Defining significant places We know that the positions were recorded only while the car moved. Large time gaps between successive positions indicate stops. We can query the database for the positions where DIFFTIME (distance in time to the next position) exceeds a specified threshold The possible meanings of the extracted places will differ depending on the threshold - Large gaps: places where the person spends much time (home, work) - Medium gaps: shops, doctors, sport facilities, - Small gaps: traffic lights, street crossings, Places separated by medium to large gaps may be destinations and sources of trips Sequences of positions between the gaps represent the trips 50
 3 hours 30 minutes 5 minutes 30 seconds")
51 Extraction of the places of stops (DB query + GUI + Visualisation) 3 hours 30 minutes 5 minutes 30 seconds 51
52 Interpretation of the places of stops A) Long stops ( 3 hours) 1) Spatial clustering: find repeated stops 2) Look at the days and times of the occurrence Days of the week Hours of the day Red: home, blue: work 52
 Days of the week Hours of the day Green & light blue: probably shopping")
53 Interpretation of the places of stops B) Medium stops ( 30 minutes) 1) Spatial clustering: find repeated stops 2) Look at the days and times of the occurrence (clusters 1&2 excluded) Days of the week Hours of the day Green & light blue: probably shopping 53


54 Interpretation of the clusters 3 and 4 (continued) Saturday and Sunday: the stops mostly occur between 10 and 14 Monday to Friday: the stops mostly occur in the evening hours (max between 18 and 19) 54


55 The interpreted places Visual Analytics example other town parking other town parking shopping centre 1 shopping centre 1 home home shopping centre 2 shopping centre 2 work work sports place sports place 55

56 Extraction of trips (DB operation + GUI + Visualisation) 56


57 A trip in more detail End Route Time Start 57

58 Problems with data quality Many false starts; the real starts are missing Positioning errors 58

59 Looking for typical trips 1) From where and to where? The trajectories are very roughly clustered according to the spatial proximity of their starts and ends Visual Analytics example 59
 - our implementation: cluster")

60 Interactive tool for spatial clustering Joint work with S.Rinzivillo, Univ. Pisa: - spatial clustering algorithm OPTICS (Ankerst, Breunig, Kriegel, and Sander 1999) - our implementation: cluster building is separated from distance and neighbourhood computation - benefit: an analyst may try different distance measures - we have developed several variants of distance measures designed specially for trajectories - some of the measures can tolerate the specific errors in the car driving data 60
 Observation: the eastern route is chosen more")
61 Cluster 1: from around the work to home (111 trips) Visual Analytics example he false starts can be seen mall green circles) Observation: the eastern route is chosen more often 61
62 Visual Analytics example Cluster 2: from around home to around the work (111 trips) Observation: the eastern route is chosen much more often 62

63 Cluster 3: trips starting and ending around home (52 trips) Visual Analytics example Observation: the distant trips are mostly occasional 63


64 The summarised view in more detail Major flow Many small moves Variations 64


65 Summarisation of trajectories: how it is done (1) Original trajectory Simplified trajectory Generalised positions Specifies which positions to keep 65
 are built around spatially close positions of all")
66 Summarisation: how it is done (2) All trajectories simplified Generalised positions (circles, for simplicity) are built around spatially close positions of all trajectories 66
 Numbers of moves between the")

67 Summarisation: how it is done (3) Numbers of moves between the positions are counted and represented by arrows of varying width 67


68 Summarized representation of clusters A single cluster is selected: the moves from this cluster only are counted and shown Disadvantage: some arrows may cover other arrows 2 or more clusters are selected: the moves from these clusters are counted and shown; dark grey corresponds to common moves In the future, we ll try to put them in a 3D view (e.g. Google Earth) 68

69 Progressive clustering 1) Select one or a few clusters 2) Apply another clustering to the selection; use a different distance function or different parameter settings 69
 is direct; the others are used for visiting certain places like shops.")
70 Analysing the trips from work to home (111 trips) Visual Analytics example Summarised trajectories excluding the noise Hypothesis: one of the routes (red) is direct; the others are used for visiting certain places like shops. 70


71 The red route (60 trips) Visual Analytics example The red route takes less time than the others. Sometimes, the trips start quite late in the evening while the latest of the remaining trips starts at 19:22. Here the time was spent Stops are rare and rather short; the longest stops (just 2) were in a place not far from home on route prolongation 71

72 The other ways home Visual Analytics example Our hypothesis is supported: the red route work-home is direct; on the other routes, the person makes intermediate stops. On the way from the work to home, the person often visits the shopping centres. The route through shopping centre 2 (green) is preferred, but not always the person stops there (see min duration of stay). 72


73 Visual Analytics example The trips through the shopping centres Is there any regularity in preferring one shopping centre to the other? Weekly distribution of the trips Start times and durations Red: trips through both shopping centres On the basis of the clustering results, we have interactively classified the trips according to the visits of the shopping centres. 1) The trips through the shopping centres occur more often on Wednesdays and Thursdays. 2) Shopping centre 1 is usually visited on Mondays, Thursdays, and Fridays. 3) The starting times and durations of the trips through shopping centres 1 and 2 do not significantly differ. 73
74 The use of 3D view (Google Earth) to analyse trajectories Two clusters of trips from home to work by the direct route differing in dynamics Yellow: faster trips; cyan blue: slower trips The clusters obtained using the distance function route + dynamics 74
 75")
75 Comparison of speed dynamics in 3D view (Google Earth) 75
76 What we have learned about the car owner: The places where the person lives, works, and shops The typical routes from home to work, from work to home, to the shopping areas The places where the person frequently stops on the way from work to home The places where the person may stop on the way from home to work The durations of the stops, times spent for visiting the shopping areas The times of the trips and of the stops How the chosen routes are distributed over the days of the week The tools we used: Database processing Interactive clustering Computational generalisation and summarisation Interactive displays Dynamic filtering Visual analytics toolkit 76
77 What we also have learned but haven t noted explicitly: Visual Analytics example The car owner lives in a small town (found using Google Earth and Google Map) The person has a flexible work schedule (concluded from the variation of the times of the trips to and from the work) The person has no small children (concluded from the times of the trips from the work to home) The person is often away or sick (judging from the distribution of the trips over the time period, especially in the summer) green: home to work red: work to home blue: home home 77
78 Reconstruction of the analytical process raw data (~90K records <x,y,t>) Database processing enhanced data (~90K records <x,y,t,dt,dx,dy, speed >) Interactive UI + Database processing Locations of stops with variable t-resolution aggregated trips Interactive UI + geocomputations Extracted trips (~500) Interactive UI + Database processing Cluster analysis + visualization + Google Earth (additional data!) Clusters of locations, their interpretation Cluster analysis + visualization and interactive analysis tools + Google Earth Typical trips, their interpretation and analysis Algorithms, other details, one more data set: G.Andrienko, N.Andrienko, S.Wrobel Visual Analytics Tools for Analysis of Movement Data ACM SIGKDD Explorations, v.9(2), December
79 Outline Visual Analytics Introduction - Definition of Visual Analytics - Roots - What is new? Where are we now? - Live demo of current visualisation techniques - Example of visual analytics: evacuation scheduling - Example of visual analytics: analysis of movement Where should we go? - The visual analytics example: what is lacking? - Visual analytics for spatial decision support Conclusion 79
80 Visual Analytics: Where should we go? Some questions about the last example: Where is the knowledge we have gained? 1) In our heads! - Do we remember everything we have learned and how we have come to it? - Shall we remember it in a few days? In a few weeks? 2) In this presentation! - It took us several days to make it How often can analysts afford this? How could we conveniently review and systematise what we have learned? - It might be useful to compare different portions of knowledge gained independently of each other (e.g. behaviour on work days and on weekends) - Further inferences could be made and new insights gained through combining known facts (putting known facts together is essential for a good detective work!) How could such analyses (with more complex data) be made by several analysts? - What should be the result of their joint effort? - What if they disagree in some points? 80
81 Visual Analytics: Where should we go? The needs Explicit and easily manageable representation of the knowledge gained from analysis Explicit representation of how the knowledge was obtained (observations, inferences, involvement of background knowledge and additional information from other sources) Explicit representation of assumptions, confidences, conditional judgements, inconsistencies, competing hypotheses, alternative interpretations A framework for knowledge systemisation and establishing relations between knowledge items A software tool that supports - capture of observations, knowledge, and argumentation (analytical artefacts) in the process of analysis but without disrupting the process! - storage of analytical artefacts and relations between them (knowledge base) - browsing and searching in the knowledge base - editing and enrichment of the knowledge base - producing reports about the analysis and explanations of the conclusions made 81
82 Visual Analytics: Where should we go? Can AI research help? Artificial Intelligence Knowledge representation Knowledge capture Reasoning Uncertainty and confidence Learning Explanation Visual Analytics AI seems to have what VA needs! But is it fully suitable and sufficient? 82
83 Specifics of knowledge and reasoning in VA (why existing methods and software would be inappropriate) Specific knowledge types: observations, abstractions, patterns, structures, Analytical artefacts are tightly connected to visual representations The visual representations need to be captured and stored together with the analytical artefacts Analytical artefacts may refer to geographical space and/or time These references also need to be captured and stored The knowledge is built dynamically rather than exists in advance Visual Analytics: Where should we go? Knowledge capture needs to be seamlessly integrated into the software for analysis - Analysts should concentrate on the analysis but not on knowledge transfer (could standard knowledge engineering approaches be suitable here?) The knowledge representation needs to be human-oriented rather than machineoriented 83
84 A great challenge: non-disruptive knowledge capture Visual Analytics: Where should we go? Analysts need an intelligent software assistant that could capture the artefacts emerging in the process of analysis without disrupting this process of analysis - Ideally, the assistant should be invisible and require no attention at all Questions: Too ambitious? Then we should at least try to reduce the assistant s opacity to an acceptable level. - E.g. suggestion of appropriate templates at appropriate time moments Can the machine understand what the analyst is doing? Can the machine see (guess) what the analyst sees? Can the machine foresee what kinds of analytical artefacts - are possible for given data? - can result from using given methods or tools? Let s review what we had in our example analysis of movement 84

85 Examples of analytical artefacts Visual Analytics: Where should we go? Positions of stops: elementary objects Clusters of positions: aggregates Places as areas: abstractions Trajectory: elementary object Clusters of trajectories: aggregates Typical route: abstraction 85
 The positions are clustered (form spatially close groups ): pattern Blue is mostly in the morning, red is")
86 Examples of analytical artefacts (cont.) Visual Analytics: Where should we go? Distribution over a time period, within a time cycle: behaviour (temporal) The positions are clustered (form spatially close groups ): pattern Blue is mostly in the morning, red is mostly in the evening: patterns Red: home, blue: work Distribution in space: behaviour (spatial) inference 86

87 Examples of analytical artefacts (cont.) Visual Analytics: Where should we go? Frequency distribution of routes and moves: behaviour outliers: pattern Statistical distribution of characteristics: behaviour The eastern route is chosen much more often: pattern 87
88 Examples of analytical artefacts (cont.) Visual Analytics: Where should we go? Green & light blue: probably shopping hypothesis basis for the hypothesis evidence evidence 88
89 Examples of analytical artefacts (cont.) Visual Analytics: Where should we go? other town parking interpretations shopping centre 1 home shopping centre 2 Positioning errors work sports place 89

 6 of 7 trips along this route visited shopping")
90 Examples of analytical artefacts (cont.) Visual Analytics: Where should we go? Route with stops: composite object Places, frequency, durations, temporal sequence of stops: behaviour Differences and similarities direct have intermediate stops On this route stops are not usual: pattern (structural) 6 of 7 trips along this route visited shopping centre 1: pattern 90
91 Could (some of) these kinds of artefacts be theoretically predicted? Movement data: <time> <positions in space>, where time is an independent component and space is a dependent component Time (set of time moments): continuous; has distances; linearly ordered; may be cyclically ordered Space (set of positions): continuous; has distances; partly ordered w.r.t. selected positions and directions Abstractions: point in space place (area in 2D or volume in 3D); moment in time interval Elementary object: [<specific time moment> <specific position>] Visual Analytics: Where should we go? Space has distances positions can be close or distant in space sets of positions may be spatially dispersed or clustered (possible patterns of spatial behaviour) Positions depend on time an analyst may be interested in the distribution of selected positions (e.g. starts or ends of trips) over the time span Time may be cyclically ordered an analyst may be interested in the distribution of selected positions within the temporal cycles Possible patterns of temporal distribution: even distribution; tendency towards certain moments or intervals within the time span or within a cycle 91
92 Predicting kinds of artefacts for movement data (cont.) Visual Analytics: Where should we go? Positions depend on time; time is linearly ordered positions form sequences Time is continuous there is a position (possibly unknown) for any time moment positions form a continuous sequence Time divided into intervals a sequence of positions divided into sub-sequences Abstraction: continuous (sub-)sequence of time-referenced positions trajectory (start position + end position + course + time interval) treated as unit, or elementary object Trajectories may be compared regarding one or more of their characteristics (i.e. start, end, course, and time interval) and grouped (clustered) by similarity Abstraction: multiple trajectories with similar courses typical route A typical analysis task: study the statistical (frequency) distribution of characteristics over a set of objects (such as trajectories in our case) Possible patterns of statistical distribution: even distribution; prevalence of certain characteristics; outliers Movement data places and trajectories (independent abstractions) can be put together - Places may be characterised in terms of trajectories passing them - Trajectories may be characterised in terms of places they pass and so on 92
93 Visual Analytics: Where should we go? Predicting kinds of artefacts for analytical tools and methods Map: positions; courses; patterns of spatial distribution Graph or plot with an axis representing time: time moments or intervals; patterns of temporal distribution Histogram, scatter plot: patterns of statistical distribution Temporal histogram: patterns of temporal distribution Clustering: groups of objects with similar characteristics Spatial clustering: groups of objects close in space and so on 93
94 Sequel Visual Analytics: Where should we go? Questions: Can the machine understand what the analyst is doing? Can the machine see (guess) what the analyst sees? Can the machine foresee what kinds of reasoning artefacts - are possible for given data? - can result from using given methods or tools? The positive answers seem to be quite attainable! But not without efforts 94
95 Conclusion Visual Analytics: Where should we go? Visual Analytics is conceived as a field of multidisciplinary research Researchers in Artificial Intelligence have valuable expertise and experience and could greatly contribute to the development of Visual Analytics The major research directions: - Typology of analytical artefacts - Representation methods for analytical artefacts - Interpretation of activities of a human analyst - Recognition of analytical artefacts - Systemisation and management of analytical artefacts Would you be interested to join? 95
96 Outline Visual Analytics Introduction - Definition of Visual Analytics - Roots - What is new? Where are we now? - Live demo of current visualisation techniques - Example of visual analytics: evacuation scheduling - Example of visual analytics: analysis of movement Where should we go? - The visual analytics example: what is lacking? - Visual analytics for spatial decision support Conclusion 96
97 Spatial Decision Support Computerised assistance to people in solving problems having geographical or spatial components: - develop, evaluate, and select - proper policies, plans, scenarios, projects, interventions E.g. long-term decision-making: - planning for sustainable places - mitigating hazards - infrastructure management - strategic business planning E.g. short-term decision making - resource logistics - emergency response 97

98 Actors in decision making processes Decision maker (e.g. administrator or politician) Analyst: knows the problem domain; skilled in (computational) analysis and/or modelling Stakeholder: can profit or lose from the decisions made wants to be informed and involved 98
99 Operations Research Creates methods to automatically develop, evaluate, and select proper variants of problem solutions when the problem, relevant information, and criteria are represented in a suitable form (numbers, formulas, logical expressions, ) Hmm This does not seem to be always possible! 99
100 Complexities Most spatial decision problems are inherently ill-defined (the goals and/or criteria are vague, incomplete, unquantifiable ) Geographic space is heterogeneous, anisotropic, continuous; multitude of objects, phenomena, relations; scale-dependency No adequate formal representation exists yet! Tacit knowledge and criteria play especially important role (e.g. knowledge of geographic area or general knowledge about space, objects, and relationships) 100

101 Approach Synergy: I cannot put my knowledge in it But I can try to evaluate possible solutions and choose the best one. Can it show me the solutions? Vehicle Vehicle Vehicle home base Source Source name Destination Destination name Start End Item Item class name class Operation ID ID ID class Number ID of items 20 Pick Up 41 Children clinics 75 Children clinics 60 Braun and Co 00:00:00 00:00:04 0 EMPTY 1 20 Deliver 41 Children clinics 75 Children clinics 60 Braun and Co 00:00:00 00:00:04 0 EMPTY 1 20 Pick Up 41 Children clinics 60 Braun and Co 68 St. John Hospital 00:00:04 00:00:30 21 invalids who cannot seat 2 20 Deliver 41 Children clinics 60 Braun and Co 68 St. John Hospital 00:00:04 00:00:30 21 invalids who cannot seat 2 20 Pick Up 41 Children clinics 68 St. John Hospital 22 St. Peter Hospital 00:00:51 00:00:54 0 EMPTY 1 20 Deliver 41 Children clinics 68 St. John Hospital 22 St. Peter Hospital 00:00:51 00:00:54 0 EMPTY 1 20 Pick Up 41 Children clinics 22 St. Peter Hospital 40 Spa healing house 00:00:54 00:01:22 21 invalids who cannot seat 2 20 Deliver 41 Children clinics 22 St. Peter Hospital 40 Spa healing house 00:00:54 00:01:22 21 invalids who cannot seat 2 10 Pick Up 102 City coach park 109 City coach park 60 Braun and Co 00:00:00 00:00:05 0 EMPTY 1 10 Deliver 102 City coach park 109 City coach park 60 Braun and Co 00:00:00 00:00:05 0 EMPTY 1 10 Pick Up 102 City coach park 60 Braun and Co 50 Exhibition hall 00:00:05 00:00:18 10 general people or children Deliver 102 City coach park 60 Braun and Co 50 Exhibition hall 00:00:05 00:00:18 10 general people or children Pick Up 102 City coach park 50 Exhibition hall 32 Kindergarten 00:00:28 00:00:34 0 EMPTY 1 10 Deliver 102 City coach park 50 Exhibition hall 32 Kindergarten 00:00:28 00:00:34 0 EMPTY 1 10 Pick Up 102 City coach park 32 Kindergarten 41 Descartes School 00:00:34 00:00:51 10 general people or children Deliver 102 City coach park 32 Kindergarten 41 Descartes School 00:00:34 00:00:51 10 general people or children Pick Up 48 City coach park 109 City coach park 60 Braun and Co 00:00:00 00:00:05 0 EMPTY 1 10 Deliver 48 City coach park 109 City coach park 60 Braun and Co 00:00:00 00:00:05 0 EMPTY 1 10 Pick Up 48 City coach park 60 Braun and Co 49 Leonardo School 00:00:05 00:00:18 10 general people or children Deliver 48 City coach park 60 Braun and Co 49 Leonardo School 00:00:05 00:00:18 10 general people or children Pick Up 48 City coach park 49 Leonardo School 5 Frings Gymnasium 00:00:28 00:00:33 0 EMPTY 1 10 Deliver 48 City coach park 49 Leonardo School 5 Frings Gymnasium 00:00:28 00:00:33 0 EMPTY 1 10 Pick Up 48 City coach park 5 Frings Gymnasium 41 Descartes School 00:00:33 00:00:48 10 general people or children Deliver 48 City coach park 5 Frings Gymnasium 41 Descartes School 00:00:33 00:00:48 10 general people or children Pick Up 78 City coach park 109 City coach park 21 Kindergarten 00:00:00 00:00:05 0 EMPTY 1 10 Deliver 78 City coach park 109 City coach park 21 Kindergarten 00:00:00 00:00:05 0 EMPTY 1 10 Pick Up 78 City coach park 21 Kindergarten 50 Exhibition hall 00:00:05 00:00:19 10 general people or children Deliver 78 City coach park 21 Kindergarten 50 Exhibition hall 00:00:05 00:00:19 10 general people or children Pick Up 78 City coach park 50 Exhibition hall 18 Albert College 00:00:29 00:00:35 0 EMPTY 1 10 Deliver 78 City coach park 50 Exhibition hall 18 Albert College 00:00:29 00:00:35 0 EMPTY 1 10 Pick Up 78 City coach park 18 Albert College 42 Riverside hall 00:00:35 00:00:52 10 general people or children Deliver 78 City coach park 18 Albert College 42 Riverside hall 00:00:35 00:00:52 10 general people or children Pick Up 117 Bus travel company 110 Bus travel company 60 Braun and Co 00:00:00 00:00:06 0 EMPTY 1 12 Deliver 117 Bus travel company 110 Bus travel company 60 Braun and Co 00:00:00 00:00:06 0 EMPTY 1 12 Pick Up 117 Bus travel company 60 Braun and Co 42 Riverside hall 00:00:06 00:00:23 10 general people or children Deliver 117 Bus travel company 60 Braun and Co 42 Riverside hall 00:00:06 00:00:23 10 general people or children 100 What? A single solution is a table with hundreds of lines? How can I review and evaluate it? A solution must be put in a visual form! 101

102 Role of visualization Visualization and interactive visual interfaces can effectively convey material for human s analysis and reasoning It s not my job. A visualization specialist must care about displaying the solutions which my algorithm produces. OK. Let me try But it s not so easy! 102
103 Visualization of a solution A solution of a spatial decision problem is often a complex spatio-temporal construct - E.g. an action plan where actions refer to different positions, regions, or paths in space and to different moments or intervals in time Retail outlet distribution: where, when, and what outlet should be opened, closed, or modified (size, profile, ) Groundwater management: how much water can be taken from each well in different time periods; when and where to restrict water withdrawals People evacuation (item transportation) scheduling: what people (items), from where, to where, how many, when, by what transport 103

104 Visualization of a solution (cont.) This can only be done by means of multiple coordinated views and interactive query tools 104

105 Does it solve the problem? I can try to learn how to use all these displays and interactive tools to analyze a single solution. But Is it realistic to compare all possible solutions for choosing the best one? It seems so hard even with two variants What if they are tens or hundreds? And when I am not fully satisfied, how can I tell the algorithm what must be improved? And would it regard my opinion?? Could we propose something better than just a display of end results of algorithms? 105
106 Enable a true synergy The human analyst should be actively involved in the process of solution generation or search, i.e. cooperate with the computer - Contribute with intangible knowledge and experience - Actively guide the work of algorithms - Effectively reduce the search scope - Improve the quality of solutions Interactive visual interfaces are essential during the whole process as a means of communication between computer and human 106
107 Enable a true synergy (cont.) Requires fundamentally new decision support methods: computational analysis modeling visualization interaction knowledge synthesis reasoning organically integrated Such methods can only result from cross-disciplinary research It seems that we ll have to work together 107

108 Regard the needs of different actors I need to see what each option means for me personally (my family, my company, my town ). And I have quite valuable local knowledge that should be taken into account. I want just a few clear and easily comparable options. But I want to understand where they come from and what tradeoffs involve. Besides, what if some assumptions are wrong or the situation changes? Would it be possible to put selected solutions in a form of simple visuointeractive models these guys could play with? Could such models be customizable? 108
109 Visual Analytics for Spatial Decision Support Cross-disciplinary research Looks for ways to provide computer support to solving space-related decision problems through enhancing human capabilities to analyze, envision, reason, and deliberate Addresses all phases of the decision making process - Initial exploration, generation of solution options, evaluation, choice Addresses the needs of various actors Bases on achievements in geovisualization, information visualization, human-computer interaction, geographic information science, operations research, data mining and machine learning, decision science, 109
110 Must deal with Huge amounts of source data, high dimensionality, extensive search spaces Complex, heterogeneous information (geography, time, objects, attributes, actions, relations, effects, ) Uncertain, incomplete, noisy information Time-critical decision making (e.g. emergency evacuation) Adaptive real-time decision making: monitoring of decision implementation in an evolving situation, assessment of effectiveness, revision 110
111 Conclusion Spatial decision support requires multi-disciplinary approaches for creating adequate tools and making theoretical advances So far, there has been limited synthesis and cooperation between different research communities Visual Analytics for Spatial Decision Support is a new concept designed to attract the attention of scientists with relevant expertise promote the development of cross-disciplinary research capable to meet the challenges of the real-world decision making 111
112 Outline Visual Analytics Introduction - Definition of Visual Analytics - Roots - What is new? Where are we now? - Live demo of current visualisation techniques - Example of visual analytics: evacuation scheduling - Example of visual analytics: analysis of movement Where should we go? - The visual analytics example: what is lacking? - Visual analytics for spatial decision support Conclusion 112
113 Visual analytics resources Visual Analytics Digital Library: InfoVis Community Platform: Software - Many tools from HCIL lead by B.Shneiderman: (TimeSearcher and others, also extensive archive of publications) - InfoVis toolkit by J.-D.Fekete / INRIA: - Prefuse toolkit by J.Heer / UC Berkeley: - InfoVis CyberInfrastructure by K.Boerner / Univ. Indiana: - GeoVista Studio from Penn State lead by A.MacEachren: - GAV Framework from Linkoping University lead by M.Jern: - Geospatial Visual Analytics toolkit based on Iris, Descartes, CommonGIS from Fraunhofer IAIS: 113

 AGILE 2008 workshop (May 2008, Girona, Spain) GeoVisualization of Dynamics, Movement and")
114 welcome to join our activities! GIScience 2006 workshop outcomes: Special issue on GeoVisual Analytics for Spatial Decision Support, including Setting the Research Agenda paper Int.J.GIScience, 2007, v.21(8) AGILE 2008 workshop (May 2008, Girona, Spain) GeoVisualization of Dynamics, Movement and Change forthcoming special issue of Information Visualization 114
Module 12. Machine Learning. Version 2 CSE IIT, Kharagpur
 Module 12 Machine Learning 12.1 Instructional Objective The students should understand the concept of learning systems Students should learn about different aspects of a learning system Students should
An Introduction to Simio for Beginners
 An Introduction to Simio for Beginners C. Dennis Pegden, Ph.D. This white paper is intended to introduce Simio to a user new to simulation. It is intended for the manufacturing engineer, hospital quality
Rule-based Expert Systems
 Rule-based Expert Systems What is knowledge? is a theoretical or practical understanding of a subject or a domain. is also the sim of what is currently known, and apparently knowledge is power. Those who
Document number: 2013/ Programs Committee 6/2014 (July) Agenda Item 42.0 Bachelor of Engineering with Honours in Software Engineering
 Agenda Item 42.0 Bachelor of Engineering with Honours in Software Engineering") Document number: 2013/0006139 Programs Committee 6/2014 (July) Agenda Item 42.0 Bachelor of Engineering with Honours in Software Engineering Program Learning Outcomes Threshold Learning Outcomes for Engineering
Document number: 2013/0006139 Programs Committee 6/2014 (July) Agenda Item 42.0 Bachelor of Engineering with Honours in Software Engineering Program Learning Outcomes Threshold Learning Outcomes for Engineering
Visit us at:
 White Paper Integrating Six Sigma and Software Testing Process for Removal of Wastage & Optimizing Resource Utilization 24 October 2013 With resources working for extended hours and in a pressurized environment,
Generating Test Cases From Use Cases
 1 of 13 1/10/2007 10:41 AM Generating Test Cases From Use Cases by Jim Heumann Requirements Management Evangelist Rational Software pdf (155 K) In many organizations, software testing accounts for 30 to
Seminar - Organic Computing
 Seminar - Organic Computing Self-Organisation of OC-Systems Markus Franke 25.01.2006 Typeset by FoilTEX Timetable 1. Overview 2. Characteristics of SO-Systems 3. Concern with Nature 4. Design-Concepts
AGN 331 Soil Science Lecture & Laboratory Face to Face Version, Spring, 2012 Syllabus
 AGN 331 Soil Science Lecture & Laboratory Face to Face Version, Spring, 2012 Syllabus Contact Information: J. Leon Young Office number: 936-468-4544 Soil Plant Analysis Lab: 936-468-4500 Agriculture Department,
On Human Computer Interaction, HCI. Dr. Saif al Zahir Electrical and Computer Engineering Department UBC
 On Human Computer Interaction, HCI Dr. Saif al Zahir Electrical and Computer Engineering Department UBC Human Computer Interaction HCI HCI is the study of people, computer technology, and the ways these
MYCIN. The MYCIN Task
 MYCIN Developed at Stanford University in 1972 Regarded as the first true expert system Assists physicians in the treatment of blood infections Many revisions and extensions over the years The MYCIN Task
Urban Analysis Exercise: GIS, Residential Development and Service Availability in Hillsborough County, Florida
 UNIVERSITY OF NORTH TEXAS Department of Geography GEOG 3100: US and Canada Cities, Economies, and Sustainability Urban Analysis Exercise: GIS, Residential Development and Service Availability in Hillsborough
On-Line Data Analytics
 International Journal of Computer Applications in Engineering Sciences [VOL I, ISSUE III, SEPTEMBER 2011] [ISSN: 2231-4946] On-Line Data Analytics Yugandhar Vemulapalli #, Devarapalli Raghu *, Raja Jacob
Implementing a tool to Support KAOS-Beta Process Model Using EPF
 Implementing a tool to Support KAOS-Beta Process Model Using EPF Malihe Tabatabaie Malihe.Tabatabaie@cs.york.ac.uk Department of Computer Science The University of York United Kingdom Eclipse Process Framework
EDIT 576 DL1 (2 credits) Mobile Learning and Applications Fall Semester 2014 August 25 October 12, 2014 Fully Online Course
 Mobile Learning and Applications Fall Semester 2014 August 25 October 12, 2014 Fully Online Course") GEORGE MASON UNIVERSITY COLLEGE OF EDUCATION AND HUMAN DEVELOPMENT GRADUATE SCHOOL OF EDUCATION INSTRUCTIONAL DESIGN AND TECHNOLOGY PROGRAM EDIT 576 DL1 (2 credits) Mobile Learning and Applications Fall
GEORGE MASON UNIVERSITY COLLEGE OF EDUCATION AND HUMAN DEVELOPMENT GRADUATE SCHOOL OF EDUCATION INSTRUCTIONAL DESIGN AND TECHNOLOGY PROGRAM EDIT 576 DL1 (2 credits) Mobile Learning and Applications Fall
DIGITAL GAMING & INTERACTIVE MEDIA BACHELOR S DEGREE. Junior Year. Summer (Bridge Quarter) Fall Winter Spring GAME Credits.
 Fall Winter Spring GAME Credits.") DIGITAL GAMING & INTERACTIVE MEDIA BACHELOR S DEGREE Sample 2-Year Academic Plan DRAFT Junior Year Summer (Bridge Quarter) Fall Winter Spring MMDP/GAME 124 GAME 310 GAME 318 GAME 330 Introduction to Maya
DIGITAL GAMING & INTERACTIVE MEDIA BACHELOR S DEGREE Sample 2-Year Academic Plan DRAFT Junior Year Summer (Bridge Quarter) Fall Winter Spring MMDP/GAME 124 GAME 310 GAME 318 GAME 330 Introduction to Maya
EDIT 576 (2 credits) Mobile Learning and Applications Fall Semester 2015 August 31 October 18, 2015 Fully Online Course
 Mobile Learning and Applications Fall Semester 2015 August 31 October 18, 2015 Fully Online Course") GEORGE MASON UNIVERSITY COLLEGE OF EDUCATION AND HUMAN DEVELOPMENT INSTRUCTIONAL DESIGN AND TECHNOLOGY PROGRAM EDIT 576 (2 credits) Mobile Learning and Applications Fall Semester 2015 August 31 October
GEORGE MASON UNIVERSITY COLLEGE OF EDUCATION AND HUMAN DEVELOPMENT INSTRUCTIONAL DESIGN AND TECHNOLOGY PROGRAM EDIT 576 (2 credits) Mobile Learning and Applications Fall Semester 2015 August 31 October
Evaluation of Usage Patterns for Web-based Educational Systems using Web Mining
 Evaluation of Usage Patterns for Web-based Educational Systems using Web Mining Dave Donnellan, School of Computer Applications Dublin City University Dublin 9 Ireland daviddonnellan@eircom.net Claus Pahl
Evaluation of Usage Patterns for Web-based Educational Systems using Web Mining
 Evaluation of Usage Patterns for Web-based Educational Systems using Web Mining Dave Donnellan, School of Computer Applications Dublin City University Dublin 9 Ireland daviddonnellan@eircom.net Claus Pahl
TU-E2090 Research Assignment in Operations Management and Services
 Aalto University School of Science Operations and Service Management TU-E2090 Research Assignment in Operations Management and Services Version 2016-08-29 COURSE INSTRUCTOR: OFFICE HOURS: CONTACT: Saara
Pragmatic Use Case Writing
 Pragmatic Use Case Writing Presented by: reducing risk. eliminating uncertainty. 13 Stonebriar Road Columbia, SC 29212 (803) 781-7628 www.evanetics.com Copyright 2006-2008 2000-2009 Evanetics, Inc. All
Math 96: Intermediate Algebra in Context
 : Intermediate Algebra in Context Syllabus Spring Quarter 2016 Daily, 9:20 10:30am Instructor: Lauri Lindberg Office Hours@ tutoring: Tutoring Center (CAS-504) 8 9am & 1 2pm daily STEM (Math) Center (RAI-338)
16.1 Lesson: Putting it into practice - isikhnas
 BAB 16 Module: Using QGIS in animal health The purpose of this module is to show how QGIS can be used to assist in animal health scenarios. In order to do this, you will have needed to study, and be familiar
A Case Study: News Classification Based on Term Frequency
 A Case Study: News Classification Based on Term Frequency Petr Kroha Faculty of Computer Science University of Technology 09107 Chemnitz Germany kroha@informatik.tu-chemnitz.de Ricardo Baeza-Yates Center
3. Improving Weather and Emergency Management Messaging: The Tulsa Weather Message Experiment. Arizona State University
 3. Improving Weather and Emergency Management Messaging: The Tulsa Weather Message Experiment Kenneth J. Galluppi 1, Steven F. Piltz 2, Kathy Nuckles 3*, Burrell E. Montz 4, James Correia 5, and Rachel
HARPER ADAMS UNIVERSITY Programme Specification
 HARPER ADAMS UNIVERSITY Programme Specification 1 Awarding Institution: Harper Adams University 2 Teaching Institution: Askham Bryan College 3 Course Accredited by: Not Applicable 4 Final Award and Level:
Unit 7 Data analysis and design
 2016 Suite Cambridge TECHNICALS LEVEL 3 IT Unit 7 Data analysis and design A/507/5007 Guided learning hours: 60 Version 2 - revised May 2016 *changes indicated by black vertical line ocr.org.uk/it LEVEL
Level 6. Higher Education Funding Council for England (HEFCE) Fee for 2017/18 is 9,250*
 Fee for 2017/18 is 9,250*") Programme Specification: Undergraduate For students starting in Academic Year 2017/2018 1. Course Summary Names of programme(s) and award title(s) Award type Mode of study Framework of Higher Education
Programme Specification: Undergraduate For students starting in Academic Year 2017/2018 1. Course Summary Names of programme(s) and award title(s) Award type Mode of study Framework of Higher Education
Probability and Statistics Curriculum Pacing Guide
 Unit 1 Terms PS.SPMJ.3 PS.SPMJ.5 Plan and conduct a survey to answer a statistical question. Recognize how the plan addresses sampling technique, randomization, measurement of experimental error and methods
USER ADAPTATION IN E-LEARNING ENVIRONMENTS
 USER ADAPTATION IN E-LEARNING ENVIRONMENTS Paraskevi Tzouveli Image, Video and Multimedia Systems Laboratory School of Electrical and Computer Engineering National Technical University of Athens tpar@image.
Algebra 1, Quarter 3, Unit 3.1. Line of Best Fit. Overview
 Algebra 1, Quarter 3, Unit 3.1 Line of Best Fit Overview Number of instructional days 6 (1 day assessment) (1 day = 45 minutes) Content to be learned Analyze scatter plots and construct the line of best
A Case-Based Approach To Imitation Learning in Robotic Agents
 A Case-Based Approach To Imitation Learning in Robotic Agents Tesca Fitzgerald, Ashok Goel School of Interactive Computing Georgia Institute of Technology, Atlanta, GA 30332, USA {tesca.fitzgerald,goel}@cc.gatech.edu
Brief Home-Based Data Collection of Low Frequency Behaviors
 Georgia Southern University Digital Commons@Georgia Southern Georgia Association for Positive Behavior Support Conference Dec 4th, 9:45 AM - 10:45 AM Brief Home-Based Data Collection of Low Frequency Behaviors
Full text of O L O W Science As Inquiry conference. Science as Inquiry
 Page 1 of 5 Full text of O L O W Science As Inquiry conference Reception Meeting Room Resources Oceanside Unifying Concepts and Processes Science As Inquiry Physical Science Life Science Earth & Space
Millersville University Degree Works Training User Guide
 Millersville University Degree Works Training User Guide Page 1 Table of Contents Introduction... 5 What is Degree Works?... 5 Degree Works Functionality Summary... 6 Access to Degree Works... 8 Login
Automating the E-learning Personalization
 Automating the E-learning Personalization Fathi Essalmi 1, Leila Jemni Ben Ayed 1, Mohamed Jemni 1, Kinshuk 2, and Sabine Graf 2 1 The Research Laboratory of Technologies of Information and Communication
Leader s Guide: Dream Big and Plan for Success
 Leader s Guide: Dream Big and Plan for Success The goal of this lesson is to: Provide a process for Managers to reflect on their dream and put it in terms of business goals with a plan of action and weekly
Probability estimates in a scenario tree
 101 Chapter 11 Probability estimates in a scenario tree An expert is a person who has made all the mistakes that can be made in a very narrow field. Niels Bohr (1885 1962) Scenario trees require many numbers.
Physics 270: Experimental Physics
 2017 edition Lab Manual Physics 270 3 Physics 270: Experimental Physics Lecture: Lab: Instructor: Office: Email: Tuesdays, 2 3:50 PM Thursdays, 2 4:50 PM Dr. Uttam Manna 313C Moulton Hall umanna@ilstu.edu
Ph.D. in Behavior Analysis Ph.d. i atferdsanalyse
 Program Description Ph.D. in Behavior Analysis Ph.d. i atferdsanalyse 180 ECTS credits Approval Approved by the Norwegian Agency for Quality Assurance in Education (NOKUT) on the 23rd April 2010 Approved
Lab 1 - The Scientific Method
 Lab 1 - The Scientific Method As Biologists we are interested in learning more about life. Through observations of the living world we often develop questions about various phenomena occurring around us.
AGN 331 Soil Science. Lecture & Laboratory. Face to Face Version, Spring, Syllabus
 AGN 331 Soil Science Lecture & Laboratory Face to Face Version, Spring, 2011 Syllabus Contact Information: J. Leon Young Office number: 936-468-4544 Soil Plant Analysis Lab: 936-468-4500 Agriculture Department,
Modeling user preferences and norms in context-aware systems
 Modeling user preferences and norms in context-aware systems Jonas Nilsson, Cecilia Lindmark Jonas Nilsson, Cecilia Lindmark VT 2016 Bachelor's thesis for Computer Science, 15 hp Supervisor: Juan Carlos
The Good Judgment Project: A large scale test of different methods of combining expert predictions
 The Good Judgment Project: A large scale test of different methods of combining expert predictions Lyle Ungar, Barb Mellors, Jon Baron, Phil Tetlock, Jaime Ramos, Sam Swift The University of Pennsylvania
A Context-Driven Use Case Creation Process for Specifying Automotive Driver Assistance Systems
 A Context-Driven Use Case Creation Process for Specifying Automotive Driver Assistance Systems Hannes Omasreiter, Eduard Metzker DaimlerChrysler AG Research Information and Communication Postfach 23 60
Business. Pearson BTEC Level 1 Introductory in. Specification
 Pearson BTEC Level 1 Introductory in Business Specification Pearson BTEC Level 1 Introductory Certificate in Business Pearson BTEC Level 1 Introductory Diploma in Business Pearson BTEC Level 1 Introductory
M55205-Mastering Microsoft Project 2016
 M55205-Mastering Microsoft Project 2016 Course Number: M55205 Category: Desktop Applications Duration: 3 days Certification: Exam 70-343 Overview This three-day, instructor-led course is intended for individuals
EECS 571 PRINCIPLES OF REAL-TIME COMPUTING Fall 10. Instructor: Kang G. Shin, 4605 CSE, ;
 EECS 571 PRINCIPLES OF REAL-TIME COMPUTING Fall 10 Instructor: Kang G. Shin, 4605 CSE, 763-0391; kgshin@umich.edu Number of credit hours: 4 Class meeting time and room: Regular classes: MW 10:30am noon
Visual CP Representation of Knowledge
 Visual CP Representation of Knowledge Heather D. Pfeiffer and Roger T. Hartley Department of Computer Science New Mexico State University Las Cruces, NM 88003-8001, USA email: hdp@cs.nmsu.edu and rth@cs.nmsu.edu
Lecture 1: Basic Concepts of Machine Learning
 Lecture 1: Basic Concepts of Machine Learning Cognitive Systems - Machine Learning Ute Schmid (lecture) Johannes Rabold (practice) Based on slides prepared March 2005 by Maximilian Röglinger, updated 2010
Introduction to Simulation
 Introduction to Simulation Spring 2010 Dr. Louis Luangkesorn University of Pittsburgh January 19, 2010 Dr. Louis Luangkesorn ( University of Pittsburgh ) Introduction to Simulation January 19, 2010 1 /
Lecture 2: Quantifiers and Approximation
 Lecture 2: Quantifiers and Approximation Case study: Most vs More than half Jakub Szymanik Outline Number Sense Approximate Number Sense Approximating most Superlative Meaning of most What About Counting?
AQUA: An Ontology-Driven Question Answering System
 AQUA: An Ontology-Driven Question Answering System Maria Vargas-Vera, Enrico Motta and John Domingue Knowledge Media Institute (KMI) The Open University, Walton Hall, Milton Keynes, MK7 6AA, United Kingdom.
This Performance Standards include four major components. They are
 Environmental Physics Standards The Georgia Performance Standards are designed to provide students with the knowledge and skills for proficiency in science. The Project 2061 s Benchmarks for Science Literacy
Protocols for building an Organic Chemical Ontology
 The European Learning Grid Infrastructure based on GRID technologies for supporting ubiquitous, collaborative, experiental-based, contextualised and personalised learning http://www.elegi.org Protocols
AUTHORITATIVE SOURCES ADULT AND COMMUNITY LEARNING LEARNING PROGRAMMES
 AUTHORITATIVE SOURCES ADULT AND COMMUNITY LEARNING LEARNING PROGRAMMES AUGUST 2001 Contents Sources 2 The White Paper Learning to Succeed 3 The Learning and Skills Council Prospectus 5 Post-16 Funding
Operational Knowledge Management: a way to manage competence
 Operational Knowledge Management: a way to manage competence Giulio Valente Dipartimento di Informatica Universita di Torino Torino (ITALY) e-mail: valenteg@di.unito.it Alessandro Rigallo Telecom Italia
Ministry of Education, Republic of Palau Executive Summary
 Ministry of Education, Republic of Palau Executive Summary Student Consultant, Jasmine Han Community Partner, Edwel Ongrung I. Background Information The Ministry of Education is one of the eight ministries
Simple Random Sample (SRS) & Voluntary Response Sample: Examples: A Voluntary Response Sample: Examples: Systematic Sample Best Used When
 & Voluntary Response Sample: Examples: A Voluntary Response Sample: Examples: Systematic Sample Best Used When") Simple Random Sample (SRS) & Voluntary Response Sample: In statistics, a simple random sample is a group of people who have been chosen at random from the general population. A simple random sample is
Simple Random Sample (SRS) & Voluntary Response Sample: In statistics, a simple random sample is a group of people who have been chosen at random from the general population. A simple random sample is
GEOG 473/573: Intermediate Geographic Information Systems Department of Geography Minnesota State University, Mankato
 GEOG 473/573: Intermediate Geographic Information Systems Department of Geography Minnesota State University, Mankato Syllabus Spring 2014 ----------------------------------------------------------------------------------------------------------------------------------
Radius STEM Readiness TM
 Curriculum Guide Radius STEM Readiness TM While today s teens are surrounded by technology, we face a stark and imminent shortage of graduates pursuing careers in Science, Technology, Engineering, and
What is PDE? Research Report. Paul Nichols
 What is PDE? Research Report Paul Nichols December 2013 WHAT IS PDE? 1 About Pearson Everything we do at Pearson grows out of a clear mission: to help people make progress in their lives through personalized
elearning OVERVIEW GFA Consulting Group GmbH 1
 elearning OVERVIEW 23.05.2017 GFA Consulting Group GmbH 1 Definition E-Learning E-Learning means teaching and learning utilized by electronic technology and tools. 23.05.2017 Definition E-Learning GFA
Algebra 2- Semester 2 Review
 Name Block Date Algebra 2- Semester 2 Review Non-Calculator 5.4 1. Consider the function f x 1 x 2. a) Describe the transformation of the graph of y 1 x. b) Identify the asymptotes. c) What is the domain
Measures of the Location of the Data
 OpenStax-CNX module m46930 1 Measures of the Location of the Data OpenStax College This work is produced by OpenStax-CNX and licensed under the Creative Commons Attribution License 3.0 The common measures
Android App Development for Beginners
 Description Android App Development for Beginners DEVELOP ANDROID APPLICATIONS Learning basics skills and all you need to know to make successful Android Apps. This course is designed for students who
FIGURE IT OUT! MIDDLE SCHOOL TASKS. Texas Performance Standards Project
 FIGURE IT OUT! MIDDLE SCHOOL TASKS π 3 cot(πx) a + b = c sinθ MATHEMATICS 8 GRADE 8 This guide links the Figure It Out! unit to the Texas Essential Knowledge and Skills (TEKS) for eighth graders. Figure
STRATEGIC LEADERSHIP PROCESSES
 STRATEGIC LEADERSHIP PROCESSES COURSE: MANA 5345.060, Fall 2016 (Online Class) DURATION: Start Date: 08/29/2016 End Date: 12/17/2016 FACULTY: TEXTBOOK: Dr. Marina Astakhova, PhD Office: BUS 123 Phone:
Science Fair Project Handbook
 Science Fair Project Handbook IDENTIFY THE TESTABLE QUESTION OR PROBLEM: a) Begin by observing your surroundings, making inferences and asking testable questions. b) Look for problems in your life or surroundings
Every curriculum policy starts from this policy and expands the detail in relation to the specific requirements of each policy s field.
 1. WE BELIEVE We believe a successful Teaching and Learning Policy enables all children to be effective learners; to have the confidence to take responsibility for their own learning; understand what it
White Paper. The Art of Learning
 The Art of Learning Based upon years of observation of adult learners in both our face-to-face classroom courses and using our Mentored Email 1 distance learning methodology, it is fascinating to see how
Student Transportation
 The district has not developed systems to evaluate transportation activities and improve operations. In addition, the district needs to systematically replace its aging buses. Conclusion The Manatee County
Space Travel: Lesson 2: Researching your Destination
 Published on AASL Learning4Life Lesson Plan Database Space Travel: Lesson 2: Researching your Destination Created by: Angie Mitchell Title/Role: Media Specialist Organization/School Name: Level Cross Elementary
Problem Solving for Success Handbook. Solve the Problem Sustain the Solution Celebrate Success
 Problem Solving for Success Handbook Solve the Problem Sustain the Solution Celebrate Success Problem Solving for Success Handbook Solve the Problem Sustain the Solution Celebrate Success Rod Baxter 2015
THE DEPARTMENT OF DEFENSE HIGH LEVEL ARCHITECTURE. Richard M. Fujimoto
 THE DEPARTMENT OF DEFENSE HIGH LEVEL ARCHITECTURE Judith S. Dahmann Defense Modeling and Simulation Office 1901 North Beauregard Street Alexandria, VA 22311, U.S.A. Richard M. Fujimoto College of Computing
THE WEB 2.0 AS A PLATFORM FOR THE ACQUISITION OF SKILLS, IMPROVE ACADEMIC PERFORMANCE AND DESIGNER CAREER PROMOTION IN THE UNIVERSITY
 THE WEB 2.0 AS A PLATFORM FOR THE ACQUISITION OF SKILLS, IMPROVE ACADEMIC PERFORMANCE AND DESIGNER CAREER PROMOTION IN THE UNIVERSITY F. Felip Miralles, S. Martín Martín, Mª L. García Martínez, J.L. Navarro
Case study Norway case 1
 Case study Norway case 1 School : B (primary school) Theme: Science microorganisms Dates of lessons: March 26-27 th 2015 Age of students: 10-11 (grade 5) Data sources: Pre- and post-interview with 1 teacher
School Leadership Rubrics
 School Leadership Rubrics The School Leadership Rubrics define a range of observable leadership and instructional practices that characterize more and less effective schools. These rubrics provide a metric
Ricopili: Postimputation Module. WCPG Education Day Stephan Ripke / Raymond Walters Toronto, October 2015
 Ricopili: Postimputation Module WCPG Education Day Stephan Ripke / Raymond Walters Toronto, October 2015 Ricopili Overview Ricopili Overview postimputation, 12 steps 1) Association analysis 2) Meta analysis
Measurement & Analysis in the Real World
 Measurement & Analysis in the Real World Tools for Cleaning Messy Data Will Hayes SEI Robert Stoddard SEI Rhonda Brown SEI Software Solutions Conference 2015 November 16 18, 2015 Copyright 2015 Carnegie
Reinforcement Learning by Comparing Immediate Reward
 Reinforcement Learning by Comparing Immediate Reward Punit Pandey DeepshikhaPandey Dr. Shishir Kumar Abstract This paper introduces an approach to Reinforcement Learning Algorithm by comparing their immediate
Rover Races Grades: 3-5 Prep Time: ~45 Minutes Lesson Time: ~105 minutes
 Rover Races Grades: 3-5 Prep Time: ~45 Minutes Lesson Time: ~105 minutes WHAT STUDENTS DO: Establishing Communication Procedures Following Curiosity on Mars often means roving to places with interesting
BUILD-IT: Intuitive plant layout mediated by natural interaction
 BUILD-IT: Intuitive plant layout mediated by natural interaction By Morten Fjeld, Martin Bichsel and Matthias Rauterberg Morten Fjeld holds a MSc in Applied Mathematics from Norwegian University of Science
Detecting Wikipedia Vandalism using Machine Learning Notebook for PAN at CLEF 2011
 Detecting Wikipedia Vandalism using Machine Learning Notebook for PAN at CLEF 2011 Cristian-Alexandru Drăgușanu, Marina Cufliuc, Adrian Iftene UAIC: Faculty of Computer Science, Alexandru Ioan Cuza University,
MATH 205: Mathematics for K 8 Teachers: Number and Operations Western Kentucky University Spring 2017
 MATH 205: Mathematics for K 8 Teachers: Number and Operations Western Kentucky University Spring 2017 INSTRUCTOR: Julie Payne CLASS TIMES: Section 003 TR 11:10 12:30 EMAIL: julie.payne@wku.edu Section
1 Use complex features of a word processing application to a given brief. 2 Create a complex document. 3 Collaborate on a complex document.
 National Unit specification General information Unit code: HA6M 46 Superclass: CD Publication date: May 2016 Source: Scottish Qualifications Authority Version: 02 Unit purpose This Unit is designed to
Houghton Mifflin Online Assessment System Walkthrough Guide
 Houghton Mifflin Online Assessment System Walkthrough Guide Page 1 Copyright 2007 by Houghton Mifflin Company. All Rights Reserved. No part of this document may be reproduced or transmitted in any form
Laboratorio di Intelligenza Artificiale e Robotica
 Laboratorio di Intelligenza Artificiale e Robotica A.A. 2008-2009 Outline 2 Machine Learning Unsupervised Learning Supervised Learning Reinforcement Learning Genetic Algorithms Genetics-Based Machine Learning
CEFR Overall Illustrative English Proficiency Scales
 CEFR Overall Illustrative English Proficiency s CEFR CEFR OVERALL ORAL PRODUCTION Has a good command of idiomatic expressions and colloquialisms with awareness of connotative levels of meaning. Can convey
REGULATIONS RELATING TO ADMISSION, STUDIES AND EXAMINATION AT THE UNIVERSITY COLLEGE OF SOUTHEAST NORWAY
 REGULATIONS RELATING TO ADMISSION, STUDIES AND EXAMINATION AT THE UNIVERSITY COLLEGE OF SOUTHEAST NORWAY Authorisation: Passed by the Joint Board at the University College of Southeast Norway on 18 December
University of Groningen. Systemen, planning, netwerken Bosman, Aart
 University of Groningen Systemen, planning, netwerken Bosman, Aart IMPORTANT NOTE: You are advised to consult the publisher's version (publisher's PDF) if you wish to cite from it. Please check the document
Coding II: Server side web development, databases and analytics ACAD 276 (4 Units)
") Coding II: Server side web development, databases and analytics ACAD 276 (4 Units) Objective From e commerce to news and information, modern web sites do not contain thousands of handcoded pages. Sites
Coding II: Server side web development, databases and analytics ACAD 276 (4 Units) Objective From e commerce to news and information, modern web sites do not contain thousands of handcoded pages. Sites
Citrine Informatics. The Latest from Citrine. Citrine Informatics. The data analytics platform for the physical world
 Citrine Informatics The data analytics platform for the physical world The Latest from Citrine Summit on Data and Analytics for Materials Research 31 October 2016 Our Mission is Simple Add as much value
LEGO MINDSTORMS Education EV3 Coding Activities
 LEGO MINDSTORMS Education EV3 Coding Activities s t e e h s k r o W t n e d Stu LEGOeducation.com/MINDSTORMS Contents ACTIVITY 1 Performing a Three Point Turn 3-6 ACTIVITY 2 Written Instructions for a
Is operations research really research?
 Volume 22 (2), pp. 155 180 http://www.orssa.org.za ORiON ISSN 0529-191-X c 2006 Is operations research really research? NJ Manson Received: 2 October 2006; Accepted: 1 November 2006 Abstract This paper
Word Segmentation of Off-line Handwritten Documents
 Word Segmentation of Off-line Handwritten Documents Chen Huang and Sargur N. Srihari {chuang5, srihari}@cedar.buffalo.edu Center of Excellence for Document Analysis and Recognition (CEDAR), Department
Conversation Starters: Using Spatial Context to Initiate Dialogue in First Person Perspective Games
 Conversation Starters: Using Spatial Context to Initiate Dialogue in First Person Perspective Games David B. Christian, Mark O. Riedl and R. Michael Young Liquid Narrative Group Computer Science Department
Individual Component Checklist L I S T E N I N G. for use with ONE task ENGLISH VERSION
 L I S T E N I N G Individual Component Checklist for use with ONE task ENGLISH VERSION INTRODUCTION This checklist has been designed for use as a practical tool for describing ONE TASK in a test of listening.
Mining Association Rules in Student s Assessment Data
 www.ijcsi.org 211 Mining Association Rules in Student s Assessment Data Dr. Varun Kumar 1, Anupama Chadha 2 1 Department of Computer Science and Engineering, MVN University Palwal, Haryana, India 2 Anupama
Tap vs. Bottled Water
 Tap vs. Bottled Water CSU Expository Reading and Writing Modules Tap vs. Bottled Water Student Version 1 CSU Expository Reading and Writing Modules Tap vs. Bottled Water Student Version 2 Name: Block:
STA 225: Introductory Statistics (CT)
") Marshall University College of Science Mathematics Department STA 225: Introductory Statistics (CT) Course catalog description A critical thinking course in applied statistical reasoning covering basic
Marshall University College of Science Mathematics Department STA 225: Introductory Statistics (CT) Course catalog description A critical thinking course in applied statistical reasoning covering basic