ARL Stat i s t i c s Compiled and Edited by
|
|
|
- Daniela Richardson
- 5 years ago
- Views:
Transcription

1 ARL Stat i s t i c s Compiled and Edited by Martha Kyrillidou Les Bland Association of Research Libraries Wa s h i n g t o n, DC 2008
2 ARL Statistics The tables presented in this publication are not indicative of performance and outcomes and should not be used as measures of library quality. In comparing any individual library to ARL medians or to other ARL members, one must be careful to make such comparisons within the context of differing institutional and local goals and characteristics. The ARL Statistics datafiles and accompanying documentation are available at annualsurveys/arlstats/index.shtml. Published by the Association of Research Libraries Washington, DC ISSN print ISSN online ISBN EAN The compilation is copyrighted by the Association of Research Libraries. Blanket permission is granted to reproduce and distribute copies of this work for nonprofit, educational, or library purposes, provided that the author, source, and copyright notice are included on each copy. This permission is in addition to rights of reproduction granted under Sections 107, 108, and other provisions of the US Copyright Act. The paper used in this publication meets the minimum requirements of the American National Standard for Information Science and National Information Standards Organization standard Permanence of Paper for Publications and Documents in Libraries and Archives, ANSI/NISO Z (R1997).
3 CONTENTS Research Library Trends...5 Research Library Trends Tables 1. Service Trends in ARL Libraries, Median Monograph and Serial Expenditures in ARL Libraries, Supply and Demand in ARL Libraries, Expenditure Trends in ARL Libraries, Resources per Student in ARL University Libraries, Electronic Resources Expenditures in ARL University Libraries, a. Electronic Resources and Materials Expenditures in ARL University Libraries, b. Electronic Resources and Materials Expenditures in ARL University Libraries, Research Library Trends Graphs 1. Service Trends in ARL Libraries, Median Monograph and Serial Expenditures in ARL Libraries, Supply and Demand in ARL Libraries, Expenditure Trends in ARL Libraries, Resources per Student in ARL University Libraries, Electronic Resources vs. Total Materials Expenditures, ARL Statistics Interactive Edition...22 ARL Library Data Tables, Collections Part Summary Data Collections Part Summary Data Expenditures...36 Summary Data Electronic Resources Expenditures...44 Summary Data Personnel and Public Services...52 Summary Data Analysis of Selected Variables of University Libraries,
4 Ph.D., Faculty, and Enrollment Statistics...61 Summary Data Rank Order Tables of University Libraries, Summary of Rank Order Tables...66 Individual Tables 1. Volumes in Library Volumes Added (Gross) Current Serials (Total) Microform Units Government Documents Total Library Materials Expenditures Total Salaries & Wages Expenditures Other Operating Expenditures Total Library Expenditures Monographs Purchased (Volumes) Expenditures for Monographs Current Serials Purchased (Titles) Expenditures for Current Serials Total Items Loaned (ILL/DD) Total Items Borrowed (ILL/DD) Professional Staff (FTE) Support Staff (FTE) Total Staff (FTE) Expenditures for Electronic Resources Electronic Resources as a Percent of Total Library Materials Library Investment Index...90 ARL Statistics Questionnaire, : Instructions for Completing the Questionnaire...91 ARL Statistics Worksheet...99 Footnotes to the ARL Statistics, Appendix A: ARL Member Libraries as of January 1, Appendix B: Bibliography...135
.")


5 Research Library Trends ARL Statistics is the latest in a series of annual publications that describe collections, staffing, expenditures, and service activities for the 123 members of the Association of Research Libraries (ARL). Of these, 113 are university libraries; the remaining 10 are public, governmental, and nonprofit research libraries. ARL member libraries are the largest research libraries in North America, representing 16 Canadian and 107 US research institutions. The academic libraries, which comprise about 92% of the membership, include 14 Canadian and 99 US libraries. Statistics have been collected and published annually for the members of the Association of Research Libraries since , and the data are available through an interactive Web interface. Prior to , annual statistics for university libraries were collected by James Gerould, first at the University of Minnesota and later at Princeton University. 1 These data, covering the years through , are now called the Gerould statistics. 2 The whole data series from 1908, which is available on the ARL FTP server, 3 represents the oldest and most comprehensive continuing library statistical series in North America. ARL libraries are a relatively small subset of libraries in North America, but they do account for a large portion of academic library resources in terms of assets, budgets, and the number of users they serve. The total library expenditures of all 123 member libraries in was more than $3.9 billion; from that, roughly $2.9 billion was spent by the 113 university libraries and more than $866 million by the nonuniversity libraries. The pie charts below show how the two types of libraries divide these expenditures differently. University Libraries Nonuniversity Libraries Other Operating Expenditures 12% Library Materials 41% Other Operating Expenditures 40% Library Materials 7% Contract Binding 0.2% Total Salaries 46% Contract Binding 0.7% Total Salaries 53% 1 Kendon L. Stubbs and Robert E. Molyneux, Research Library Statistics through (Washington, DC: ARL, 1990). 2 Robert E. Molyneux, The Gerould Statistics 1907/ /62. (Washington, DC: ARL, 1986) Research Library Trends 5
6 Change in Counting Serials This year the definition of counting serials in the ARL Statistics was changed from serials subscriptions we changed to counting serial titles. As a result the trend line of publishing serial cost per subscription is being discontinued and eventually a new one will emerge as we collect annual data on serial titles. This change though simple at first glance is very important as it makes the concept of serials more meaningful in the electronic environment. What prompted this change? In earlier years the instructions for reporting serials were that libraries report the total number of subscriptions, not titles, but electronic serials acquired as part of an aggregated package (such as MUSE or Academic s IDEAL) were to be counted by title. Directors and other staff have expressed concern that the serials count was problematic since many libraries engage in multiple consortia arrangements and the serials count was inflated by duplicate titles held in multiple packages. The Statistics and Assessment Committee determined that a new way of counting serials focusing on titles would provide better descriptive data reflecting the true scope of the content provided by research libraries. A pilot at various ARL libraries demonstrated the feasibility of the new method. In the electronic environment once you own or lease a title, it is often accessible by all users so a more authentic descriptive statistic for the scope of the content is titles rather than subscriptions. A unique title count favors broader coverage. Any duplication of those titles through packages, aggregations, bundles, etc., becomes more a management issue. The new definition asks that titles be reported as electronic if available both in print and electronic formats and they be reported as purchased if available both through purchased and non-purchased arrangements. So, if a title appears in both print and electronic form and a library has acquired it through several different providers, it would be counted as one title. Training events were delivered last fall to ensure that there is a well-grounded, shared understanding of the new definitions. The outcome has been successful as we have more libraries reporting serials titles than they ever managed to report serial subscriptions indicating that the new definition is moving us into the right direction of having data that are both collectable and useful. However, we had to delete all earlier trend lines that were based on serial subscriptions. A variety of resources have been developed for libraries to consult as they implemented the change and they are available through 6 ARL Statistics
7 Research Library Trends Tables and Graphs Research Library Trends 7
8 Table 1 Service Trends in ARL Libraries, Median Values for Time-Series Trends Year ILL: Group Participants Reference Initial Total Ratio of Circ. Total Total Borrowed Pres. In Pres. Trans. Circ. Circ. Init./Tot. Staff Students (Libraries) (103) (84) (82) (79) (36) (80) (34) (105) (103) , , , , , , , , , , , , , , , , , , , , , , , , , , , , , , , , , , , , , , , , , , , , , , , , , , , , , , , , , , , , , , , , , , , ,350 95, , , , , ,516 89, , , , , ,864 84, , , , , ,782 65, , , , , ,051 67, , , , , ,417 61, , , ,874 Average annual % change 6.1% 3.1% 4.5% -4.3% % % Table 1 presents data about select public service activities such as circulation (initial and total), reference transactions, library instruction (group presentations and participants in these presentations), and interlibrary borrowing and lending. As seen in table 1, the median of group presentations dropped slightly during However, the number of participants increased with a median of 14,417 for the typical research library. Perhaps what is of most interest is that by 2007 there were double the participants compared to 1991 (see Graph 1). 8 ARL Statistics
9 Graph 1 Service Trends in ARL Libraries, % 160% Interlibrary Borrowing (+158%) % Change Since % 120% 100% 80% 60% 40% 20% Participants in Group Presentations (+102%) Group Presentations (+63%) Circulation Ratio: Total Initial to Total Students (+26%) (+25%) 0% -20% -40% Total Staff (-2%) Total Circulation** (-10%) Initial Circulation** (-25%) -60% ** Total Circulation includes Initial and Renewals but excludes Reserve Circulation Source: ARL Statistics , Association of Research Libraries, Washington, DC Reference Transactions (-51%) Research Library Trends 9
10 Table 2 Median Monograph and Serial Expenditures in ARL Libraries, Median Values for Time-Series Trends Year Serial Monograph Monograph Monographs Expenditures Unit Cost Expenditures Purchased (Libraries) (100) (57) (97) (58) 1986 $ 1,496,775 $ $ 1,120,645 32, $ 1,769,960 $ $ 1,064,484 26, $ 1,947,559 $ $ 1,141,226 25, $ 2,113,976 $ $ 1,106,073 27, $ 2,296,910 $ $ 1,330,747 27, $ 2,548,687 $ $ 1,400,738 27, $ 2,620,832 $ $ 1,353,865 26, $ 2,918,569 $ $ 1,295,807 25, $ 2,912,495 $ $ 1,309,807 25, $ 3,131,033 $ $ 1,365,575 25, $ 3,389,118 $ $ 1,444,015 25, $ 3,642,541 $ $ 1,460,234 28, $ 3,816,497 $ $ 1,486,764 24, $ 4,095,934 $ $ 1,506,651 25, $ 4,430,812 $ $ 1,657,349 28, $ 4,660,349 $ $ 1,864,023 30, $ 4,939,225 $ $ 1,812,826 31, $ 5,392,007 $ $ 1,873,157 33, $ 5,580,157 $ $ 1,839,412 30, $ 5,962,446 $ $ 1,784,841 30, $ 6,307,292 $ $ 2,044,272 33, $6,587,241 $ $2,097,078 36,462 Average annual % change 7.3% 3.0% 3.0% 0.5% Note that Table 2 and Graph 2 have been revised since and no longer include Serial Unit Cost or Serial Subscriptions. Beginning with , ARL libraries are reporting unduplicated counts of serial titles rather than subscriptions. 10 ARL Statistics
11 Graph 2 Median Monograph and Serial Expenditures in ARL Libraries, * 325% Serial Expenditures (+340%) 275% 225% % Change Since % 125% 75% 25% Monograph Expenditures (+87%) Monograph Unit Cost (+85%) Monographs Purchased -25% (+12%) Source: ARL Statistics , Association of Research Libraries, Washington, DC *Includes electronic resources from onward. Research Library Trends 11
12 Table 3 Supply and Demand in ARL Libraries, Median Values for Time-Series Trends Year ILL: ILL: Graduate Teaching Total Monographs Borrowed Lent Students Faculty Students Purchased (Libraries) (103) (103) (104) (101) (103) (58) ,047 16,092 2,327 1,124 16,684 32, ,387 16,318 3,078 1,195 17,029 26, ,881 17,476 3,251 1,222 17,485 25, ,547 19,638 3,312 1,285 17,866 27, ,595 20,837 3,314 1,278 17,745 27, ,397 23,285 3,310 1,295 18,290 27, ,362 22,514 3,539 1,356 18,273 26, ,489 22,740 3,745 1,281 18,450 25, ,007 24,039 3,794 1,289 18,305 25, ,472 24,864 3,914 1,308 18,209 25, ,278 25,720 3,904 1,251 18,320 25, ,264 25,463 3,942 1,263 18,166 28, ,656 27,223 3,880 1,247 18,335 24, ,942 26,837 3,933 1,255 18,609 25, ,475 27,044 3,844 1,239 18,908 28, ,902 28,950 4,159 1,279 19,102 30, ,339 29,021 4,067 1,251 19,925 31, ,146 33,421 4,167 1,268 21,132 33, ,737 33,934 4,461 1,369 21,562 30, ,729 36,325 4,595 1,355 22,047 30, ,412 36,035 4,647 1,388 22,618 33, ,813 35,838 4,709 1,451 22,874 36,462 Average annual % change 6.6% 3.9% 3.4% 1.2% 1.5% 0.5% Interlibrary borrowing and lending, which showed a marked growth in the last decade, seem to be declining. Monographs purchased are above 1986 levels for the third time in the last 22 years. 12 ARL Statistics


13 Graph 3 Supply and Demand in ARL Libraries, * Research Library Trends 13
14 Table 4 Expenditure Trends in ARL Libraries, Median Values for Time-Series Trends Unadjusted dollar figures Year Library Serial Monograph Total Operating Total Materials Exp. Exp. Salary Exp. (Libraries) (105) (100) (97) (104) (104) (105) CPI ,705,297 1,496,775 1,120,645 4,011,436 1,111,914 8,361, ,058,479 1,769,960 1,064,484 4,361,646 1,180,167 8,990, ,369,896 1,947,559 1,141,226 4,618,335 1,198,674 9,557, ,577,405 2,113,976 1,106,073 5,236,292 1,364,558 10,183, ,903,358 2,296,910 1,330,747 5,469,333 1,386,618 11,241, ,064,344 2,548,687 1,400,738 5,885,814 1,445,735 11,990, ,156,510 2,620,832 1,353,865 6,050,222 1,390,245 12,249, ,316,674 2,918,569 1,295,807 5,962,470 1,561,122 12,265, ,572,276 2,912,495 1,309,807 6,047,803 1,676,701 12,767, ,715,203 3,131,033 1,365,575 6,312,770 1,853,586 13,171, ,126,482 3,389,118 1,444,015 6,664,021 1,997,233 13,870, ,562,742 3,642,541 1,460,234 6,893,582 2,039,957 14,526, ,795,223 3,816,497 1,486,764 7,163,979 2,072,903 15,329, ,232,365 4,095,934 1,506,651 7,476,532 2,069,887 16,737, ,744,281 4,430,812 1,657,349 7,811,403 1,991,852 17,221, ,322,507 4,660,349 1,864,023 8,106,666 2,280,493 17,620, ,599,249 4,939,225 1,812,826 8,488,255 2,136,616 18,456, ,273,171 5,392,007 1,873,157 8,813,191 2,073,913 19,030, ,286,431 5,580,157 1,839,412 9,015,741 2,274,878 19,953, ,801,962 5,962,446 1,784,841 9,268,364 2,243,592 20,663, ,174,734 6,307,292 2,044,272 9,647,695 2,540,171 21,694, ,600,793 6,587,241 2,097,078 9,940,406 2,549,139 22,810, Average annual % change 6.5% 7.3% 3.0% 4.4% 4.0% 4.9% 3.1% Operating expenditures, including many automation expenditures, have doubled since 1986, but during the last five years have remained at relatively stable levels of investment. The total salary expenditures median has increased only slightly over the past four years. Monograph expenditures continue to increase. The annual consumer price index (CPI), included in Graph 4, provides a comparative reference for the increases in library expenditures. 14 ARL Statistics


15 Graph 4 Expenditure Trends in ARL Libraries, Research Library Trends 15
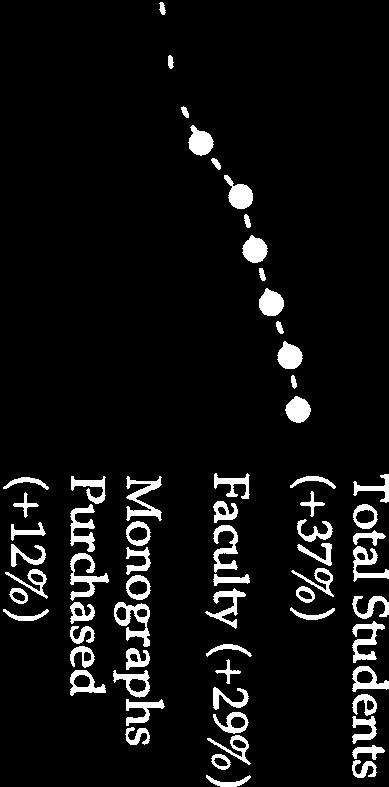
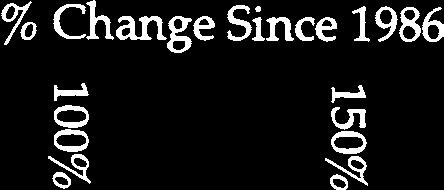
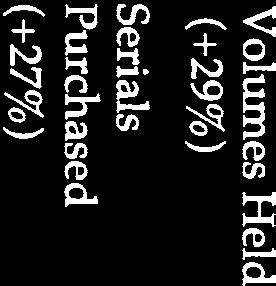
16 Table 5 Resources per Student in ARL University Libraries, Median of Ratio Values for Time-Series Trends Year ILL: Volumes Volumes Total Monographs Borrowed Held Added (Gross) Staff Purchased (Libraries) (102) (103) (103) (103) (57) Average annual % change 4.8% 1.2% -0.8% -1.6% -1.7% Over the 22-year period since 1986, ARL libraries are acquiring 30% fewer monographs per student. Libraries reported fewer staff per student in 2006 as compared to 1986: in 2007, there was a median number of 11.4 total staff per 1,000 students, compared to the 1986 figure of 16 per 1, ARL Statistics


17 Graph 5 Resources per Student in ARL University Libraries, Research Library Trends 17
18 Table 6 Electronic Resources Expenditures in ARL University Libraries, Sum Number Reporting Expenditures for Computer Files (one-time/monographic purchase) $59,808, Expenditures for Electronic Serials $476,225, Expenditures for Bibliographic Utilities, Networks, etc. (Library) $26,771, Expenditures for Bibliographic Utilities, Networks, etc. (External) $18,931, Expenditures for Hardware and Software 75,169, Expenditures for Document Delivery/Interlibrary Loan 12,849, Table 6 contains data on several items which previously had been collected only in the ARL Supplementary Statistics. These data are especially useful because they reflect monies spent on all electronic serials, while the ARL Statistics categories of serials purchased and serials expenditures include only those journals that provide full-text electronic versions to their subscribers. The Expenditures for Electronic Serials time series may be viewed as an alternative to the Serials Purchased series, both figures reflecting in their own way the influence the electronic serial is gaining in the modern research library. Not only have electronic materials expenditures grown sharply in the past decade, they have grown at a rate far exceeding that of library materials expenditures overall. As shown in Graph 6, in every year of the last decade electronic materials expenditures have grown sharply, anywhere between two and ten times faster than materials expenditures have. The average ARL university library now spends just under 47% of its materials budget on electronic materials (Tables 7A and 7B) and 50 ARL libraries report that they spent more than 50% of their materials budget on electronic materials (see Rank Order Table 20). 18 ARL Statistics


19 Graph 6 Electronic Resources vs. Total Materials Expenditures, Yearly Increases in Average % % % 32.34% 31.99% % 22.50% 24.81% 27.06% 24.29% 23.85% 20.78% % % 9.18% 9.12% % % 4.18% 5.53% 6.35% 3.40% 5.92% 3.38% 6.93% 3.39% 7.53% 6.06% Increase in Average Library Materials Expenditures Increase in Average Electronic Resources Expenditures Research Library Trends 19
20 Table 7a Electronic Resources and Materials Expenditures in ARL University Libraries, * * a. Computer File Expenditures (monographic/onetime) Total 14,147,625 20,132,553 22,030,727 24,639,822 8,013,055 11,189,103 10,848,219 14,727,984 15,297,096 16,748,194 Average 172, , , ,126 87, , , , , ,482 Median 148, , , ,178 47,932 52,311 54,024 98,657 72,070 82,566 N b. Electronic Serial Expenditures Total N/A N/A 11,847,577 15,170,971 40,956,696 49,497,141 67,124,554 84,343, ,415, ,418,679 Average N/A N/A 188, , , , , ,873 1,118,244 1,429,803 Median N/A N/A 156, , , , , , ,067 1,272,965 N c. Total Electronic Resources (Total a+b) Total 14,147,625 20,132,553 33,878,304 39,810,793 50,512,984 60,686,244 77,972,773 99,071, ,712, ,166,873 Average 172, , , , , , , ,541 1,252,007 1,556,062 Median 148, , , , , , , ,210 1,129,298 1,377,874 N Total Library Materials Expenditures** Total 393,271, ,287, ,496, ,145, ,123, ,600, ,623, ,321, ,778, ,930,849 Average 4,795,989 5,003,384 5,427,797 5,654,911 6,174,266 6,515,692 6,929,744 7,364,967 7,818,668 8,281,189 Median 4,242,887 4,527,122 4,714,384 4,975,353 5,529,606 5,643,070 5,991,177 6,545,146 7,028,134 7,566,727 N Electronic Resources Expenditures as a Percent of Total Materials Expenditures Average Median N/A N Expenditures for Bibliographic Utilities, Networks, etc. (External) Total N/A N/A N/A N/A $3,827,348 4,695,737 7,442,962 9,523,348 14,655,078 20,373,560 Average N/A N/A N/A N/A $136, , , , , ,449 Median N/A N/A N/A N/A $120, , , , , ,690 N *In a recent review of past Supplementary Statistics data, some figures previously published in these columns were found to be incorrect and subsequently revised. **Figures reflect Materials Expenditures only from those institutions that reported nonzero figures for Total Electronic Resources. 20 ARL Statistics
21 Table 7b Electronic Resources and Materials Expenditures in ARL University Libraries, a. Computer File Expenditures (monographic/onetime) Total $23,275,683 $32,098,404 $38,744,076 $48,793,981 $59,808,658 Average $225,978 $314,690 $372,539 $478,372 $558,959 Median $111,266 $191,148 $210,576 $336,338 $352,802 N b. Electronic Serial Expenditures Total $205,300,292 $269,601,241 $328,166,027 $383,127,163 $476,225,086 Average $1,849,552 $2,450,920 $3,038,574 $3,547,474 $4,290,316 Median $1,649,361 $2,348,463 $2,824,962 $3,349,709 $4,240,530 N c. Total Electronic Resources (Total a+b) Total $228,575,974 $301,699,645 $366,910,103 $431,921,144 $536,033,744 Average $2,059,243 $2,718,015 $3,366,147 $3,962,579 $4,786,016 Median $1,775,865 $2,705,847 $3,144,841 $3,792,873 $4,661,123 N Total Library Materials Expenditures** Total $950,275,167 $1,016,121,605 $1,031,619,722 $1,031,619,722 $1,219,796,179 Average $8,561,038 $9,154,249 $9,464,401 $9,464,401 $10,794,656 Median $7,707,153 $8,276,175 $8,662,668 $8,662,668 $9,594,560 N Electronic Resources Expenditures as a Percent of Total Materials Expenditures Average Median N Expenditures for Bibliographic Utilities, Networks, etc. (External) + Total $21,470,716 $17,420,520 $16,082,790 + $15,930,476 $18,931,797 Average $438,178 $335,010 $349,626 + $318,610 $225,379 Median $250,000 $94,837 $149,396 + $143,649 $33,247 N ** Figures reflect Materials Expenditures only from those institutions that reported nonzero figures for Total Electronic Resources. Research Library Trends 21
22 ARL Statistics Interactive Edition The ARL Statistics are available through an interactive edition on the Web, supplementing previously available data from Maintained and supported by the Geospatial and Statistical Data Center at the University of Virginia, this site offers researchers access to ARL Statistics with documentation. 4 The site offers maps and graphics depicting current library trends. For the particularly adventurous, the site links to an interactive graphics and statistics page, allowing users to manipulate their data queries. One may chose univariate, bivariate, or multivariate statistics in addition to a vast array of selections with which to customize a query. The interactive pages also include options for regional aggregates, customized samples of observations, simple rank order tabulations of data, and the ability to create ratios of any two variables. These and other capabilities are located at The ARL Statistics datafiles since 1908 can be retrieved in spreadsheet format from annualsurveys/arlstats/mrstat.shtml. The ARL Statistics and Measurement Program Web site is located at 4 For more information on the ARL Statistics Interactive Edition, see Martha Kyrillidou, To Describe and Measure the Performance of North American Research Libraries, IFLA Journal 27 (2001): ARL Statistics
23 ARL Li b r a r y Da t a Ta b l e s
24 Collections Part 1 Volumes In Library Volumes Added (Gross) Volumes Added (Net) Monographs Purchased (Volumes) Current Serials Total (Survey Question Number) (1) (1b.i) (1b) (2) (4) INSTITUTION Notes ALABAMA bglm+ 2,835,808 46,035 38,877 22,903 44,079 ALBERTA G+ 6,720, , ,955 UA/NA 45,110 ARIZONA bglm+ 5,632,559 82,344-34,354 38,670 75,181 ARIZONA STATE BGL+ 4,342,425 93,623 83,215 61,036 82,862 AUBURN G+ 3,016,986 34,484 32,707 16,548 36,635 BOSTON LM+ 2,463,324 47,105 13,767 14,514 45,264 BOSTON COLLEGE bl+ 2,446,744 50,137 33,210 31,328 31,714 BRIGHAM YOUNG GL+ 3,908, , , ,172 54,183 BRITISH COLUMBIA G+ 5,929, , ,070 UA/NA 67,827 BROWN bg+ 3,720,244 74,085 72,267 51,967 54,050 CALIFORNIA, BERKELEY GL+ 10,725, , ,748 UA/NA 87,265 CALIFORNIA, DAVIS GLM+ 3,599,983 81,543 50,979 UA/NA 42,592 CALIFORNIA, IRVINE bgm+ 2,778,921 65,290 64,127 33,907 47,668 CALIFORNIA, LOS ANGELES GLM+ 8,272, , ,930 57,260 76,248 CALIFORNIA, RIVERSIDE G+ 2,483,202 50,266 47,906 47,706 44,025 CALIFORNIA, SAN DIEGO bgm+ 3,360, ,258 80,703 41,290 37,385 CALIFORNIA, SANTA BARBARA 2,914,539 37,484 34,245 24,639 35,544 CASE WESTERN RESERVE bglm+ 2,518,324 27,987 22, ,128 54,252 CHICAGO bglm+ 7,926, , , ,798 57,236 CINCINNATI GLM+ 3,418,599 94,815 80,446 40,340 69,609 COLORADO bgl+ 3,843,458 99,592 86,491 31,903 50,350 COLORADO STATE G+ 2,066,079 65,234 62,389 32,245 32,678 COLUMBIA GLM+ 10,004, , , , ,637 CONNECTICUT BGLM+ 3,637,190 41,666 7,613 21,740 51,007 CORNELL BGL+ 7,999, , ,509 UA/NA 92,000 DARTMOUTH GM+ 2,732,831 50,168 42,436 29,934 51,936 DELAWARE + 2,741,215 38,010 36, ,508 21,931 DUKE blm+ 5,872,136 98,905 86,640 66,344 47,122 EMORY BGLM+ 3,298,971 94,667 72,835 47,005 54,218 FLORIDA BbLM+ 4,229,717 59,624 52,595 51,053 73,747 FLORIDA STATE BbGLM+ 3,442,420 62,369 41,998 44,117 51,733 GEORGE WASHINGTON GLM+ 2,219,849 46,166 22,205 27,928 65,604 GEORGETOWN bglm+ 2,955,278 91,987 77,716 35,260 53,697 GEORGIA GL+ 4,559,220 75,494 73, ,183 80,976 GEORGIA TECH G+ 2,487,554 41,220 38,231 7,460 40,887 GUELPH BG+ 1,578,968 29,071 21,226 UA/NA 11,787 HARVARD GLM+ 15,965, ,049 22,597 UA/NA 110,463 HAWAII GLM+ 3,486,937 56,308 52,401 28,685 58,111 HOUSTON bl+ 2,558,069 79,824 53,833 65,962 42,812 HOWARD bglm+ 2,467,638 33,864 31,475 2,985 16,627 ILLINOIS, CHICAGO M+ 2,363,705 48,051 38,848 28,776 35,006 ILLINOIS, URBANA bgl+ 10,712, , ,761 70, , ARL Statistics
25 Collections Part 1 Current Serials Purchased Current Serials Purchased Electronic Current Serials Purchased Print Current Serials Not Purchased Current Serials Not Purchased Electronic Current Serials Not Purchased Print (4a) (4a.i) (4a.ii) (4b) (4b.i) (4b.ii) (Survey Question Number) INSTITUTION 36,110 31,820 4,290 7,969 7, ALABAMA 31,541 20,853 10,688 13,569 UA/NA UA/NA ALBERTA 72,710 63,982 8,728 2, ,451 ARIZONA 65,586 54,726 10,860 17,276 7,260 10,016 ARIZONA STATE 15,308 13,850 1,458 21,327 20, AUBURN 42,924 35,233 7,691 2,340 2, BOSTON 23,671 17,302 6,369 8,043 7, BOSTON COLLEGE 45,796 24,101 21,695 8,387 4,149 4,238 BRIGHAM YOUNG 67,827 48,020 19,807 0 UA/NA UA/NA BRITISH COLUMBIA 36,678 34,550 2,128 17,372 17, BROWN 81,551 36,394 45,157 5, ,640 CALIFORNIA, BERKELEY 33,390 22,534 10,856 9,202 4,721 4,481 CALIFORNIA, DAVIS 31,395 27,250 4,145 16,273 15, CALIFORNIA, IRVINE UA/NA UA/NA UA/NA UA/NA UA/NA UA/NA CALIFORNIA, LOS ANGELES 32,557 29,237 3,320 11,468 7,133 4,335 CALIFORNIA, RIVERSIDE 26,582 21,287 5,295 10,803 8,347 2,456 CALIFORNIA, SAN DIEGO 24,198 16,962 7,236 11,346 4,672 6,674 CALIFORNIA, SANTA BARBARA 48,726 42,993 5,733 5,526 3,079 2,447 CASE WESTERN RESERVE 34,453 21,108 13,345 22,783 13,900 8,883 CHICAGO 67,409 58,220 9,189 2,200 1, CINCINNATI 33,342 32,164 1,178 17,008 17,008 0 COLORADO 20,366 18,454 1,912 12,312 10,980 1,332 COLORADO STATE 86,802 61,715 25,087 32,835 16,520 16,315 COLUMBIA 24,477 17,303 7,174 26,530 25, CONNECTICUT UA/NA UA/NA UA/NA UA/NA UA/NA UA/NA CORNELL 46,380 39,199 7,181 5,556 3,247 2,309 DARTMOUTH 16,918 11,843 5,075 5,013 3,509 1,504 DELAWARE 46,965 34,746 12, UA/NA UA/NA DUKE 39,113 28,006 11,107 15,105 7,683 7,422 EMORY 56,302 31,763 24,539 17,445 13,411 4,034 FLORIDA 49,903 42,526 7,377 1, ,830 FLORIDA STATE 58,795 42,991 15,804 6,809 6, GEORGE WASHINGTON 48,460 37,277 11,183 5,237 4, GEORGETOWN 50,849 42,558 8,291 30,127 25,866 4,261 GEORGIA 12,755 8,365 4,390 28,132 13,121 15,011 GEORGIA TECH 11,287 8,976 2, UA/NA UA/NA GUELPH UA/NA UA/NA UA/NA UA/NA UA/NA UA/NA HARVARD 38,993 25,325 13,668 19,118 11,651 7,467 HAWAII 39,382 24,316 15,066 3, ,422 HOUSTON 13,442 5,740 7,702 3,185 1,705 1,480 HOWARD 31,841 24,747 7,094 3,165 3,165 0 ILLINOIS, CHICAGO 98,511 66,389 32,122 9,155 6,236 2,919 ILLINOIS, URBANA Data Tables 25
26 Collections Part 1 Volumes In Library Volumes Added (Gross) Volumes Added (Net) Monographs Purchased (Volumes) Current Serials Total (Survey Question Number) (1) (1b.i) (1b) (2) (4) INSTITUTION Notes INDIANA + 7,553, , ,039 59,972 57,534 IOWA blm+ 4,765, , ,210 46,293 59,380 IOWA STATE G+ 2,500,880 44,550 27,805 28,620 58,443 JOHNS HOPKINS BGM+ 3,726,532 59,052 48,890 30,661 91,851 KANSAS BbGLM+ 4,210,639 62,438 16,356 75,980 48,212 KENT STATE BbG+ 2,809,479 55,279 51,155 12,338 17,093 KENTUCKY GLM+ 3,537,710 85,561 81,374 59,041 44,610 LAVAL G+ 2,834,119 61,874 48,909 37,034 32,158 LOUISIANA STATE GLM+ 3,548,726 54,400 23,800 67,754 86,026 LOUISVILLE BGLM+ 2,143,282 63,740 61,462 10,562 39,268 MCGILL BbG+ 4,143, , ,654 78,339 54,490 MCMASTER GM+ 2,019,006 18,107 13,726 UA/NA 41,216 MANITOBA G+ 2,235,944 52,240 45,640 37,773 29,800 MARYLAND 3,623, , ,322 45,368 60,117 MASSACHUSETTS G+ 3,529, , ,840 16,226 16,488 MIT G+ 2,847,680 43,372 40,112 22,899 22,280 MIAMI GLM+ 3,227,943 70,498 61,268 38,779 62,621 MICHIGAN GLM+ 8,414, , , ,362 71,788 MICHIGAN STATE GL+ 4,915,621 66,906 51,018 32,847 74,177 MINNESOTA bglm+ 6,867, , ,790 43,049 77,446 MISSOURI L+ 3,454,585 64,014 57,410 39,239 52,490 MONTREAL GLM+ 3,150,386 74,411 60,097 51,742 54,265 NEBRASKA GL+ 3,171,134 65,994 57,661 15,233 41,034 NEW MEXICO GLM+ 2,707,830 62,075 32,748 24,136 40,374 NEW YORK bglm+ 4,946, ,043 65,171 73,089 58,968 NORTH CAROLINA GLM+ 6,154, , ,306 69,102 56,647 NORTH CAROLINA STATE G+ 3,857, , ,632 26,560 53,404 NORTHWESTERN BGLM+ 4,768,588 92,004 80,760 42,066 64,888 NOTRE DAME bgl+ 3,322,395 79,540 75,427 45,192 68,038 OHIO BbG+ 2,913,522 83,258 55,113 34,121 39,297 OHIO STATE bglm+ 6,244, ,400 35,194 68,746 68,550 OKLAHOMA GLM+ 5,047, , ,295 31,528 55,815 OKLAHOMA STATE BGM+ 2,789,236 79,930 77,981 27,469 56,261 OREGON bgl+ 2,905,608 62,013 56,911 21,613 62,348 PENNSYLVANIA GLM+ 5,994, ,078 91,082 UA/NA 84,182 PENNSYLVANIA STATE BGLM+ 5,220, , ,226 94,929 68,876 PITTSBURGH BGLM+ 5,116, , ,041 UA/NA 48,637 PRINCETON b+ 6,778, , ,211 95,534 41,120 PURDUE G+ 2,504,803 52,779-6,294 16,809 40,073 QUEENS LM+ 2,517,328 48,389 40,191 26,355 39,823 RICE G+ 2,518,659 45,481 44,307 35,828 66,473 ROCHESTER bm+ 3,672,976 34,715 29,486 22,172 27, ARL Statistics
27 Collections Part 1 Current Serials Purchased Current Serials Purchased Electronic Current Serials Purchased Print Current Serials Not Purchased Current Serials Not Purchased Electronic Current Serials Not Purchased Print (4a) (4a.i) (4a.ii) (4b) (4b.i) (4b.ii) (Survey Question Number) INSTITUTION 51,326 29,051 22,275 6,208 2,986 3,222 INDIANA 41,388 24,130 17,258 17,992 14,348 3,644 IOWA 41,833 31,820 10,013 16,610 13,266 3,344 IOWA STATE 54,944 UA/NA UA/NA 36,907 UA/NA UA/NA JOHNS HOPKINS 34,138 25,863 8,275 14,074 8,230 5,844 KANSAS 11,592 UA/NA UA/NA 5,501 UA/NA UA/NA KENT STATE 28,116 24,679 3,437 16,494 9,784 6,710 KENTUCKY 24,293 19,420 4,873 7,865 6,180 1,685 LAVAL 72,876 71,003 1,873 13,150 13, LOUISIANA STATE 39,268 26,209 13,059 0 UA/NA UA/NA LOUISVILLE 42,493 33,025 9,468 11,997 7,472 4,525 MCGILL 30,870 27,415 3,455 10,346 8,975 1,371 MCMASTER 19,939 16,287 3,652 9,861 7,567 2,294 MANITOBA 52,268 45,171 7,097 7,849 7,843 6 MARYLAND 9,757 3,785 5,972 6,731 6, MASSACHUSETTS 11,791 4,996 6,795 10,489 3,134 7,355 MIT 58,494 52,989 5,505 4,127 3, MIAMI UA/NA UA/NA UA/NA UA/NA UA/NA UA/NA MICHIGAN 53,094 44,012 9,082 21,083 9,547 11,536 MICHIGAN STATE 50,238 29,486 20,752 27,208 16,467 10,741 MINNESOTA 43,490 16,620 26,870 9,000 8, MISSOURI 45,657 37,905 7,752 8,608 4,241 4,367 MONTREAL 31,767 24,403 7,364 9,267 2,790 6,477 NEBRASKA 26,834 20,982 5,852 13,540 13, NEW MEXICO 40,981 32,363 8,618 17,987 9,811 8,176 NEW YORK 30,842 21,491 9,351 25,805 6,378 19,427 NORTH CAROLINA 20,827 17,206 3,621 32,577 23,725 8,852 NORTH CAROLINA STATE UA/NA UA/NA UA/NA UA/NA UA/NA UA/NA NORTHWESTERN 52,715 45,363 7,352 15, NOTRE DAME 25,702 22,621 3,081 13,595 13, OHIO 59,839 50,860 8,979 8,711 3,285 5,426 OHIO STATE 45,523 40,794 4,729 10,292 9,100 1,192 OKLAHOMA UA/NA UA/NA UA/NA UA/NA UA/NA UA/NA OKLAHOMA STATE 46,903 40,725 6,178 15,445 14,287 1,158 OREGON UA/NA UA/NA UA/NA UA/NA UA/NA UA/NA PENNSYLVANIA 56,007 41,038 14,969 12,869 1,185 11,684 PENNSYLVANIA STATE 43,243 35,549 7,694 5,394 3,922 1,472 PITTSBURGH 40,385 28,811 11, PRINCETON 30,634 27,517 3,117 9,439 5,232 4,207 PURDUE 33,113 25,101 8,012 6,710 6, QUEENS 53,811 50,160 3,651 12,662 12, RICE UA/NA UA/NA UA/NA UA/NA UA/NA UA/NA ROCHESTER Data Tables 27
28 Collections Part 1 Volumes In Library Volumes Added (Gross) Volumes Added (Net) Monographs Purchased (Volumes) Current Serials Total (Survey Question Number) (1) (1b.i) (1b) (2) (4) INSTITUTION Notes RUTGERS BGL+ 4,462, ,692 88,427 47,436 54,450 SASKATCHEWAN LM+ 2,367,250 63,731 20,017 22,471 34,920 SOUTH CAROLINA LM+ 3,579,504 54,301 47,966 21,300 51,540 SOUTHERN CALIFORNIA BGLM+ 4,039,228 73,605 70,300 45,731 89,971 SOUTHERN ILLINOIS blm+ 3,073,665 29,439 18,919 11,717 39,221 SUNY-ALBANY G+ 2,156,476 45,500 27,373 17,475 35,466 SUNY-BUFFALO GLM+ 3,655,089 54,272 48,464 37,565 71,234 SUNY-STONY BROOK M+ 2,240,758 27,297 11,937 10,298 38,747 SYRACUSE GL+ 3,160,240 30,294-20,187 17,998 23,285 TEMPLE BbGLM+ 3,137,142 66,014 65,031 62,027 51,198 TENNESSEE BbGLM+ 3,251,893 78,738 68,712 35,889 44,337 TEXAS GL+ 9,323, ,833 94,787 59,852 56,097 TEXAS A&M BG+ 3,739, , , ,691 51,797 TEXAS TECH BLM+ 2,578,185 58,178 52,228 37,790 70,114 TORONTO BL+ 10,719, , , ,006 47,916 TULANE BLM+ 3,106,645 44,108 41,420 38,966 34,820 UTAH LM+ 3,320,167 69,759 65,458 UA/NA 45,830 VANDERBILT GLM+ 3,311,665 58,102 47,434 32,671 44,199 VIRGINIA GLM+ 5,465,077 88,756-1, ,201 82,440 VIRGINIA TECH G+ 2,299,426 35,265 30,807 26,410 35,596 WASHINGTON GLM+ 7,304, , ,169 62,616 61,272 WASHINGTON STATE BG+ 2,294,761 26,922 16,976 17,719 37,648 WASHINGTON U.-ST. LOUIS GLM+ 4,162,980 58,602 46,738 26,144 49,970 WATERLOO G+ 2,224, , , ,470 21,706 WAYNE STATE G+ 3,458,773 35,959 15,526 16,271 43,559 WESTERN ONTARIO GL+ 3,362,078 52,753 51,753 92,700 56,223 WISCONSIN GLM+ 7,916, ,200 87,783 57,383 54,164 YALE GLM+ 12,283, , , ,163 89,649 YORK BG+ 2,733,807 44,626 36,327 29,813 38,714 BOSTON PUBLIC G 7,631, , , ,362 7,149 CISTI G+ 8,161,218 16,060 11,695 16,811 15,000 CENTER FOR RESEARCH LIBS G+ 2,218,290 7,912 7,933 4,320 UA/NA LIBRARY OF CONGRESS bg+ 29,864, , , , ,100 NATL AGRICULTURAL LIB G+ 2,427,420 12,416 9,532 3,290 13,328 LIB & ARCHIVES CANADA G+ 9,416,380 UA/NA UA/NA 10,258 43,881 NATL LIB OF MEDICINE + 2,558,973 36,725 26,915 14,869 21,317 NEW YORK PUBLIC bg+ 8,956, , ,196 80, ,640 NEW YORK STATE + 2,688,689 25,738 25,715 8,543 37,095 SMITHSONIAN b+ 1,566,708 15,385 15,385 5,127 4, See Footnotes G - Government documents not included in serials count U/A - Unavailable L - Includes Law library B - Includes branch campuses N/A - Not Applicable M- Includes Medical library b Basis of volume count is bibliographic 28 ARL Statistics
29 Collections Part 1 Current Serials Purchased Current Serials Purchased Electronic Current Serials Purchased Print Current Serials Not Purchased Current Serials Not Purchased Electronic Current Serials Not Purchased Print (4a) (4a.i) (4a.ii) (4b) (4b.i) (4b.ii) (Survey Question Number) INSTITUTION 40,777 33,864 6,913 13,673 13, RUTGERS 26,420 23,536 2,884 8,500 8, SASKATCHEWAN UA/NA UA/NA UA/NA UA/NA UA/NA UA/NA SOUTH CAROLINA 66,328 48,636 17,692 23,643 10,921 12,722 SOUTHERN CALIFORNIA 30,924 27,014 3,910 8,297 7, SOUTHERN ILLINOIS 27,988 16,292 11,696 7,478 4,849 2,629 SUNY-ALBANY 59,457 51,274 8,183 11,777 3,646 8,131 SUNY-BUFFALO 33,847 26,258 7,589 4,900 4, SUNY-STONY BROOK 20,232 17,780 2,452 3,053 2,004 1,049 SYRACUSE 41,687 36,266 5,421 9,511 9, TEMPLE 27,923 22,246 5,677 16,414 9,440 6,974 TENNESSEE 33,354 21,648 11,706 22,743 11,357 11,386 TEXAS 34,409 30,028 4,381 17,388 12,594 4,794 TEXAS A&M 58,320 54,183 4,137 11,794 11, TEXAS TECH 39,847 20,357 19,490 8,069 6,068 2,001 TORONTO 33,307 22,759 10,548 1, TULANE UA/NA UA/NA UA/NA UA/NA UA/NA UA/NA UTAH 32,912 24,426 8,486 11,287 10, VANDERBILT 44,652 37,588 7,064 37,788 32,064 5,724 VIRGINIA 30,576 29,085 1,491 5,020 4, VIRGINIA TECH UA/NA UA/NA UA/NA UA/NA UA/NA UA/NA WASHINGTON UA/NA UA/NA UA/NA UA/NA UA/NA UA/NA WASHINGTON STATE 38,994 32,516 6,478 10,976 8,296 2,680 WASHINGTON U.-ST. LOUIS 20,738 14,402 6, WATERLOO 29,246 24,421 4,825 14,313 13, WAYNE STATE 52,565 39,613 12,952 3,658 1,550 2,108 WESTERN ONTARIO 50,398 18,398 32,000 3, ,763 WISCONSIN 85,090 59,982 25,108 4,559 3,108 1,451 YALE 33,514 25,559 7,955 5,200 4, YORK 7, ,981 UA/NA UA/NA UA/NA BOSTON PUBLIC 14,307 11,818 2, CISTI UA/NA UA/NA UA/NA UA/NA UA/NA UA/NA CENTER FOR RESEARCH LIBS 57,980 23,528 34, ,120 7,814 92,306 LIBRARY OF CONGRESS 2, ,954 10,375 2,519 7,856 NATL AGRICULTURAL LIB 1, ,068 42,656 3,329 39,327 LIB & ARCHIVES CANADA 18,574 2,549 16,025 2, ,109 NATL LIB OF MEDICINE 94,189 60,572 33,617 22, ,451 NEW YORK PUBLIC 31,887 24,069 7,818 5, ,208 NEW YORK STATE 1, ,910 2,574 UA/NA UA/NA SMITHSONIAN Data Tables 29
30 Summary Data : Collections Part 1 Volumes in Library Volumes Added (Gross) Volumes Added (Net) Monographs Purchased (Volumes) Current Serials Total (Survey Question Number) (1) (1b.i) (1b) (2) (4) University Libraries Mean 4,284,758 94,139 75,275 52,927 53,528 Median 3,454,585 69,759 56,911 38,230 51,797 High 15,965, , , , ,637 Low 1,578,968 18,107-34,354 2,985 11,787 Totals 484,177,673 10,637,660 8,506,094 5,398,535 6,048,608 Number of Libraries Reporting Nonuniversity Li b r a r i e s Median 5,160,340 25,738 25,715 12,564 21,317 Totals 75,490,151 1,149, , , ,032 Number of Libraries Reporting GRAND TOTALS 559,667,824 11,786,972 9,439,400 5,867,128 6,465, ARL Statistics
31 Current Serials Purchased Current Serials Purchased Electronic Current Serials Purchased Print Summary Data : Collections Part 1 Current Serials Not Purchased Current Serials Not Purchased Electronic Current Serials Not Purchased Print (4a) (4a.i) (4a.ii) (4b) (4b.i) (4b.ii) (Survey Question Number) University Librarirs 40,533 31,028 9,651 11,638 8,181 3,559 Mean 39,113 28,006 7,589 9,861 7,520 2,055 Median 98,511 71,003 45,157 37,788 32,064 19,427 High 9,757 3,785 1, Low 4,093,791 3,071, ,449 1,175, , ,501 Totals Number of Libraries Reporting Nonuniversity Li b r a r i e s 14,307 2,549 6,981 7, ,856 Median 230, , , ,820 14, ,884 Totals Number of Libraries Reporting 4,324,003 3,195,704 1,061,763 1,362, , ,385 GRAND TOTALS Data Tables 31
32 Microform Units Collections Part 2 Government Documents Computer Manuscripts Cartographic Files and Archives Materials Graphic Materials Audio Materials Film and Video (Survey Question Number) (6) (7) (8) (9) (10) (11) (12) (13) INSTITUTION Notes ALABAMA bglm+ 4,068, ,159 7,236 33, , ,325 23,328 6,798 ALBERTA G+ 3,734, ,159 22,178 1,544,147 UA/NA UA/NA UA/NA ARIZONA bglm+ 6,267, ,041 10, , ,681 42,961 26,681 ARIZONA STATE BGL+ 7,587, ,062 7,169 24, ,735 1,210,016 66,429 34,566 AUBURN G+ 2,712, ,511 3,134 10, ,373 75, ,724 5,289 BOSTON LM+ 4,675,390 UA/NA 2,063 48,800 1,700 17,700 56,184 1,504 BOSTON COLLEGE bl+ 4,152, ,086 5,445 8,460 17, ,217 20,600 22,187 BRIGHAM YOUNG GL+ 3,859, ,238 UA/NA 42, ,799 1,266, ,226 33,616 BRITISH COLUMBIA G+ 5,257, ,843 12, , ,012 99,277 32,135 BROWN bg+ 1,952, ,537 11, , ,392 76,117 8,282 CALIFORNIA, BERKELEY GL+ 6,757, ,860 18,020 86, ,463 9,636,669 93,188 47,007 CALIFORNIA, DAVIS GLM+ 4,220,007 73,145 12,150 17, , ,470 12,834 3,792 CALIFORNIA, IRVINE bgm+ 2,891, ,834 11,160 4,120 11,232 71,661 9,634 11,074 CALIFORNIA, LOS ANGELES GLM+ 6,202,084 72,562 15,346 60, ,987 4,143, ,194 32,139 CALIFORNIA, RIVERSIDE G+ 2,252, ,807 9,579 4, ,089 21,687 21,014 9,410 CALIFORNIA, SAN DIEGO bgm+ 3,272, ,364 14, , , ,721 17,972 CALIFORNIA, SANTA BARBARA 3,771, ,798 13,147 16,969 4,056,155 1, ,401 10,615 CASE WESTERN RESERVE bglm+ 2,590,449 26,867 8,310 1,940 64,647 72,556 32,347 21,545 CHICAGO bglm+ 3,080,279 UA/NA 11,398 35, , ,959 5,946 CINCINNATI GLM+ 3,362,670 33,497 13,352 25, , ,151 63,360 22,658 COLORADO bgl+ 6,889, ,836 11,986 37, , ,507 68,021 16,076 COLORADO STATE G+ 1,165, ,168 6,999 5,592 43,530 4, COLUMBIA GLM+ 6,300, ,423 46, , , , ,827 32,018 CONNECTICUT BGLM+ 4,301,603 UA/NA 3,778 26, ,234 2,416 60,310 10,508 CORNELL BGL+ 8,445,737 UA/NA 18,321 64, ,509 49, ,229 37,076 DARTMOUTH GM+ 2,599, ,790 22, , ,514 35,850 16,085 DELAWARE + 3,437, , ,486 4, , ,935 18,142 DUKE blm+ 4,301,882 1,252,784 58,509 53, , ,600 56,529 74,980 EMORY BGLM+ 6,216, ,766 11,940 21,676 16,804 2,912 50,439 37,319 FLORIDA BbLM+ 7,814,666 1,235,366 7,820 8, , ,520 18,750 42,875 FLORIDA STATE BbGLM+ 9,106, ,761 9,715 8, ,250 6,532 61,717 18,790 GEORGE WASHINGTON GLM+ 2,914, ,483 18, ,675 10,477 16,480 GEORGETOWN bglm+ 3,957,886 9,385 7,026 18,023 1, ,062 18,367 24,766 GEORGIA GL+ 6,615,818 1,062,664 19,252 58, ,665 1,639, , ,784 GEORGIA TECH G+ 4,613, ,466 6, , ,525 1,866 5,293 GUELPH BG+ 2,343, ,410 13,297 73,935 7,553 12,514 UA/NA HARVARD GLM+ 10,118,984 UA/NA UA/NA UA/NA UA/NA UA/NA UA/NA UA/NA HAWAII GLM+ 3,509, ,203 6,331 15,872 3,100 34,569 32,462 HOUSTON bl+ 5,955, ,971 2,183 4,863 5, ,160 6,395 HOWARD bglm+ 4,220,992 4, , ,200 25,556 6,675 ILLINOIS, CHICAGO M+ 3,969, ,060 UA/NA 32, ,844 2,109,500 8,251 11,193 ILLINOIS, URBANA bgl+ 9,535, ,956 43, ,116 90, ,963 26, ARL Statistics
33 Microform Units Collections Part 2 Government Documents Computer Manuscripts Cartographic Files and Archives Materials Graphic Materials Audio Materials Film and Video (Survey Question Number) (6) (7) (8) (9) (10) (11) (12) (13) INSTITUTION Notes INDIANA + 5,351, ,196 73,715 39, ,487 3,542, ,052 82,854 IOWA blm+ 7,178,601 UA/NA UA/NA 16, ,215 UA/NA 27,404 31,167 IOWA STATE G+ 3,508, ,016 16, , ,332 15,018 53,088 JOHNS HOPKINS BGM+ 4,391,442 1,300 6,059 13, ,108 69,255 29,340 12,105 KANSAS BbGLM+ 3,646, ,947 13,801 52, ,067 3,255,408 37,736 23,438 KENT STATE BbG+ UA/NA 0 12,930 11,273 7,742 2,112 15,687 12,619 KENTUCKY GLM+ 6,433,748 1,102,510 8,030 26, ,702 2,097,143 50,079 42,521 LAVAL G+ 1,293, , , ,131 21,512 27,055 LOUISIANA STATE GLM+ 6,763, ,560 9,071 23, ,793 UA/NA 23,570 4,782 LOUISVILLE BGLM+ 2,212,690 0 UA/NA 22,037 22,309 1,514,744 32,947 9,638 MCGILL BbG+ 1,782, ,373 1,181 1, , ,669 49,886 31,221 MCMASTER GM+ 1,627, ,559 12, , ,019 2,171 MANITOBA G+ 1,472, ,871 UA/NA 12, , ,662 28,142 10,009 MARYLAND 5,810, ,577 7,715 39, , , ,458 42,117 MASSACHUSETTS G+ 2,582,187. 1,629 14, , ,030 20,041 4,670 MIT G+ 2,411,592 UA/NA 52,482 23, , ,310 30,908 5,361 MIAMI GLM+ 3,981, ,103 17,733 56,695 12,726 55,190 15,534 MICHIGAN GLM+ 8,445, ,163,587 45, ,132 33,314,072 66,354 40,059 MICHIGAN STATE GL+ 6,736, ,546 2, ,246 1,817 66,405 4,911 MINNESOTA bglm+ 6,947,047 2,638,912 16,808 80, ,772 UA/NA UA/NA UA/NA MISSOURI L+ 8,696,639 1,681, , , ,984 4,538 MONTREAL GLM+ 1,539, , , ,701 40,446 14,387 NEBRASKA GL+ 4,659, ,672 7,626 10, , ,899 35,003 2,953 NEW MEXICO GLM+ 4,716, ,593 45,501 15, ,306 1,081,234 29,121 8,250 NEW YORK bglm+ 6,430, ,661 5,887 34, ,331, ,931 46,227 NORTH CAROLINA GLM+ 5,088,410 1,625,932 11,820 38, ,710 1,580, ,150 61,456 NORTH CAROLINA STATE G+ 5,445, ,144 12,731 41, ,150 4,348 22,374 NORTHWESTERN BGLM+ 4,511,356 7,808 14,467 14, , ,801 62,739 30,439 NOTRE DAME bgl+ 3,920, ,354 33,215 20, ,000 21,757 11,507 OHIO BbG+ 3,308,966 UA/NA 17,006 13, ,508 97,681 61,998 40,500 OHIO STATE bglm+ 6,002, ,079 32, ,129 2,344,828 64,948 UA/NA OKLAHOMA GLM+ 4,449,470 29,927 5,126 17, ,806 1,748,010 4,504 8,396 OKLAHOMA STATE BGM+ 4,518, ,807 15,642 10, , ,598 12,868 17,616 OREGON bgl+ 4,156, ,640 2,527 73, ,833 1,319,350 78,178 28,498 PENNSYLVANIA GLM+ 4,118,094 UA/NA 1,611 16, , ,438 70,123 18,600 PENNSYLVANIA STATE BGLM+ 5,378,624 UA/NA 11,227 30, , ,892 80, ,672 PITTSBURGH BGLM+ 5,399,668 UA/NA 49,070 31, , , ,306 82,005 PRINCETON b+ 6,536, ,822 11,455 33, , ,011 91,505 8,066 PURDUE G+ 3,103, ,519 12,050 3, ,103 1,476 1,023 12,242 QUEENS LM+ 3,906,399 1,114,831 UA/NA UA/NA 158,933 28,184 UA/NA UA/NA RICE G+ 3,248,726 55,896 14,978 7,326 27,129 33,888 45,292 12,568 ROCHESTER bm+ 5,105, ,239 7,160 14, ,064 11,564 93,895 16,600 Data Tables 33
Average Loan or Lease Term. Average
 Auto Credit For many working families and individuals, owning a car or truck is critical to economic success. For most, a car or other vehicle is their primary means of transportation to work. For those
2013 donorcentrics Annual Report on Higher Education Alumni Giving
 213 donorcentrics Annual Report on Higher Education Alumni Giving Summary of Annual Fund Key Performance Indicators July 212-June 213 214 2 Daniel Island Drive, Charleston, SC 29492 T 8.443.9441 E solutions@blackbaud.com
The College of New Jersey Department of Chemistry. Overview- 2009
 The College of New Jersey Department of Chemistry Overview- 2009 Faculty Heba Abourahma John Allison Michelle Bunagan Lynn Bradley Benny Chan Don Hirsh Jinmo Huang David Hunt Stephanie Sen (plus currently
BUILDING CAPACITY FOR COLLEGE AND CAREER READINESS: LESSONS LEARNED FROM NAEP ITEM ANALYSES. Council of the Great City Schools
 1 BUILDING CAPACITY FOR COLLEGE AND CAREER READINESS: LESSONS LEARNED FROM NAEP ITEM ANALYSES Council of the Great City Schools 2 Overview This analysis explores national, state and district performance
STATE CAPITAL SPENDING ON PK 12 SCHOOL FACILITIES NORTH CAROLINA
 STATE CAPITAL SPENDING ON PK 12 SCHOOL FACILITIES NORTH CAROLINA NOVEMBER 2010 Authors Mary Filardo Stephanie Cheng Marni Allen Michelle Bar Jessie Ulsoy 21st Century School Fund (21CSF) Founded in 1994,
Peer Comparison of Graduate Data
 Peer Comparison of Graduate Data Enrollment and Degrees Total Number of Doctoral Degrees Awarded 2009 Institution 2009 Doctorates Granted of Florida 2,028 Ohio State - 1,617 of Minnesota-Twin Cities 1,594
medicaid and the How will the Medicaid Expansion for Adults Impact Eligibility and Coverage? Key Findings in Brief
 on medicaid and the uninsured July 2012 How will the Medicaid Expansion for Impact Eligibility and Coverage? Key Findings in Brief Effective January 2014, the ACA establishes a new minimum Medicaid eligibility
The Ohio State University Library System Improvement Request,
 The Ohio State University Library System Improvement Request, 2005-2009 Introduction: A Cooperative System with a Common Mission The University, Moritz Law and Prior Health Science libraries have a long
46 Children s Defense Fund
 Nationally, about 1 in 15 teens ages 16 to 19 is a dropout. Fewer than two-thirds of 9 th graders in Florida, Georgia, Louisiana and Nevada graduate from high school within four years with a regular diploma.
2017 National Clean Water Law Seminar and Water Enforcement Workshop Continuing Legal Education (CLE) Credits. States
 Credits. States") t 2017 National Clean Water Law Seminar and Water Enforcement Workshop Continuing Legal Education (CLE) Credits NACWA has applied to the states listed below for Continuing Legal Education (CLE) credits.
t 2017 National Clean Water Law Seminar and Water Enforcement Workshop Continuing Legal Education (CLE) Credits NACWA has applied to the states listed below for Continuing Legal Education (CLE) credits.
cover Private Public Schools America s Michael J. Petrilli and Janie Scull
 cover America s Private Public Schools Michael J. Petrilli and Janie Scull February 2010 contents introduction 3 national findings 5 state findings 6 metropolitan area findings 13 conclusion 18 about us
Managing Printing Services
 Managing Printing Services A SPEC Kit compiled by Julia C. Blixrud Director of Information Services Association of Research Libraries December 1999 Series Editor: Lee Anne George Production Coordinator:
Wilma Rudolph Student Athlete Achievement Award
 Wilma Rudolph Student Athlete Achievement Award CRITERIA FOR NOMINATION The N4A Wilma Rudolph Student Athlete Achievement Award is intended to honor student athletes who have overcome great personal, academic,
A Comparison of the ERP Offerings of AACSB Accredited Universities Belonging to SAPUA
 Association for Information Systems AIS Electronic Library (AISeL) SAIS 2004 Proceedings Southern (SAIS) 3-1-2004 A Comparison of the ERP Offerings of AACSB Accredited Universities Belonging to SAPUA Ronald
Disciplinary action: special education and autism IDEA laws, zero tolerance in schools, and disciplinary action
 National Autism Data Center Fact Sheet Series March 2016; Issue 7 Disciplinary action: special education and autism IDEA laws, zero tolerance in schools, and disciplinary action The Individuals with Disabilities
2016 Match List. Residency Program Distribution by Specialty. Anesthesiology. Barnes-Jewish Hospital, St. Louis MO
 2016 Match List Residency Program Distribution by Specialty Anesthesiology Cleveland Clinic Foundation - Ohio, Cleveland OH University of Arkansas Medical School - Little Rock, Little Rock AR University
A Profile of Top Performers on the Uniform CPA Exam
 Marquette University e-publications@marquette Accounting Faculty Research and Publications Business Administration, College of 8-1-2014 A Profile of Top Performers on the Uniform CPA Exam Michael D. Akers
FY year and 3-year Cohort Default Rates by State and Level and Control of Institution
 Student Aid Policy Analysis FY2007 2-year and 3-year Cohort Default Rates by State and Level and Control of Institution Mark Kantrowitz Publisher of FinAid.org and FastWeb.com January 5, 2010 EXECUTIVE
Housekeeping. Questions
 Housekeeping To join us on audio, dial the phone number in the teleconference box and follow the prompts. Please dial in with your Attendee ID number. The Attendee ID number will connect your name in WebEx
The following tables contain data that are derived mainly
 APPENDIX Medical Schools in the United s, 2012-2013 Barbara Barzansky, PhD; Sylvia I. Etzel The following tables contain data that are derived mainly from the 2012-2013 Liaison Committee on Medical Education
Two Million K-12 Teachers Are Now Corralled Into Unions. And 1.3 Million Are Forced to Pay Union Dues, as Well as Accept Union Monopoly Bargaining
 FACT SHEET National Institute for Labor Relations Research 5211 Port Royal Road, Suite 510 i Springfield, VA 22151 i Phone: (703) 321-9606 i Fax: (703) 321-7342 i research@nilrr.org i www.nilrr.org August
VOL VISION 2020 STRATEGIC PLAN IMPLEMENTATION
 VOL VISION 2020 STRATEGIC PLAN IMPLEMENTATION CONTENTS Vol Vision 2020 Summary Overview Approach Plan Phase 1 Key Initiatives, Timelines, Accountability Strategy Dashboard Phase 1 Metrics and Indicators
Student Admissions, Outcomes, and Other Data
 Student Admissions, Outcomes, and Other Data Data on Incoming Class UNL Clinical Psychology Training Program (CPTP) August Academic Year of Entry 7 8 9 Number of Applicants 9 7 8 8 8 Number Interviewed
Albert (Yan) Wang. Flow-induced Trading Pressure and Corporate Investment (with Xiaoxia Lou), Forthcoming at
 Wang. Flow-induced Trading Pressure and Corporate Investment (with Xiaoxia Lou), Forthcoming at") Albert (Yan) Wang 315 Lowder Hall 405 W. Magnolia Ave Auburn, AL 36849 Office: 334-844-5324 Cell: 205-737-2677 albertwang@auburn.edu Employment 2017/8 present: Synovus Fellow and Associate Professor, Department
Albert (Yan) Wang 315 Lowder Hall 405 W. Magnolia Ave Auburn, AL 36849 Office: 334-844-5324 Cell: 205-737-2677 albertwang@auburn.edu Employment 2017/8 present: Synovus Fellow and Associate Professor, Department
The Social Network of US Academic Anthropology Nicholas C. Kawa (co-authors: Chris McCarty, José A. Clavijo Michelangeli, and Jessica Clark)
") Introduction The Social Network of US Academic Anthropology Nicholas C. Kawa (co-authors: Chris McCarty, José A. Clavijo Michelangeli, and Jessica Clark) If you re currently looking to break into the academic
Introduction The Social Network of US Academic Anthropology Nicholas C. Kawa (co-authors: Chris McCarty, José A. Clavijo Michelangeli, and Jessica Clark) If you re currently looking to break into the academic
Financial Plan. Operating and Capital. May2010
 10 Financial Plan Operating and Capital May2010 Published by: The Division of Planning and Budget Cornell University 440 Day Hall Ithaca, New York 14853 http://dpb.cornell.edu 607 255 0155 May 2010 Edited
State Limits on Contributions to Candidates Election Cycle Updated June 27, PAC Candidate Contributions
 State Limits on to Candidates 2017-2018 Election Cycle Updated June 27, 2017 Individual Candidate Alabama Ala. Code 17-5-1 et seq. Unlimited Unlimited Unlimited Unlimited Unlimited Alaska 15.13.070, 15.13.072(e),
Roadmap to College: Highly Selective Schools
 Roadmap to College: Highly Selective Schools COLLEGE Presented by: Loren Newsom Understanding Selectivity First - What is selectivity? When a college is selective, that means it uses an application process
NASWA SURVEY ON PELL GRANTS AND APPROVED TRAINING FOR UI SUMMARY AND STATE-BY-STATE RESULTS
 NASWA SURVEY ON PELL GRANTS AND APPROVED TRAINING FOR UI SUMMARY AND STATE-BY-STATE RESULTS FINAL: 3/22/2010 Contact: Yvette Chocolaad Director, Center for Employment Security Education and Research National
Culture, Tourism and the Centre for Education Statistics: Research Papers
 Catalogue no. 81-595-M Culture, Tourism and the Centre for Education Statistics: Research Papers Salaries and SalaryScalesof Full-time Staff at Canadian Universities, 2009/2010: Final Report 2011 How to
CLE/MCLE Information by State
 /M Information by State Updated June 30, 2011 State /M Information Form Contact Telephone Email Alabama http://www.alabar.org/cle/ http://www.alabar.org/cle/course_approv al.cfm Linda Dukes Conner, of
ELLEN E. ENGEL. Stanford University, Graduate School of Business, Ph.D. - Accounting, 1997.
 ELLEN E. ENGEL September 2016 University of Illinois at Chicago Department of Accounting 601 S. Morgan Street Chicago, IL 60607 Office Phone: (312)-413-3418 Mobile Phone: (847) 644-2961 Email: elleneng@uic.edu
2007 NIRSA Salary Census Compiled by the National Intramural-Recreational Sports Association NIRSA National Center, Corvallis, Oregon
 2007 NIRSA Salary Census Compiled by the National Intramural-Recreational Sports Association NIRSA National Center, Corvallis, Oregon 2007 Salary Census 2007 No part of this publication may be reproduced
Discussion Papers. Assessing the New Federalism. State General Assistance Programs An Urban Institute Program to Assess Changing Social Policies
 State General Assistance Programs 1998 L. Jerome Gallagher Cori E. Uccello Alicia B. Pierce Erin B. Reidy 99 01 Assessing the New Federalism An Urban Institute Program to Assess Changing Social Policies
About the College Board. College Board Advocacy & Policy Center
 15% 10 +5 0 5 Tuition and Fees 10 Appropriations per FTE ( Excluding Federal Stimulus Funds) 15% 1980-81 1981-82 1982-83 1983-84 1984-85 1985-86 1986-87 1987-88 1988-89 1989-90 1990-91 1991-92 1992-93
The Effect of Income on Educational Attainment: Evidence from State Earned Income Tax Credit Expansions
 The Effect of Income on Educational Attainment: Evidence from State Earned Income Tax Credit Expansions Katherine Michelmore Policy Analysis and Management Cornell University km459@cornell.edu September
Instrumentation, Control & Automation Staffing. Maintenance Benchmarking Study
 Electronic Document Instrumentation, Control & Automation Staffing Prepared by ITA Technical Committee, Maintenance Subcommittee, Task Force on IC&A Staffing John Petito, Chair Richard Haugh, Vice-Chair
Culture, Tourism and the Centre for Education Statistics: Research Papers 2011
 Table 2 Memorial University 99,256 84,168 72,852 57,764 153,950 125,660 89,826 67,194 Annual increment 1,886 1,886 1,886 1,886 University of Prince Edward Island 1 91,738 72,287 58,062 49,614 126,903 108,831
Trends in Tuition at Idaho s Public Colleges and Universities: Critical Context for the State s Education Goals
 1 Trends in Tuition at Idaho s Public Colleges and Universities: Critical Context for the State s Education Goals June 2017 Idahoans have long valued public higher education, recognizing its importance
GRADUATE CURRICULUM REVIEW REPORT
 UATE CURRICULUM REVIEW REPORT OCTOBER 2014 Graduate Review Committee: Beverly J. Irby, Chair; Luis Ponjuan, Associate Professor, and Lisa Baumgartner, Associate Professor (First Draft Submission- June,
National Survey of Student Engagement Spring University of Kansas. Executive Summary
 National Survey of Student Engagement Spring 2010 University of Kansas Executive Summary Overview One thousand six hundred and twenty-one (1,621) students from the University of Kansas completed the web-based
top of report Note: Survey result percentages are always out of the total number of people who participated in the survey.
 Offering Report Recognition and Reward for Academic Advising...: Advisor Recognition and Reward... Summary Survey Name: Recognition and Reward for Academic Advising Offering Name: Advisor Recognition and
Higher Education. Pennsylvania State System of Higher Education. November 3, 2017
 November 3, 2017 Higher Education Pennsylvania s diverse higher education sector - consisting of many different kinds of public and private colleges and universities - helps students gain the knowledge
Shintaro Yamaguchi. Educational Background. Current Status at McMaster. Professional Organizations. Employment History
 Shintaro Yamaguchi Department of Economics McMaster University 1280 Main Street West Hamilton, ON L8S 4M4 Phone: (905) 525-9140 x23672 Office: 440 Kenneth Taylor Hall Email: yamtaro@mcmaster.ca Homepage:
Understanding University Funding
 Understanding University Funding Jamie Graham Registrar and AVP, Institutional Planning Brad MacIsaac AVP Planning & Analysis, and Registrar Where does Funding Come From Total Revenue Ontario $13.1B Other
2009 National Survey of Student Engagement. Oklahoma State University
 Office of University Assessment and Testing Jeremy Penn, Ph.D., Director Chris Ray, Ph.D., Assistant Director uat@okstate.edu (405) 744-6687 Contributions to this report were made by Tom Gross and Lihua
Draft Preliminary Master Plan April 18, 2012
 Arkansas State University Comprehensive Campus Master Plan Draft Preliminary Master Plan April 18, 2012 Crafton Tull Paulien & Associates The Protection Engineering Group Agenda 1 Master Plan Principles
Free Fall. By: John Rogers, Melanie Bertrand, Rhoda Freelon, Sophie Fanelli. March 2011
 Free Fall Educational Opportunities in 2011 By: John Rogers, Melanie Bertrand, Rhoda Freelon, Sophie Fanelli March 2011 Copyright 2011 UCLA s Institute for Democracy, Education, and Access UC All Campus
Diploma in Library and Information Science (Part-Time) - SH220
 - SH220") Diploma in Library and Information Science (Part-Time) - SH220 1. Objectives The Diploma in Library and Information Science programme aims to prepare students for professional work in librarianship. The
Diploma in Library and Information Science (Part-Time) - SH220 1. Objectives The Diploma in Library and Information Science programme aims to prepare students for professional work in librarianship. The
Teach For America alumni 37,000+ Alumni working full-time in education or with low-income communities 86%
 About Teach For America Teach For America recruits, trains, and supports top college graduates and professionals who make an initial commitment to teach for two years in urban and rural public schools
A Snapshot of the Graduate School
 A Snapshot of the Graduate School Prepared for the Research Council February 6, 2009 John R. Mullin, Ph.D., FAICP Dean of the Graduate School University of Massachusetts Amherst Graduate School Purpose
Susanna M Donaldson Curriculum Vitae
 Susanna M Donaldson Curriculum Vitae Department of Sociology and Anthropology 307 Knapp Hall Phone: (304) 293-8844 West Virginia University Fax: (304) 293-5994 Morgantown, WV 25606-6326 smdonaldson@mail.wvu.edu
Collections, Technical Services & Scholarly Communications
 Collections, Technical Services & Scholarly Communications Associate Director Karla Strieb October-December 214 General Observations Visitors from the Shanghai Library were welcomed by several departments
STUDENT PERCEPTION SURVEYS ACTIONABLE STUDENT FEEDBACK PROMOTING EXCELLENCE IN TEACHING AND LEARNING
 1 STUDENT PERCEPTION SURVEYS ACTIONABLE STUDENT FEEDBACK PROMOTING EXCELLENCE IN TEACHING AND LEARNING Presentation to STLE Grantees: December 20, 2013 Information Recorded on: December 26, 2013 Please
Guide to the Program in Comparative Culture Records, University of California, Irvine AS.014
 http://oac.cdlib.org/findaid/ark:/13030/kt2f59q8v9 No online items University of California, Irvine AS.014 Finding aid prepared by Processed by Mary Ellen Goddard and Michelle Light; machine-readable finding
Sociology. Faculty. Emeriti. The University of Oregon 1
 The University of Oregon Sociology Ellen Scott, Interim Department Head 5-36-5002 5-36-5026 fax 736 Prince Lucien Campbell Hall 29 University of Oregon Eugene OR 9703-29 sociology@uoregon.edu Sociology
Trends in Student Aid and Trends in College Pricing
 Trends in Student Aid and Trends in College Pricing 2012 NYSFAAA Conference Katrina Delgrosso Senior Educational Manager Agenda What is the College Board Advocacy & Policy Center? Trends in College Pricing
TRENDS IN. College Pricing
 2008 TRENDS IN College Pricing T R E N D S I N H I G H E R E D U C A T I O N S E R I E S T R E N D S I N H I G H E R E D U C A T I O N S E R I E S Highlights 2 Published Tuition and Fee and Room and Board
LEWIS M. SIMES AS TEACHER Bertel M. Sparks*
 T LEWIS M. SIMES AS TEACHER Bertel M. Sparks* o describe Professor Lewis Mallalieu Simes is to list the qualities of a great teacher. And just as it is impossible to identify all the characteristics of
Trends in College Pricing
 Trends in College Pricing 2009 T R E N D S I N H I G H E R E D U C A T I O N S E R I E S T R E N D S I N H I G H E R E D U C A T I O N S E R I E S Highlights Published Tuition and Fee and Room and Board
How Living Costs Undermine Net Price As An Affordability Metric
 How Living Costs Undermine Net Price As An Affordability Metric Braden J. Hosch, Ph.D. Asst. Vice President for Institutional Research, Planning & Effectiveness Association for Institutional Research Annual
Stetson University College of Law Class of 2012 Summary Report
 Stetson University College Law Class 2012 Summary Report Full-time Long-term Salaries # with Salary 25th Median 75th Mean Total = 341 Gender : Women Men Subtotal Race : Minority Nonminority Subtotal Gender
James H. Walther, Ed.D.
 James H. Walther, Ed.D. Curriculum Vitae Emporia State University School of Library and Information Management (SLIM) Campus Box 4025 1 Kellogg Circle Emporia, KS 66801-5415 Phone: 620-341-5698 Email:
UCLA Affordability. Ronald W. Johnson Director, Financial Aid Office. May 30, 2012
 UCLA Affordability Ronald W. Johnson Director, Financial Aid Office May 30, 2012 1 UC is affordable First, Students must: Apply for admission in November File FAFSA and GPA Verification Form between January
Biomedical Sciences. Career Awards for Medical Scientists. Collaborative Research Travel Grants
 Biomedical Sciences Research in the medical sciences provides a firm foundation for improving human health. The Burroughs Wellcome Fund is committed to fostering the development of the next generation
NATIONAL CENTER FOR EDUCATION STATISTICS
 NATIONAL CENTER FOR EDUCATION STATISTICS Palm Desert, CA The Integrated Postsecondary Education Data System (IPEDS) is the nation s core postsecondary education data collection program. It is a single,
CHAPTER 4: REIMBURSEMENT STRATEGIES 24
 CHAPTER 4: REIMBURSEMENT STRATEGIES 24 INTRODUCTION Once state level policymakers have decided to implement and pay for CSR, one issue they face is simply how to calculate the reimbursements to districts
Strategic Plan Update, Physics Department May 2010
 Strategic Plan Update, Physics Department May 2010 Mission To generate and disseminate knowledge of physics and its applications. Vision The Department of Physics faculty will continue to conduct cutting
Fisk University FACT BOOK. Office of Institutional Assessment and Research
 Fisk University 2013-2014 FACT BOOK Office of Institutional Assessment and Research 1 The 2013-2014 Fisk University Fact Book is designed to present and provide basic descriptive and statistical information
A Case to Provide Students Practice in Basic and Advanced Functions of IDEA Software
 Volume 7 Number 1 2012 ISSN: 1935-8156 http://www.aisej.com A Case to Provide Students Practice in Basic and Advanced Functions of IDEA Software Mary Antcliff KPMG Advisory Richmond VA Ryan Doren KPMG
2014 Comprehensive Survey of Lawyer Assistance Programs
 2014 Comprehensive Survey of Lawyer Assistance Programs A m e r i c a n B a r A s s o c i a t i o n 3 2 1 N. C l a r k S t r e e t C h i c a g o, I L 6 0 6 5 4 Copyright 2015 by the American Bar Association.
ADVANCED PLACEMENT STUDENTS IN COLLEGE: AN INVESTIGATION OF COURSE GRADES AT 21 COLLEGES. Rick Morgan Len Ramist
 February 1998 Report No. SR-98-13 ADVANCED PLACEMENT STUDENTS IN COLLEGE: AN INVESTIGATION OF COURSE GRADES AT 21 COLLEGES Rick Morgan Len Ramist Unpublished Statistical Report This is a limited distribution
Intellectual Property and Online Courses: Policies at Major Research Universities. Jeffrey Kromrey
 Intellectual Property and Online Courses 1 Intellectual Property and Online Courses: Policies at Major Research Universities Jeffrey Kromrey College of Education University of South Florida 4202 E. Fowler
Financing Education In Minnesota
 Financing Education In Minnesota 2016-2017 Created with Tagul.com A Publication of the Minnesota House of Representatives Fiscal Analysis Department August 2016 Financing Education in Minnesota 2016-17
University of Southern California Hayward R. Alker Postdoctoral Fellow, Center for International Studies,
 JORDAN BRANCH Department of Political Science Box 1844, 36 Prospect Street Providence, RI 02912 jordan_branch@brown.edu CURRENT POSITION Assistant Professor, Department of Political Science, 2012 present
EITAN GOLDMAN Associate Professor of Finance FedEx Faculty Fellow Indiana University
 EITAN GOLDMAN Associate Professor of Finance FedEx Faculty Fellow Indiana University 927 S Jordan Ave Phone (202) 288 8624 Bloomington Indiana, 47401 Email: eigoldma@indiana.edu Education The Wharton Business
Brian Isetts University of Minnesota - Twin Cities, Anthony W. Olson PharmD University of Minnesota, Twin Cities,
 Volume 8 Number 1 Article 24 3-16-2017 An Evaluation of the Distribution, Scope, and Impact of Community Pharmacy Foundation Grants Completed by Academic Principal Investigators between 2002 and 2014 Brian
MMOG Subscription Business Models: Table of Contents
 DFC Intelligence DFC Intelligence Phone 858-780-9680 9320 Carmel Mountain Rd Fax 858-780-9671 Suite C www.dfcint.com San Diego, CA 92129 MMOG Subscription Business Models: Table of Contents November 2007
The Big Deal, Interlibrary Loan, and Building the User-Centered Journal Collection: A Case Study
 Collections and Technical Services Publications and Papers Collections and Technical Services 2014 The Big Deal, Interlibrary Loan, and Building the User-Centered Journal Collection: A Case Study Wayne
Journal Article Growth and Reading Patterns
 New Review of Information Networking ISSN: 1361-4576 (Print) 1740-7869 (Online) Journal homepage: http://www.tandfonline.com/loi/rinn20 Journal Article Growth and Reading Patterns Carol Tenopir, Regina
Pathways to Health Professions of the Future
 Pathways to Health Professions of the Future Stephen C. Shannon, DO, MPH American Association of Colleges of Osteopathic Medicine Copyright 2014 AACOM, all rights reserved. Photo courtesy of LECOM The
THE ECONOMIC AND SOCIAL IMPACT OF APPRENTICESHIP PROGRAMS
 THE ECONOMIC AND SOCIAL IMPACT OF APPRENTICESHIP PROGRAMS March 14, 2017 Presentation by: Frank Manzo IV, MPP Illinois Economic Policy Institute fmanzo@illinoisepi.org www.illinoisepi.org The Big Takeaways
San Francisco County Weekly Wages
 San Francisco County Weekly Wages Focus on Post-Recession Recovery Q 3 205 Update Produced by: Marin Economic Consulting March 6, 206 Jon Haveman, Principal 45-336-5705 or Jon@MarinEconomicConsulting.com
NATIONAL SURVEY OF STUDENT ENGAGEMENT
 NATIONAL SURVEY OF STUDENT ENGAGEMENT (NSSE 2004 Results) Perspectives from USM First-Year and Senior Students Office of Academic Assessment University of Southern Maine Portland Campus 780-4383 Fall 2004
Graduate Division Annual Report Key Findings
 Graduate Division 2010 2011 Annual Report Key Findings Trends in Admissions and Enrollment 1 Size, selectivity, yield UCLA s graduate programs are increasingly attractive and selective. Between Fall 2001
Active Learning a pathfinder guide to active learning resources Developed by Roberta (Robin) Sullivan
 Sullivan") Active Learning a pathfinder guide to active learning resources Developed by Roberta (Robin) Sullivan Scope note The guides on this pathfinder provide suggested resources for beginning research about active
Active Learning a pathfinder guide to active learning resources Developed by Roberta (Robin) Sullivan Scope note The guides on this pathfinder provide suggested resources for beginning research about active
Identifying Users of Demand-Driven E-book Programs: Applications for Collection Development
 Identifying Users of Demand-Driven E-book Programs: Applications for Collection Development Background Information In 2003 San José State University (SJSU) and the City of San José formed a unique partnership
HEALTH SERVICES ADMINISTRATION
 Assessment of Library Collections Program Review HEALTH SERVICES ADMINISTRATION Tony Schwartz Associate Director for Collection Management April 13, 2006 Update: the main additions to the health science
UNIVERSITY OF REGINA. Tuition and fees
 UNIVERSITY OF REGINA Tuition and fees 2017-18 The following tuition and fee changes will be effective September 1, 2017: Tuition for all undergraduate credit hours will be increased by 2.5%, rounded to
Reaching the Hispanic Market The Arbonne Hispanic Initiative
 Reaching the Hispanic Market The Arbonne Hispanic Initiative Hispanic Initiative Overview 2002 Arbonne en Español Started 2006 Initiated Hispanic Initiative 2007 Market Study & Survey Field Support» Jael
Economics research in Canada: A long-run assessment of journal publications #
 Economics research in Canada: A long-run assessment of journal publications # James B. Davies,, Martin G. Kocher*, Matthias Sutter*,# University of Western Ontario, Canada * University of Innsbruck, Austria
Proficiency Illusion
 KINGSBURY RESEARCH CENTER Proficiency Illusion Deborah Adkins, MS 1 Partnering to Help All Kids Learn NWEA.org 503.624.1951 121 NW Everett St., Portland, OR 97209 Executive Summary At the heart of the
SHARIF F. KHAN. June 16, 2015
 SHARIF F. KHAN June 16, 2015 University Address: 75 University Avenue West Wilfrid Department of Economics Waterloo, ON N2L 3C5, Canada E-mail: khans@econ.queensu.ca Mailing Address: 455 Rideau River St
LEN HIGHTOWER, Ph.D.
 Page 1 LEN HIGHTOWER, Ph.D. 350 South Merelet Lane Orange, CA 92869 E-Mail: WLHightower@hotmail.com 714-602-6573 Home 503-341-2672 Cell CAREER HIGHLIGHTS HighTower Consulting Assisted Concordia University
Urban Universities. An Action Plan for Transforming the Future Health Workforce. USU Health Action Groups
 Urban Universities An Action Plan for Transforming the Future Health Workforce USU Health Action Groups September 2013 Urban Universities for HEALTH Urban Universities for HEALTH (Health Equity through
Massachusetts Department of Elementary and Secondary Education. Title I Comparability
 Massachusetts Department of Elementary and Secondary Education Title I Comparability 2009-2010 Title I provides federal financial assistance to school districts to provide supplemental educational services
Dr. Tang has been an active member of CAPA since She was Co-Chair of Education Committee and Executive committee member ( ).
.") 2015 CAPA Candidates Profiles For President-elect (alphabetic order): Dr. Ping Tang Dr. Ping Tang is a Professor at Department of Pathology and Laboratory Medicine, University of Rochester Medical Center,
2015 CAPA Candidates Profiles For President-elect (alphabetic order): Dr. Ping Tang Dr. Ping Tang is a Professor at Department of Pathology and Laboratory Medicine, University of Rochester Medical Center,
VOLCANO HAZARDS PROGRAM
 Si 17(tYD REVIEW OF R-f+-r4 /Lk THE U.S. GEOLOGICAL SURVEY'S A/6" VOLCANO HAZARDS PROGRAM Committee on the Review of the USGS Volcano Hazards Program Board on Earth Sciences and Resources Commission on
Set t i n g Sa i l on a N e w Cou rse
 Set t i n g Sa i l on a N e w Cou rse N AT I O N A L R E GI S TRY OF EM ER GENC Y MEDIC AL TEC HNIC IANS 2011 ANNUAL REPORT Under development for the past ten years, the most significant event in the 40-year
Class Numbers: & Personal Financial Management. Sections: RVCC & RVDC. Summer 2008 FIN Fully Online
 Summer 2008 FIN 3140 Personal Financial Management Fully Online Sections: RVCC & RVDC Class Numbers: 53262 & 53559 Instructor: Jim Keys Office: RB 207B, University Park Campus Office Phone: 305-348-3268