Special Education Cross-Subsidies Fiscal Year Fiscal Year Report. To the. Legislature. As required by. Minnesota Statutes,
|
|
|
- Eileen Richardson
- 5 years ago
- Views:
Transcription
1 This document is made available electronically by the Minnesota Legislative Reference Library as part of an ongoing digital archiving project. Special Education Cross-Subsidies Fiscal Year 2014 Fiscal Year 2014 Report To the Legislature As required by Minnesota Statutes, section 127A.065
2 COMMISSIONER: Brenda Cassellius, Ed. D. Special Education Cross-Subsidies Fiscal Year 2014 July 2015 FOR MORE INFORMATION CONTACT: Tom Melcher, Director Division of School Finance Report to the Legislature As required by Minnesota Statutes 2014 Section 127A.065 2
3 Cost of Report Preparation The total cost for the Minnesota Department of Education (MDE) to prepare this report was approximately $2, Most of these costs involved staff time in analyzing data and preparing the written report. Incidental costs include paper, copying, and other office supplies. Estimated costs are provided in accordance with Minnesota Statutes, section 3.197, which requires that at the beginning of a report to the Legislature, the cost of preparing the report must be provided. 3
4 SPECIAL EDUCATION CROSS-SUBSIDIES REPORT FISCAL YEAR 2014 Minnesota Statutes 2014, Section 127A.065, states: By March 30, the commissioner of education shall submit an annual report to the legislative committees having jurisdiction over kindergarten through grade 12 education on the amount each district is cross-subsidizing special education costs with general education revenue. This report is notification to legislative committees based upon data compiled on May 1, Introduction Expenditures for special education programs provided by local education agencies, including school districts, charter schools, intermediate school districts and special education cooperatives, are funded with a combination of state categorical aids, federal categorical aids, third-party billing revenues and state and local general education revenues. The special education cross-subsidy measures the difference between special education expenditures and corresponding revenues. Two cross-subsidy measures are used in this report: 1. The gross cross-subsidy is the difference between total special education expenditures and categorical special education revenues. 2. The adjusted net cross-subsidy equals the gross cross-subsidy minus the amount of general education revenue attributable to special education students for time spent receiving special education services outside of the regular classroom for those who spend 60 percent or more of the school day outside of the regular classroom. The gross cross-subsidy is the portion of special education expenditures not covered by categorical special education revenue. However, since special education students earn general education revenue in the same manner as other students, a portion of the general education revenue earned by these students is available to cover costs of the special education programs, without creating a shortfall in the general education program of the district. For purposes of this report, the adjusted net cross-subsidy includes the portion of general education revenue that reasonably follows the student to the special education program as revenue for special education, thereby reducing the amount of the cross-subsidy. When the term cross-subsidy is used in this report without further details, we are referring to the adjusted net cross-subsidy. In calculating the adjusted net cross-subsidy, the portion of general education revenue designated as following the student to the special education program is limited to the instructional portion of the revenue earned by special education students served outside of the regular classroom for 60 percent or more of the school day, for the time these students spend receiving special education services outside of the regular classroom. This excludes: 4
5 1. the non-instructional portion of general education revenue for all special education students; 2. the instructional portion of general education revenue earned by special education students served primarily in the regular classroom for time spent both inside and outside of the regular classroom; and 3. the instructional portion of general education revenue earned by students served primarily outside of the classroom for time spent in the regular classroom. Detailed definitions of the terms used in this report are provided in Appendix A. Legislative History In 1998, (Laws 1998, Chapter 398, Article 6, Section 16), legislation was enacted requiring school district superintendents to annually report to the commissioner how much the district is cross-subsidizing the cost of special education programs with general education revenue. Since the Minnesota Department of Education (MDE) already collected all of the data needed to calculate special education cross-subsidies, From FY 1999 through FY 2006, MDE calculated the cross-subsidies on behalf of the superintendents and asked them to review the calculations before publication. However, since the cross-subsidy calculations were a technical task performed by MDE, the review by superintendents was widely viewed as an unnecessary step in the process and did not result in any significant changes to the reported cross-subsidies. To simplify the process and eliminate unnecessary paperwork, legislation was enacted in 2007, (Laws 2007, Chapter 146, Article 7, Section 1), making MDE, instead of the superintendents, directly responsible for the cross-subsidies report and making it a report to the legislature. Appendix A provides detailed definitions of the terms and methodology used in this report. State Total Special Education Cross-Subsidies, FY 2013 FY
6 Table 1 shows the calculation of the state total cross-subsidy for FY 2013 through FY Amounts shown for FY 2013 FY 2014 are based on actual data. Amounts shown for FY are estimates based on February 2015 forecast data. Amounts for FY appear in Appendix B and are based on final data. MDE / School Finance 7/1/15 Reflects February 2015 forecast data updated Table 1 State Total Special Education Cross-Subsidies, Year to Year Comparison FY FY 2019 Final FY 2014 Data ($ in Millions) FY2013 FY2014 FY2015 FY2016 FY2017 FY2018 FY Special Education Expenditures: Final Final Est Est Est Est Est * State excluding Alternative Delivery, Full State Payment for students with Disabilities, Home Based Travel, Transition Disabled, Local Collaborative Time Study and Third Party Revenue Expenditures (including fringe benefits and excluding transportation). 1, , , , , , ,879.9 State transportation (excluding special transportation of nondisabled * students) * Federal (including fringe benefits) Subtotal, Special Education Expenditures 1, , , , , , ,307.1 Change from Prior Year Percent Change from Prior Year 1.1% 4.2% 4.2% 3.8% 3.8% 4.0% 3.6% 2 Special Education Categorical Revenues: * State - regular special education aid, includes transportation , ,097.4 * State - excess cost aid * Adjust for Cap Growth * Adjust for Hold Harmless * Adjust for Alternative Delivery (11.1) (15.6) (21.7) (27.0) (30.1) (33.3) (36.3) * Adjust for Spec Trans for Non-disabled Students (10.3) (13.8) (15.3) (15.7) (18.4) (19.7) (21.0) * Transition Disabled Aid * Levy Equalization Revenue * State - special pupil aid * State - home based travel aid * State - cross-subsidy aid * Third Party Billing * Federal Subtotal, Categorical Revenue 1, , , , , , ,552.6 Change from Prior Year Percent Change from Prior Year 278.6% 7.2% 5.3% 4.2% 4.0% 4.8% 4.7% 3 General Education Revenue Attributable to Special Education Students for time spent receiving special education services Outside Of The Regular Classroom for more that 60% of the School Day Cross-Subsidies: (a Gross Cross-Subsidy (1)-(2): b) Adjusted Net Cross-Subsidy (1) - (2) - (3a): Change from Prior Year (830.3) (7.9) Percent Change from Prior Year -58.8% -1.4% 1.8% 3.2% 4.0% 3.0% 1.7% projection-table 1 updated for FY xls 6
7 Figure 1 shows the trends from FY 2003 FY 2014 and projections through FY 2019 for special education revenues and expenditures. Special education expenditures increased steadily over this period, from $1.210 billion in FY 2003 to $1.906 billion in FY 2014, and are projected to continue to increase up to $2.307 billion by FY Special education revenues increased at a slower rate than expenditures between FY 2003 and FY 2007, increasing the gap between expenditures and revenues. As a result of legislation enacted in 2007, revenues increased sharply in FY 2008, with slower revenue growth in FY Due to federal stimulus funds, revenues continued to increase in FY 2010 and carryover in FY 2011 but fall back to a slower rate of growth in FY 2012 and FY 2013 compared to FY Overall, expenditures are projected to increase 90 percent over the 13-year period, while revenues are projected to increase by 97 percent. 7
8 Figure 2 shows the gap between special education expenditures and revenues, generally referred to as the special education cross-subsidy. The adjusted net cross-subsidy grew at an accelerating rate between FY 2003 and FY 2007, reaching $572 million in FY As a result of the 2007 legislation, the cross-subsidy decreased to $484 million in FY 2008 but began to grow again in FY 2009 to $529 million. Due to federal stimulus funds in FY 2010 and carryover in FY 2011, the cross-subsidy dropped below the FY 2008 level in FY 2010 to $451 million and rose slightly in FY 2011 to $455 million. It exceeded the FY 2007 level in FY 2012 and is projected to reach $656 million in FY Figure 3 provides another perspective on the cross-subsidy by showing the percentage of special education expenditures covered by state and federal funding formulas from FY 2003 through FY Between FY 2003 and FY 2007, the state/federal funded portion of special education expenditures declined gradually from 69.0 percent to 61.8 percent. The increase enacted in 2007 raised the state/federal funded portion of special education expenditures to 69.1 percent in FY It declined to 67.7 percent in FY 2009 but, due to federal stimulus funds in FY 2010 and carry over in FY 2011, it rose to 73.3 percent in FY 2010 and to 73.9 percent in FY With the expiration of federal stimulus funding after FY 2011, the state/federal funded portion of special education expenditures declined sharply to 66.7 percent in FY Funding increases exceeded expenditure growth in FY 2013 and FY 2014, increasing the state/federal funded portion to 69.9 percent in FY For FY 2015 and later, the state/federal funded portion of special education expenditures is expected to increase slightly to 71.6 percent by FY 2019, due to increases enacted in state special education funding in
9 Figure 4 presents yet another perspective by showing the cross-subsidy as amount per Average Daily Membership (ADM) necessary to cross subsidize special education with general education. Amounts are shown in current dollars and adjusted for inflation using the Consumer Price Index (CPI) and the Implicit Price Deflator (IPD) for state and local government purchases. The trends in cross subsidy per ADM in current dollars, shown in the solid blue line, follow closely with the trends in the total cross subsidy shown in Figure 2, with a dip in FY 2010 and FY 2011 due to the federal stimulus funding and gradual increases projected for FY 2015 through FY 2019, as funding growth is projected to lag slightly behind expenditure growth. However, when adjusted for inflation, the cross subsidy per ADM is projected to remain essentially unchanged between FY 2015 and FY
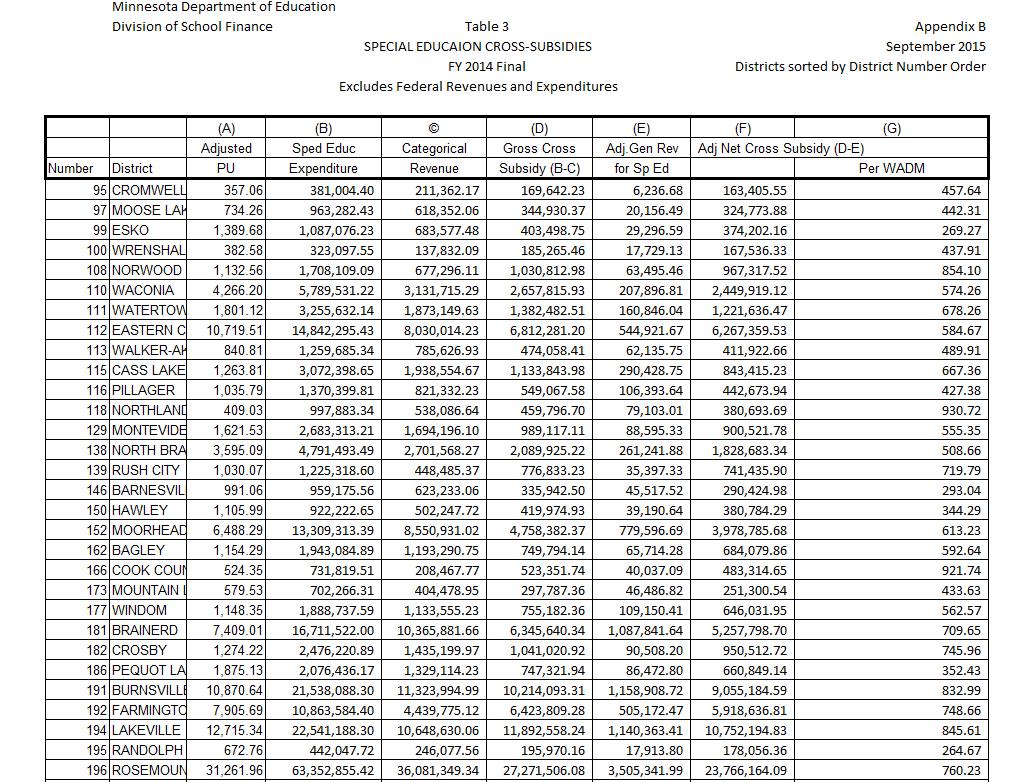
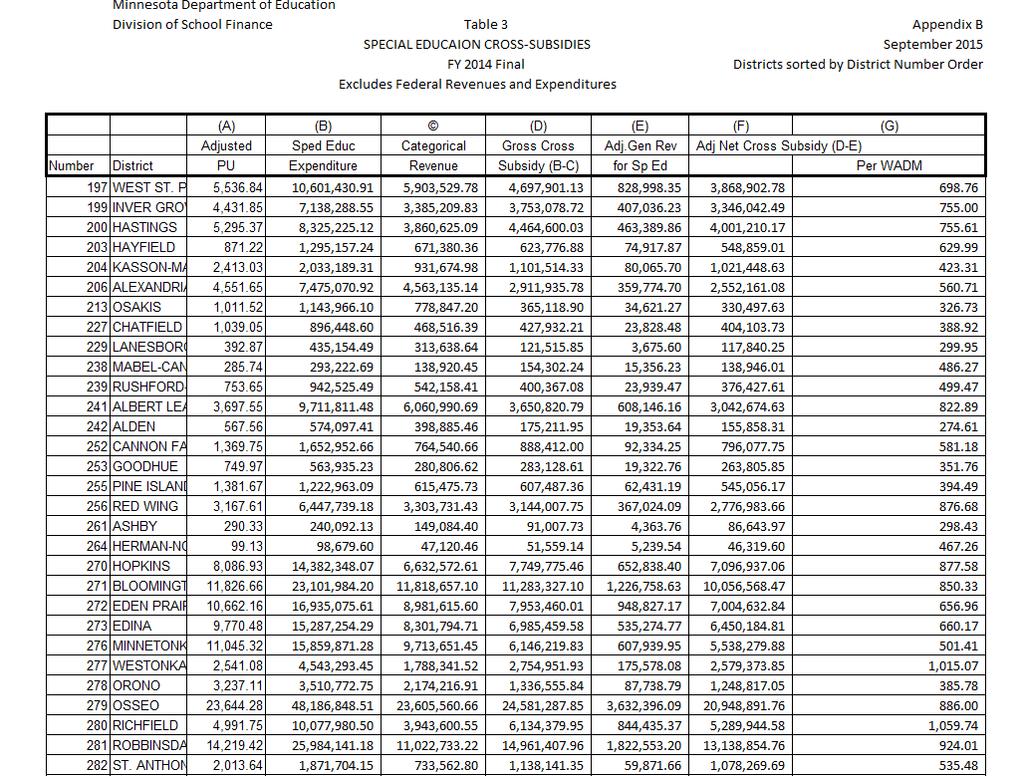
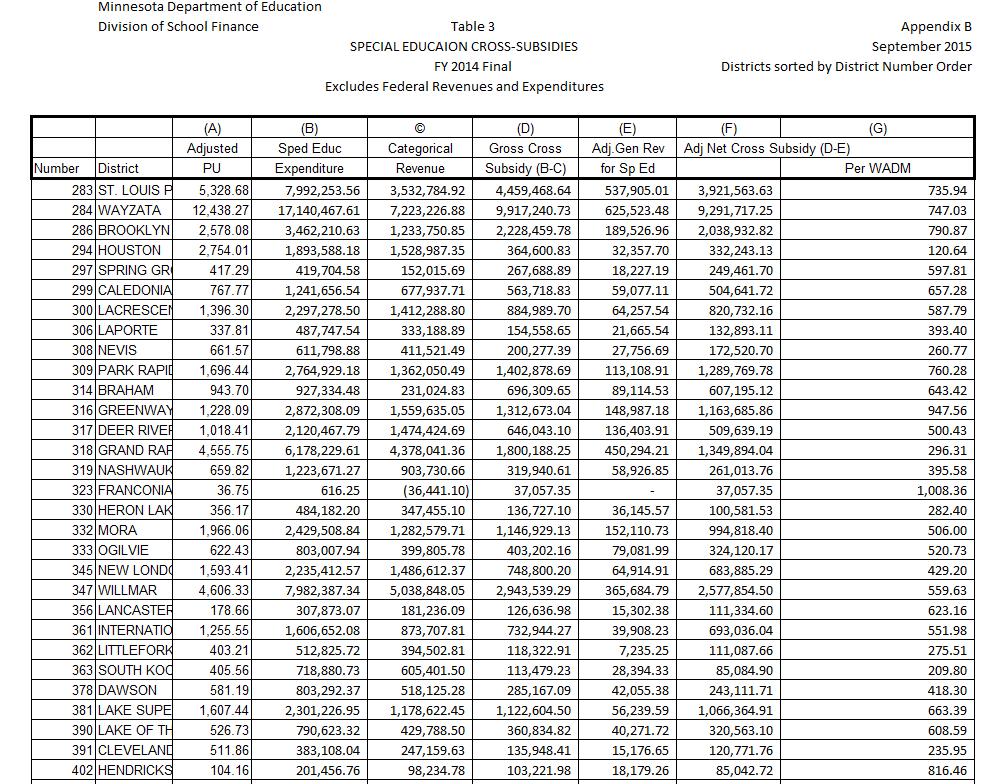
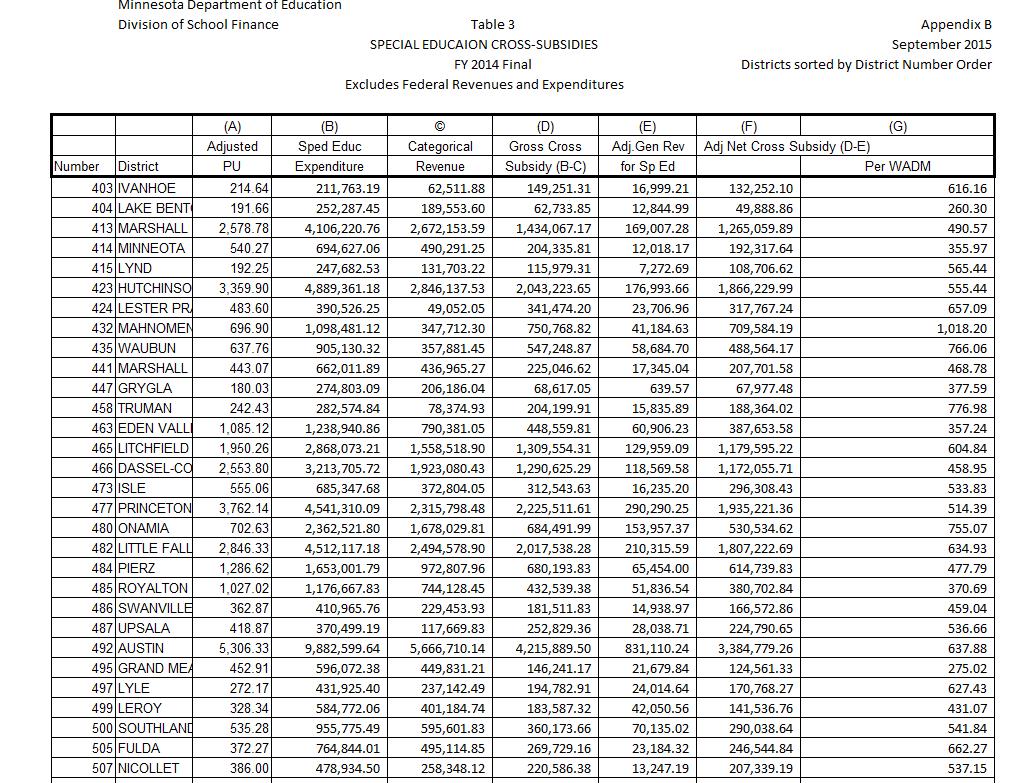
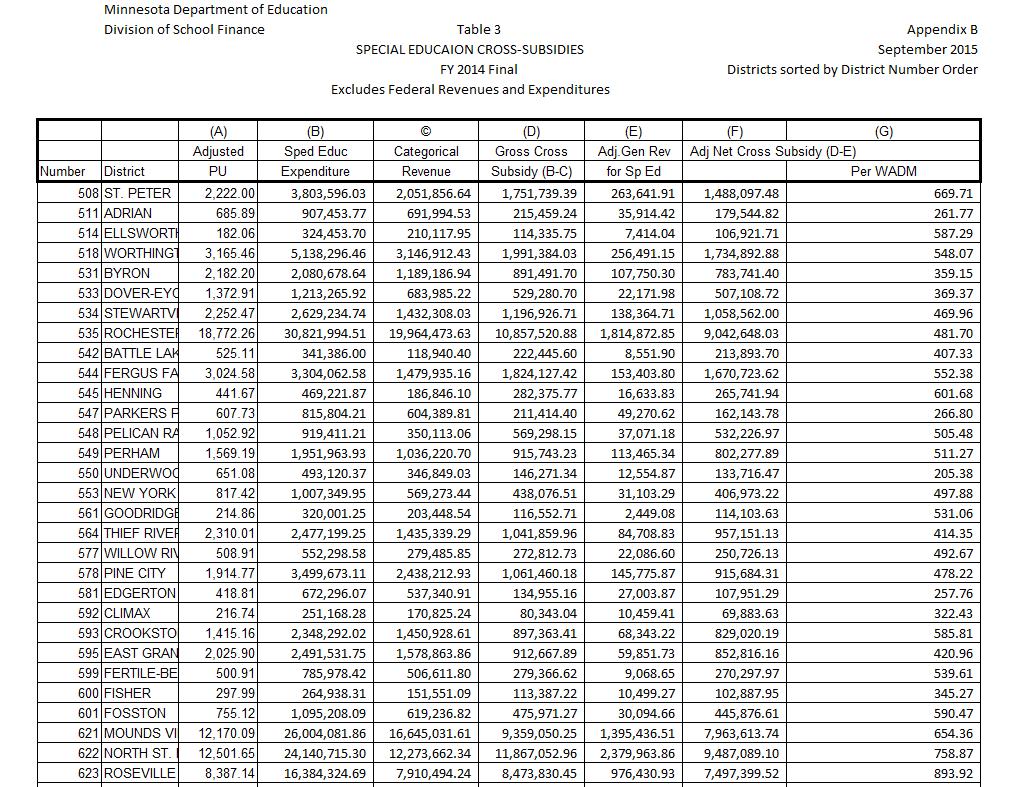
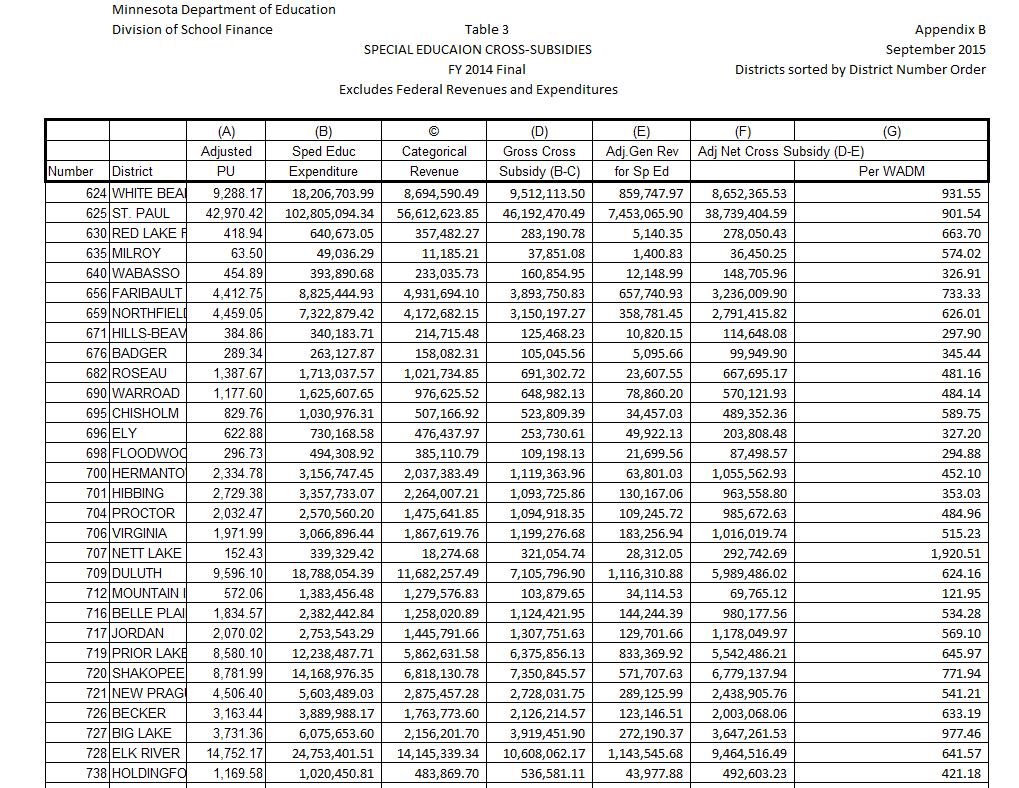
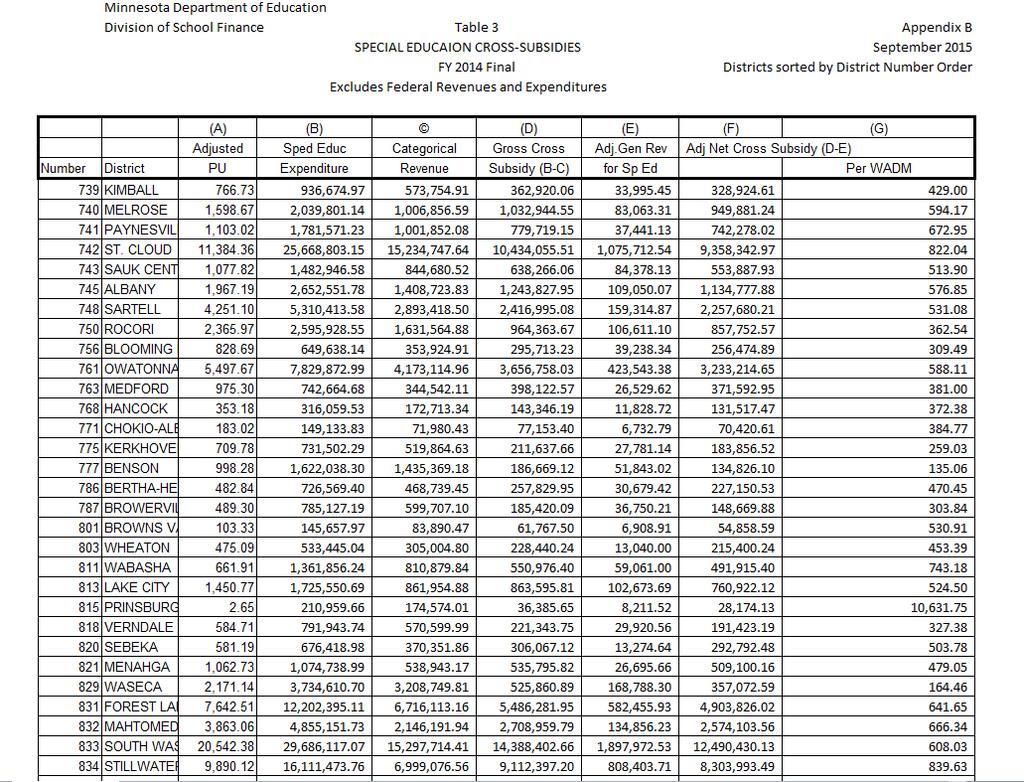
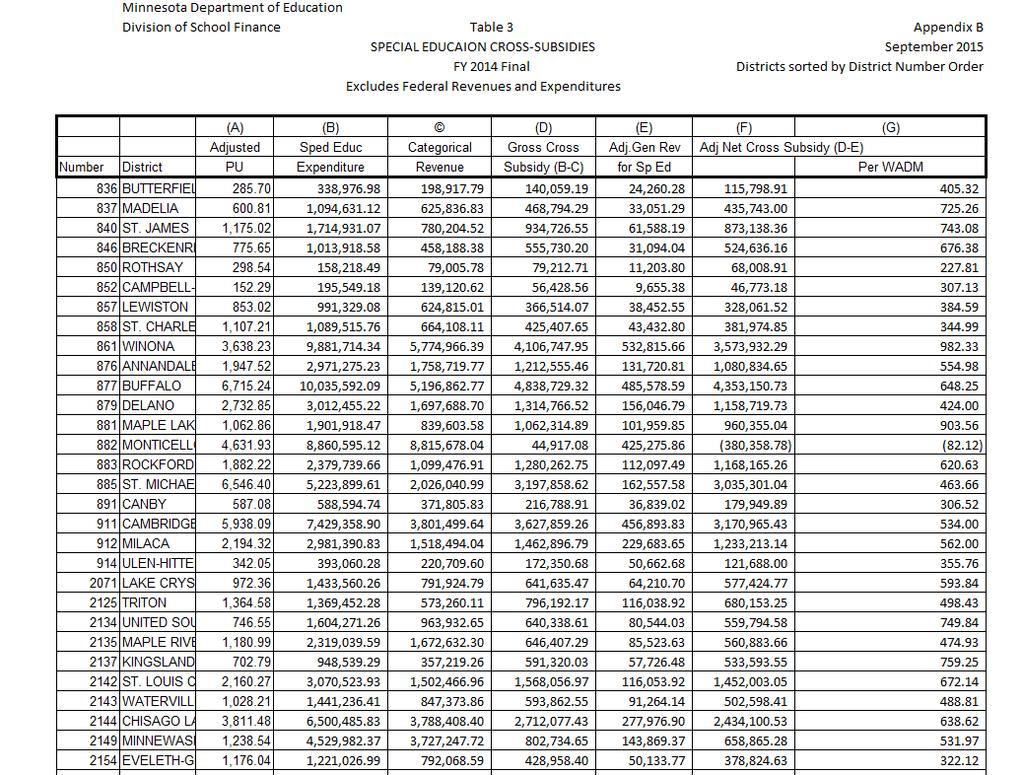
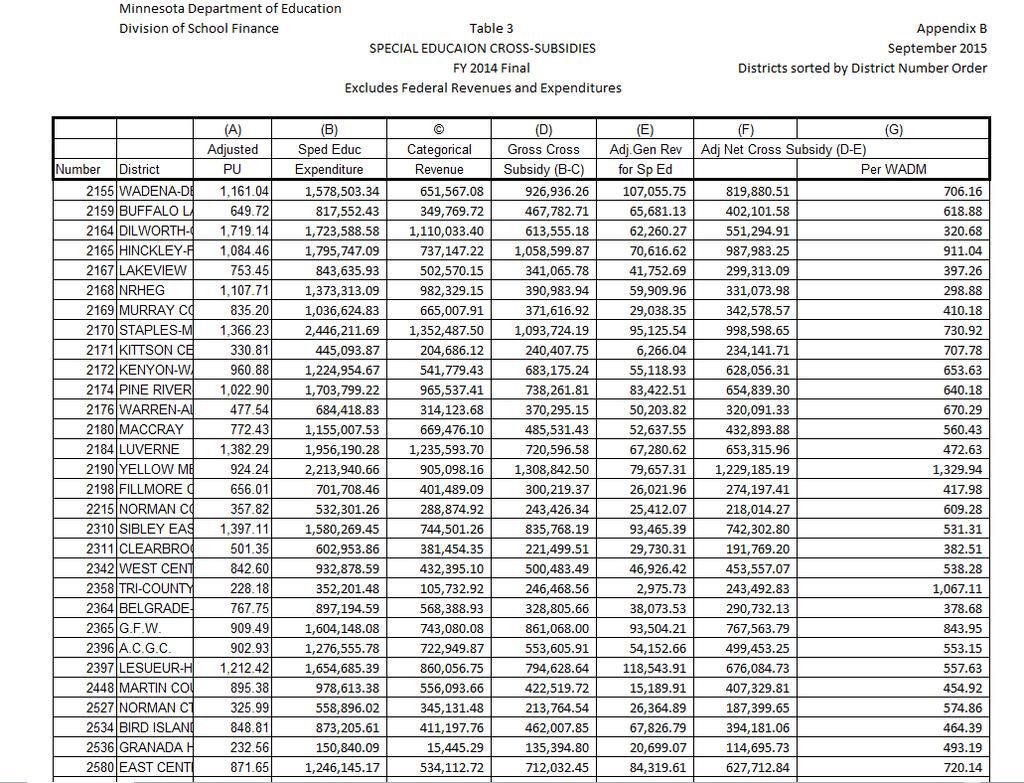
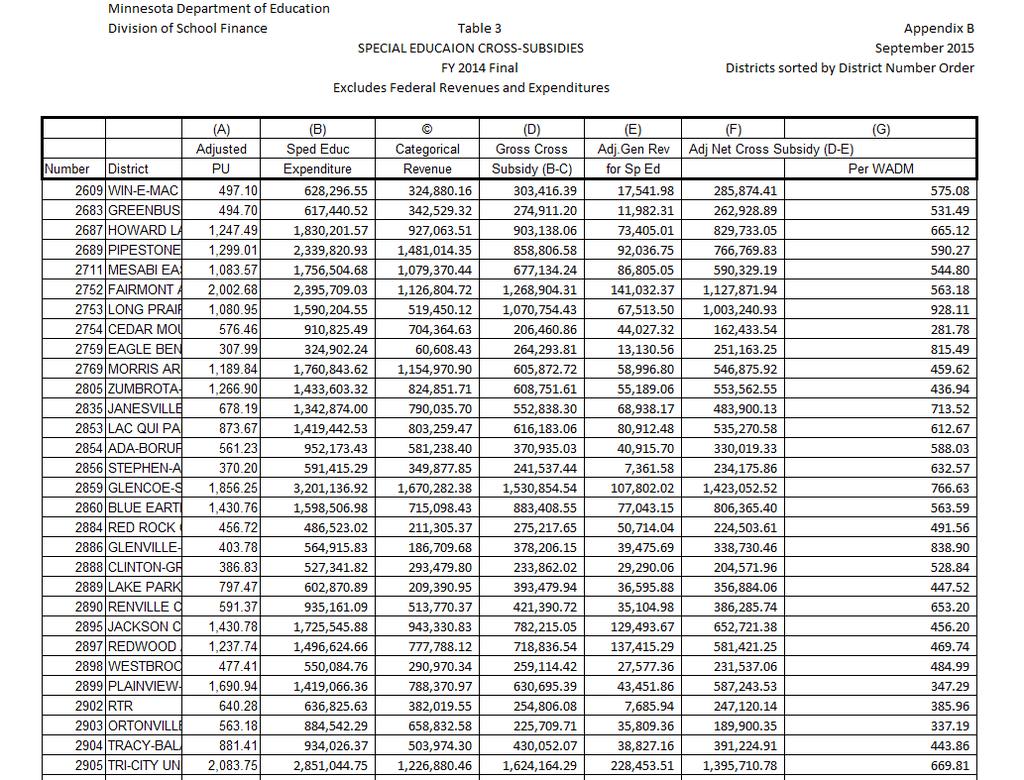
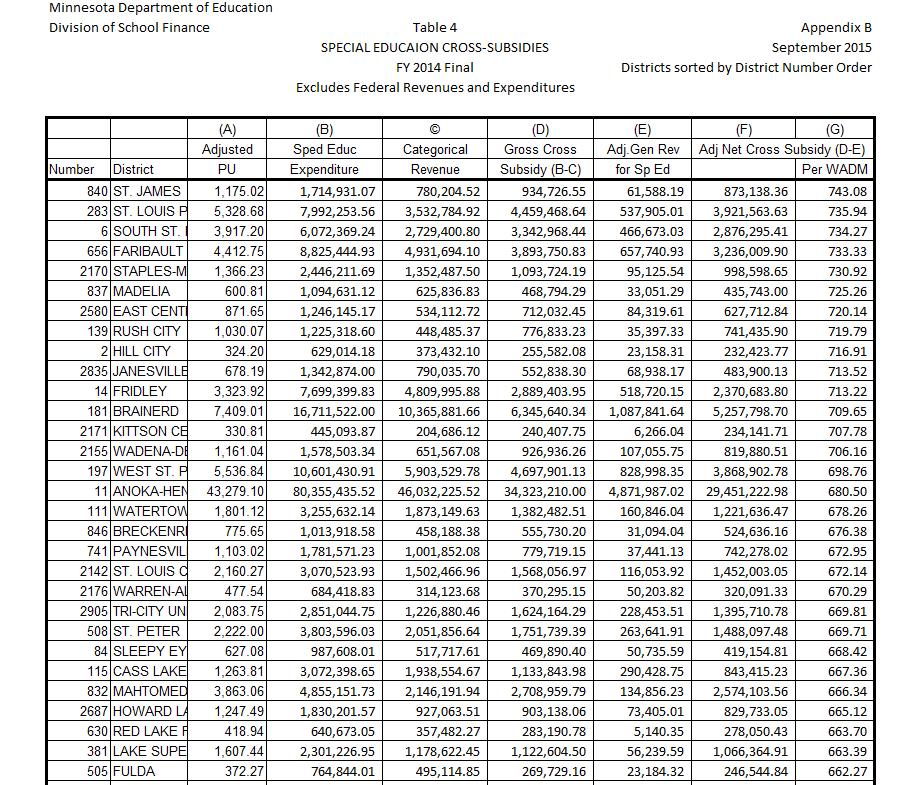
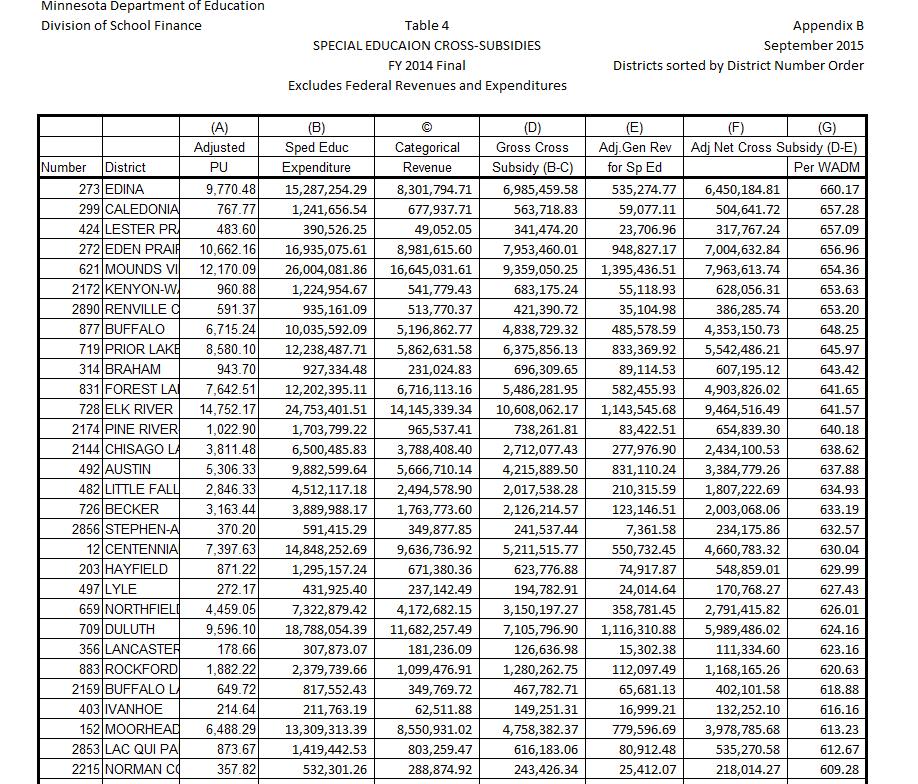
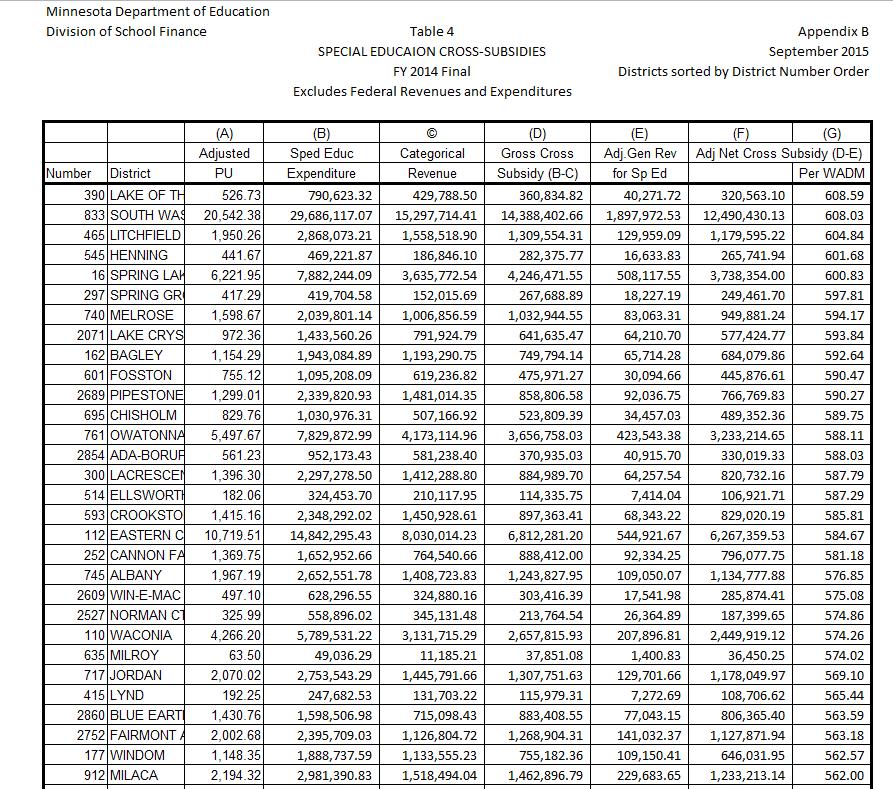
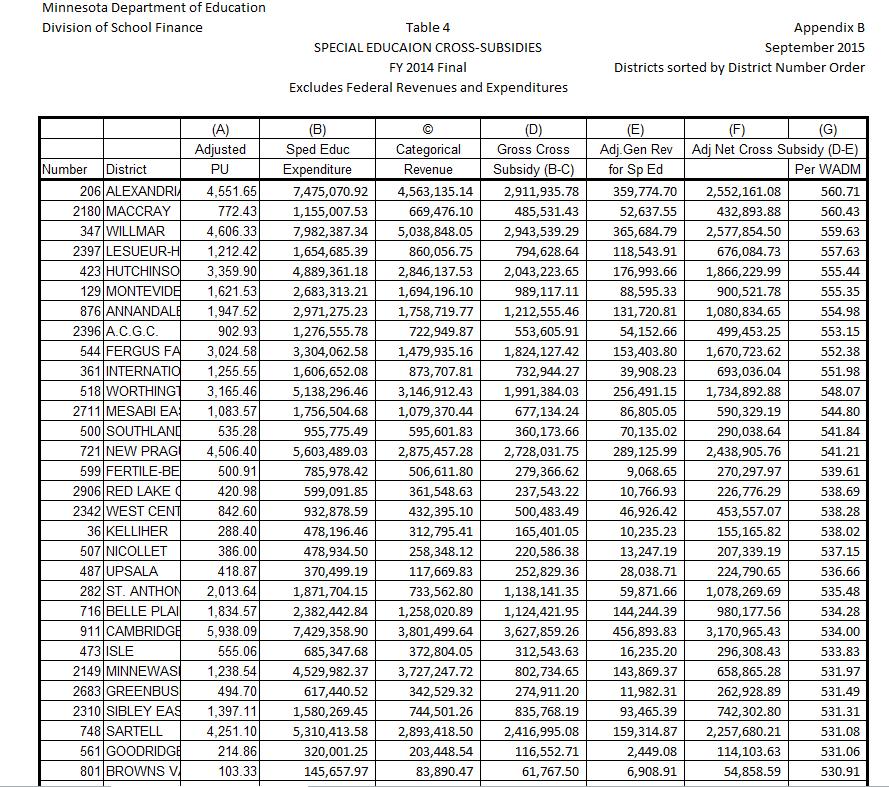
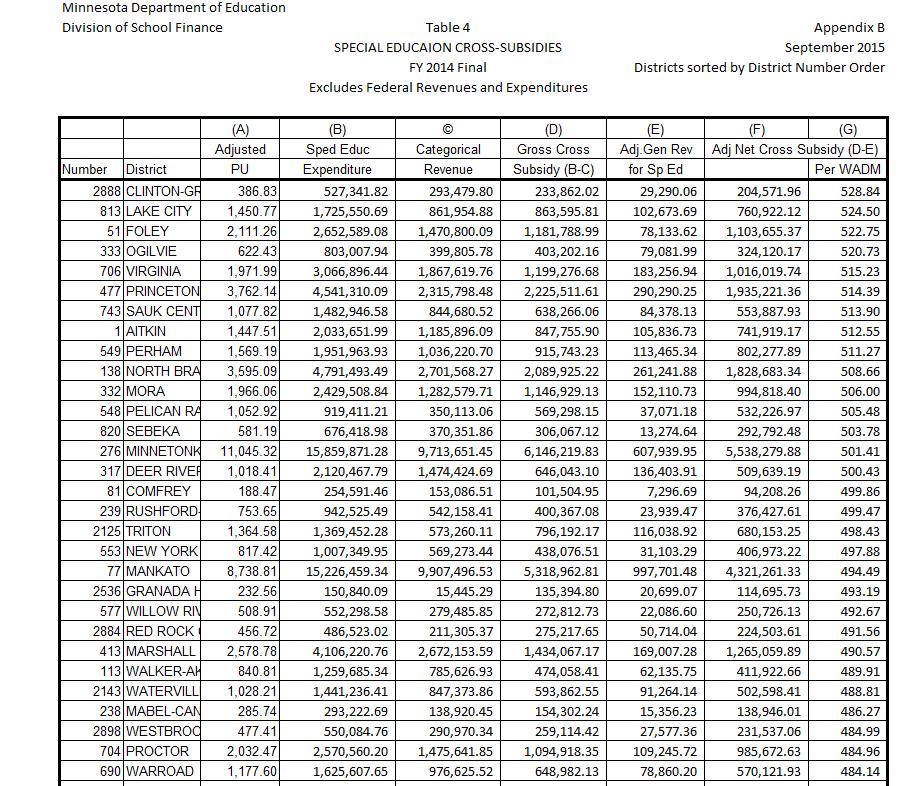
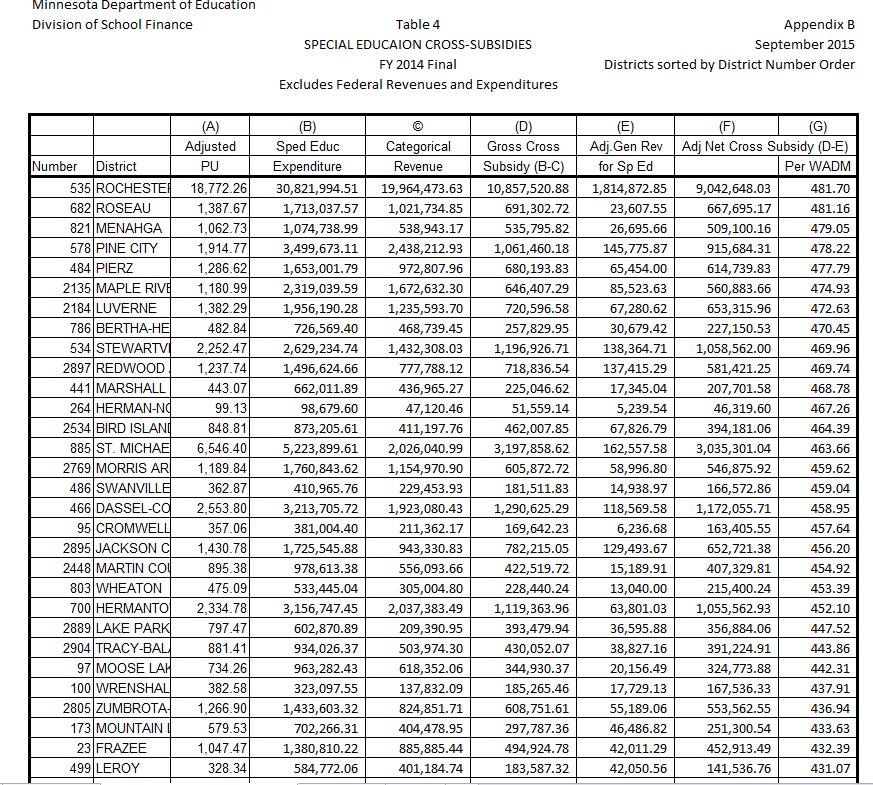
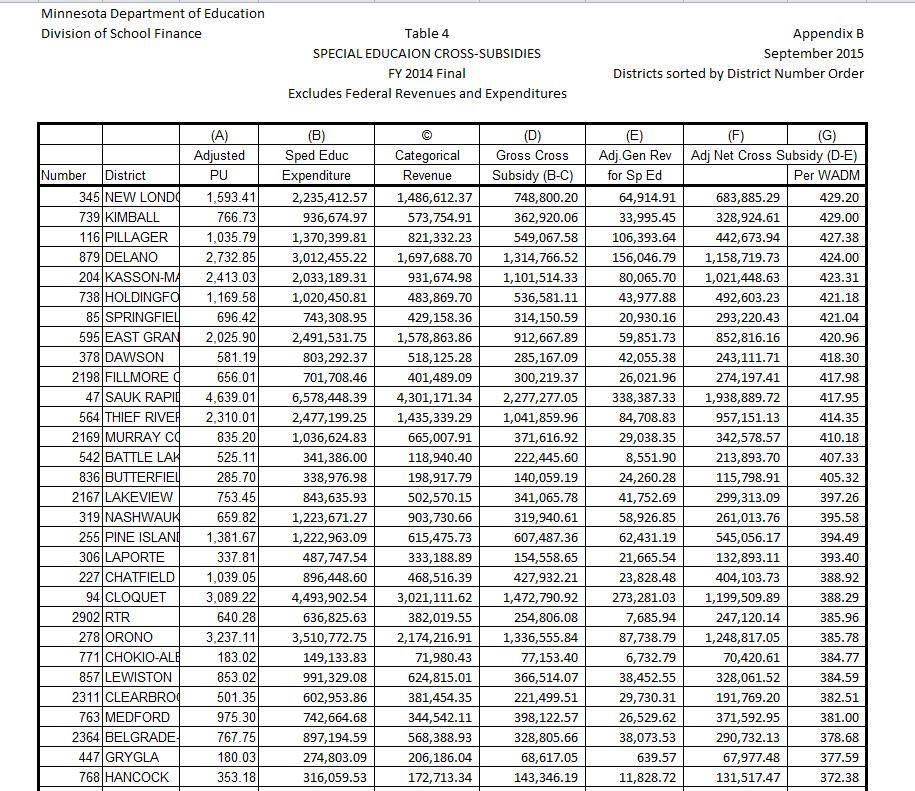
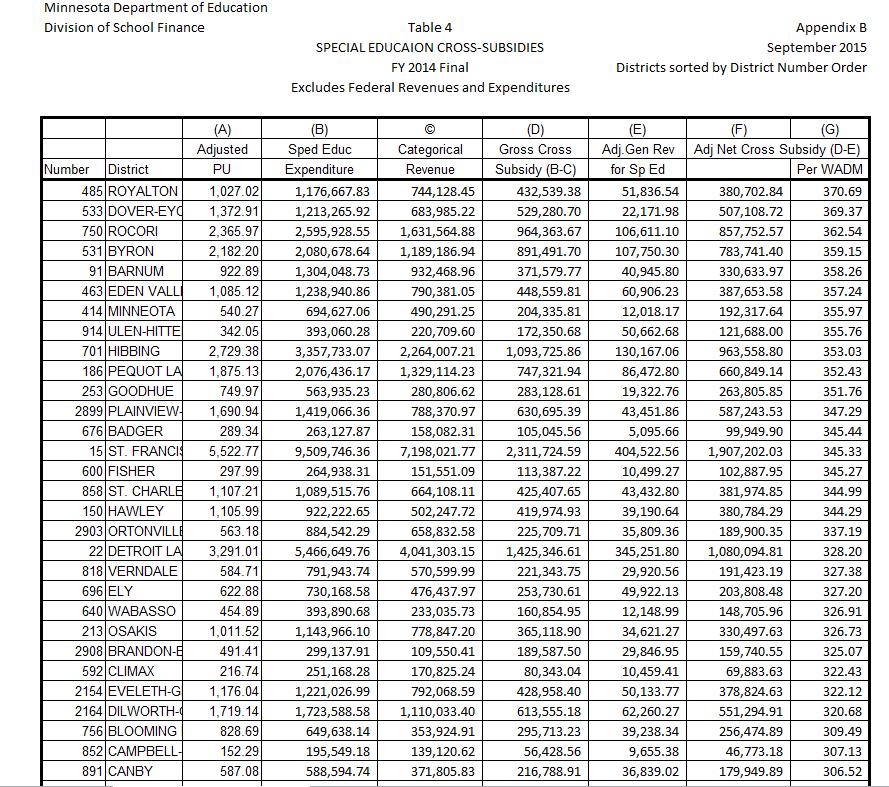
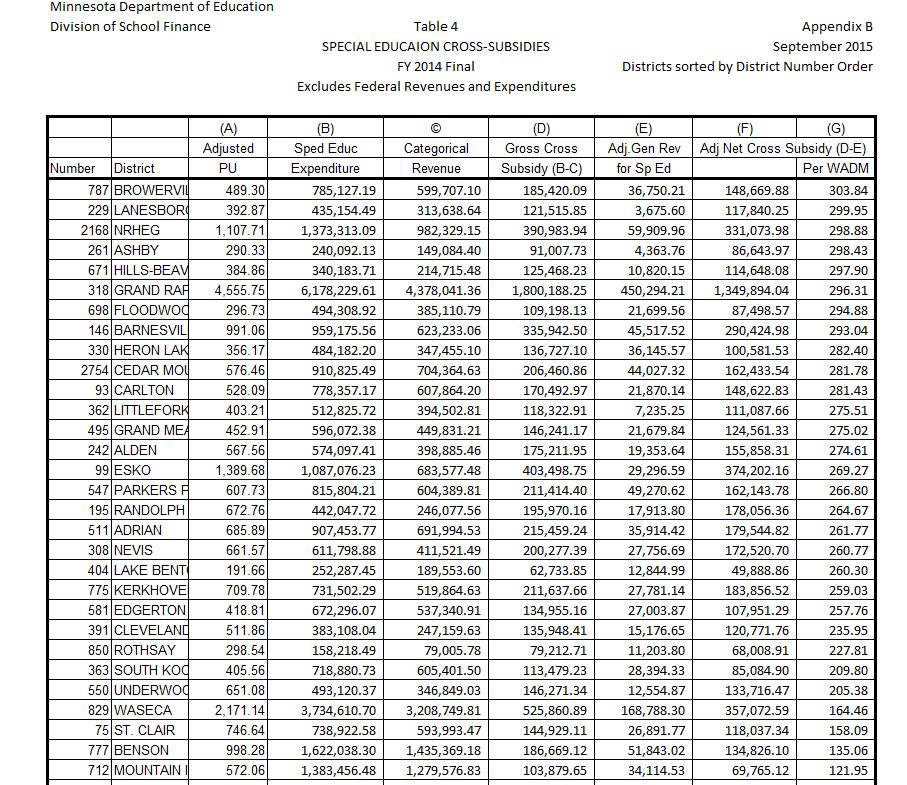
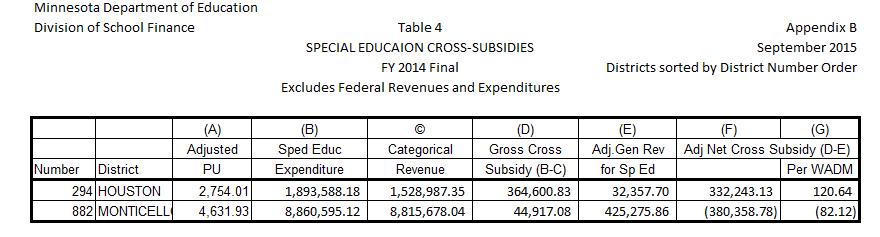
10 District-by-District Cross-Subsidy Reports, FY 2014 Appendix B includes reports showing a summary of district-by-district cross-subsidy calculations for FY 2014, sorted in school district number order and by the adjusted net crosssubsidy per adjusted weighted pupil unit. Because some of the data used in the statewide cross-subsidy reports is not available at the school district level (e.g., federal special education revenues and expenditures), the district-bydistrict reports were completed using a simpler methodology that provides a close approximation of the cross-subsidies, but is not as comprehensive as the statewide calculations. More specifically, the district-by-district tables: 1. are limited to state-funded special education expenditures and revenues, excluding federally funded expenditures and revenues, 2. include data only for school districts and not for charter schools and 3. reflect net adjustments for these transactions in the state special education aid paid to the resident and serving districts, with the advent of the system of state aid adjustments for students served outside the resident district in FY Table 2 provides a comparison of average cross-subsidies for FY 2014 by school district strata, based on the district-by-district reports included in Appendix B (tables 3 and 4): State totals are lower than the amounts shown in Table 1 due to the differences in methodology outlined 10

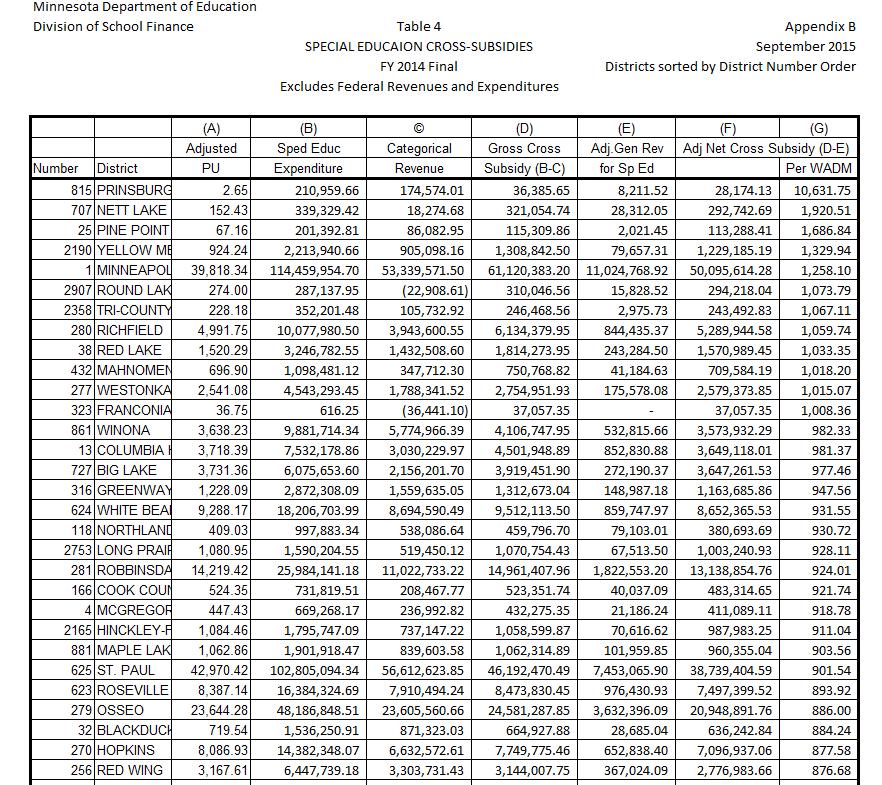
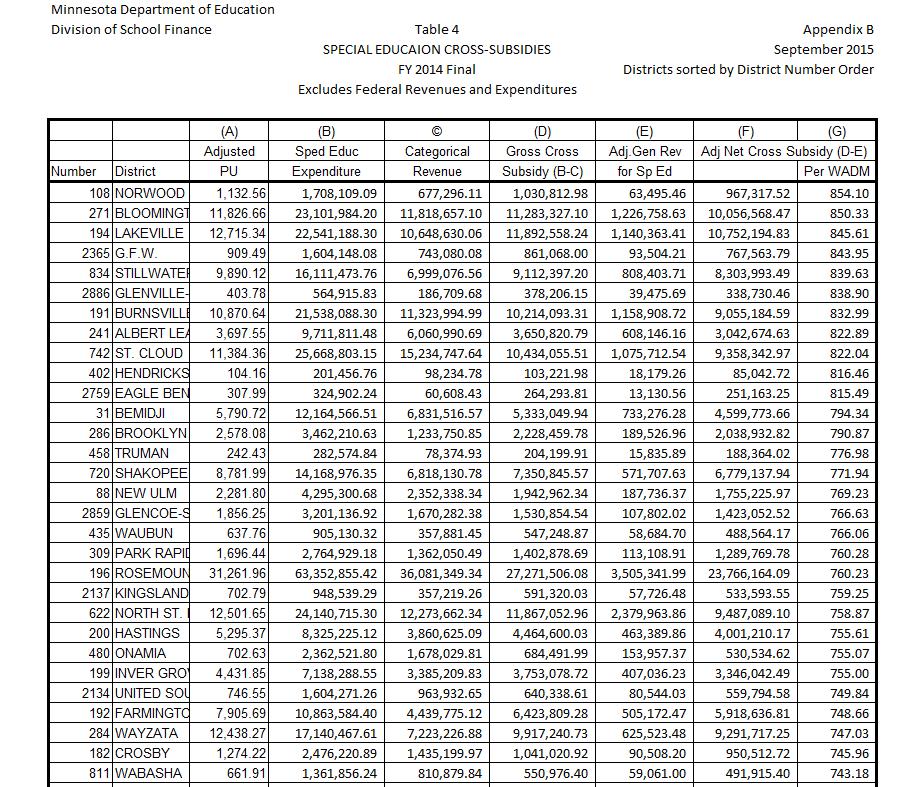
11 above. The average adjusted net cross-subsidies per pupil unit fall between $537 and $776 per pupil unit for all groups of districts except for the smallest non-metro districts, which have an average cross subsidy of $502 per pupil unit, and the Minneapolis and St. Paul districts, which have an average cross subsidy of $1,073 per pupil unit. Table three in Appendix B displays the amount that each district cross-subsidizes special education costs with general revenue sorted by district number order. Column D displays the calculation of each district s gross cross-subsidy. Column F displays the calculation of each districts adjusted net cross-subsidy. Column G displays the amount of each districts adjusted net cross-subsidy per adjusted weighted pupil unit. Table four in Appendix B displays the amount that each district cross-subsidizes special education costs with general education revenue sorted by the adjusted net cross-subsidy per Adjusted Weighted Pupil Unit (WADM). Detailed individual district cross-subsidies reports may be found on the MDE website by selecting Data Center > Data Reports and Analytics > School Finance Reports > Minnesota Funding Reports (MFR). You may view this report here. A line-by-line description of the data sources used in this detailed cross-subsidies report is provided in Appendix C. 11
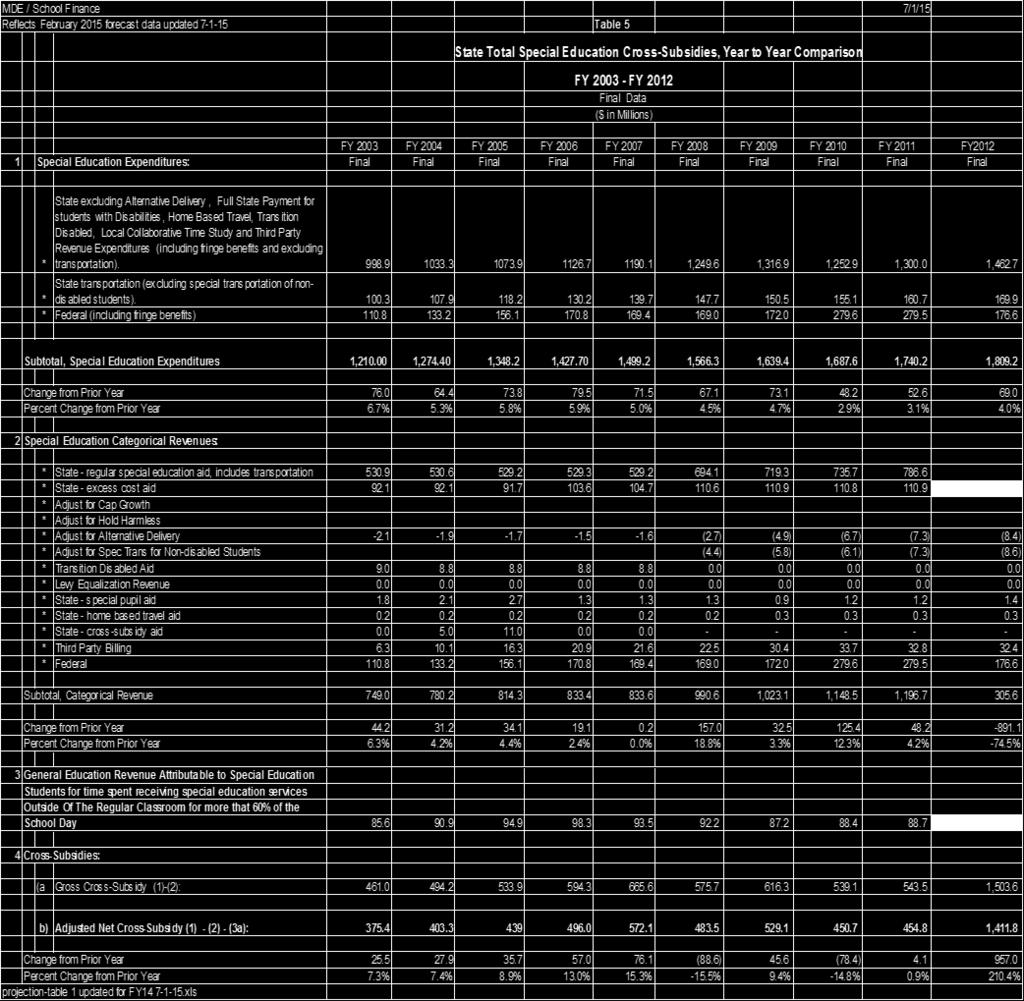
12 Definitions Appendix A Special Education Expenditures Special education expenditures were defined to include all special education expenditures reported for state funding purposes, plus fringe benefits for special education staff funded with state aids (fringe benefits are not included in the state funding base). SPECIAL NOTE: Two cost categories have been funded through the special education funding formulas that do not provide services to special education students as stipulated in their Individualized Educational Programs (IEPs). The first is Alternative Delivery of Specialized Instructional Services (ADSIS) and is designed to provide prevention services as an alternative to special education and other compensatory programs. This program began in 1991 and until recently, represented an insignificant amount of special education expenditures and aids. The second is transportation services provided to students who are homeless, need transportation to care and treatment programs and students who do not have IEPSs but qualify for special transportation under Section 504 of the Federal Rehabilitation Act of These transportation expenditures are reported under the Uniform Financial and Reporting System (UFARS) Finance code 728. Expenditures and aids attributable to these two cost categories were included in previous cross-subsidy reports but are excluded from this report to provide a more precise calculation of special education cross-subsidies. Further, it was determined that although expenditures for serving children receiving early childhood special education services had been included in the cross-subsidy analysis, the general education revenue attributable to these children was not accounted for in previous cross-subsidy reports. To provide comparable cross-subsidy calculations for FY , adjustments were made to exclude ADSIS and Finance 728 transportation revenues and expenditures and to include general education revenue attributable to early childhood special education for prior years going back to FY Recomputed cross-subsidies for these earlier years are shown in Table 5. In order to calculate fringe benefits for special education staff funded with state aids, the salaries for UFARS Finance Dimension Code 740 (Special Education) were summed from district final and audited UFARS data. Fringe benefits (Object Series ) were downloaded from UFARS final and audited data and summed. The charge backs using Federal Section 611 (UFARS Finance Dimension 419) and third party revenue (UFARS Finance Dimension 372) were then added to the benefits from UFARS Finance 740. The total fringe benefits, including charge backs were divided by the total salaries. This ratio is called the benefit rate and is applied to all Electronic Data Reporting System (EDRS) salary lines (Service Codes A and U) that are not in error. The percentages times the salaries equal the benefit costs. Cooperative expenditures were accounted for by the tuition billing system. Expenditures for special education transportation were taken from UFARS; all other special education expenditures were taken from year-end special education EDRS reports and transition disabled EDRS reports. State total computations presented in Table 1 include total federal expenditures on a statewide basis only. Federal expenditures were excluded in the district-by-district analysis presented in Tables 3 and 4 because of uncertainty in the allocation of federal expenditures 12
13 among districts participating in cooperatives and the fact that some federal fiscal hosts spend and receive federal funds directly without allocating to districts and charter schools Special Education Categorical Revenues Special education categorical revenues were defined to include state special education aid (including excess cost, special pupil and homebased travel), and third party billing revenue. Revenues earned based on cooperative expenditures were allocated back to the participating districts based on the percentage factors used for special education program aid computations. Cooperative expenditures were accounted for by the tuition billing system. State total computations presented in Table 1 include total federal aid on a statewide basis only. Federal aids were excluded in the district-bydistrict analysis presented in Tables 3 and 4 because of uncertainty in the allocation of federal aids among districts participating in cooperatives and the fact that some federal fiscal hosts spend and receive federal funds directly without allocating to districts and charter schools. General Education Revenue Attributable to Special Education Students for Time Spent Receiving Special Education Services Outside of the Regular Classroom for those who spend 60 percent or more of the school day outside of the regular classroom. The department uses a precise and district-specific method to determine the amount of general education revenue that follows special education students to special education programs. The value of all objects in UFARS Program Codes that are defined as instructional (Program Codes Elementary and Secondary Regular Instruction, Vocational Education Instruction and Special Education Instruction) and the value of all objects in UFARS Program Codes that are defined as non-instructional (Program Codes Administration, Pupil Support Services and Sites and Buildings) are downloaded for each district. The value of all objects in the instructional program codes is divided by the combined value of all objects in the instructional and non-instructional program codes to calculate an instructional rate for each district. The instructional rate is multiplied by the general education revenue per pupil unit of each district to calculate adjusted general education revenue per pupil unit. The adjusted general education revenue that follows the student equals the adjusted general education revenue per pupil unit, times the full-time equivalent number of pupil units attributable to all special education students who receive special education services outside the regular classroom for 60 percent or more of the school day times that portion of the day that they spend outside of the regular classroom (federal settings III through VIII). To determine the number of full-time equivalent pupil units attributable to special education students for the time they spend receiving special education services outside of the regular classroom, the average daily membership of students by federal special education setting was taken from the student accounting system Minnesota Automated Reporting Student System, (MARSS). To establish an initial estimate of full-time-equivalency, it was assumed that the percent of time spent receiving special education services outside of the regular classroom reflects the midpoint for each federal setting. This is consistent with the methodology used by the Office of the Legislative Auditor in its 1997 program evaluation report on special education. For example, Setting I includes students spending 0 to 20 percent of their time outside of the regular classroom; we assumed that the average percent of time outside of the regular classroom for students in Setting I is 10 percent. Setting II includes students spending 21 13
14 percent to 60 percent of their time outside of the regular classroom; we assumed that the average percent of time outside of the regular classroom for students in Setting II is 40 percent. Setting III includes students spending more than 60 percent of their time outside of the regular classroom. In the data reported here we assumed 80 percent, the midpoint for Setting III. Computation of Cross-Subsidies For purposes of the district-by-district tables, cross-subsidies were computed using two separate definitions: The gross cross-subsidy was defined as the difference between state special education expenditures and state categorical special education revenues, without regard to general education revenues following students. The adjusted net cross-subsidy was defined as the difference between state special education expenditures and state categorical special education revenues, less the amount of general education revenue attributable to those special education students served more than 60 percent of the time outside of the regular classroom for the time they spend receiving special education services outside of the regular classroom. 14

15 Appendix B 15
16 16
17 17
18 18
19 19
20 20
21 21
22 22
23 23
24 24
25 25
26 26
27 27
28 28
29 29
30 30
31 31
32 32
33 33
34 34
35 35
36 36
37 37
38 38
39 39
40 Data Sources Appendix C SPECIAL EDUCATION CROSS-SUBSIDIES REPORT, FY 2014 Line 1, Adjusted General Education Revenue per Adjusted Pupil Unit (Current Year) for Cross-Subsidy Computation The amount shown on this line was computed as explained in detail in Appendix A. Line 2 Adjusted Pupil Units (Current Year) By Special Education Federal Settings The settings are defined as follows: EARLY CHILDHOOD SPECIAL EDUCATION Learners receiving services through early childhood special education programs generate at least.28 Full Time Equivalents (FTE). SETTING I Learners receiving the majority of their education program in regular class. Includes children and youth with disabilities, receiving special education and related services OUTSIDE THE REGULAR CLASSROOM for less than 21 percent of the school day. SETTING II Learners receiving education programs in a resource room. Includes children and youth with disabilities receiving special education and related services OUTSIDE THE REGULAR CLASSROOM for 60 percent or less of the school day and at least 21percent of the school day. SETTING III Learners receiving education programs in separate class. Includes children and youth with disabilities receiving special education and related services OUTSIDE THE REGULAR CLASSROOM for more than 60 percent of the school day. DOES NOT include pupils who received education programs in public or private separate day or residential facilities. SETTING IV- Learners receiving education programs in public separate day school facilities. Includes children and youth with disabilities receiving special education and related services for greater than 50 percent of the school day in separate facilities. SETTING V Learners receiving education programs in private separate day school facilities at public expense for greater than 50 percent of the school day. SETTING VI Learners receiving education programs in public residential facilities for greater than 50 percent of the school day. SETTING VII Learners receiving education programs in private residential facilities at public expense for greater than 50 percent of the school day. SETTING VIII Learners receiving education programs in homebound/hospital placement. Includes children and youth with disabilities placed in and receiving education in hospital programs or homebound programs. The data showing Adjusted Pupil Unit (PU) by special education setting are based on pupil data from MARSS, adjusted for the grade level weighting factors (1.25 for Pre-Kindergarten (PK), 1.00 for disabled Kindergarten (K),.557 for regular K, for grades 1 3, 1.06 for grades 4 6, and 1.30 for secondary) to determine the Adjusted Weight Pupil Unit (AWPU). 40
41 Changes to the AWPU by setting were made only by changing the special education settings for individual students on MARSS. Line 3 Percent of School Day Students Spend In Special Education Settings The percentages shown on the report are MDE estimates based on the midpoints for each federal setting. For example, the 10 percent assumption for Setting I is the midpoint of the range for Setting 1 (0 percent to 20 percent). Line 4 General Education Revenue Attributable to Special Education Students for the Time They Spend In Special Education This was calculated as shown. Lines 5 Special Education Expenditures These data are reported on EDRS, as summarized on reports sent to districts and as explained in Appendix A. Line 6 State Calculated Fringe Benefits This was calculated as shown. Line 7 Special Education Transportation Expenditures This is the district s FY 2014 expenditure for special education transportation, as reported to MDE under Finance codes 723, excluding Finance code 728, through UFARS and special education bus depreciation as reported to MDE as of December 31, This amount has previously been displayed on regular and excess cost aid reports. Line 8 Total Special Education Expenditure This was calculated as shown. Lines 9 15 Special Education Categorical Revenues These amounts were calculated using the data shown above. The aid entitlement reports available on MDE s Web page show the aid computations for several of the component formulas. Lines General Education Cross-Subsidy of Special Education These amounts were calculated as shown. 41
Financing Education In Minnesota
 Financing Education In Minnesota 2016-2017 Created with Tagul.com A Publication of the Minnesota House of Representatives Fiscal Analysis Department August 2016 Financing Education in Minnesota 2016-17
MINNESOTA SCHOOL BOARDS ASSOCIATION
 MINNESOTA SCHOOL BOARDS ASSOCIATION 2017 DELEGATE ASSEMBLY RESOLUTIONS AND BACKGROUND INFORMATION MSBA DELEGATE ASSEMBLY December 1-2, 2017 DoubleTree by Hilton Hotel, Minneapolis 2017 DELEGATE ASSEMBLY
FY 2018 Guidance Document for School Readiness Plus Program Design and Site Location and Multiple Calendars Worksheets
 FY 2018 Guidance Document for School Readiness Plus Program Design and Site Location and Multiple Calendars Worksheets June 8, 2017 The FY 2018 School Readiness Plus Program Design and Site Location worksheet
An Introduction to School Finance in Texas
 An Introduction to School Finance in Texas May 12, 2010 Sheryl Pace TTARA Research Foundation space@ttara.org (512) 472-8838 Texas Public Education System 1,300 school districts (#1 in the nation) 1,025
FTE General Instructions
 Florida Department of Education Bureau of PK-20 Education Data Warehouse and Office of Funding and Financial Reporting FTE General Instructions 2017-18 Questions and comments regarding this publication
TRENDS IN. College Pricing
 2008 TRENDS IN College Pricing T R E N D S I N H I G H E R E D U C A T I O N S E R I E S T R E N D S I N H I G H E R E D U C A T I O N S E R I E S Highlights 2 Published Tuition and Fee and Room and Board
Massachusetts Department of Elementary and Secondary Education. Title I Comparability
 Massachusetts Department of Elementary and Secondary Education Title I Comparability 2009-2010 Title I provides federal financial assistance to school districts to provide supplemental educational services
CHAPTER 4: REIMBURSEMENT STRATEGIES 24
 CHAPTER 4: REIMBURSEMENT STRATEGIES 24 INTRODUCTION Once state level policymakers have decided to implement and pay for CSR, one issue they face is simply how to calculate the reimbursements to districts
HOUSE OF REPRESENTATIVES AS REVISED BY THE COMMITTEE ON EDUCATION APPROPRIATIONS ANALYSIS
 BILL #: HB 269 HOUSE OF REPRESENTATIVES AS REVISED BY THE COMMITTEE ON EDUCATION APPROPRIATIONS ANALYSIS RELATING TO: SPONSOR(S): School District Best Financial Management Practices Reviews Representatives
Personnel Administrators. Alexis Schauss. Director of School Business NC Department of Public Instruction
 Personnel Administrators Alexis Schauss Director of School Business NC Department of Public Instruction Delivering Bad News in a Good Way Planning Allotments are NOT Allotments Budget tool New Allotted
Description of Program Report Codes Used in Expenditure of State Funds
 Program Report Codes (PRC) A program report code (PRC) is an accounting term and is used for the allocation and accounting of funds. The PRCs (allocations) may change from year to year depending on the
About the College Board. College Board Advocacy & Policy Center
 15% 10 +5 0 5 Tuition and Fees 10 Appropriations per FTE ( Excluding Federal Stimulus Funds) 15% 1980-81 1981-82 1982-83 1983-84 1984-85 1985-86 1986-87 1987-88 1988-89 1989-90 1990-91 1991-92 1992-93
1.0 INTRODUCTION. The purpose of the Florida school district performance review is to identify ways that a designated school district can:
 1.0 INTRODUCTION 1.1 Overview Section 11.515, Florida Statutes, was created by the 1996 Florida Legislature for the purpose of conducting performance reviews of school districts in Florida. The statute
The Ohio State University Library System Improvement Request,
 The Ohio State University Library System Improvement Request, 2005-2009 Introduction: A Cooperative System with a Common Mission The University, Moritz Law and Prior Health Science libraries have a long
PUBLIC SCHOOL OPEN ENROLLMENT POLICY FOR INDEPENDENCE SCHOOL DISTRICT
 PUBLIC SCHOOL OPEN ENROLLMENT POLICY FOR INDEPENDENCE SCHOOL DISTRICT Policy 423.1 This policy shall be administered in accordance with the state public school open enrollment law in sections 118.51 and
Trends in Higher Education Series. Trends in College Pricing 2016
 Trends in Higher Education Series Trends in College Pricing 2016 See the Trends in Higher Education website at trends.collegeboard.org for figures and tables in this report and for more information and
State Budget Update February 2016
 State Budget Update February 2016 2016-17 BUDGET TRAILER BILL SUMMARY The Budget Trailer Bill Language is the implementing statute needed to effectuate the proposals in the annual Budget Bill. The Governor
Financial Plan. Operating and Capital. May2010
 10 Financial Plan Operating and Capital May2010 Published by: The Division of Planning and Budget Cornell University 440 Day Hall Ithaca, New York 14853 http://dpb.cornell.edu 607 255 0155 May 2010 Edited
GRADUATE STUDENTS Academic Year
 Financial Aid Information for GRADUATE STUDENTS Academic Year 2017-2018 Your Financial Aid Award This booklet is designed to help you understand your financial aid award, policies for receiving aid and
Summary of Special Provisions & Money Report Conference Budget July 30, 2014 Updated July 31, 2014
 6.4 (b) Base Budget This changes how average daily membership is built in the Budget. Until now, projected ADM increases have been included in the continuation budget. This special provision defines what
Basic Skills Plus. Legislation and Guidelines. Hope Opportunity Jobs
 Basic Skills Plus Legislation and Guidelines Hope Opportunity Jobs Page 2 of 7 Basic Skills Plus Legislation When the North Carolina General Assembly passed the 2010 budget bill, one of their legislative
Michigan and Ohio K-12 Educational Financing Systems: Equality and Efficiency. Michael Conlin Michigan State University
 Michigan and Ohio K-12 Educational Financing Systems: Equality and Efficiency Michael Conlin Michigan State University Paul Thompson Michigan State University October 2013 Abstract This paper considers
Average Daily Membership Proposed Change to Chapter 8 Rules and Regulations for the Wyoming School Foundation Program
 Average Daily Membership Proposed Change to Chapter 8 Rules and Regulations for the Wyoming School Foundation Program Jim McBride, Ed.D. State Superintendent of Public Instruction The (WDE) is proposing
Estimating the Cost of Meeting Student Performance Standards in the St. Louis Public Schools
 Estimating the Cost of Meeting Student Performance Standards in the St. Louis Public Schools Prepared by: William Duncombe Professor of Public Administration Education Finance and Accountability Program
ILLINOIS DISTRICT REPORT CARD
 -6-525-2- HAZEL CREST SD 52-5 HAZEL CREST SD 52-5 HAZEL CREST, ILLINOIS and federal laws require public school districts to release report cards to the public each year. 2 7 ILLINOIS DISTRICT REPORT CARD
Availability of Grants Largely Offset Tuition Increases for Low-Income Students, U.S. Report Says
 Wednesday, October 2, 2002 http://chronicle.com/daily/2002/10/2002100206n.htm Availability of Grants Largely Offset Tuition Increases for Low-Income Students, U.S. Report Says As the average price of attending
Trends & Issues Report
 Trends & Issues Report prepared by David Piercy & Marilyn Clotz Key Enrollment & Demographic Trends Options Identified by the Eight Focus Groups General Themes 4J Eugene School District 4J Eugene, Oregon
ILLINOIS DISTRICT REPORT CARD
 -6-525-2- Hazel Crest SD 52-5 Hazel Crest SD 52-5 Hazel Crest, ILLINOIS 2 8 ILLINOIS DISTRICT REPORT CARD and federal laws require public school districts to release report cards to the public each year.
Financial aid: Degree-seeking undergraduates, FY15-16 CU-Boulder Office of Data Analytics, Institutional Research March 2017
 CU-Boulder financial aid, degree-seeking undergraduates, FY15-16 Page 1 Financial aid: Degree-seeking undergraduates, FY15-16 CU-Boulder Office of Data Analytics, Institutional Research March 2017 Contents
House Finance Committee Unveils Substitute Budget Bill
 April 28, 2017 House Finance Committee Unveils Substitute Budget Bill On Tuesday, April 25, the House Finance Committee adopted a substitute version of House Bill 49, the budget bill for Fiscal Years (FY)
DRAFT VERSION 2, 02/24/12
 DRAFT VERSION 2, 02/24/12 Incentive-Based Budget Model Pilot Project for Academic Master s Program Tuition (Optional) CURRENT The core of support for the university s instructional mission has historically
Greetings, Ed Morris Executive Director Division of Adult and Career Education Los Angeles Unified School District
 Greetings, The thesis of my presentation at this year s California Adult Education Administrators (CAEAA) Conference was that the imprecise and inconsistent nature of the statute authorizing adult education
KSBA Staff Review of HB 520 Charter Schools Rep. Carney - (as introduced )
") KSBA Staff Review of HB 520 Charter Schools Rep. Carney - (as introduced 2-17-17) Section Statute Summary Comments 1 pg. 1 DEFINITIONS FOR SECTIONS 1 TO 10 Definition of achievement gap conflicts with
KSBA Staff Review of HB 520 Charter Schools Rep. Carney - (as introduced 2-17-17) Section Statute Summary Comments 1 pg. 1 DEFINITIONS FOR SECTIONS 1 TO 10 Definition of achievement gap conflicts with
Trends in College Pricing
 Trends in College Pricing 2009 T R E N D S I N H I G H E R E D U C A T I O N S E R I E S T R E N D S I N H I G H E R E D U C A T I O N S E R I E S Highlights Published Tuition and Fee and Room and Board
4.0 CAPACITY AND UTILIZATION
 4.0 CAPACITY AND UTILIZATION The capacity of a school building is driven by four main factors: (1) the physical size of the instructional spaces, (2) the class size limits, (3) the schedule of uses, and
A New Compact for Higher Education in Virginia
 October 22, 2003 A New Compact for Higher Education in Virginia Robert B. Archibald David H. Feldman College of William and Mary 1. Introduction This brief paper describes a plan to restructure the relationship
School of Medicine Finances, Funds Flows, and Fun Facts. Presentation for Research Wednesday June 11, 2014
 School of Medicine Finances, Funds Flows, and Fun Facts Presentation for Research Wednesday June 11, 2014 Duke University Management Center Structure: Duke University Duke University Academic campus Duke
Trends in Student Aid and Trends in College Pricing
 Trends in Student Aid and Trends in College Pricing 2012 NYSFAAA Conference Katrina Delgrosso Senior Educational Manager Agenda What is the College Board Advocacy & Policy Center? Trends in College Pricing
Council on Postsecondary Education Funding Model for the Public Universities (Excluding KSU) Bachelor's Degrees
 Bachelor's Degrees") Bachelor's Degrees Institution 2013-14 2014-15 2015-16 UK 3,988 4,238 4,540 UofL 2,821 2,832 2,705 EKU 2,508 2,532 2,559 MoSU 1,144 1,166 1,306 MuSU 1,469 1,512 1,696 NKU 2,143 2,214 2,196 WKU 2,751 2,704
Bachelor's Degrees Institution 2013-14 2014-15 2015-16 UK 3,988 4,238 4,540 UofL 2,821 2,832 2,705 EKU 2,508 2,532 2,559 MoSU 1,144 1,166 1,306 MuSU 1,469 1,512 1,696 NKU 2,143 2,214 2,196 WKU 2,751 2,704
FREQUENTLY ASKED QUESTIONS (FAQs) for. Non-Educational Community-Based Support Services Program
 for. Non-Educational Community-Based Support Services Program") FREQUENTLY ASKED QUESTIONS (FAQs) for Non-Educational Community-Based Support Services Program The term Non-Ed throughout this document denotes: Non-Educational Community-Based Support Services. The term
FREQUENTLY ASKED QUESTIONS (FAQs) for Non-Educational Community-Based Support Services Program The term Non-Ed throughout this document denotes: Non-Educational Community-Based Support Services. The term
Program budget Budget FY 2013
 Program budget Budget FY 2013 Fairfax County, Virginia www.fcps.edu Fairfax County Public Schools FY 2013 Program Budget Ilryong Moon, Chairman Member at Large Pat Hynes, Vice Chairman Hunter Mill District
UPPER ARLINGTON SCHOOLS
 UPPER ARLINGTON SCHOOLS SERVE LEAD SUCCEED CHALLENGE AND SUPPORT EVERY STUDENT, EVERY STEP OF THE WAY. 2014-2015 www.uaschools.org 1950 North Mallway Drive Upper Arlington, Ohio 43221 (614) 487-5000 Introduction
NC Community College System: Overview
 NC Community College System: Overview Presentation to Joint Appropriations Subcommittee on Education Brett Altman Mark Bondo Fiscal Research Division March 18, 2015 Presentation Agenda 1. NCCCS Background
Differential Tuition Budget Proposal FY
 Differential Tuition Budget Proposal FY 2013-2014 MPA Differential Tuition Subcommittee MPA Faculty This document presents the budget proposal of the MPA Differential Tuition Subcommittee (MPADTS) for
CONTINUUM OF SPECIAL EDUCATION SERVICES FOR SCHOOL AGE STUDENTS
 CONTINUUM OF SPECIAL EDUCATION SERVICES FOR SCHOOL AGE STUDENTS No. 18 (replaces IB 2008-21) April 2012 In 2008, the State Education Department (SED) issued a guidance document to the field regarding the
FORT HAYS STATE UNIVERSITY AT DODGE CITY
 FORT HAYS STATE UNIVERSITY AT DODGE CITY INTRODUCTION Economic prosperity for individuals and the state relies on an educated workforce. For Kansans to succeed in the workforce, they must have an education
Educational Quality Assurance Standards. Residential Juvenile Justice Commitment Programs DRAFT
 Educational Quality Assurance Standards Residential Juvenile Justice Commitment Programs 2009 2010 Bureau of Exceptional Education and Student Services Division of K-12 Public Schools Florida Department
UCB Administrative Guidelines for Endowed Chairs
 UCB Administrative Guidelines for Endowed Chairs I. General A. Purpose An endowed chair provides funds to a chair holder in support of his or her teaching, research, and service, and is supported by a
Milton Public Schools Fiscal Year 2018 Budget Presentation
 Milton Public Schools Fiscal Year 2018 Budget Presentation 1 Background 2 How does Milton s per-pupil spending compare to other communities? Boston $18,372 Dedham $17,780 Randolph $16,051 Quincy $16,023
Strategic Plan Dashboard Results. Office of Institutional Research and Assessment
 29-21 Strategic Plan Dashboard Results Office of Institutional Research and Assessment Binghamton University Office of Institutional Research and Assessment Definitions Fall Undergraduate and Graduate
Value of Athletics in Higher Education March Prepared by Edward J. Ray, President Oregon State University
 Materials linked from the 5/12/09 OSU Faculty Senate agenda 1. Who Participates Value of Athletics in Higher Education March 2009 Prepared by Edward J. Ray, President Oregon State University Today, more
(2) GRANT FOR RESIDENTIAL AND REINTEGRATION SERVICES.
 GRANT FOR RESIDENTIAL AND REINTEGRATION SERVICES.") Code: IDDF (18) 160-4-7-.18 GRANTS FOR SERVICES. (1) AUTHORIZATION. (a) The State Board shall have authority to provide grant funds for the implementation of other educational programs or additional personnel
Code: IDDF (18) 160-4-7-.18 GRANTS FOR SERVICES. (1) AUTHORIZATION. (a) The State Board shall have authority to provide grant funds for the implementation of other educational programs or additional personnel
Teacher Supply and Demand in the State of Wyoming
 Teacher Supply and Demand in the State of Wyoming Supply Demand Prepared by Robert Reichardt 2002 McREL To order copies of Teacher Supply and Demand in the State of Wyoming, contact McREL: Mid-continent
EDUCATION AND DECENTRALIZATION
 EDUCATION AND DECENTRALIZATION Skopje, 2006 Education and Decentralization: User-friendly Manual Author: Jovan Ananiev, MSc. Project management: OSCE Spillover Monitor Mission to Skopje/Confidence Building
State Parental Involvement Plan
 A Toolkit for Title I Parental Involvement Section 3 Tools Page 41 Tool 3.1: State Parental Involvement Plan Description This tool serves as an example of one SEA s plan for supporting LEAs and schools
Governor s Office of Budget, Planning and Policy and the Legislative Budget Board. Texas A&M University - Corpus Christi
 LEGISLATIVE APPROPRIATIONS REQUEST For Fiscal Years 212 and 213 Submitted to the Governor s Office of Budget, Planning and Policy and the Legislative Budget Board by Texas A&M University - Corpus Christi
For the Ohio Board of Regents Second Report on the Condition of Higher Education in Ohio
 Facilities and Technology Infrastructure Report For the Ohio Board of Regents Second Report on the Condition of Higher Education in Ohio Introduction. As Ohio s national research university, Ohio State
Higher Education Six-Year Plans
 Higher Education Six-Year Plans 2018-2024 House Appropriations Committee Retreat November 15, 2017 Tony Maggio, Staff Background The Higher Education Opportunity Act of 2011 included the requirement for
THE COLLEGE OF WILLIAM AND MARY IN VIRGINIA INTERCOLLEGIATE ATHLETICS PROGRAMS FOR THE YEAR ENDED JUNE 30, 2005
 THE COLLEGE OF WILLIAM AND MARY IN VIRGINIA INTERCOLLEGIATE ATHLETICS PROGRAMS FOR THE YEAR ENDED JUNE 30, 2005 - T A B L E O F C O N T E N T S INDEPENDENT AUDITOR S REPORT ON APPLICATION OF AGREED-UPON
Tale of Two Tollands
 Tale of Two Tollands 3-14-2017 State of Connecticut Enrollment trends Tolland Public School Enrollment Enrollment 2006-2016 3141 3131 3149 3151 3054 2954 2837 2733 2657 2599 2484 FY 2006-07 FY 2007-08
FY STATE AID ALLOCATIONS AND BUDGET POLICIES
 Attachment FC 4 FY 2013-14 STATE AID ALLOCATIONS AND BUDGET POLICIES STATE BOARD OF COMMUNITY COLLEGES DIVISION OF FINANCE AND OPERATIONS AUGUST 16, 2013 SBCC 08/16/2013 Version 1.0 Document Revision History
STATE CAPITAL SPENDING ON PK 12 SCHOOL FACILITIES NORTH CAROLINA
 STATE CAPITAL SPENDING ON PK 12 SCHOOL FACILITIES NORTH CAROLINA NOVEMBER 2010 Authors Mary Filardo Stephanie Cheng Marni Allen Michelle Bar Jessie Ulsoy 21st Century School Fund (21CSF) Founded in 1994,
NATIONAL CENTER FOR EDUCATION STATISTICS
 NATIONAL CENTER FOR EDUCATION STATISTICS Palm Desert, CA The Integrated Postsecondary Education Data System (IPEDS) is the nation s core postsecondary education data collection program. It is a single,
UCLA Affordability. Ronald W. Johnson Director, Financial Aid Office. May 30, 2012
 UCLA Affordability Ronald W. Johnson Director, Financial Aid Office May 30, 2012 1 UC is affordable First, Students must: Apply for admission in November File FAFSA and GPA Verification Form between January
Fiscal Years [Millions of Dollars] Provision Effective
![Fiscal Years [Millions of Dollars] Provision Effective](/thumbs/71/65805895.jpg "Fiscal Years [Millions of Dollars] Provision Effective") JOINT COMMITTEE ON TAXATION December 3, 2014 JCX-107-14 R ESTIMATED REVENUE EFFECTS OF H.R. 5771, THE "TAX INCREASE PREVENTION ACT OF 2014," SCHEDULED FOR CONSIDERATION BY THE HOUSE OF REPRESENTATIVES
JOINT COMMITTEE ON TAXATION December 3, 2014 JCX-107-14 R ESTIMATED REVENUE EFFECTS OF H.R. 5771, THE "TAX INCREASE PREVENTION ACT OF 2014," SCHEDULED FOR CONSIDERATION BY THE HOUSE OF REPRESENTATIVES
Arkansas Private Option Medicaid expansion is putting state taxpayers on the hook for millions in cost overruns
 Arkansas Private Option Medicaid expansion is putting state taxpayers on the hook for millions in cost overruns ObamaCare advocates repeatedly promise that Medicaid expansion is fully funded by the federal
Series IV - Financial Management and Marketing Fiscal Year
 Series IV - Financial Management and Marketing... 1 4.101 Fiscal Year... 1 4.102 Budget Preparation... 2 4.201 Authorized Signatures... 3 4.2021 Financial Assistance... 4 4.2021-R Financial Assistance
THE ECONOMIC IMPACT OF THE UNIVERSITY OF EXETER
 THE ECONOMIC IMPACT OF THE UNIVERSITY OF EXETER Report prepared by Viewforth Consulting Ltd www.viewforthconsulting.co.uk Table of Contents Executive Summary... 2 Background to the Study... 6 Data Sources
Draft Budget : Higher Education
 The Scottish Parliament and Scottish Parliament Infor mation C entre l ogos. SPICe Briefing Draft Budget 2015-16: Higher Education 6 November 2014 14/79 Suzi Macpherson This briefing reports on funding
NATIONAL CENTER FOR EDUCATION STATISTICS
 NATIONAL CENTER FOR EDUCATION STATISTICS The Integrated Postsecondary Education Data System (IPEDS) is the core postsecondary education data collection program for the NCES. It is a single, comprehensive
A Snapshot of the Graduate School
 A Snapshot of the Graduate School Prepared for the Research Council February 6, 2009 John R. Mullin, Ph.D., FAICP Dean of the Graduate School University of Massachusetts Amherst Graduate School Purpose
Texas A&M University-Texarkana
 LEGISLATIVE APPROPRIATIONS REQUEST For Fiscal Years 216 and 217 Submitted to the Governor s Office of Budget Planning and Policy and the Legislative Budget Board by Texas A&M University-Texarkana October
AB104 Adult Education Block Grant. Performance Year:
 AB104 Adult Education Block Grant Performance Year: 2015-2016 Funding source: AB104, Section 39, Article 9 Version 1 Release: October 9, 2015 Reporting & Submission Process Required Funding Recipient Content
A Comparison of State of Florida Charter Technical Career Centers to District Non-Charter Career Centers,
 A Comparison of State of Florida Charter Technical Career to District Non-Charter Career, 2013-14 At a Glance In school year 2013-14, there were 4,502 students enrolled in the state of Florida s charter
Dr. Brent Benda and Ms. Nell Smith
 School Case Studies Dr. Brent Benda and Ms. Nell Smith Bureau of Legislative Research Case Study Objectives Examine eschools s that have aeachieved ed sg significant improvement and schools that have been
AGENDA ITEM VI-E October 2005 Page 1 CHAPTER 13. FINANCIAL PLANNING
 Page 1 CHAPTER 13. FINANCIAL PLANNING Subchapter F. FORMULA FUNDING AND TUITION CHARGED FOR REPEATED AND EXCESS HOURS OF UNDERGRADUATE STUDENTS Section 13.100. Purpose. 13.101. Authority 13.102. Definitions.
NCEO Technical Report 27
 Home About Publications Special Topics Presentations State Policies Accommodations Bibliography Teleconferences Tools Related Sites Interpreting Trends in the Performance of Special Education Students
SCICU Legislative Strategic Plan 2018
 The primary objective of the South Carolina Independent Colleges and Universities Legislative Strategic Plan is to establish an agenda and course of action for a program of education and advocacy on matters
Charter School Performance Comparable to Other Public Schools; Stronger Accountability Needed
 April 2005 Report No. 05-21 Charter School Performance Comparable to Other Public Schools; Stronger Accountability Needed at a glance On average, charter school students are academically behind when they
Higher Education. Pennsylvania State System of Higher Education. November 3, 2017
 November 3, 2017 Higher Education Pennsylvania s diverse higher education sector - consisting of many different kinds of public and private colleges and universities - helps students gain the knowledge
OREGON TECH ECONOMIC IMPACT ANALYSIS
 OREGON TECH ECONOMIC IMPACT ANALYSIS JANUARY 2016 PREPARED BY: This page left intentionally blank TABLE OF CONTENTS 1 Executive Summary 2 Introduction 3 Oregon Tech s Role in Oregon 4 Career Readiness
Montana's Distance Learning Policy for Adult Basic and Literacy Education
 Montana's Distance Learning Policy for Adult Basic and Literacy Education 2013-2014 1 Table of Contents I. Introduction Page 3 A. The Need B. Going to Scale II. Definitions and Requirements... Page 4-5
Intervention in Struggling Schools Through Receivership New York State. May 2015
 Intervention in Struggling Schools Through Receivership New York State May 2015 The Law - Education Law Section 211-f and Receivership In April 2015, Subpart E of Part EE of Chapter 56 of the Laws of 2015
BENCHMARK TREND COMPARISON REPORT:
 National Survey of Student Engagement (NSSE) BENCHMARK TREND COMPARISON REPORT: CARNEGIE PEER INSTITUTIONS, 2003-2011 PREPARED BY: ANGEL A. SANCHEZ, DIRECTOR KELLI PAYNE, ADMINISTRATIVE ANALYST/ SPECIALIST
Modern Trends in Higher Education Funding. Tilea Doina Maria a, Vasile Bleotu b
 Available online at www.sciencedirect.com ScienceDirect Procedia - Social and Behavioral Scien ce s 116 ( 2014 ) 2226 2230 Abstract 5 th World Conference on Educational Sciences - WCES 2013 Modern Trends
Charter School Reporting and Monitoring Activity
 School Reporting and Monitoring Activity All information and documents listed below are to be provided to the Schools Office by the date shown, unless another date is specified in pre-opening conditions
Orange Elementary School FY15 Budget Overview. Tari N. Thomas Superintendent of Schools
 + Orange Elementary School FY15 Budget Overview Tari N. Thomas Superintendent of Schools + The Key Metrics of the Organization: Orange Elementary Enrollment 661 Attendance 94% Average Class Size 22 Student
Invest in CUNY Community Colleges
 Invest in Opportunity Invest in CUNY Community Colleges Pat Arnow Professional Staff Congress Invest in Opportunity Household Income of CUNY Community College Students
Ho-Chunk Nation Department of Education Pre K-12 Grant Program
 Ho-Chunk Nation Department of Education Pre K-12 Grant Program Application Packet and Guidelines Revised 7/11/06 Second Revision 11/9/06 Office/Mailing/Contact Information Updated 1/3/08 Revised 04/13/10
Strategic Plan Update Year 3 November 1, 2013
 Georgia Network for Educational and Therapeutic Support (GNETS) Strategic Plan Update Year 3 November 1, 2013 Introduction The Georgia Network for Educational and Therapeutic Support (GNETS) is comprised
Student Transportation
 The district has not developed systems to evaluate transportation activities and improve operations. In addition, the district needs to systematically replace its aging buses. Conclusion The Manatee County
Why Philadelphia s Public School Problems Are Bad For Business
 Why Philadelphia s Public School Problems Are Bad For Business Posted on January 26, 2015 by rbadmin in Features By Stuart Michaelson A cursory look at the state of the Philadelphia public-school system
Lakewood Board of Education 200 Ramsey Avenue, Lakewood, NJ 08701
 March 20, 2017 Judee DeStefano-Anen Interim Executive County Superintendent 212 Washington Street Toms River, NJ 08753 Dear Dr. DeStefano-Anen: It is with great sadness that I must inform you that the
Graduate Division Annual Report Key Findings
 Graduate Division 2010 2011 Annual Report Key Findings Trends in Admissions and Enrollment 1 Size, selectivity, yield UCLA s graduate programs are increasingly attractive and selective. Between Fall 2001
TACOMA HOUSING AUTHORITY
 TACOMA HOUSING AUTHORITY CHILDREN s SAVINGS ACCOUNT for the CHILDREN of NEW SALISHAN, Tacoma, WA last revised July 10, 2014 1. SUMMARY The Tacoma Housing Authority (THA) plans to offer individual development
SANTIAGO CANYON COLLEGE STUDENT PLACEMENTOFFICE PROGRAM REVIEW SPRING SEMESTER, 2010
 SANTIAGO CANYON COLLEGE STUDENT PLACEMENTOFFICE PROGRAM REVIEW SPRING SEMESTER, 2010 Section I. Signature Page Signature of Program Leader Syed Rizvi Date: Printed Name/Title Signature of Vice President,
TENNESSEE S ECONOMY: Implications for Economic Development
 TENNESSEE S ECONOMY: Implications for Economic Development William F. Fox, Director Center for Business and Economic Research The University of Tennessee, Knoxville August 2005 U.S. ECONOMY W.F. Fox, CBER,
Post-16 transport to education and training. Statutory guidance for local authorities
 Post-16 transport to education and training Statutory guidance for local authorities February 2014 Contents Summary 3 Key points 4 The policy landscape 4 Extent and coverage of the 16-18 transport duty
Governors and State Legislatures Plan to Reauthorize the Elementary and Secondary Education Act
 Governors and State Legislatures Plan to Reauthorize the Elementary and Secondary Education Act Summary In today s competitive global economy, our education system must prepare every student to be successful
Massachusetts Juvenile Justice Education Case Study Results
 Massachusetts Juvenile Justice Education Case Study Results Principal Investigator: Thomas G. Blomberg Dean and Sheldon L. Messinger Professor of Criminology and Criminal Justice Prepared by: George Pesta