READY OR NOT? CALIFORNIA'S EARLY ASSESSMENT PROGRAM AND THE TRANSITION TO COLLEGE
|
|
|
- Spencer Gibson
- 6 years ago
- Views:
Transcription
1 READY OR NOT? CALIFORNIA'S EARLY ASSESSMENT PROGRAM AND THE TRANSITION TO COLLEGE Michal Kurlaender University of California, Davis Policy Analysis for California Education March 16, 2012 This research has been supported by grants from the Institute of Education Sciences, U.S. Department of Education and the Bill and Melinda Gates Foundation
2 Collaborators: Jake Jackson (University of California Davis), Jessica Howell (College Board), and Eric Grodsky (University of Minnesota) California State University: Beverly Young, Marsha Hirano-Nakanishi, Carolina Cardenas, Phillip Garcia, Monica Malhotra, Joy Salvetti, Roberta Ching, and Nancy Brynelson California Department of Education: Deb Sigman, Rachel Perry, and Julie Williams
3 College Readiness High college remediation rates Calls for alignment between high schools and colleges Require all high school graduates to complete a college- and career-ready curriculum College Completion Agenda Common Core standards to promote college and career readiness
4 Percent of students requiring remediation at CSU system and six-year graduation rates by cohort 65% 60% Need Remediation Percent 55% 50% 45% 6 year grad rate 40% 35% 30% First Time Freshman Cohort Data from CSU Analytic Studies:
5 Percent of students Requiring remediation at CSU in 2010 Total 57.0% White 36.6% American Indian Filipino Asian American 53.7% 57.6% 58.5% Other Latino Pacific Islander Mexican American African American 69.6% 70.8% 72.9% 79.9% 0% 20% 40% 60% 80% 100% Data from CSU Analytic Studies:
6 Goals of EAP: Provide an early signal to students about their college readiness California State University collaboration with K-12 Provide 12 th grade interventions Components of EAP: th grade testing (early assessment) 2. Professional development for teachers 3. Supplemental preparation for students
7 Aligning school and CSU standards so that success in high school means readiness for the CSU Giving high school students an early signal about their college readiness and adequate time to prepare before entering CSU Making the senior year a time for more direct and specific preparation for college Exempting CSU-ready students from taking CSU placement tests, thereby reducing testing time for students Giving more meaning and force to the California Standards Tests (CSTs)
8 How does participation in the Early Assessment Program affect the probability of requiring remedial coursework in college? Do effects vary with individual and school characteristics? How have different levels of EAP participation influenced school-wide measures of college readiness?
9 4,500 CSU by Campus First-Time Freshmen Enrollment, Fall ,000 3,500 3,000 2,500 2,000 1,500 1,
10 100% English Remediation Need, Fall % 80% 70% 60% 50% 40% 30% 20% 10% 0%
11 100% Math Remediation Need, Fall % 80% 70% 60% 50% 40% 30% 20% 10% 0%
12 CSU Chancellor s Office Four cohorts of first-time freshman applicants ( ) California Department of Education EAP participation by all HS juniors in the state since program inception Matched CSU applicants (enrollees) to CST scores and EAP participation and outcomes
13 Overview of EAP Testing Component Assessment: Optional 15 questions on the mandatory 11 th grade CST Additional items developed by CSU faculty Score based on CST augmented with EAP items Signal: 1. Exempt 2. Non-Exempt 3. Conditional Exempt (in math only)
14 80 Percent of Eligible Juniors Participating in the EAP Test Percent English Math
15 Analytic Strategy for Research Questions 1 & 2 Model remediation need for first-time freshmen in Math and English, respectively, as a function of: Individual characteristics of students Attributes of individual s high school EAP availability Participation in EAP Interrupted Time Series Intuition: Compare similar students in cohorts that had EAP available to those that did not
16 Characteristics of CSU Enrollees Pre-EAP Post-EAP Proportion Male 39.0% 39.4% 39.7% 40.0% White 38.9% 38.1% 36.5% 35.9% Black 6.5% 6.5% 7.1% 7.3% Hispanic 24.2% 26.8% 28.0% 29.1% Asian 13.0% 13.5% 13.5% 13.0% Other race/ethnicity 17.4% 15.1% 14.9% 14.7% Mom - College Grad 28.8% 29.5% 29.3% 29.3% Dad - College Grad 31.7% 32.4% 31.8% 31.1% Math Remediation 42.4% 38.7% 37.2% 39.9% English Remediation 49.5% 47.8% 47.9% 47.5% N 27,436 28,985 32,264 35,667
17 Characteristics of CSU Enrollees Pre-EAP Post-EAP Average ELM Test (math) Proportion non-zero 55% 51% 50% 58% EPT Test (English) Proportion non-zero 70% 69% 65% 66% SAT Proportion non-zero 92% 91% 92% 91% ACT Proportion non-zero 24% 24% 23% 24% High School GPA N 27,436 28,985 32,264 35,667
18
19 Differences Across CSU Campuses SAT Verbal Score Proportion participating in EAP SAT Verbal EAP Partic
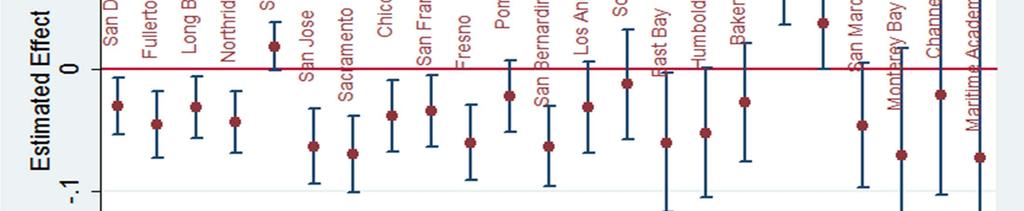
20 Differential Treatment Effects
21 Differential Treatment Effects
22 EAP participation in English leads to a reduction in the probability that CSU freshmen require remediation Important differences in treatment effects by campus by individual characteristics
23 Differences in EAP participation across schools School attributes that influence EAP participation rates Student demographics Aggregate academic performance Difference-in-Difference Intuition: Compare school outcomes over time, for schools with varying levels of EAP participation
24 400 School English EAP Participation by Year Number of Schools Percent of Students Taking EAP in School
25 Percent of students taking EAP English Exam Number of Schools Percent of Students in School Participating in English EAP Graphs by (firstnm) year
26 School characteristics related to EAP participation Correlation coefficients for school characteristics with EAP participation Academic Performance Index 0.197*** 0.245*** Free/Reduced Lunch (%) ** ** Under-represented Minority Students (%) Enrollment 0.077* Emergency Credential (%) * Pupil-Teacher Ratio 0.073* 0.106** Parent with less than diploma (%) * * p<0.05, **p<0.01, ***p<0.001
27 College readiness indicators have increased over time Average percent of students in school displaying readiness Percent of students in school indicators over time EAP Year EPT Take-up (%) 698 API CST Eng Profic/Adv (%) Apply to CSU (%) CST Eng Adv (%)
28 California s high schools also changed over the same time period Average student and teacher characteristics in California high schools over time EAP Year Under-rep. Minority Free/Reduced Lunch Parents <HS Grad Emerg. Credential
29 Percent of students taking EAP English Exam per school (2005 Cohort) # of Schools % Participation in English EAP
30 What if level of EAP participation had no impact on CST Proficiency? Hypothetical Pre-EAP to Post-EAP differences in CST Proficiency by Quartile = Pre-EAP Post-EAP Time Quartile 1 Quartile 4
31 What if level of EAP participation did have an impact on CST Proficiency? Hypothetical Pre-EAP to Post-EAP differences in CST Proficiency by Quartile Pre-EAP Post-EAP Time Quartile 1 Quartile = 4
32 Higher EAP participation is associated with higher levels of CST Proficiency Fitted Values for CST Proficiency from Difference in Difference % Proficient of Advanced * 0 Q1 Q2 Q3 Q4 Pre-EAP Post-EAP
33 Higher EAP participation is associated with higher levels of CST Advanced % Advanced Fitted Values for CST Advanced from Difference in Difference 1.3 * * Q1 Q2 Q3 Q4 Pre-EAP Post-EAP
34 Higher EAP participation is associated with higher API 800 Fitted Values for API from Difference in Difference * 600 API Q1 Q2 Q3 Q4 Pre-EAP Post-EAP
35 Higher EAP participation is somewhat related to applications to CSU 35 Fitted Values for Apply to CSU from Difference in Difference % Applying to CSU Q1 Q2 Q3 Q4 Pre-EAP Post-EAP
36 Preliminary Conclusions Part II School Effects Schools in all levels of participation see gains in test scores, accountability measures, and college-level outcomes Higher levels of participation in EAP are associated with higher gains across tests scores and school accountability measures
37 EAP participation in English leads to a reduction in the probability that CSU freshmen require remediation, with key differences in treatment effects by individual characteristics and across campuses At the school level, higher levels of participation in EAP are associated with higher gains across tests scores and school accountability measures Future Directions Math Closer investigation of differential treatment effects Examine mechanisms Sorting in applications 12 th grade course taking
38 Michal Kurlaender Associate Professor School of Education University of California, Davis
39
40 Figure A3: Timeline for EAP Participation and College Entrance EAP Implementation High School junior in: 2001/ / / /2005 High School graduate in: 2002/ / / /2006 College entrant in: 2003/ / / /2007 Pre-EAP Post-EAP
41 11th grader takes mandatory California Standards Test (CST) in the spring Figure 3: Paths to College Readiness or Remediation in English at California State University Ready for college coursework at CSU without additional testing Takes supplemental EAP English questions No Matriculate at CSU? No Yes No further action *Exempt via SAT, ACT, or AP? No Yes Take CSU English remediation placement exam Yes Score 25 Score < 25 Receives EAP report in August indicating exemption status on CSU English remediation placement exam Nonexempt Matriculate at CSU? No Yes No further action *Exempt via SAT, ACT, or AP? No Yes Exempt Ready for college coursework at CSU without additional testing Placed into remediation * Exemption requires a score of 550 or above on SAT I verbal or a score of 680 on the SAT II writing test, a score of 24 or above on ACT English, or a score of 3, 4, or 5 on either the AP Language and Composition exam or the AP Literature and Composition exam.
42 60% California State University Systemwide Remediation Need 50% 40% 30% 20% 10% 0% Eng Math
43 College participation rates are at an all time high Despite increases in postsecondary participation, degree completion has remained stagnant (and slightly declining for African American and Latino students) Why? Compositional changes in college participation Financial constraints Academic preparation College for All ethos Institutional practices
44 Academic Preparation Literature Better academic preparation higher rates of persistence and degree completion Student information and expectations Person, Rosenbaum & Deil-Amen (2006) K-12 alignment with higher education Venezia et al. (2005); Martinez & Klopott (2005) Effect of college remediation Ohio (Bettinger & Long, 2004): Positive effects on transfer to more selective institution and on degree completion. Florida (Calcagno & Long, 2008): Slight positive effects on persistence and no effect on transfer to 4-year institution or on degree completion. Texas (Martorell & McFarlin, 2008): No effects (and even modest negative effects) on transfer, persistence, degree completion, and earnings.
45 Controversy over Collegiate Remediation Where should remediation occur? Bridge between K-12 schooling and college readiness Role of secondary schools or community colleges, but not BA-granting institutions. Costs associated with remediation Paying Double Estimated cost of remediation at 4-year colleges is over $500 million (Strong American Schools, 2008)
46 Selection at the Individual Level Propensity Score Matching Selection at the School Level School Fixed Effects Schools with Universal EAP take-up
47 American Diploma Project Align high school standards and assessments with the skills required for success after high school. Require all high school graduates to complete a collegeand career-ready curriculum. Build assessments that measure students readiness for college and careers. Develop an accountability system that promotes college and career readiness.
California State University EAP Updates 2016
 California State University EAP Updates 2016 CSU San Bernardino EAP Director Faye Wong CSU Office of the Chancellor Student Academic Services Carolina C Cardenas Academic Outreach and Early Assessment
Shelters Elementary School
 Shelters Elementary School August 2, 24 Dear Parents and Community Members: We are pleased to present you with the (AER) which provides key information on the 23-24 educational progress for the Shelters
EAP. updates KHENG WAICHE. early proficiency programs coordinator
 EAP updates 2016 KHENG WAICHE early proficiency programs coordinator 2015 CAASPP EAP Testing ü 3.2 million students tested in grades 3-11. ü California tested the largest number of students in the Smarter
An Analysis of the Early Assessment Program (EAP) Assessment for English
 Assessment for English") An Analysis of the Early Assessment Program (EAP) Assessment for English Conducted by Achieve on behalf of the California Diploma Project (ADP) and Policy Analysis for California Education (PACE) October
An Analysis of the Early Assessment Program (EAP) Assessment for English Conducted by Achieve on behalf of the California Diploma Project (ADP) and Policy Analysis for California Education (PACE) October
Access Center Assessment Report
 Access Center Assessment Report The purpose of this report is to provide a description of the demographics as well as higher education access and success of Access Center students at CSU. College access
CSU East Bay EAP Breakfast. CSU Office of the Chancellor Student Academic Services Lourdes Kulju Academic Outreach and Early Assessment
 CSU East Bay EAP Breakfast CSU Office of the Chancellor Student Academic Services Lourdes Kulju Academic Outreach and Early Assessment 2015 CAASPP EAP Testing 3.2 million students tested in grades 3-11.
File Print Created 11/17/2017 6:16 PM 1 of 10
 Success - Key Measures Graduation Rate: 4-, 5-, and 6-Year 9. First-time, full-time entering, degree-seeking, students enrolled in a minimum of 12 SCH their first fall semester who have graduated from
Educational Attainment
 A Demographic and Socio-Economic Profile of Allen County, Indiana based on the 2010 Census and the American Community Survey Educational Attainment A Review of Census Data Related to the Educational Attainment
Best Colleges Main Survey
 Best Colleges Main Survey Date submitted 5/12/216 18::56 Introduction page 1 / 146 BEST COLLEGES Data Collection U.S. News has begun collecting data for the 217 edition of Best Colleges. The U.S. News
46 Children s Defense Fund
 Nationally, about 1 in 15 teens ages 16 to 19 is a dropout. Fewer than two-thirds of 9 th graders in Florida, Georgia, Louisiana and Nevada graduate from high school within four years with a regular diploma.
Frank Phillips College. Accountability Report
 Frank Phillips College Accountability Report January 2016 Accountability System, January 2016 1 of 22 Participation - Key Measures Enrollment 1. Fall Headcount (Unduplicated) Fall 2000 Fall 2014 Fall 2015
The Demographic Wave: Rethinking Hispanic AP Trends
 The Demographic Wave: Rethinking Hispanic AP Trends Kelcey Edwards & Ellen Sawtell AP Annual Conference, Las Vegas, NV July 19, 2013 Exploring the Data Hispanic/Latino US public school graduates The Demographic
2012 New England Regional Forum Boston, Massachusetts Wednesday, February 1, More Than a Test: The SAT and SAT Subject Tests
 2012 New England Regional Forum Boston, Massachusetts Wednesday, February 1, 2012 More Than a Test: The SAT and SAT Subject Tests 1 Presenters Chris Lucier Vice President for Enrollment Management, University
Enrollment Trends. Past, Present, and. Future. Presentation Topics. NCCC enrollment down from peak levels
 Presentation Topics 1. Enrollment Trends 2. Attainment Trends Past, Present, and Future Challenges & Opportunities for NC Community Colleges August 17, 217 Rebecca Tippett Director, Carolina Demography
Status of Women of Color in Science, Engineering, and Medicine
 Status of Women of Color in Science, Engineering, and Medicine The figures and tables below are based upon the latest publicly available data from AAMC, NSF, Department of Education and the US Census Bureau.
Iowa School District Profiles. Le Mars
 Iowa School District Profiles Overview This profile describes enrollment trends, student performance, income levels, population, and other characteristics of the public school district. The report utilizes
Los Angeles City College Student Equity Plan. Signature Page
 Los Angeles City College Student Equity Plan Signature Page Los Angeles Community College Los Angeles City College President, Board of Trustees Date District Chancellor: College President: Academic Senate
Evaluation of a College Freshman Diversity Research Program
 Evaluation of a College Freshman Diversity Research Program Sarah Garner University of Washington, Seattle, Washington 98195 Michael J. Tremmel University of Washington, Seattle, Washington 98195 Sarah
Peer Influence on Academic Achievement: Mean, Variance, and Network Effects under School Choice
 Megan Andrew Cheng Wang Peer Influence on Academic Achievement: Mean, Variance, and Network Effects under School Choice Background Many states and municipalities now allow parents to choose their children
STEM Academy Workshops Evaluation
 OFFICE OF INSTITUTIONAL RESEARCH RESEARCH BRIEF #882 August 2015 STEM Academy Workshops Evaluation By Daniel Berumen, MPA Introduction The current report summarizes the results of the research activities
State Budget Update February 2016
 State Budget Update February 2016 2016-17 BUDGET TRAILER BILL SUMMARY The Budget Trailer Bill Language is the implementing statute needed to effectuate the proposals in the annual Budget Bill. The Governor
Cooper Upper Elementary School
 LIVONIA PUBLIC SCHOOLS http://cooper.livoniapublicschools.org 215-216 Annual Education Report BOARD OF EDUCATION 215-16 Colleen Burton, President Dianne Laura, Vice President Tammy Bonifield, Secretary
Basic Skills Initiative Project Proposal Date Submitted: March 14, Budget Control Number: (if project is continuing)
") Basic Skills Initiative Project Proposal 2016-2017 Date Submitted: March 14, 2016 Check One: New Proposal: Continuing Project: X Budget Control Number: (if project is continuing) Control # 87-413 - EOPS
Basic Skills Initiative Project Proposal 2016-2017 Date Submitted: March 14, 2016 Check One: New Proposal: Continuing Project: X Budget Control Number: (if project is continuing) Control # 87-413 - EOPS
African American Male Achievement Update
 Report from the Department of Research, Evaluation, and Assessment Number 8 January 16, 2009 African American Male Achievement Update AUTHOR: Hope E. White, Ph.D., Program Evaluation Specialist Department
Data Diskette & CD ROM
 Data File Format Data Diskette & CD ROM Texas Assessment of Academic Skills Fall 2002 through Summer 2003 Exit Level Test Administrations Attention Macintosh Users To accommodate Macintosh systems a delimiter
DO SOMETHING! Become a Youth Leader, Join ASAP. HAVE A VOICE MAKE A DIFFERENCE BE PART OF A GROUP WORKING TO CREATE CHANGE IN EDUCATION
 DO SOMETHING! Become a Youth Leader, Join ASAP. HAVE A VOICE MAKE A DIFFERENCE BE PART OF A GROUP WORKING TO CREATE CHANGE IN EDUCATION The Coalition for Asian American Children and Families (CACF) is
Data Glossary. Summa Cum Laude: the top 2% of each college's distribution of cumulative GPAs for the graduating cohort. Academic Honors (Latin Honors)
") Institutional Research and Assessment Data Glossary This document is a collection of terms and variable definitions commonly used in the universities reports. The definitions were compiled from various
Institutional Research and Assessment Data Glossary This document is a collection of terms and variable definitions commonly used in the universities reports. The definitions were compiled from various
Transportation Equity Analysis
 2015-16 Transportation Equity Analysis Each year the Seattle Public Schools updates the Transportation Service Standards and bus walk zone boundaries for use in the upcoming school year. For the 2014-15
Strategic Plan Dashboard Results. Office of Institutional Research and Assessment
 29-21 Strategic Plan Dashboard Results Office of Institutional Research and Assessment Binghamton University Office of Institutional Research and Assessment Definitions Fall Undergraduate and Graduate
Cupertino High School Accountabiltiy Report Card. Kami Tomberlain, Principal FREMONT UNION HIGH SCHOOL DISTRICT
 Cupertino High Kami Tomberlain, Principal Address: 10100 Finch Avenue, Cupertino, CA 95014 408-366-7300 FREMONT UNION HIGH SCHOOL DISTRICT 2010-2011 Accountabiltiy Report Card Profile Cupertino is a four-year
Psychometric Research Brief Office of Shared Accountability
 August 2012 Psychometric Research Brief Office of Shared Accountability Linking Measures of Academic Progress in Mathematics and Maryland School Assessment in Mathematics Huafang Zhao, Ph.D. This brief
The Condition of College & Career Readiness 2016
 The Condition of College and Career Readiness This report looks at the progress of the 16 ACT -tested graduating class relative to college and career readiness. This year s report shows that 64% of students
College and Career Ready Performance Index, High School, Grades 9-12
 Dr. John D. Barge, State School Superintendent Making Education Work for All of Georgia s Students College and Career Ready Performance Index, High School, Grades 9-12 CONTENT MASTERY (END of COURSE TESTS
https://secure.aacte.org/apps/peds/print_all_forms.php?view=report&prin...
 1 of 35 4/25/2012 9:56 AM A» 2011 PEDS» Institutional Data inst id: 3510 Institutional Data A_1 Institutional Information This information will be used in all official references to your institution. Institution
Practices Worthy of Attention Step Up to High School Chicago Public Schools Chicago, Illinois
 Step Up to High School Chicago Public Schools Chicago, Illinois Summary of the Practice. Step Up to High School is a four-week transitional summer program for incoming ninth-graders in Chicago Public Schools.
An Empirical Analysis of the Effects of Mexican American Studies Participation on Student Achievement within Tucson Unified School District
 An Empirical Analysis of the Effects of Mexican American Studies Participation on Student Achievement within Tucson Unified School District Report Submitted June 20, 2012, to Willis D. Hawley, Ph.D., Special
University of Utah. 1. Graduation-Rates Data a. All Students. b. Student-Athletes
 University of Utah FRESHMAN-COHORT GRADUATION RATES All Students Student-Athletes # 2009-10 Graduation Rate 64% 64% Four-Class Average 61% 64% Student-Athlete Graduation Success Rate 87% 1. Graduation-Rates
2015 High School Results: Summary Data (Part I)
") 1 2015 High School Results: Summary Data (Part I) October 27, 2015 Dr. Gregory E. Thornton CEO, Baltimore City Public Schools Theresa D. Jones Chief Achievement and Accountability Officer HS Data Summary
1 2015 High School Results: Summary Data (Part I) October 27, 2015 Dr. Gregory E. Thornton CEO, Baltimore City Public Schools Theresa D. Jones Chief Achievement and Accountability Officer HS Data Summary
Undergraduate Admissions Standards for the Massachusetts State University System and the University of Massachusetts. Reference Guide April 2016
 Undergraduate Admissions Standards for the Massachusetts State University System and the University of Massachusetts Reference Guide April 2016 Massachusetts Department of Higher Education One Ashburton
ABILITY SORTING AND THE IMPORTANCE OF COLLEGE QUALITY TO STUDENT ACHIEVEMENT: EVIDENCE FROM COMMUNITY COLLEGES
 ABILITY SORTING AND THE IMPORTANCE OF COLLEGE QUALITY TO STUDENT ACHIEVEMENT: EVIDENCE FROM COMMUNITY COLLEGES Kevin Stange Ford School of Public Policy University of Michigan Ann Arbor, MI 48109-3091
5 Programmatic. The second component area of the equity audit is programmatic. Equity
 5 Programmatic Equity It is one thing to take as a given that approximately 70 percent of an entering high school freshman class will not attend college, but to assign a particular child to a curriculum
The following resolution is presented for approval to the Board of Trustees. RESOLUTION 16-
 1. Adoption of Wright State 2016 Campus Completion Plan The following resolution is presented for approval to the Board of Trustees. RESOLUTION 16- WHEREAS, Section 3345.81 of the Ohio Revised Code requires
10/6/2017 UNDERGRADUATE SUCCESS SCHOLARS PROGRAM. Founded in 1969 as a graduate institution.
 UNDERGRADUATE SUCCESS SCHOLARS PROGRAM THE UNIVERSITY OF TEXAS AT DALLAS Founded in 1969 as a graduate institution. Began admitting upperclassmen in 1975 and began admitting underclassmen in 1990. 1 A
Wisconsin 4 th Grade Reading Results on the 2015 National Assessment of Educational Progress (NAEP)
") Wisconsin 4 th Grade Reading Results on the 2015 National Assessment of Educational Progress (NAEP) Main takeaways from the 2015 NAEP 4 th grade reading exam: Wisconsin scores have been statistically flat
Wisconsin 4 th Grade Reading Results on the 2015 National Assessment of Educational Progress (NAEP) Main takeaways from the 2015 NAEP 4 th grade reading exam: Wisconsin scores have been statistically flat
School of Education Tel: (530) One Shields Avenue, Davis, CA Fax: (530)
 One Shields Avenue, Davis, CA Fax: (530)") MICHAL KURLAENDER (June 2016) University of California, Davis mkurlaender@ucdavis.edu School of Education Tel: (530) 752-3748 One Shields Avenue, Davis, CA 95616 Fax: (530) 752-5411 EDUCATION Harvard University,
MICHAL KURLAENDER (June 2016) University of California, Davis mkurlaender@ucdavis.edu School of Education Tel: (530) 752-3748 One Shields Avenue, Davis, CA 95616 Fax: (530) 752-5411 EDUCATION Harvard University,
Institution of Higher Education Demographic Survey
 Institution of Higher Education Demographic Survey Data from all participating institutions are aggregated for the comparative studies by various types of institutional characteristics. For that purpose,
Student Mobility Rates in Massachusetts Public Schools
 Student Mobility Rates in Massachusetts Public Schools Introduction The Massachusetts Department of Elementary and Secondary Education (ESE) calculates and reports mobility rates as part of its overall
Moving the Needle: Creating Better Career Opportunities and Workforce Readiness. Austin ISD Progress Report
 Moving the Needle: Creating Better Career Opportunities and Workforce Readiness Austin ISD Progress Report 2013 A Letter to the Community Central Texas Job Openings More than 150 people move to the Austin
Cooper Upper Elementary School
 LIVONIA PUBLIC SCHOOLS www.livoniapublicschools.org/cooper 213-214 BOARD OF EDUCATION 213-14 Mark Johnson, President Colleen Burton, Vice President Dianne Laura, Secretary Tammy Bonifield, Trustee Dan
The Achievement Gap in California: Context, Status, and Approaches for Improvement
 The Achievement Gap in California: Context, Status, and Approaches for Improvement Eva L. Baker, EdD - University of California, Los Angeles, Center for Research on Evaluation, Standards, and Student Testing
Idaho Public Schools
 Advanced Placement: Student Participation 13.5% increase in the number of students participating between 25 and 26 In 26: 3,79 Idaho Public School Students took AP Exams In 25: 3,338 Idaho Public School
Annual Report to the Public. Dr. Greg Murry, Superintendent
 Annual Report to the Public Dr. Greg Murry, Superintendent 1 Conway Board of Education Ms. Susan McNabb Mr. Bill Clements Mr. Chuck Shipp Mr. Carl Barger Dr. Adam Lamey Dr. Quentin Washispack Mr. Andre
Kansas Adequate Yearly Progress (AYP) Revised Guidance
 Revised Guidance") Kansas State Department of Education Kansas Adequate Yearly Progress (AYP) Revised Guidance Based on Elementary & Secondary Education Act, No Child Left Behind (P.L. 107-110) Revised May 2010 Revised May
Kansas State Department of Education Kansas Adequate Yearly Progress (AYP) Revised Guidance Based on Elementary & Secondary Education Act, No Child Left Behind (P.L. 107-110) Revised May 2010 Revised May
John F. Kennedy Middle School
 John F. Kennedy Middle School CUPERTINO UNION SCHOOL DISTRICT Steven Hamm, Principal hamm_steven@cusdk8.org School Address: 821 Bubb Rd. Cupertino, CA 95014-4938 (408) 253-1525 CDS Code: 43-69419-6046890
ACHE DATA ELEMENT DICTIONARY as of October 6, 1998
 ACHE DATA ELEMENT DICTIONARY as of October 6, 1998 Element Title: Reference Numbers: Institution FICE Code FICE ST010, GR010 The identification number for each reporting institution will be the institution's
Bachelor of Science. Undergraduate Program. Department of Physics
 Department of Physics Undergraduate Program Bachelor of Science Students with a strong interest in understanding the fundamental whys and hows of natural physical phenomena are encouraged to consider majoring
Coming in. Coming in. Coming in
 212-213 Report Card for Glenville High School SCHOOL DISTRICT District results under review by the Ohio Department of Education based upon 211 findings by the Auditor of State. Achievement This grade combines
Academic Advising and Career Exploration. PLTW State Conference 2015 Bayless School District
 Academic Advising and Career Exploration PLTW State Conference 2015 Bayless School District Bayless PLTW Academic Advising and Career Exploration Professional School Counselors are critical to the success
Summary of Selected Data Charter Schools Authorized by Alameda County Board of Education
 Summary of Selected Data Charter Schools Authorized by Alameda County Board of Education Prepared for the Alameda County Board of Education November 10, 2015 Alameda County Office of Education Charter
ADMISSION TO THE UNIVERSITY
 ADMISSION TO THE UNIVERSITY William Carter, Director of Admission College Hall 140. MSC 128. Extension 2315. Texas A&M University-Kingsville adheres to high standards of academic excellence and admits
National Survey of Student Engagement Spring University of Kansas. Executive Summary
 National Survey of Student Engagement Spring 2010 University of Kansas Executive Summary Overview One thousand six hundred and twenty-one (1,621) students from the University of Kansas completed the web-based
Port Graham El/High. Report Card for
 School: District: Kenai Peninsula Grades: K - 12 School Enrollment: 20 Title I School? No Title 1 Program: Accreditation: Report Card for 2008-2009 A Title 1 school receives federal money in support low-achieving
Accuplacer Implementation Report Submitted by: Randy Brown, Ph.D. Director Office of Institutional Research Gavilan College May 2012
 Accuplacer Implementation Report Submitted by: Randy Brown, Ph..D. Director Office of Institutional Research Gavilan Collegee May 01 Introduction New student matriculation is an important factor in students
EDUCATIONAL ATTAINMENT
 EDUCATIONAL ATTAINMENT By 2030, at least 60 percent of Texans ages 25 to 34 will have a postsecondary credential or degree. Target: Increase the percent of Texans ages 25 to 34 with a postsecondary credential.
CAMPUS PROFILE MEET OUR STUDENTS UNDERGRADUATE ADMISSIONS. The average age of undergraduates is 21; 78% are 22 years or younger.
 CAMPUS PROFILE MEET OUR STUDENTS Freshmen are defined here as all domestic students entering in fall quarter from high school. These statistics include information drawn from records available at UC Davis.
Sunnyvale Middle School School Accountability Report Card Reported Using Data from the School Year Published During
 Sunnyvale Middle School School Accountability Report Card Reported Using Data from the 2014-15 School Year Published During 2015-16 By February 1 of each year, every school in California is required by
Rachel Edmondson Adult Learner Analyst Jaci Leonard, UIC Analyst
 Rachel Edmondson Adult Learner Analyst Jaci Leonard, UIC Analyst UIC Process Changes for 2016 STARR Reporting Year, submission window Data Element, Business Rule Data Quality MI School Data Postsecondary
BENCHMARK TREND COMPARISON REPORT:
 National Survey of Student Engagement (NSSE) BENCHMARK TREND COMPARISON REPORT: CARNEGIE PEER INSTITUTIONS, 2003-2011 PREPARED BY: ANGEL A. SANCHEZ, DIRECTOR KELLI PAYNE, ADMINISTRATIVE ANALYST/ SPECIALIST
A Diverse Student Body
 A Diverse Student Body No two diversity plans are alike, even when expressing the importance of having students from diverse backgrounds. A top-tier school that attracts outstanding students uses this
Multiple Measures Assessment Project - FAQs
 Multiple Measures Assessment Project - FAQs (This is a working document which will be expanded as additional questions arise.) Common Assessment Initiative How is MMAP research related to the Common Assessment
Raw Data Files Instructions
 Raw Data Files Instructions Colleges will report the above information for students in the Main Cohort for each of the reporting timeframes and the system will calculate the sub cohorts and metrics based
JOHN F. KENNEDY HIGH SCHOOL THREE-YEAR-TERM REVISIT VISITING COMMITTEE REPORT
 JOHN F. KENNEDY HIGH SCHOOL 6715 Gloria Dr. Sacramento, CA 95831 Sacramento City Unified School District THREE-YEAR-TERM REVISIT VISITING COMMITTEE REPORT November 15-17, 2015 ACCREDITING COMMISSION FOR
UW-Waukesha Pre-College Program. College Bound Take Charge of Your Future!
 UW-Waukesha Pre-College Program College Bound 2017 Take Charge of Your Future! This is a great program to increase your knowledge on various subjects. Students will be engaged in workshops and hands-on
2012 ACT RESULTS BACKGROUND
 Report from the Office of Student Assessment 31 November 29, 2012 2012 ACT RESULTS AUTHOR: Douglas G. Wren, Ed.D., Assessment Specialist Department of Educational Leadership and Assessment OTHER CONTACT
El Toro Elementary School
 El Toro Elementary School 2013-14 Published During 2014-15 El Toro Elementary Contact Information (School Year 2014-15) 455 East Main Ave. Morgan Hill, CA 95037-3745 (408) 201-6380 Principal: Contact E-mail
A Guide to Adequate Yearly Progress Analyses in Nevada 2007 Nevada Department of Education
 A Guide to Adequate Yearly Progress Analyses in Nevada 2007 Nevada Department of Education Note: Additional information regarding AYP Results from 2003 through 2007 including a listing of each individual
The Relationship Between Poverty and Achievement in Maine Public Schools and a Path Forward
 The Relationship Between Poverty and Achievement in Maine Public Schools and a Path Forward Peer Learning Session MELMAC Education Foundation Dr. David L. Silvernail Director Applied Research, and Evaluation
Section V Reclassification of English Learners to Fluent English Proficient
 Section V Reclassification of English Learners to Fluent English Proficient Understanding Reclassification of English Learners to Fluent English Proficient Decision Guide: Reclassifying a Student from
Graduation Initiative 2025 Goals San Jose State
 Graduation Initiative 2025 Goals San Jose State Metric 2025 Goal Most Recent Rate Freshman 6-Year Graduation 71% 57% Freshman 4-Year Graduation 35% 10% Transfer 2-Year Graduation 36% 24% Transfer 4-Year
The Effect of Income on Educational Attainment: Evidence from State Earned Income Tax Credit Expansions
 The Effect of Income on Educational Attainment: Evidence from State Earned Income Tax Credit Expansions Katherine Michelmore Policy Analysis and Management Cornell University km459@cornell.edu September
NBER WORKING PAPER SERIES WOULD THE ELIMINATION OF AFFIRMATIVE ACTION AFFECT HIGHLY QUALIFIED MINORITY APPLICANTS? EVIDENCE FROM CALIFORNIA AND TEXAS
 NBER WORKING PAPER SERIES WOULD THE ELIMINATION OF AFFIRMATIVE ACTION AFFECT HIGHLY QUALIFIED MINORITY APPLICANTS? EVIDENCE FROM CALIFORNIA AND TEXAS David Card Alan B. Krueger Working Paper 10366 http://www.nber.org/papers/w10366
U VA THE CHANGING FACE OF UVA STUDENTS: SSESSMENT. About The Study
 About The Study U VA SSESSMENT In 6, the University of Virginia Office of Institutional Assessment and Studies undertook a study to describe how first-year students have changed over the past four decades.
VOL VISION 2020 STRATEGIC PLAN IMPLEMENTATION
 VOL VISION 2020 STRATEGIC PLAN IMPLEMENTATION CONTENTS Vol Vision 2020 Summary Overview Approach Plan Phase 1 Key Initiatives, Timelines, Accountability Strategy Dashboard Phase 1 Metrics and Indicators
MAINE 2011 For a strong economy, the skills gap must be closed.
 For a strong economy, the skills gap must be closed. 62% 36% 26% By 2020, jobs requiring a career certificate or college degree Skills gap Too few students make it through college. MEMBER Maine adults
National Survey of Student Engagement The College Student Report
 The College Student Report This is a facsimile of the NSSE survey (available at nsse.iub.edu/links/surveys). The survey itself is administered online. 1. During the current school year, about how often
Testing Schedule. Explained
 2014 2015 Testing Schedule Explained Jennifer Dugan Leading for educational excellence and equity. Every day for every one. Agenda Requirements and implementation of legislation Testing schedule for 2014
Demographic Survey for Focus and Discussion Groups
 Appendix F Demographic Survey for Focus and Discussion Groups Demographic Survey--Lesbian, Gay, and Bisexual Discussion Group Demographic Survey Faculty with Disabilities Discussion Group Demographic Survey
World s Best Workforce Plan
 2017-18 World s Best Workforce Plan District or Charter Name: PiM Arts High School, 4110-07 Contact Person Name and Position Matt McFarlane, Executive Director In accordance with Minnesota Statutes, section
New Jersey Institute of Technology Newark College of Engineering
 New Jersey Institute of Technology Newark College of Engineering AND IN ELECTRICAL AND COMPUTER ENGINEERING Program Review Last Update: Nov. 23, 2005 MISSION STATEMENTS DOCTOR OF PHILOSOPHY IN ELECTRICAL
Executive Summary. DoDEA Virtual High School
 New York/Virginia/Puerto Rico District Dr. Terri L. Marshall, Principal 3308 John Quick Rd Quantico, VA 22134-1752 Document Generated On February 25, 2015 TABLE OF CONTENTS Introduction 1 Description of
DUAL ENROLLMENT ADMISSIONS APPLICATION. You can get anywhere from here.
 DUAL ENROLLMENT ADMISSIONS APPLICATION SM You can get anywhere from here. Please print or type: DUAL ENROLLMENT APPLICATION Last Name First Name Maiden/Middle Social Security # Local Address (include apt.
Welcome Parents! Class of 2021
 Welcome Parents! Class of 2021 How to prepare for CHS! Finish strong!! 4 th quarter determines fall eligibility. Good habits now mean a successful start next year. Tour of CHS Volunteers from the class
Bethune-Cookman University
 Bethune-Cookman University The Independent Colleges and Universities of Florida Community College Articulation Manual 2012-2013 1 BETHUNE-COOKMAN UNIVERSITY ICUF ARTICULATION MANUAL GENERAL ADMISSION PROCEDURES
Connecting to the Big Picture: An Orientation to GEAR UP
 Connecting to the Big Picture: An Orientation to GEAR UP About the National Council for Community and Education Partnerships (NCCEP) Our mission is to build the capacity of communities to ensure that underserved
Hokulani Elementary School
 Hokulani Elementary Code: 109 Status and Improvement Report Year -11 Contents Focus On Standards Grades K-5 This Status and Improvement Report has been prepared as part of the Department's education accountability
Undergraduates Views of K-12 Teaching as a Career Choice
 Undergraduates Views of K-12 Teaching as a Career Choice A Report Prepared for The Professional Educator Standards Board Prepared by: Ana M. Elfers Margaret L. Plecki Elise St. John Rebecca Wedel University
Serving Country and Community: A Study of Service in AmeriCorps. A Profile of AmeriCorps Members at Baseline. June 2001
 Serving Country and Community: A Study of Service in AmeriCorps Cambridge, MA Lexington, MA Hadley, MA Bethesda, MD Washington, DC Chicago, IL Cairo, Egypt Johannesburg, South Africa A Profile of AmeriCorps
EXECUTIVE SUMMARY. Online courses for credit recovery in high schools: Effectiveness and promising practices. April 2017
 EXECUTIVE SUMMARY Online courses for credit recovery in high schools: Effectiveness and promising practices April 2017 Prepared for the Nellie Mae Education Foundation by the UMass Donahue Institute 1
Miami-Dade County Public Schools
 ENGLISH LANGUAGE LEARNERS AND THEIR ACADEMIC PROGRESS: 2010-2011 Author: Aleksandr Shneyderman, Ed.D. January 2012 Research Services Office of Assessment, Research, and Data Analysis 1450 NE Second Avenue,
Bellehaven Elementary
 Overall istrict: Albuquerque Public Schools Grade Range: KN-05 Code: 1229 School Grade Report Card 2013 Current Standing How did students perform in the most recent school year? are tested on how well