Mapping literacy in India: who are the illiterates and where do we find them?
|
|
|
- Benjamin Conley
- 6 years ago
- Views:
Transcription
1 2006/ED/EFA/MRT/PI/36 Background paper prepared for the Education for All Global Monitoring Report 2006 Literacy for Life Mapping literacy in India: who are the illiterates and where do we find them? R. Govinda, and K.Biswal 2005 This paper was commissioned by the Education for All Global Monitoring Report as background information to assist in drafting the 2006 report. It has not been edited by the team. The views and opinions expressed in this paper are those of the author(s) and should not be attributed to the EFA Global Monitoring Report or to UNESCO. The papers can be cited with the following reference: Paper commissioned for the EFA Global Monitoring Report 2006, Literacy for Life. For further information, please contact 1
2 Contents Section I: Growth in literacy 1-5 Section II: Gender and regional variations in literacy 5-11 Section III: Literacy rates by age, social group and household type Section IV: Who are the illiterates? Section V: Concluding remarks Annexure I List of Tables Table 1: Relative position of major states in terms of gender disparity in literacy rates, 1991 and 2001 Table 2: Literacy rate of population (age 15+), India, Table 3: Percentage distribution of population (age 6 and above) by literacy rate and primary level of education, India, Table 4: estimated number of illiterates by age group and sex, India, 2001 (based on NFHS-2 estimates of illiteracy rate in ) Table 5: Correlations among illiterates, SC and ST population, and agricultural labour in India, 2001 List of Charts Chart 1: Literacy rates by sex in India since 1951 Chart 2: Progress of literacy rates by sex and rural/urban area in India since 1951 Chart 3: Share of illiterates (persons) in India, 2001 Chart 4: Share of female illiterates to total illiterates in India, 2001 Chart 5: GPI of literacy rates in major states, 1991 and 2001 Chart 6: Share of females in total illiterates, 2001 Chart 7: Distribution of top 100 districts (in terms of absolute number of illiterates), 2001 Chart 8: Distribution of 81 districts where more than half of the population are illiterates, 2001 Chart 9: Literacy rate of the population in the age group 15+, Chart 10: Percentage of illiterates by age group and sex, India (NFHA-2), Chart 11: Illiterates per 1000 persons (7+ age group) by sex and social group in rural and urban India, Chart 12: Illiterates per 1000 persons (7+ age group) by sex and social group in rural area by social group in 7 major states in India,
3 Chart 13: Chart 14: Chart 15: Chart 16: Chart 17: Chart 18: Illiterates per 1000 persons (7+ age group) by sex and social group in urban area by social group in 7 major states in India, Illiterates per 1000 persons (7+ age group) by sex and household type in rural India, Illiterates per 1000 persons (7+ age group) by sex and household type in urban India, illiterates per 1000 persons (7+ age group) by household type in rural area in major states in India, Per 1000 distribution of 7+ age group population by educational level and MPCE class in rural India, Per 1000 distribution of 7+ age group population by educational level and MPCE class in urban India, Map 1: Female literacy in India, 2001 Map 2: 67 districts with million plus illiterates, 2001 List of Maps 3
4 Mapping Literacy in India 1 Who are the illiterates and where do we find them? I. Growth in Literacy India covers an area of 3,287,263 sq. km from the Himalayas to the tropical rain forests of the south. The country is divided into 28 states and 7 union territories (UTs) for the purpose of governance. States and the centre function under a federal relationship. Union territories are under the direct control of the Central Government. Education has been on the Concurrent List of the Constitution of India since As per the national census, 2001, total population of India is million, out of which million are females. As the second most populous country, India is home to 16 per cent of world s population. In terms of Human Development Index (HDI), India occupies 127 th position in the family of 177 nations (Human Development Report 2004). The paper makes a modest attempt at mapping out literacy in India, focusing on an analysis of the illiterates by making use of data from the Census of India, the National Family Health Survey-2, and various rounds of the National Sample Survey. The primary objective of the paper is to locate the illiterates at the sub-national and district levels, and to highlight the characteristics of the illiterates, given the limitations of the available information. The National Adult Education Programme (NAEP), the first countrywide programme in 1978, viewed literacy as a means to bring about fundamental changes in socio-economic development. It aimed at covering 100 million illiterate persons in the age group in the adult education centres across the country. Based on the findings of the evaluation of the NAEP, the National Policy on Education (1986) suggested creation of a National Literacy Mission (NLM) to design and manage large-scale literacy programmes. Adopting a well-defined campaign approach, the NLM launched the total literacy campaigns in The objective was to impart functional literacy (i.e. self-reliance in 3 Rs) to non-literates in the age group The total literacy campaigns also created positive environment for implementing national and state level basic education programmes. The initial literacy campaign was followed up with post-literacy and continuing education programmes aimed at preventing relapse into illiteracy, to enroll dropouts and enable non-achievers to upgrade their literacy skills. Besides various adult literacy programmes, the literacy rate of population in 7-14 age group has been directly influenced by the implementation of a number of basic education development programmes in the 1990s, thereby directly contributing to the overall literacy status of population in 7+ age group. In most of the developing countries, including India, literacy has been measured by the literacy rate, which is the percent (or, equivalently, fraction) of the population, usually adult population. In India, the decennial census data remain the most widely acceptable and frequently quoted estimates of literacy. Besides, the National Sample Survey Organization (NSSO) conducts sample surveys once in every five years, usually in between two census years, to collect data on literacy status and other socio-economic characteristics of the population. The estimates of literacy by the NSSO can be viewed as the mid-term assessment of literacy in the country. The NLM designs, implements and 1 R. Govinda ( rgovinda@niepa.org) and K. Biswal ( kkbiswal@niepa.org), National Institute of Educational Planning and Administration (NIEPA), 17-B, Sri Aurobindo Marg, New Delhi , India, April The views expressed in the paper are that of the authors and should not be attributed to NIEPA. 4
5 monitors literacy programmes, and formulates guidelines for literacy assessment. Several other non-governmental bodies/organizations also carry out independent studies on assessment of literacy 2. The National Family Health Surveys of the International Institute for Population Sciences (IIPS), Mumbai provide database on a variety of demographic and socio-economic indicators, including literacy, on the basis of sample study of the households. However, the definition and method of assessment of literacy varies across various sources such as the Census of India, NLM, NSSO and NFHS. The definition of literacy in the population census of India is fairly liberal 3. In the census enumeration, a person, who can read and write with understanding in any language, is treated as literate. The person may or may not have received any formal education. 4 The data on literacy collected through census enumeration is based on self-declaration of the respondent, and thus, it classifies all individuals into only two categories, i.e. literate and illiterate. It does not make any distinction between the proximate 5 and isolated 6 illiterates. 7 The census data thus suffer from obvious limitations, as these are not based on any objective measure to test the literacy status of the respondents. The literacy figures of different census years are not strictly comparable. Since 1991 census, children in the age group 0-6 have been treated as illiterates by definition and the 7+ age group population has been considered for estimating the literacy rate. Prior to 1991 census, the literacy rate had been estimated taking the 5+ age group population as the denominator 8. The NSSO survey covers the entire country and adopts the census definition of literacy but takes a sample as a basis for estimation. However, in1991, the NSSO administered tests to a sub-sample of the 15+ age group population to verify the literacy status of those who declared themselves as literate. One of the important outcomes of this exercise was that nearly 34% of those who claimed literate status had failed to qualify the test (NSSO 1995). This has significant implications for assessing estimates of literacy rate provided in different population censuses. The NSSO surveys also provide useful information on the characteristics of various types of households defined in terms of monthly per capita consumer expenditure, main occupation, etc. by literacy status. The latest survey of the NSSO (55 th Round 9 ) was conducted in July June There was only 7-month difference between the latest NSS (55 th Round) and the population census in The findings of the NSS (55 th Round) on literacy 10 are quite robust as these are not much different from that of the Census of India, 2001 (see Table A5 in Annexure I). The National Literacy Mission defines literacy as acquiring the skills of reading, writing and arithmetic and the ability to 2 For example, literacy assessment practices by the Indian Institute of Education in Maharashtra, and Digantar in Madhya Pradesh. However, these innovative literacy assessment practices have not been widely replicated in the country. For further details, see Rao, I. V. Subba (2002), Literacy Assessment Practices (LAP) in Selected Developing Countries: India Case Study. 3 If literacy is measured in terms of years of schooling, the average is merely 2.4 years in India for persons aged 25 and above (Dreze and Sen 1995). 4 Census of India, 2001, State of Literacy (Chapter 7), Provisional Population Totals, Series 1, India, Paper 1 of An illiterate member (s) having literate member (s) in the household, which generates intra-household externalities. 6 An illiterate member (s) having no literate member in the household, which does not generate intra-household externalities. 7 For further details, see Basu, Kaushhik, et al, (2000), Isolated and proximate illiteracy and why these concepts matter in measuring literacy and designing education programmes. Working Paper No. 00-W02, Vanderbilt University, Nashville. 8 When total population is taken as the denominator, the estimated literacy rate is called the crude literacy rate. 9 Sample size was 600,016. The survey followed a two stage stratified design with villages or urban blocks as first stage and households as second stage. 10 NSSO (2001), Literacy and Levels of Education in India, Report No. 437 (55/1.0/11), Ministry of Statistics and Programme Implementation, Government of India. 5
6 apply them to one s day-to-day life. 11 The definition of literacy by the NLM goes beyond the census definition and focuses on the functional literacy. The NFHS defines an illiterate person as one who can not read and write, even if he/she may have been to school 12. Over the last five decades, there has been an impressive growth in literacy in India. In 1901, a little over 5% of Indian population was literate, which increased to around 16% in 1950, a mere increase of 11 percentage points in the literacy rate during the first half of the century. In the post-independence period, the decadal growth in literacy has shown a substantial progress i.e. from 18.35% (5+ age group population) in 1951 to 65.38% (7+ age group population) in Chart 1: Literacy rate by sex in India since Percentage of literates Male Female Total Census Year Source: Census of India, Notes: (i) (ii) (iii) Literacy rates for 1951,1961 and 1971 censuses relate to population aged five years and above. The rates for the 1981,1991 and 2001 census relate to population aged seven years and above. In the 1981 census, literacy rates exclude Assam where census could not be conducted and the 1991 literacy rates exclude Jammu & Kashmir where Census could not be conducted due to disturbed conditions. In the 2001 census, literacy rates exclude entire Kachchh district, Morvi, Maliya-Miyana and Wankaner talukas of Rajkot district, Jodiya taluka of Jamnagar district of Gujarat State and entire Kinnaur district of Himachal Pradesh where population enumeration of the Census of India, 2001 could not be conducted due to natural calamities. The female literacy rate was just 8.9% in 1951, which went up to 54.2% in 2001 (see Chart 1). The literacy rates for population in the 7+ age group are available for the last three censuses, and therefore, comparable for assessing the progress. In 1981, the literacy rate was 43.57% (56.58% for male and 29.76% for female), which increased to 52.21% 13 (64.13% for males and 39.29% for females) in In 2001, almost two-thirds of India s population (65.38%), and around three-fourths of males (75.85%) and more than half of females (54.16%) were literate. Between 1981 and 2001, while the literacy rate of population increased by percentage points, the female literacy rate went up by percentage points. During this period, the increase in the female literacy rate was more than the male literacy rate, which was percentage points. The literacy rate registered an increase of percentage points from 1991 to 2001; the highest increase in any one-decade. Much of this increase 11 NLM, 1994, and website of the NLM. 12 IIPS (2000), NFHS-2, India. p Excluding Jammu and Kashmir, where census could not be conducted. 6
7 may be due to the implementation of various national and state level externally funded primary education programmes and the national adult literacy programmes of the NLM. The increase in female literacy (14.87 percentage points) was also relatively higher than that of the male literacy rate (11.72 percentage points) in the 1990s. In 1951, only 12.1% of rural population and 4.87% of females in India were literate. In 2001, rural literacy rate increased to 59.4% (71.4% for males and 46.7% for females). During , the increase in female literacy rate (16.1 percentage points) in rural area was relatively more compared to that of the male (13.5 percentage points). In urban India, only 34.59% of the population was literate in 1951, which increased to 80.3% in The female literacy rate was 22.33% in 1951, which increased to 73.2% in 2001 (see Chart 2). In urban area too the growth in female literacy rate (13.2 percentage points) was relatively faster than that of the male (5.6 percentage points) during In 1951, the male-female differences in the literacy rate in rural and urban areas were and percentage points respectively. In 1991, the gaps in the male-female literacy rate in rural and urban areas were 27.3 and 17.1 percentage points respectively, which came down to 24.7 and 13.5 percentage points in In 1991, rural-urban gap in literacy rate was 28.4 percentage points, which decreased to 20.9 percentage points in In other words, while 4/5 th of the urban population was literate, more than 2/5 th of the rural population was illiterate in Chart 2: Progress of literacy rates by sex and rural/urban area in India since 1951* Percentage of literate Rural Male Rural Female Rural Total Urban Male Urban Female Urban Total Male (Rural+ Urban) Female (Rural+ Urban) Total (Rural+Urban) Source: Census of India, Notes: (*) For 1951, the population male, female and persons refer to effective literacy rates and the break up of rural, urban, male and female components are crude literacy rates. (i), (ii), and (iii) Same as that of Chart 1. Another notable aspect of the progress in literacy in India is that, for the first time, the number of illiterates has gone down in absolute term. During , the population of India in the 7+ age group increased by 172 million, while around 204 million additional persons became literate. As a result, the total number of illiterates came down from million in 1991 to million 14 in During this period, the absolute number of illiterates decreased by around million. In 1981, India had million literate persons, which increased to million in 1991 and million in The average annual growth of literate persons was 4.30% during , 14 As per the provisional figures, the estimated number of illiterates in India was 296 million in 2001, which excludes the number of illiterates in Jammu and Kashmir. This figure increases to million when the estimate is based on the district level data of the Census of India 2001, and the number of illiterates in Jammu and Kashmir is included. 7
8 and it was 4.66% during The number of illiterates grew at an average annual growth rate of 0.75% during , while it declined at an average annual growth rate of 0.91% during II. Gender and Regional Variations in Literacy As has been mention earlier in Section I, there has been relatively greater progress in the literacy rate of females during the last two decades. The gender gap has been reduced in 2001 compared to what it was in 1981 and Male-female differential in literacy rate was percentage points in 1981 and percentage points in 1991, which decreased to percentage points in The progress in the female literacy rate hides the fact that, the decrease in absolute number of non-literate females between 1991 and 2001 is relatively small compared to that of the males. In 1991, the number of male illiterates in the country was million, which came down to million in The decrease in the number of male illiterates was 16.74% during In 1991, the number of female illiterates was million, which decreased to million in The decrease was just 5.25% during the same period. The slower progress made in the reduction of the number of non-literate females during the last decade can be attributed to relatively lower participation rate and higher dropout rate of girls at the primary level of education. According to the National Family Health Survey 15 (NFHS-2), while 85.2% of boys in the age group 6-10 were attending school, only 78.3% of girls were doing so in In , the percentage share of girls in total enrolment at primary level was The boys-girls differential in the Gross Enrolment Ratio (GER) at the primary level was around 19 percentage points. 16 Besides, there exist huge variations in literacy rates across states (provinces) in India. According to 2001 census, Kerala remains on the top with a literacy rate of 90.9%, while Bihar is at the bottom with a literacy rate of 47.5%. In 2001, 23 states/uts had literacy rate equal to or above the national average (Chhatisgarh having literacy rate of 65.18% included). States/UTs having literacy below the national average are Assam, Madhya Pradesh, Orissa, Meghalaya, Andhra Pradesh, Rajasthan, Dadra and Nagar Haveli, Uttar Pradesh, Arunachal Pradesh, Jammu and Kashmir, Jharkhand and Bihar. In the same year, 24 states and UTs had male and female literacy rates equal to or more than the national average. States having female literacy rate below the national average are Chhatisgarh, Andhra Pradesh, Orissa, Madhya Pradesh, Rajasthan, Arunachal Pradesh, Dadra and Nagar Haveli, Uttar Pradesh, Jammu and Kashmir, Jharkhand and Bihar. Between 1991 and 2001, Kerala has registered the lowest increase in the literacy rate (1.11 percentage points), primarily because of the high literacy rate in the base year. Among the educationally backward states mostly located in the north, Bihar has shown the lowest increase in the literacy rate during the last decade (i.e percentage points), and Rajasthan and Chhatisgarh have registered the highest increase (i.e and percentage pints respectively). The literacy rate during the last decade has also increased substantially in Uttar Pradesh (16.65 percentage points), Arunachal Pradesh (17.03 percentage points), Andhra Pradesh (17.02 percentage points) and Madhya Pradesh (19.44 percentage points), and Orissa (14.52 percentage points). During the last decade, the educationally backward states located in the Hindi speaking belt of the country have 15 The survey also finds that while the median number of years of schooling was 5.5 for males (6+ age group), it was only 1.6 for females (6+ age group). The share of girls enrolment in total enrolment at primary level (grades I-V) 43.6% in , and the Gross Enrolment Ratio (GER) was 104.1% for boys and 85.2% for girls (Selected Educational Statistics, MHRD, ). Around 39% of boys entering grade I dropped out before grade V, and 42% of girls did so (Selected educational Statistics, MHRD, ). 16 Selected Educational Statistics, MHRD, GOI, various years. 8
9 contributed significantly to the reduction of illiteracy in the country. It may be noted that during the 1990s, several state specific basic education programmes like Uttar Pradesh Basic Education Programme, Bihar Education Programme, Andhra Pradesh Primary Education Programme, Lok Jumbish, and Education Guarantee Scheme were implemented in the educationally backward states. Besides, the District Primary Education Programme focused on the backward districts, mostly located in these states. The NLM also focused on these states while implementing adult literacy programmes. These interventions have perhaps contributed to the relative faster growth of literacy in educationally backward states. How much of this contribution can be attributed to basic education programmes and adult literacy programmes? One can have some idea about this only when census data on literacy by age group are available. Chart 3: Share of illiterates (persons) in India 2001 Chart 4: Share of female illiterates to total female illiterates in India 2001 Rest of India 35% Uttar Pradesh Bihar Andhra Pradesh West Bengal Maharashtra Rajasthan Madhya Pradesh rest of India Uttar Pradesh Bihar Andhra Pradesh West Bengal Maharashtra Rajasthan Madhya Pradesh Rest of India Even after the impressive progress in literacy during the last decade, still India is home to million 17 non-literates, which includes million females (63.95%). Nearly 46.51% of illiterates are found in 4 states Uttar Pradesh, Bihar, Andhra Pradesh and West Bengal. Around 65% of illiterates are found in 7 states -- Uttar Pradesh, Bihar, Andhra Pradesh, West Bengal, Maharashtra, Rajasthan and Madhya Pradesh (Chart 3). In absolute terms, nearly million illiterates are found in these 7 states, and around 64% of them are females. The share of females in total illiterates of the state is very high in Uttaranchal (70.8%), Himachal Pradesh (69.2%), Kerala (69.2%), Rajasthan (68.6%) and Maharashtra (68.6%) (see Chart 5). However, in terms of female literacy rate in 2001, Kerala tops the list; Himachal Pradesh takes 10 th rank, Maharashtra 11 th rank, and Uttaranchal 18 th rank. It implies that, even in educationally advanced states, most of the illiterates are females. However, in 2001, the percentage change in the number of illiterate persons was negative in eight states/uts namely, Dadra and Nagar Haveli, Daman and Diu, Manipur, Nagaland, Arunachal Pradesh, Bihar, Delhi and Chandigarh (see Table A5 and Chart A2 in Annexure I). Except Bihar, all other such states are located in the north-eastern part of the country, and the total population of these states is relatively small. The negative change in the number of illiterate persons in most of the above-mentioned union territories 17 Census of India, 2001 (Series 1, Provisional Population Totals (Paper 1 of 2001). 9
10 is primarily because of rural-urban migration, especially casual labourers. More than 20% decrease in the number of illiterate persons during was in two states -- Chhatisgarh (25.62%) and Himachal Pradesh (22.42%). Besides, during the same period, more than 15% decrease in the number of illiterate persons was in 8 other states Rajasthan (16.95%), Tripura (18.58%), Madhya Pradesh (16.97%), Maharashtra (17.35%), Andhra Pradesh (17.28%), Goa (15.97%), Uttaranchal (19.13%) and Tamil Nadu (18.18%). More than 10% decrease in the number of illiterates was in 3 states West Bengal (11.04%), Mizoram (13.35%), and Orissa (14.36%). At the all-india level, the percentage decrease in the number of illiterates was 9.74 during Towards reduction of the number of illiterates in the country, 7 states/uts have contributed negatively. These are Delhi, Bihar, Arunachal Pradesh, Nagaland, Manipur, Chandigarh, and Dadra and Nagar Haveli. Highest contribution has come from Andhra Pradesh (16.79%) and the least from Bihar (-9.33%). Rajasthan, Uttar Pradesh, Madhya Pradesh, Maharashtra and Tamil Nadu have made more than 10% contribution in the reduction the number of illiterates at the national level. Three of the five such states are located in the Hindi-speaking belt of north, northwest and central India. Andhra Pradesh, Uttar Pradesh, Maharashtra, Rajasthan, Madhya Pradesh and Tamil Nadu contributed around 3/4 th of the percentage decrease in the total number of illiterates in the country, whereas half of the country s population lived in these states in Uttar Pradesh contributed the maximum (19.46%) in the decadal ( ) decrease of male illiterates in the country. Five other states also contributed significantly to the decadal decrease in the number of male illiterates Andhra Pradesh (13.59%), Maharashtra (9.21%), Madhya Pradesh (11.37), West Bengal (7.03%), and Rajasthan (12.42%). Eight states, including Kerala (-0.01%), contributed negatively to the decadal decrease in the number of male illiterates. During the last decade, the maximum number of female illiterates decreased in Andhra Pradesh (2.45 million; 13.31%), followed by Maharashtra (2.01 million; 13.37%), Tamil Nadu (1.89 million; 16.19%), Madhya Pradesh (1.21 million; 9.29%) and West Bengal (1.13 million; 7.88%). The contribution of these 5 states taken together explains 82.69% of the total decline in female illiterates in the country. Bihar has made a huge negative contribution (-21.99%) in the decadal decline in female illiterates in the country. Other states/uts, which have made significant negative contribution to decadal decline in female illiterates in the country, are Jharkhand (-2.85%), Gujarat (-1.31%), Delhi (-1.67%) and Nagaland (-0.93%). In 1991, the Gender Parity Index (GPI) of literacy rate was 0.59 or less) in 12 state and UTs, namely Rajasthan, Bihar, Uttar Pradesh, Jharkhand, Chhatisgarh, Madhya, Pradesh, Dadra & Nagar Haveli, Orissa, Uttaranchal, Andhra Pradesh, Haryana, and Arunachal Pradesh. In 18 states and UTs, the GPI of literacy rate was equal to or more In 2001, the GPI of literacy rate was equal to or less than 0.69 in 10 states and UTs i.e. Andhra Pradesh, Madhya Pradesh, J&K, Uttar Pradesh, Orissa, Jharkhand, Chhatisgarh, Rajasthan, Bihar, and Dadra and Nagar Haveli. Table 1: Relative position of major states in terms of gender disparity in literacy rates, 1991 and 2001 S. No. State Rank 18 (GPI 19, 1991) Rank (GPI, 2001) 1. Rajasthan Higher the rank, wider is the gender disparity in the literacy rates in the state, i.e. smaller the size of the GPI in literacy. A state getting Rank 1 has the highest gender disparity and a state having Rank 20 has the lowest gender disparity in literacy. The ranking is not based on all states and UTs. The basic purpose is to show the progress of major states in bridging gender gap during GPI of Literacy = Female Literacy Rate/ Male Literacy Rate. 10
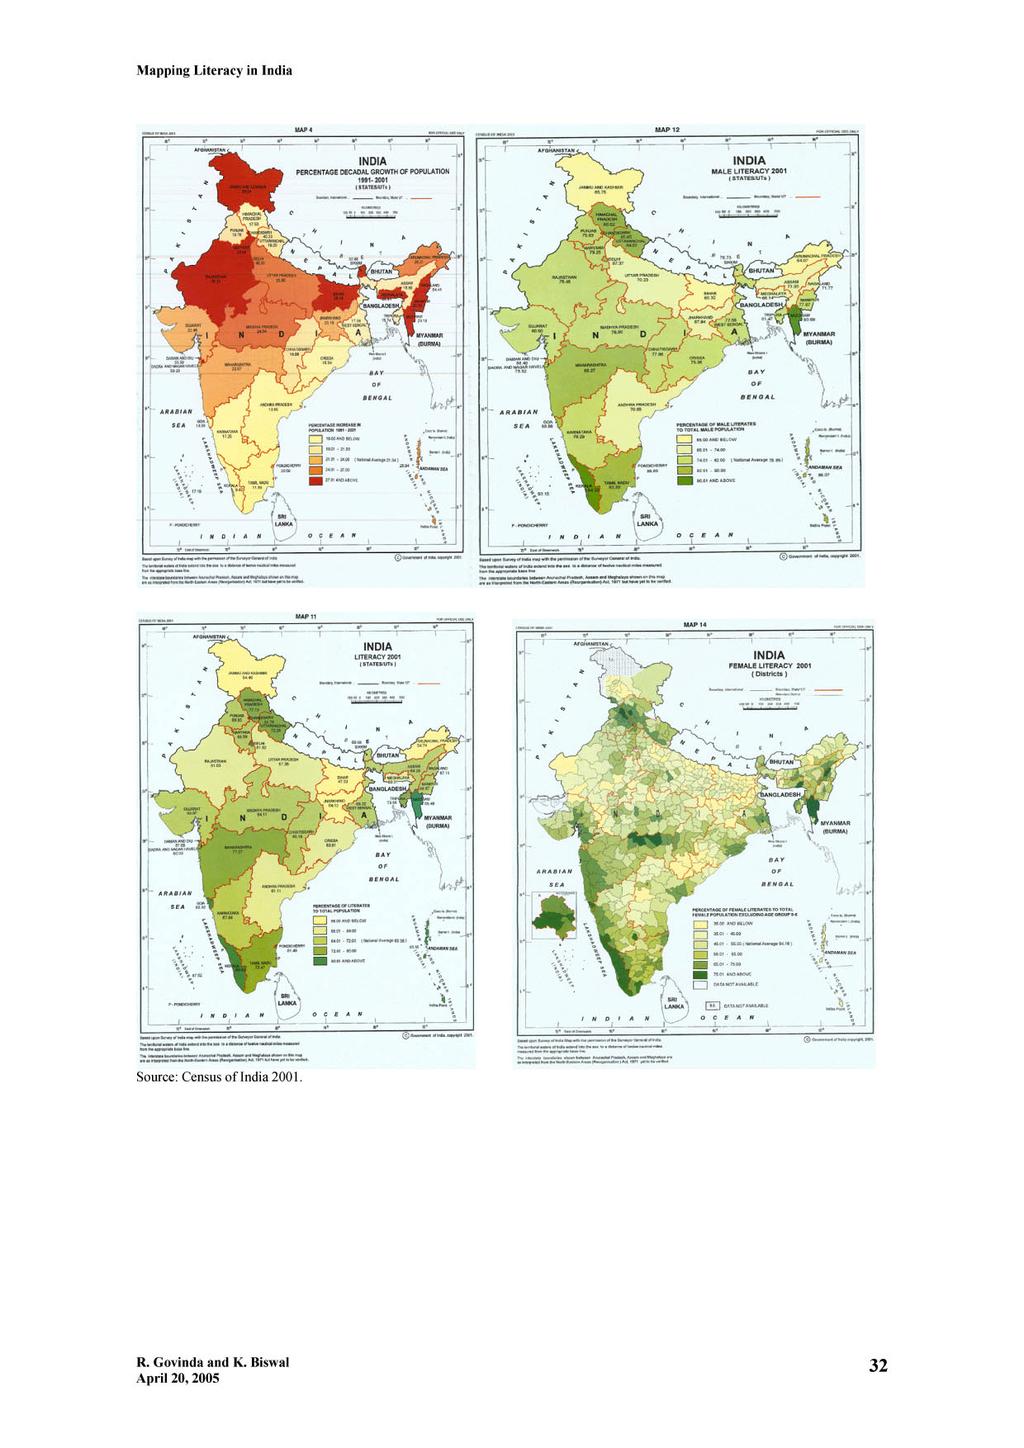
11 2. Bihar Uttar Pradesh Jharkhand Chhatisgarh Jammu and Kashmir NA Madhya Pradesh Orissa Uttaranchal Andhra Pradesh Haryana Arunachal Pradesh Karnataka Manipur Gujarat Maharashtra West Bengal Himachal Pradesh Assam Tamil Nadu Source: Estimated using data from the Census of India, Chart 3: GPI of literacy rates in major states, 1991 and Uttar Pradesh Bihar Andhra Pradesh West Bengal Maharashtra Rajasthan Madhya Pradesh GPI 2001 GPI 1991 Map 1: Female literacy rate in India, 2001 Source: GPI for major states estimated by authors on the basis of Census of India 2001 data. The gender gap in literacy rate was highest in Bihar followed by Jharkhand, Rajasthan, Uttar Pradesh, Jammu and Kashmir, Madhya Pradesh, Orissa, Chhatisgarh and Andhra Pradesh (see Table 1; Chart 5; and Map 1). In 1991, gender gap in literacy was the highest in Rajasthan, which improved its position to the third place in Bihar, which had second position in 1991 in terms of gender disparity in literacy, moved to the first position in 2001, further widening the gender disparity. Relative performance of states like Jharkhand, Gujarat and Assam was not very encouraging in reducing the gender gap in literacy (see Table 2). The share of females in total illiterates continues to be high in major states (see Chart 6). 20 Census not held in the state. 11
12 Chart 6: Share of females in total illiterates, % 90% 80% 70% 60% 50% 40% 30% 20% 10% 0% Uttar Pradesh Bihar Andhra Pradesh West Bengal Maharashtra Rajasthan Madhya Pradesh Males Females Regional variations in literacy rate become more pronounced when analysis is done at the district level. According to 2001 census, around one-fifth of 591 districts 21 (i.e. 81 districts) have literacy rate equal to or less than 50%; 21.3% of the districts have literacy rate in the range of 50-60%; 29.3% of districts have literacy rate ranging between 60% and 70%; a little more than a quarter of the districts have literacy rate ranging between 70% and 80%; and only 10% of the districts have literacy rate more than 90%. Around 21% of the districts have female literacy rate equal to or less than 40%; 21.5% of districts have 40-50% female literacy rate; 23.4% of districts have female literacy rate ranging between 50-60%; one-fifth of the districts have 60-70% female literacy rate; and around 14% of districts have more than 80% of female literacy rate. Most of the low literacy districts (26 districts having literacy rate less than 40%) are located in the educationally backward states such as Bihar (11 districts; 42.3%), Jharkhand (3 districts; 11.5%), Orissa (4 districts; 15.4%), and Uttar Pradesh (5 districts; 19.2%). Most of the high literacy districts (46 districts having literacy rate = 80-90%) are found in Kerala (6 districts; 13.0%), Maharashtra (9 districts; 19.6%), and Delhi (6 districts; 13.0%). Districts having more than 90% literacy rate are found in Kerala (8 districts; 61.5%), Mizoram (4 districts; 30.8%) and Pondichery (1 district; 7.7%). In terms of absolute number of illiterates in 2001, the top 100 districts are found in 11 states -- Andhra Pradesh, Bihar, Gujarat, Jharkhand, Karnataka, Maharashtra, Orissa, Rajasthan, Tamil Nadu, Uttar Pradesh and West Bengal (see Chart 7). These districts are home to million illiterates (around 40% of illiterates of the country). Among these 100 districts, female literacy rate is more than 70% (maximum 77.86%) in 12 districts in Bihar (7 districts) and Uttar Pradesh (5 districts) Araria (Bihar), Bahraich (UP), Purnia (Bihar), Katihar (Bihar), Purba Champaran (Bihar), Budaun (UP), Paschim Champaran (Bihar), Sitamari (Bihar), Madhubani (Bihar), Gonda (UP), Rampur (UP), and Siddharthnagar (UP). Sixty-seven districts in the country spread over 9 states are having million plus illiterates. These districts are home to million illiterates, which is 29.5% of total illiterates in the country (see Map 2). These districts are located in Andhra Pradesh (14), Bihar (15), Gujarat (2), Karnataka (2), Maharashtra (3), Rajasthan (1), Tamil Nadu (1), Uttar Pradesh (20), and West Bengal (9). The top 10 districts in terms of absolute number of illiterates are found in 4 states Bihar (3 districts), West Bengal (5 districts), Uttar Pradesh (1 district), and Andhra Pradesh (1 district). These are Murshidabad (WB), Medinapur (WB), Purba Champaran (Bihar), South 24 Parganas (WB), North 24 Parganas (WB), Bardhaman (WB), Madhubani (Bihar), Moradabad (Uttar Pradesh), Mahbubnagar 21 Census of India, 2001 has been conducted in 591 districts out of the total 593 districts. 12
13 Mapping Literacy in India (Andhra Pradesh), and Muzaffarpur (Bihar). These 10 districts have million illiterates accounting for around 6% of illiterates in the country. Map 2: 67 districts with million plus illiterates Chart 7: Distribution of top 100 districts (in terms of absolute number of illiterates), 2001 Andhra Pradesh Bihar Gujarat Jharkhand Karnataka Maharashtra Orissa Rajasthan Tamil Nadu Uttar Pradesh West Bengal Source: Prepared using estimated data based on Census of India and the map based on Survey of India. NIEPA has the copy right of the map. More than half of the population is illiterate in 81 districts located in 15 states (see Chart 8). Most of these districts are located in Bihar (around 28%) and Uttar Pradesh (around 22%). Around one-fifth of the illiterates (61 million; 20.32%) live in these 81 districts. Female illiteracy rate is more than 50% (maximum of 81.51%) in 253 districts mostly located in Andhra Pradesh, Arunachal Pradesh, Bihar, J and K, Jharkhand, Madhya Pradesh, Orissa, Rajasthan, and Uttar Pradesh (see Chart 14). These districts have million female illiterates, which accounts for 54.51% of female illiterates in the country. In 17 districts, more than 3/4th of the females are illiterates. These districts are located in Bihar (7), Chhatisgarh (1), Jharkhand (2), Orissa (4), and Uttar Pradesh (3). These districts are Kishanganj (Bihar), Shravasti (UP), Pakaur (Jharkhand, Dantewada (Chhatisgarh), Nabarangapur (Orissa), Supaul (Bihar), Malkangiri (Orissa), Balrampur (UP), Araria (Bihar), Madhepura (Bihar), Garhwa (Jharkhand), Bahraich (UP), Purnia (Bihar), Katihar (Bihar), Rayagada (Orissa), Purba Champaran (Bihar), and Koraput (Orissa). 13
14 Chart 8: Distribution of 81 districts where more than half of the population are illiterates, Number of Districts 5 0 Andhra Pradesh Arunachal Assam Bihar chhatisgarh Gujarat J and K Jharkhand Karnataka Madhya Pradesh Nagaland Orissa Rajasthan Uttar Pradesh West Bengal III. Literacy Rates by Age, Social Group and Household Type Presently, data on literacy rates by age group are not available for the census year Literacy rates for population (age 15+) have been obtained by simple extrapolation. In 1991 census, the difference between the literacy rates of age groups 7+ and 15+ was 4 percentage points, which increased to 5 percentage points in 1997 (NSS 53 rd Round)). As several basic education programmes have been implemented in the 1990s, particularly in the educationally backward states, it is expected that literacy level of children in 7-14 age group would have increased at a relatively faster rate. Therefore, it has been assumed that the difference between the literacy rates of age groups 7+ and 15+ is 6 percentage points in 2001 census. To get the literacy rate of 15+ age group population, 6 percentage points have been deducted from the literacy rate of 7+ age group population. Over the years, the literacy rate of population in the age group 15+ has shown a linear increase. In 1961, the literacy rate of the population (age 15+) was just 27.8% (41.5% for males and 13.2% for females), which increased to an estimated 59.4% 22 (71.1% for males and 47.1% for females) in According to the NFHS-2, , the literacy rate of population (age 15+) is 58.6%. If we apply the estimates of the NSS 53 rd Round, 1997 (i.e. 5 percentage point difference between the literacy rates of population in the age group 7+ and 15+) to the literacy rates as given in the census 2001 data, the literacy rate of population in 15+ age group comes to 60.4%. Table 2: Literacy rate of population (age 15+), India Year Males Females Total Gender Gap * ** Sources: (i) Census of India, 1961,1971, 1981 and (ii) Applying the 5 percentage point difference in the literacy rate between 7+ and 15+ age group population to 2001 census data on the basis of estimates of NSS 53 rd Round (iii) **Srivastava, ABL, Chart 9:Literacy rate of the population in the age group 15+, Male Female Total Srivastava, ABL,
15 According to 2001 census, total population (age 15+) in India is 666,999,816, which is 65.5% of the total population. In 2001, the country had million 23 literates (age 15+). If we consider a 6 percentage point difference in the literacy rate of population 7+ and 15+, the estimated number of literates (age 15+) comes to million. This seems to be more likely because of progress in primary education during the last decade, increasing the size of the literates in the age group The gender gap in the literacy rate of population (age 15+) still continues to be as high as 24.0 percentage points 24, whereas it was 21.7 percentage points for population (age 7+) in Since 1961, the gender gap in the literacy rate of population (age 15+) has been reduced by only 4 percentage points. In fact, the gender gap in the literacy rate of population (age 15+) did not decrease up to the census year 1991 (see Table 2 and Chart 9). However, if we consider the information from the NSS 53 rd Round, the difference between the literacy rates of population in the age group 7+ and 15+ was 5 percentage points (3 percentage points for males and 7 percentage points for males) in Table 3: Age group (In years) Illiterate Percentage distribution of population (age 6 and above) by literacy and primary level of education, India, Males Females Total Literate Primary Illiterate Literate Primary Illiterate Literate <primary school <primary school <primary school graduate 25 school graduate school complete complete complete Primary school graduate Total Source: Table 4: International Institute for Population Sciences (2000), National Family Health Survey (NFHS-2), , India. Mumbai., p. 28, Table 2.7. Estimated number of illiterates by age group and sex, India, 2001 (based on NFHS-2 estimates of illiteracy rate in ) Age group % of illiterates (NFHS-2) Population, Census 2001 (In million) Estimated number of illiterates, 2001 (In millions) Male Female Total Male Female Total Male Female Total Source: Note: Estimated by authors using NFHS-2 and Census 2001 data. The illiteracy rates by age group from NFHS-2 have been applied to estimate the number of illiterates in The estimated figures may be slightly higher because of two years difference between the NFHS-2 and Census, In the Table 4, the number of illiterates have been estimated for only five age groups, whereas the NFHS-2, illiteracy rate is given for 3 other age groups, i.e. 6-9; 50+; and Total having no information on age, p.28, Table 2.7. According to the NFHS-2 data, the literacy rates of the population in and age groups were 76.9% and 67% respectively in In 1991, the literacy rates of 23 When a 5 percentage point difference in the literacy rates of population 7+ and 15+ is considered. 24 On the basis of the estimated literacy rates as given in Table Primary school complete means 5 to 7 completed years of schooling. 26 Includes persons with missing information on age, who are not shown separately. 15
16 children in the age groups and were 68.6% and 65.8% respectively. The increase in the literacy rates of these age groups may not be very substantial between It implies that the illiteracy rate of young adults still continues to be high in the country. An estimated million 27 children (14.72 million girls) in the age group were illiterate in As per the estimate, the number of illiterates in the age group was million (53.79 million females) (see Table 4). In 2001, the estimated number of illiterates in the age group was million (also see Chart 10). An estimated million children in the age group were illiterates in The estimated number of female illiterates in the age groups 20-29, 30-39, and was almost double the number of male illiterates in It also implies that the number of illiterates in the older cohorts of the population still continues to be very high, which calls for designing and implementing large scale adult literacy programmes in the country. Besides, huge number of illiterate children in 2001 has serious implications for achieving the goal of EFA in the country by Chart 10: Percentage of illiterates by age group and sex, India, (NFHS-2), Total Males Females Total Source: Table 3. The variation in the literacy rate across social groups and household type is high in India. In terms of social status, the population of India can be grouped into four categories i.e. Scheduled Castes (SC), Scheduled Tribes (ST), Other Backward Class (OBC), and others. The SC and ST population are generally disadvantaged in most of the states in India. According to the 2001 Census, India has 16.2% and 8.2% of SC and ST population respectively. The greatest concentration of population of SCs is in Andhra Pradesh, Tamil Nadu, Bihar, West Bengal, Uttar Pradesh, Uttaranchal, Punjab, Rajasthan, Himachal Pradesh, Maharashtra, Karnataka, and Orissa (also see Chart A5 in Annexure I). Besides the northeastern states, STs are found in greater numbers in Orissa, Maharashtra, Madhya Pradesh, Jharkhand, Chhatisgarh, Gujarat and Rajasthan. It may be noted that the educational status of ST households is relatively better in majority of the northeastern states. As per 1991 Census, the literacy rate of SCs and STs was 37.41% and 29.6% respectively, much lower than the literacy rate of the general population. The literacy rates of SC males and females were 49.91% and 23.79%, a gender gap of percentage points. The ST male and female literacy rates were 40.65% and 18.19%, also a wide gender gap of percentage points. The literacy rate was lowest for SCs in Bihar 27 The number of illiterates in different age groups have been estimated by the authors by applying the illiteracy rates of the respective age group population as estimated in the NFHS-2, Under the Sarva Shiksha Abhiyan (Education for All Programme), India aims at achieving universal elementary education of 8 years of formal schooling or its alternatives for children in the age group 6-14 by
17 (19.49%), and highest in Kerala (79.66%), and for STs, it was the lowest for Andhra Pradesh (17.16%) and highest in Mizoram (82.0%). Literacy rate of STs was more than SCs in Bihar, Meghalaya, Mizoram, Sikkim and Uttar Pradesh. In general, SCs were ahead of STs in the literacy rate, but in urban areas, the STs were ahead of STs. The literacy rate of SC females compared to general population was much lower in Bihar (7.07%), Rajasthan (8.31%) and Uttar Pradesh (10.69%). The literacy rate of ST females was extremely low in Rajasthan (4.4%). As the Census 2001 has not yet brought out the data on the literacy rate of SCs and STs, it is not possible to assess the progress during the last decade. However, literacy data by social group are available from the 55 th Round of NSS ( ), which was conducted just 7 months before the Census, As per NSS, 55 th round, the literacy rate of SCs in rural India was 46.6% (58.8% for males and 33.6% for females). In urban India, the literacy rate was 66.2% (76.0% for males and 55.7% for females). The literacy rate of ST population was 42.2% in rural areas (53.8% for males and 30.1% for females), and in urban areas, it was 70% (78.1% for males and 61.2% for females). The literacy rate of Other Backward Class (OBC) was 54.8% (67.8% for males and 54.8% for females) in rural India. In urban India, the literacy rate of OBC was 75.3% (83.5% for males and 66.4% for females). Though the literacy rates of SC and ST population have increased between 1991 census and the NSS, 55 th round, the increase is much slower than that of the general population. Between 1991 census and NSS, 55 th round, the progress in the literacy rate of ST population is relatively faster than that of the SC population (see Chart 11). Chart 11: Illiterates per 1000 persons (7+ age group) by sex and social group in rural and urban India, Illiterates per 1000 persons Rural Male Rural Female Rural Total Urban Male Urban Female Urban Total Social Group Scheduled Tribe Scheduled Caste Other Backward Class Others Not Recorded Source: NSS, 55 th Round (2001), Report No. 473 (55/1.0/11). As per NSS, 55 th round, in rural India, the illiteracy rates of SC, ST and OBC females were very high, and it was highest for the ST females (69.9%). In urban India, the illiteracy rate of SC females was higher than that of the ST females. The illiteracy rate of others was much lower compared that of SCs, STs and OBCs in both rural and urban areas (see Chart 11). In the 7 major states, where around 65% of illiterates are found in 2001, the literacy status of SCs, STs and OBCs is relatively very low. As per NSS, 55 th round, in rural areas, the illiteracy rate of ST population was higher than that of the SC population in Andhra Pradesh, Madhya Pradesh, Maharashtra and West Bengal. The illiteracy rate of SC population was higher than that of the ST population in Bihar, Rajasthan and Uttar 17
18 Pradesh. The illiteracy rate of OBC was also very high in Rajasthan, Andhra Pradesh, Bihar and Uttar Pradesh (see Chart 12). Chart 12: Iliterates per 1000 persons (7+ age group) in rural area by social grpup in 7 major states in India, Illiterates per 1000 persons Andhra Pradesh Bihar Maharashtra Madhya Pradesh Rajasthan Uttar Pradesh West Bengal Social Group Scheduled Tribe Scheduled Caste Other Backward Class Others Source: Ibid. In urban areas in these 7 states, the illiteracy rate of SC population was more than 50% in Bihar, and more than 40% in Rajasthan and Uttar Pradesh. The illiteracy rate of ST population was more than 40% in Andhra Pradesh and Uttar Pradesh. Even the urban OBC are not better off in literacy in these states, particularly in Andhra Pradesh, Bihar, Rajasthan and Uttar Pradesh (see Chart 13). In general, the illiteracy rates of SC, ST and OBC population were much lower in urban areas compared to that of the rural areas. It may be noted that these states are not very urbanized, and therefore, most of the illiterates live in villages. As per 2001 Census, while 27.78% of population lives in urban area in India, the share of urban population is much lower in Rajasthan (23.38%), Uttar Pradesh (20.78%), Bihar (10.47%) and Madhya Pradesh (26.67%). Among the 7 states, Maharashtra has the largest share of urban population (42.4%), where around one-fifth of the urban SCs and STs are illiterate. Chart 13: Illiterates per 1000 persons (7+ age group) by social group in urban areas in 7 major states in India, Illiterates per 1000 Persons Andhra Pradesh Bihar Maharashtra Madhya Pradesh Rajasthan Uttar Pradesh West Bengal Social Group Scheduled Tribe Scheduled Caste Other Backward Class Others 18
19 Source: Ibid. Analysis of NSS, 55 th round data by household type reveals that the literacy rate of agricultural labourers is the lowest in rural areas. In urban areas, the literacy rate of the casual laborers is distinctly very low. In rural India, the illiteracy rate of agricultural labourers was 57.4% (46.5% for males and 68.8% for females) in 2000 (see Chart 14). In urban India, the illiteracy rate of casual laborers was 40.7% (31.8% for males and 50.5% for females) in the same year (see Chart 15). The female illiteracy rate was the highest agricultural labour households in rural areas, and casual labour households in urban areas. This implies that the economic status of the households is directly related to the literacy level in the country. Moreover, states where most of the illiterates are found have high illiteracy rates among agricultural labourers and casual labourers. As per NSS, 55 th round, compared to other states, the illiteracy rate of agricultural labourers in rural areas was very high in Bihar (76.9), Andhra Pradesh (64.5%0, Madhya Pradesh (60.6%), Orissa (59.3%), Rajasthan (65.2%), West Bengal (53.6%), and Uttar Pradesh (67.4%) in 2000 (see Chart 16). Chart 14: Illiterates per 1000 persons (7+ age group) by sex and household type in rural India Illiterates per 1000 persons Self-employed in nonagr Agricultural labour Other labour Self-employed in agr others Not recorded Household Type Male Female Total Source: Ibid. 19
20 Chart 15: Illiterates per 1000 persons (7+ age group) by sex and household type in urban India, Illiterates per 1000 population Self-employed Regular wage/salary earnings Casual labour Others Not recorded Household Type Male Female Total Source: Ibid. 20
21 Chart 16: Illiterates per 1000 persons (7+ age group) by household type in rural areas in major states of India, West Bengal Uttar Pradesh Tamil Nadu Rajasthan Punjab Orissa Maharashtra Madhya Pradesh Kerala Karnataka Himachal Pradesh Haryana Gujarat Bihar Assam Andhra Pradesh Illiterates per 1000 persons Self-employed in non-agr Agricultural labour Other labour Self-emplyed in agr Others IV. Who are the Illiterates? Who are the illiterates? Illiterates are found across all regions and demographic groups in India. They are found in both rural and urban areas; relatively more in rural areas because of obvious reasons. They are mostly females and belong to socioeconomically backward communities, particularly SCs and STs. Poverty happens to be the 21
22 single most important factor contributing to the high illiteracy rate in the country. Even without any empirical evidence, one can draw a conjecture between the high concentrations of agricultural labourers in districts having high illiteracy rate. Discussions in the preceding section also reveals that the 7 states having around 65% of illiterates have high concentration of SCs and STs, and the illiteracy rates of agricultural and casual labour households are relatively very high. Besides, in most of the sates, where female illiteracy rate is high, the percentage share of females in total agricultural labourers is also high (see Chart A3 in Annexure I). However, there are few states, high female illiteracy rate is accompanied by low share of female agricultural labourers, primarily because women are engaged in other household based paid activities or other commercial activities, particularly in Rajasthan and northeastern states. District level analysis also shows that the correlation coefficients among the number of illiterates, SC and ST population and the number of agricultural labourers are extremely high, positive and significant (see Table 5). A correlation coefficient of (significant at 0.01 level) supports the fact that irrespective of the social characteristics, low economic status of the households (agricultural labourers as a proxy variable) contributes to high illiteracy rate. This finding is further supported by the findings of the NSS, 55 th round that the level of illiteracy and the Monthly Per Capita Consumer Expenditure (MPCE 29 ) of households are inversely related to each other. Table 5: Correlations among illiterates, SC and ST population, and agricultural labour in India, 2001 (based on district level records, N=591) Number of illiterates (persons) 2001 SC population (persons) 2001 ST population (persons) 2001 Estimated number of agricultural labourers 01 Number of illiterates (persons) 2001 SC population (persons) 2001 ST population (persons) ** 0.142** 0.750** * 0.524** ** Estimated number of agricultural labourers 01 ** Correlation is significant at the 0.01 level (2-tailed). * Correlation is significant at the 0.05 level (2-tailed) As per NSS, 55 th round, the educational attainment and economic status of households are directly related to each other. Illiteracy rate is relatively high among members of households having low MPCE, both in rural and urban areas (se Charts 17 and 18). Compared to urban areas, the literacy rate increases relatively at slower rate with the increase in the MPCE of rural households. On the other hand, the illiteracy rate deciles very sharply with the increase in the MPCE of the urban households. Compared to rural areas, the percentage share of secondary school graduates and above increases at a faster rate with the increased MPCE of the urban households. In other words, MPCE as a variable directly explains the economic characteristics of the household, and now, it is 29 MPCE is defined in NSS, 55 th round as the per capital consumer expenditure in the last 30 days of the survey. MPCE = (Household s last 30 days total consumer expenditure / Household size). In the NSS, 55 th round, the MPCE classes have been assigned to households based on the data with reference period of 365 days for items of education, medical expenses (institutional, clothing, footwear, and durable goods and of last 30 days for the rest of the items. NSSO, Report No. 473, p. 11,
23 evident that poverty is the most important factor explaining the low literacy level of rural households. Besides, cultural factors also contribute to the low literacy status of households, particularly in the Hindi heartland on India. It is also argued that, in this region of the country mainly covering Uttar Pradesh, Bihar, Rajasthan and Madhya Pradesh, much weaker process of emergence of sub-nationalism and a virtual failure to give rise to a middle class, which in most other parts of the country have spearheaded the social reforms, have created a value system perhaps that does not give adequate recognition to education as a critical individual endowment. 30 Chart 17: Per 1000 distribution of 7+ population by educational level and MPEC class in rural India, Per 1000 Distribution of Persons or less and above MPCE Class (in Rs.) Illiterate Litearate Literate and Below Primary Primary Middle Secondary Higher Secondary Graduate and Above Source: Table A1 in Annexure I. Chart18 : Per 1000 distribution of 7+ age group population by level of education and MPCE class in urban India, Per 1000 Distribution of Persons or less or above MPCE Class (in Rs.) Source: Table A2 in Annexure I. Illiterate Litearate Literate and Below Primary Primary Middle Secondary Higher Secondary Graduate and Above V. Concluding Remarks The last two decades have shown enormous improvement in the literacy scene in the country as reflected by the average literacy figures. Yet, the country has more than For a detailed discussion, see Gupta, Shaibal,
24 million illiterates (7+ age group). Where are they and who are they? Though illiteracy still remains to be wiped out in every state, the burden in terms of numbers seems to be carried by a few states, namely, Uttar Pradesh, Bihar, Andhra Pradesh, West Bengal, Maharashtra, Rajasthan and Madhya Pradesh. Not surprisingly, analysis shows that the gender disparity is also higher in these states. A positive feature is that some of these states like Madhya Pradesh and Andhra Pradesh have recorded very substantial increase in female literacy between 1991 and 2001 indicating the possibility of reducing gender disparity fairly quickly, if the trend continues. Though most of the so-called educationally backward states have contributed positively towards the decline in the number of illiterates in the country, Bihar remains a classic case of underdevelopment, where slow progress in literacy and high growth of population have made a huge addition to the pool of illiterates in the country. It is important to note that educational development is not uniformly poor in all these states. For instance, Maharashtra is among the leading states in overall status of primary education as well as literacy. This points to the existence of intra-state disparities that are as important as inter-state disparities. In this context it is significant to note that in 20% districts, the average literacy rate is below 50%. When female literacy is considered, more than 40% districts are found to show less than 50% literacy rate. Around 65% of illiterates are found concentrated in 7 states, and 67 districts across 9 major states have million plus illiterates which together account for around 30% of the illiterates in In other words, it is these states and districts, which need special efforts for reducing illiteracy, whether through direct adult literacy programmes or through intensified programmes of primary education. Examining the changing age profile of literates reveals that the literacy rate has increased steadily since 1961, in all age groups. In fact, the trajectory of change clearly indicates that the increase has come essentially due to increased primary school participation. Further, what is alarming is that an estimated million children in the age group were illiterates. Youth illiteracy (age group 15-29) appeared to be quite high with an estimated number of around 79 million illiterates. Analysis of the NSS, 55 th round data shows that the literacy rates of socio-economically disadvantaged groups such as the Scheduled castes and Scheduled Tribes continue to be very low, particularly in the educationally backward states in the Hindi heartland and Andhra Pradesh and West Bengal. More revealing is the fact that the illiteracy rates of casual and agricultural labourers are relatively very high in these states. Who are illiterates is a difficult proposition to examine, as many factors including their location in different states matter significantly. Illiterates are found across all demographic, socio-economic and age groups, showing that inefficiency in primary education continue to be a major factor for continuation of illiteracy. Illiterates are relatively more in rural areas because of obvious reasons and females are substantially higher with a differential of 24% found in An overarching observation is that irrespective of location, gender and religion, poverty continues to be the most important determining factor. Taking concentration of agricultural labourers as a proxy for poverty levels, it was found that presence of illiterates and agricultural labourers particularity among female population goes hand in hand in most of the states. As per NSS, 55 th round, the illiteracy level and the Monthly Per Capita Consumer Expenditure (MPCE) and the illiteracy rate are inversely related to each other, both in rural and urban areas, thereby further supporting our argument that poverty is one of the critical factors determining literacy level of households in India. 24
25 The implication is clear. While progress in primary education accounts for overall progress in literacy rates, its reach and coverage continues to be inadequate with respect to socially and economically disadvantaged population. This may not be a new observation. But it is significant for identifying the districts and groups that should become the focus of intensified intervention in order to make faster progress in reducing illiteracy levels in the country References Basu, Kaushhik, Foster James E., and Subramanian, S. (2000), Isolated and Proximate Illiteracy and Why These Concepts Matter in Measuring Literacy and Designing Education Programmes. Working Paper No. 00-W02, Vanderbilt University, Nashville. Census of India (2001), Provisional Population Totals, Series 1), India, Paper 1, Web edition, New Delhi. Census of India (2001), Report and Tables on Age, Series 1, Volume 1, New Delhi. Drez, Jean and Sen, Amartya (1995), India: Economic Development and Social Opportunity. Oxford University Press, Delhi. Gupta, Shaibal (2000), Status of Literacy in India. Asian Development research Institute, Paper presented at the Summer Literacy Training Programme (SLTP), 2000, International literacy Institute, University of Philadelphia, July 5-28, International Institute for Population Sciences (2000), National Family Health Survey, , India, Mumbai. Ministry of Human Resource Development (2001), Selected Educational Statistics, and Government of India, New Delhi. National Sample Survey Organisation (1998), Attending an Educational Institution in India: Its Level, Nature and Cost, NSS 52 nd Round ( ). Ministry of Statistics and Programme Implementation, GOI, New Delhi. National Sample Survey Organisation (2001), Literacy and Level of Education India, NSS, 55 th Round (July-1999-June 2000). Report No. 473 (55/1.0/11), Ministry of Statistics and Programme Implementation, GOI, New Delhi. National Literacy Mission (1994), Evaluation of Literacy Campaigns in India: Report of the Expert Group. NLM, Ministry of Human Resource Development, GOI, New Delhi. Rao, I.V. Subba (2002), Literacy Assessment Practices (LAP) in Selected Developing Countries: India Case Study. Discussion Document prepared for ILI/UNESCO; LAP 2 nd Experts Meeting, UNESCO, Paris, 7-8 March Srivastava, ABL (2002), Some Significant Features of Literacy Data of the 2001 Census and Projection of Literacy Rate for the Population of age group 15+. Ed. CIL's TSG DPEP, New Delhi, India. UNDP (2004), Human Development Report, New York: Oxford University Press. 25
26 Annexure I Table A1: Per 1000 distribution of persons aged 7 and above by level of education and PMCE class in rural India in MPCE Class (In Rs.) Illiterate Literate Literate and Below Primary Primary Middle Secondary Higher Secondary Graduate and Above 225 or less and above Source: NSS, 55 th Round, Literacy and Levels of Education in India, Report No. 473 (55/1.0/11), Table A2: Per 1000 distribution of persons aged 7 and above by level of education and PMCE class in urban India in MPCE Class (In Rs.) Illiterate Literate Literate and Below Primary Primary Middle Secondary Higher Secondary Graduate and Above 300 or less or above Source: Ibid. Table A3: Per 1000 distribution of persons aged 7 and above by household type and level of education in rural and urban India, Household Type Illiterate Literate Lit & Below primary Primary Middle Secondary Hr. Secondary All All Graduate & above R U R U R U R U R U R U R U R U SC ST OBC Others Not Recorded Note; R = Rural; U = Urban; SC = Scheduled caste; ST = Scheduled Tribe; OBC = Other Backward Class. Source: Ibid. 26
27 Table A4: State-wise percentage of literate persons (7+ age group) based on NSS 55 th Round ( ) and Census of India 2001, (rural+ urban) State/UT Male Female Person NSS 55 th Round Census 2001 NSS 55 th Round Census 2001 NSS 55 th Round Census 2001 Andhra Pradesh Arunachal Pradesh Assam Bihar Goa Gujarat Haryana Himachal Pradesh Jammu Kashmir and Karnataka Kerala Madhya Pradesh Maharashtra Manipur Meghalaya Mizoram Nagaland Orissa Punjab Rajasthan Sikkim Tamil Nadu Tripura Uttar Pradesh West Bengal Andaman & Nicobar Islands Chandigarh Dadra & Nagar Haveli Daman and Diu Delhi Lakshadweep Pondichery All India Source: Ibid. 27
28 Chart A1: Per 1000 distribution of persons aged 7 and above by level of education and household type in rural and urban India, Graduate and above (U) Graduate and above ( R) Hr. Secondary (U) Hr. Secondary ( R) Secondary (U) Seconday ( R) Middle (U) Level of Education Middlr ( R) Primary (U) Primary ( R) Lit & below primary (U) Lit & below primary ( R) Literate (U) Literate ( R) Illiterate ( U) Illiterate ( R) Per 1000 Distribution of Persons SC ST OBC Others Not Recorded Source: Table A3. 28
29 Table A5: State-wise number of illiterates in India, decadal decreases in illiterates and percentage contribution in decrease, S. No. State/UT Number of illiterates Decadal decrease in the number of illiterates Percentage change Contribution in the decrease Himachal Pradesh*** Punjab Chandigarh Uttaranchal Haryana Delhi Rajasthan Uttar Pradesh Bihar Sikkim Arunachal Pradesh Nagaland Manipur Mizoram Tripura Meghalaya Assam West Bengal Jharkhand Orissa Chhatisgarh Madhya Pradesh Gujarat**** Daman and Diu Dadra and Nagar Haveli Maharashtra Andhra Pradesh Karnataka Goa Lakshadweep Kerala Tamil Nadu Pondichery Andaman and Nicobar Islands All India* ** Notes: * For making the data comparable, the number of illiterates given in Column 4 against India excludes the figure for Jammu and Kashmir for 2001, as this data is not available for the state for 1991 Census, since Census could not be conducted due to disturbed condition. ** To make the data comparable, the number of illiterates shown in Column 3 against India for 1991 excludes the number of illiterates of entire Kachchh district, Morvi, Maliya- Miyana and Wankaner talukas of Rajkot district, Jodiya taluka of Jamnagar district of Gujarat state and entire Kinnaur district of Himachal Pradesh where population enumeration of Census of India 2001 could not be conducted due to natural calamity. *** To make the data comparable, the number of illiterates shown against Himachal Pradesh in Column 3 for 1991 census excludes the figure of illiterates of entire Kinaur district where census of India 2001 could not be conducted due to natural calamity. **** To make the data comparable, the number of illiterates shown against Gujarat in Column 3 for 1991 census excludes the figures of illiterates of entire Kachchh district, Morvi, Maliya- Miyana and Wankaner talukas of Rajkot district, Jodiya taluka of Jamnagar district where census of India 2001 could not be conducted due to natural calamity. Source: Census of India, 2001, State of Literacy (Chapter 7), Provisional Population Totals, Series 1, India, Paper 1 of
30 Chart A2: Contribution of states in the decrease of illiterates in India in 2001 Andaman and Nicobar Islands Pondichery Tamil nadu Kerala Lakshadweep Goa Karnataka Andhra Pradesh Maharashtra Dadra and Nagar Haveli Daman and Diu Gujarat Madhya Pradesh Chhatisgarh Orissa Jharkhand State/UT West Bengal Assam Meghalaya Tripura Mizoram Manipur Nagaland Arunachal Pradesh Sikkim Bihar Uttar Pradesh Rajasthan Delhi Haryana Uttaranchal Chandigarh Punjab Himachal Pradesh Percentage Source: Table A5. % Change in the number of illiterates between 1991 and 2001 Percentage contribution in the decrease in illiterates in India 30
31 Table A6: State-wise literacy rate by sex in India, 1991 and S.No. State/UT Literacy Rate, 2001 Census (%) Person Male Female Literacy rate 1991 Census (%) Change in Literacy Rate ( ) 1 Andaman & Nicobar Is.* Andhra Pradesh Arunachal Pradesh Assam Bihar Chandigargh* Chhatisgarh Dadra & Nagar Haveli* Daman & Diu* Delhi* Goa Gujarat Haryana Himachal Pradesh Jammu & Kashmir NA NA 16 Jharkhand Karnataka Kerala Lakshadweep * Madhya Pradesh Maharashtra Manipur Meghalaya Mizoram Nagaland Orissa Pondicherry* Punjab Rajasthan Sikkim Tamil Nadu Tripura Uttar Pradesh Uttaranchal West Bengal India Notes: 1. The population of India includes the estimated population of entire Kachchh district, Morvi, Maliya-Miyana and Wankaner talukas of Rajkot district, Jodiya taluka of Jamanagar district of Gujarat State and entire Kinnaur district of Himachal Pradesh where population enumeration of Census of India 2001 could not be conducted due to natural calamity. 2. Figures shown against Population in the age-group 0-6 and Literates do not include the figures of entire Kachchh district, Morvi, Maliya-Miyana and Wankaner talukas of Rajkot district, Jodiya taluka of Jamanagar district and entire Kinnaur district of Himachal Pradesh where population enumeration of Census of India 2001 could not be conducted due to natural calamity. 3. Figures shown against Himachal Pradesh have been arrived at after including the estimated figures of entire Kinnaur district of Himachal Pradesh where the population enumeration of Census of India 2001 could not be conducted due to natural calamity. Source: Provisional Population Totals: India. Census of India 2001, Paper 1 of
32
[For Admission Test to VI Class] Based on N.C.E.R.T. Pattern. By J. N. Sharma & T. S. Jain UPKAR PRAKASHAN, AGRA 2
![[For Admission Test to VI Class] Based on N.C.E.R.T. Pattern. By J. N. Sharma & T. S. Jain UPKAR PRAKASHAN, AGRA 2](/thumbs/71/65941921.jpg "[For Admission Test to VI Class] Based on N.C.E.R.T. Pattern. By J. N. Sharma & T. S. Jain UPKAR PRAKASHAN, AGRA 2") [For Admission Test to VI Class] Based on N.C.E.R.T. Pattern By J. N. Sharma & T. S. Jain 2015 UPKAR PRAKASHAN, AGRA 2 Publishers Dedicated to His Holiness Shri Nantin Maharaj Shyam Khet Nainital Hindi
[For Admission Test to VI Class] Based on N.C.E.R.T. Pattern By J. N. Sharma & T. S. Jain 2015 UPKAR PRAKASHAN, AGRA 2 Publishers Dedicated to His Holiness Shri Nantin Maharaj Shyam Khet Nainital Hindi
According to the Census of India, rural
 AAJEEVIKA-A FRESH LEASE OF LIFE FOR THE RURAL PEOPLE Dr. Mukesh Kumar Shrivastava According to the Census of India, rural population constitutes 68.84 percent of the total population of the country. Though,
NAVODAYA VIDYALAYA SAMITI PROSPECTUS FOR JAWAHAR NAVODAYA VIDYALAYA SELECTION TEST- 2014
 NAVODAYA VIDYALAYA SAMITI PROSPECTUS FOR JAWAHAR NAVODAYA VIDYALAYA SELECTION TEST- 2014 1. NAVODAYA VIDYALAYA SCHEME 1.1 Introduction In accordance with the National Policy of Education (1986) Government
NAVODAYA VIDYALAYA SAMITI PROSPECTUS FOR JAWAHAR NAVODAYA VIDYALAYA SELECTION TEST- 2016
 NAVODAYA VIDYALAYA SAMITI PROSPECTUS FOR JAWAHAR NAVODAYA VIDYALAYA SELECTION TEST- 2016 1. NAVODAYA VIDYALAYA SCHEME 1.1 Introduction In accordance with the National Policy of Education (1986) Government
NAVODAYA VIDYALAYA SAMITI PROSPECTUS FOR JAWAHAR NAVODAYA VIDYALAYA SELECTION TEST- 2018
 NAVODAYA VIDYALAYA SAMITI PROSPECTUS FOR JAWAHAR NAVODAYA VIDYALAYA SELECTION TEST- 2018 1. NAVODAYA VIDYALAYA SCHEME 1.1 Introduction In accordance with the National Policy of Education (1986) Government
NAVODAYA VIDYALAYA SAMITI PROSPECTUS FOR JAWAHAR NAVODAYA VIDYALAYA SELECTION TEST- 2015
 NAVODAYA VIDYALAYA SAMITI PROSPECTUS FOR JAWAHAR NAVODAYA VIDYALAYA SELECTION TEST- 2015 1. NAVODAYA VIDYALAYA SCHEME 1.1 Introduction In accordance with the National Policy of Education (1986) Government
NAVODAYA VIDYALAYA SAMITI PROSPECTUS FOR JAWAHAR NAVODAYA VIDYALAYA SELECTION TEST- 2015
 NAVODAYA VIDYALAYA SAMITI PROSPECTUS FOR JAWAHAR NAVODAYA VIDYALAYA SELECTION TEST- 2015 1. NAVODAYA VIDYALAYA SCHEME 1.1 Introduction In accordance with the National Policy of Education (1986) Government
JOIN INDIAN COAST GUARD
 1 JOIN INDIAN COAST GUARD (MINISTRY OF DEFENCE) AS NAVIK (DOMESTIC BRANCH) 10 th ENTRY - 01/2018 BATCH APPLICATION WILL BE ACCEPTED ONLINE FROM 16 TO 23 OCT 2017 1. Applications are invited from Indian
व रण क ए आ दन-पत र. Prospectus Cum Application Form. न दय व kऱय सम त. Navodaya Vidyalaya Samiti ਨਵ ਦ ਆ ਦਵਦ ਆਦ ਆ ਸਦ ਤ. Navodaya Vidyalaya Samiti
 व रण क ए आ दन-पत र ENGLISH / ह द / ਪ ਜ ਬ Prospectus Cum Application Form PROSPECTUS IS FREE OF COST न दय व kऱय सम त Navodaya Vidyalaya Samiti ਨਵ ਦ ਆ ਦਵਦ ਆਦ ਆ ਸਦ ਤ व रण क तन:श ल क Navodaya Vidyalaya Samiti
National rural Health mission Ministry of Health and Family Welfare government of India, new delhi
 National rural Health mission Ministry of Health and Family Welfare government of India, new delhi Update on the ASHA Programme July 2011 C ontents Introduction... 1 1. Findings of the Recent Evaluations...
JAWAHAR NAVODAYA VIDYALAYA, RAKH JAGANOO DISTT:UDHAMPUR (J&K)
") JAWAHAR NAVODAYA VIDYALAYA, RAKH JAGANOO DISTT:UDHAMPUR (J&K) ADMISSION NOTICE It is notified for all the concerned Students, Parents, ZEO s and CEO of District Udhampur that JNVST-2018 entrance Exam which
JAWAHAR NAVODAYA VIDYALAYA, RAKH JAGANOO DISTT:UDHAMPUR (J&K) ADMISSION NOTICE It is notified for all the concerned Students, Parents, ZEO s and CEO of District Udhampur that JNVST-2018 entrance Exam which
Literacy Level in Andhra Pradesh and Telangana States A Statistical Study
 The International Journal of Engineering and Science (IJES) Volume 6 Issue 6 Pages PP 70-77 2017 ISSN (e): 2319 1813 ISSN (p): 2319 1805 Literacy Level in Andhra Pradesh and Telangana States A Statistical
Kenya: Age distribution and school attendance of girls aged 9-13 years. UNESCO Institute for Statistics. 20 December 2012
 1. Introduction Kenya: Age distribution and school attendance of girls aged 9-13 years UNESCO Institute for Statistics 2 December 212 This document provides an overview of the pattern of school attendance
Educational Attainment
 A Demographic and Socio-Economic Profile of Allen County, Indiana based on the 2010 Census and the American Community Survey Educational Attainment A Review of Census Data Related to the Educational Attainment
Ref. No.YFI/ Dated:
 YOGA FEDERATION OF INDIA (REGD. UNDER THE SOCIETIES REGISTRATION ACT. XXI OF 1860 REGD. NO.1195 DATED 14.02.90) RECOGNIZED BY INDIAN OLYMPIC ASSOCIATION - OCTOBER, 1998 TO FEBRUARY, 2011 Affiliated to
BASIC EDUCATION IN GHANA IN THE POST-REFORM PERIOD
 BASIC EDUCATION IN GHANA IN THE POST-REFORM PERIOD By Abena D. Oduro Centre for Policy Analysis Accra November, 2000 Please do not Quote, Comments Welcome. ABSTRACT This paper reviews the first stage of
Rwanda. Out of School Children of the Population Ages Percent Out of School 10% Number Out of School 217,000
 Rwanda Out of School Children of the Population Ages 7-14 Number Out of School 217, Percent Out of School % Source: Demographic and Health Survey (DHS) 2 Comparison of Rates of Out of School Children Ages
Systematic Assessment and Monitoring leading to Improving Quality of Education
 Systematic Assessment and Monitoring leading to Improving Quality of Education Abstract This study was aimed at assessment of quality of teaching-learning process and impact of interventions on actual
The Comparative Study of Information & Communications Technology Strategies in education of India, Iran & Malaysia countries
 Australian Journal of Basic and Applied Sciences, 6(9): 310-317, 2012 ISSN 1991-8178 The Comparative Study of Information & Communications Technology Strategies in education of India, Iran & Malaysia countries
Accessing Higher Education in Developing Countries: panel data analysis from India, Peru and Vietnam
 Accessing Higher Education in Developing Countries: panel data analysis from India, Peru and Vietnam Alan Sanchez (GRADE) y Abhijeet Singh (UCL) 12 de Agosto, 2017 Introduction Higher education in developing
Guinea. Out of School Children of the Population Ages Percent Out of School 46% Number Out of School 842,000
 Guinea Out of School Children of the Population Ages 7-14 Number Out of School 842, Percent Out of School 46% Source: Demographic and Health Survey (DHS) 25 Comparison of Rates of Out of School Children
NATIONAL INSTITUTE OF HOMOEOPATHY
 (i) (ii) (iii) No.8-012/NIH/DAVP/2012 NATIONAL INSTITUTE OF HOMOEOPATHY (An Autonomous Organisation) Govt. of India Ministry of AYUSH GE Block, Sector-III, Salt Lake, Kolkata-700106 Website: www.nih.nic.in
EDUCATIONAL ATTAINMENT
 EDUCATIONAL ATTAINMENT By 2030, at least 60 percent of Texans ages 25 to 34 will have a postsecondary credential or degree. Target: Increase the percent of Texans ages 25 to 34 with a postsecondary credential.
Over-Age, Under-Age, and On-Time Students in Primary School, Congo, Dem. Rep.
 Primary School Net and Gross Attendance Rates, Congo, Dem. Rep. Less than two thirds of school age children in the Democratic Republic of the Congo attend primary school. Boys are not much more likely
Research Update. Educational Migration and Non-return in Northern Ireland May 2008
 Research Update Educational Migration and Non-return in Northern Ireland May 2008 The Equality Commission for Northern Ireland (hereafter the Commission ) in 2007 contracted the Employment Research Institute
Iowa School District Profiles. Le Mars
 Iowa School District Profiles Overview This profile describes enrollment trends, student performance, income levels, population, and other characteristics of the public school district. The report utilizes
U VA THE CHANGING FACE OF UVA STUDENTS: SSESSMENT. About The Study
 About The Study U VA SSESSMENT In 6, the University of Virginia Office of Institutional Assessment and Studies undertook a study to describe how first-year students have changed over the past four decades.
Australia s tertiary education sector
 Australia s tertiary education sector TOM KARMEL NHI NGUYEN NATIONAL CENTRE FOR VOCATIONAL EDUCATION RESEARCH Paper presented to the Centre for the Economics of Education and Training 7 th National Conference
Pragmatic Constraints affecting the Teacher Efficacy in Ethiopia - An Analytical Comparison with India
 Pragmatic Constraints, Affecting the Teacher Surapaneni B. & Sisay S. 81 REVIEW ARTICLE Pragmatic Constraints affecting the Teacher Efficacy in Ethiopia - An Analytical Comparison with India Surapaneni
Status of Women of Color in Science, Engineering, and Medicine
 Status of Women of Color in Science, Engineering, and Medicine The figures and tables below are based upon the latest publicly available data from AAMC, NSF, Department of Education and the US Census Bureau.
SASKATCHEWAN MINISTRY OF ADVANCED EDUCATION
 SASKATCHEWAN MINISTRY OF ADVANCED EDUCATION Report March 2017 Report compiled by Insightrix Research Inc. 1 3223 Millar Ave. Saskatoon, Saskatchewan T: 1-866-888-5640 F: 1-306-384-5655 Table of Contents
EDUCATIONAL ATTAINMENT
 EDUCATIONAL ATTAINMENT By 2030, at least 60 percent of Texans ages 25 to 34 will have a postsecondary credential or degree. Target: Increase the percent of Texans ages 25 to 34 with a postsecondary credential.
Educational system gaps in Romania. Roberta Mihaela Stanef *, Alina Magdalena Manole
 Available online at www.sciencedirect.com ScienceDirect Procedia - Social and Behavioral Scien ce s 93 ( 2013 ) 794 798 3rd World Conference on Learning, Teaching and Educational Leadership (WCLTA-2012)
Department: Basic Education REPUBLIC OF SOUTH AFRICA MACRO INDICATOR TRENDS IN SCHOOLING: SUMMARY REPORT 2011
 Department: Basic Education REPUBLIC OF SOUTH AFRICA MACRO INDICATOR TRENDS IN SCHOOLING: SUMMARY REPORT 2011 Published by the Department of Basic Education Sol Plaatje House 222 Struben Street Pretoria
ESIC Advt. No. 06/2017, dated WALK IN INTERVIEW ON
 EMPLOYEES STATE INSURANCE CORPORATION ESIC-PGIMSR & ESIC MEDICAL COLLEGE ESIC Hospital & ODC (EZ) Diamond Harbour Road, P.O. Joka, Kolkata - 700104 Tel No: (033) 24381382, Tel/Fax No: (033) 24381176 E-mail:
HCFC Phase-Out Management Plan Servicing Sector
 Implemented by HCFC Phase-Out Management Plan Servicing Sector Roundtable Meeting 5 th March 2014 Seite 1 Implemented by HCFC Phase-Out Management Plan Servicing Sector Roundtable Meeting 5 th March 2014
A STUDY ON AWARENESS ABOUT BUSINESS SCHOOLS AMONG RURAL GRADUATE STUDENTS WITH REFERENCE TO COIMBATORE REGION
 A STUDY ON AWARENESS ABOUT BUSINESS SCHOOLS AMONG RURAL GRADUATE STUDENTS WITH REFERENCE TO COIMBATORE REGION S.Karthick Research Scholar, Periyar University & Faculty Department of Management studies,
OPEN AND DISTANCE LEARNING (ODL) EDUCATION SYSTEM: PAST, PRESENT AND FUTURE A SYSTEMATIC STUDY OF AN ALTERNATIVE EDUCATION SYSTEM
 EDUCATION SYSTEM: PAST, PRESENT AND FUTURE A SYSTEMATIC STUDY OF AN ALTERNATIVE EDUCATION SYSTEM") Volume 3, No. 4, April 2012 Journal of Global Research in Computer Science REVIEW ARTICLE Available Online at www.jgrcs.info OPEN AND DISTANCE LEARNING (ODL) EDUCATION SYSTEM: PAST, PRESENT AND FUTURE
Volume 3, No. 4, April 2012 Journal of Global Research in Computer Science REVIEW ARTICLE Available Online at www.jgrcs.info OPEN AND DISTANCE LEARNING (ODL) EDUCATION SYSTEM: PAST, PRESENT AND FUTURE
Production of Cognitive and Life Skills in Public, Private, and NGO Schools in Pakistan
 The Pakistan Development Review 42 : 1 (Spring 2003) pp. 1 28 Production of Cognitive and Life Skills in Public, Private, and NGO Schools in Pakistan G. M. ARIF and NAJAM US SAQIB * The share of private
TRENDS IN. College Pricing
 2008 TRENDS IN College Pricing T R E N D S I N H I G H E R E D U C A T I O N S E R I E S T R E N D S I N H I G H E R E D U C A T I O N S E R I E S Highlights 2 Published Tuition and Fee and Room and Board
JAWAHAR NAVODAYA VIDYALAYA BHILLOWAL, POST OFFICE PREET NAGAR DISTT. AMRITSAR (PUNJAB)
") Email: jnvlopoke_asr2spl@yahoo.com JAWAHAR NAVODAYA VIDYALAYA BHILLOWAL, POST OFFICE PREET NAGAR DISTT. AMRITSAR (PUNJAB) (TO BE FILLED IN CAPITAL LETTERS) NAME OF CANDIDATE: FATHER S NAME: MOTHER S NAME:
Email: jnvlopoke_asr2spl@yahoo.com JAWAHAR NAVODAYA VIDYALAYA BHILLOWAL, POST OFFICE PREET NAGAR DISTT. AMRITSAR (PUNJAB) (TO BE FILLED IN CAPITAL LETTERS) NAME OF CANDIDATE: FATHER S NAME: MOTHER S NAME:
Sl. No. Name of the Post Pay Band & Grade Pay No. of Post(s) Category
 Category") National Institute of Open Schooling (An autonomous organization under the Deptt. of School Education & Literacy, MHRD Govt. of India) A-24-25, Institutional Area, Sector 62, NOIDA- 201309, Uttar Pradesh
National Institute of Open Schooling (An autonomous organization under the Deptt. of School Education & Literacy, MHRD Govt. of India) A-24-25, Institutional Area, Sector 62, NOIDA- 201309, Uttar Pradesh
(ALMOST?) BREAKING THE GLASS CEILING: OPEN MERIT ADMISSIONS IN MEDICAL EDUCATION IN PAKISTAN
 BREAKING THE GLASS CEILING: OPEN MERIT ADMISSIONS IN MEDICAL EDUCATION IN PAKISTAN") (ALMOST?) BREAKING THE GLASS CEILING: OPEN MERIT ADMISSIONS IN MEDICAL EDUCATION IN PAKISTAN Tahir Andrabi and Niharika Singh Oct 30, 2015 AALIMS, Princeton University 2 Motivation In Pakistan (and other
(ALMOST?) BREAKING THE GLASS CEILING: OPEN MERIT ADMISSIONS IN MEDICAL EDUCATION IN PAKISTAN Tahir Andrabi and Niharika Singh Oct 30, 2015 AALIMS, Princeton University 2 Motivation In Pakistan (and other
Navodaya Vidyalaya Samiti Noida
 Navodaya Vidyalaya Samiti Noida NOTICE Select list of students for admission to Class VI through JNVST-2017 has been released. The following activities may be taken up by the parents/guardians after selection
NCEO Technical Report 27
 Home About Publications Special Topics Presentations State Policies Accommodations Bibliography Teleconferences Tools Related Sites Interpreting Trends in the Performance of Special Education Students
Wisconsin 4 th Grade Reading Results on the 2015 National Assessment of Educational Progress (NAEP)
") Wisconsin 4 th Grade Reading Results on the 2015 National Assessment of Educational Progress (NAEP) Main takeaways from the 2015 NAEP 4 th grade reading exam: Wisconsin scores have been statistically flat
Wisconsin 4 th Grade Reading Results on the 2015 National Assessment of Educational Progress (NAEP) Main takeaways from the 2015 NAEP 4 th grade reading exam: Wisconsin scores have been statistically flat
Edexcel GCSE. Statistics 1389 Paper 1H. June Mark Scheme. Statistics Edexcel GCSE
 Edexcel GCSE Statistics 1389 Paper 1H June 2007 Mark Scheme Edexcel GCSE Statistics 1389 NOTES ON MARKING PRINCIPLES 1 Types of mark M marks: method marks A marks: accuracy marks B marks: unconditional
In reviewing progress since 2000, this regional
 United Nations Educational, Scientific and Cultural Organization EFA Global Monitoring Report 2 0 1 5 Regional overview: East Asia and the Pacific United Nations Educational, Scientific and Cultural Organization
Like much of the country, Detroit suffered significant job losses during the Great Recession.
 36 37 POPULATION TRENDS Economy ECONOMY Like much of the country, suffered significant job losses during the Great Recession. Since bottoming out in the first quarter of 2010, however, the city has seen
Graduate Division Annual Report Key Findings
 Graduate Division 2010 2011 Annual Report Key Findings Trends in Admissions and Enrollment 1 Size, selectivity, yield UCLA s graduate programs are increasingly attractive and selective. Between Fall 2001
STATUS OF OPAC AND WEB OPAC IN LAW UNIVERSITY LIBRARIES IN SOUTH INDIA
 CHAPTER - 5 STATUS OF OPAC AND WEB OPAC IN LAW UNIVERSITY LIBRARIES IN SOUTH INDIA 5.0. Introduction Library automation implies the application of computers and utilization of computer based products and
Guatemala: Eduque a la Niña: Girls' Scholarship
 Guatemala: Eduque a la Niña: Girls' Scholarship May 14, 1996 Xiaoyan Liang and Kari Marble Human Development Department, World Bank We thank Gabriela Núñez of the USAID Guatemala office, Paula Gubbins
Teacher Supply and Demand in the State of Wyoming
 Teacher Supply and Demand in the State of Wyoming Supply Demand Prepared by Robert Reichardt 2002 McREL To order copies of Teacher Supply and Demand in the State of Wyoming, contact McREL: Mid-continent
Principal vacancies and appointments
 Principal vacancies and appointments 2009 10 Sally Robertson New Zealand Council for Educational Research NEW ZEALAND COUNCIL FOR EDUCATIONAL RESEARCH TE RŪNANGA O AOTEAROA MŌ TE RANGAHAU I TE MĀTAURANGA
Shelters Elementary School
 Shelters Elementary School August 2, 24 Dear Parents and Community Members: We are pleased to present you with the (AER) which provides key information on the 23-24 educational progress for the Shelters
Creating Teachers Communities of Learning. Report on the Subject Teacher Forum Program IT for Change
 Creating Teachers Communities of Learning Report on the Subject Teacher Forum Program IT for Change Table of Contents 1 Background...3 2 Goals of the programme...3 2.1 Subject Matter Expertise...3 2.2
INFORMATION BOOKLET. Refer RUHS website (www.ruhsraj.org) for updated and relevant information.
 for updated and relevant information.") RAJASTHAN UNIVERSITY OF HEALTH SCIENCES Kumbha Marg, Sector-18, Pratap Nagar, Tonk Road, Jaipur -302033 Phone: 0141-2795527, 2795550; Fax: 0141-2795550 Website: www.ruhsraj.org RAJASTHAN CENTRALIZED ADMISSIONS
RAJASTHAN UNIVERSITY OF HEALTH SCIENCES Kumbha Marg, Sector-18, Pratap Nagar, Tonk Road, Jaipur -302033 Phone: 0141-2795527, 2795550; Fax: 0141-2795550 Website: www.ruhsraj.org RAJASTHAN CENTRALIZED ADMISSIONS
The number of involuntary part-time workers,
 University of New Hampshire Carsey School of Public Policy CARSEY RESEARCH National Issue Brief #116 Spring 2017 Involuntary Part-Time Employment A Slow and Uneven Economic Recovery Rebecca Glauber The
Dakar Framework for Action. Education for All: Meeting our Collective Commitments. World Education Forum Dakar, Senegal, April 2000
 Dakar Framework for Action Education for All: Meeting our Collective Commitments Text adopted by the World Education Forum Dakar, Senegal, 26-28 April 2000 Dakar Framework for Action Education for All:
MEASURING GENDER EQUALITY IN EDUCATION: LESSONS FROM 43 COUNTRIES
 GIRL Center Research Brief No. 2 October 2017 MEASURING GENDER EQUALITY IN EDUCATION: LESSONS FROM 43 COUNTRIES STEPHANIE PSAKI, KATHARINE MCCARTHY, AND BARBARA S. MENSCH The Girl Innovation, Research,
EXECUTIVE SUMMARY. TIMSS 1999 International Science Report
 EXECUTIVE SUMMARY TIMSS 1999 International Science Report S S Executive Summary In 1999, the Third International Mathematics and Science Study (timss) was replicated at the eighth grade. Involving 41 countries
Tamil Nadu RURAL. School enrollment and out of school children. Young children in pre-school and school
 ANALYSS BASED ON DATA FROM HOUSEHOLDS. 29 OUT OF 29 DSTRCTS School enrollment and out of school children Table 1: % Children in different types of schools Chart 1: Trends over time % Children out of school
CHAPTER 4: REIMBURSEMENT STRATEGIES 24
 CHAPTER 4: REIMBURSEMENT STRATEGIES 24 INTRODUCTION Once state level policymakers have decided to implement and pay for CSR, one issue they face is simply how to calculate the reimbursements to districts
Report on Keo Kou Community Learning Centre
 Lao People s Democratic Republic Peace Independence Democratic Unity Prosperity Report on Keo Kou Community Learning Centre By: Mr. Bounkhong THOUMMAVONG Mr. Chaleun SOUVONG Contents I. Conception. 1 II.
Effective Pre-school and Primary Education 3-11 Project (EPPE 3-11)
") Effective Pre-school and Primary Education 3-11 Project (EPPE 3-11) A longitudinal study funded by the DfES (2003 2008) Exploring pupils views of primary school in Year 5 Address for correspondence: EPPSE
Effective Pre-school and Primary Education 3-11 Project (EPPE 3-11) A longitudinal study funded by the DfES (2003 2008) Exploring pupils views of primary school in Year 5 Address for correspondence: EPPSE
ILLINOIS DISTRICT REPORT CARD
 -6-525-2- HAZEL CREST SD 52-5 HAZEL CREST SD 52-5 HAZEL CREST, ILLINOIS and federal laws require public school districts to release report cards to the public each year. 2 7 ILLINOIS DISTRICT REPORT CARD
UPPER SECONDARY CURRICULUM OPTIONS AND LABOR MARKET PERFORMANCE: EVIDENCE FROM A GRADUATES SURVEY IN GREECE
 UPPER SECONDARY CURRICULUM OPTIONS AND LABOR MARKET PERFORMANCE: EVIDENCE FROM A GRADUATES SURVEY IN GREECE Stamatis Paleocrassas, Panagiotis Rousseas, Vassilia Vretakou Pedagogical Institute, Athens Abstract
ANALYSIS: LABOUR MARKET SUCCESS OF VOCATIONAL AND HIGHER EDUCATION GRADUATES
 ANALYSIS: LABOUR MARKET SUCCESS OF VOCATIONAL AND HIGHER EDUCATION GRADUATES Authors: Ingrid Jaggo, Mart Reinhold & Aune Valk, Analysis Department of the Ministry of Education and Research I KEY CONCLUSIONS
ILLINOIS DISTRICT REPORT CARD
 -6-525-2- Hazel Crest SD 52-5 Hazel Crest SD 52-5 Hazel Crest, ILLINOIS 2 8 ILLINOIS DISTRICT REPORT CARD and federal laws require public school districts to release report cards to the public each year.
Trends in College Pricing
 Trends in College Pricing 2009 T R E N D S I N H I G H E R E D U C A T I O N S E R I E S T R E N D S I N H I G H E R E D U C A T I O N S E R I E S Highlights Published Tuition and Fee and Room and Board
Computers on Wheels!!
 Computers on Wheels!! Computer Education Through Mobile Computer Vans for Rural Children. The Project: Vidya Pratishthan s Institute of Information Technology (VIIT), Baramati, Dist. Pune, Maharashtra,
An Empirical Analysis of the Effects of Mexican American Studies Participation on Student Achievement within Tucson Unified School District
 An Empirical Analysis of the Effects of Mexican American Studies Participation on Student Achievement within Tucson Unified School District Report Submitted June 20, 2012, to Willis D. Hawley, Ph.D., Special
Updated: December Educational Attainment
 Updated: Educational Attainment Among 25- to 29-year olds, the proportions who have attained a high school education, some college, or a bachelor s degree are all rising, according to longterm trends.
(Effective from )
") PADHO PARDESH - SCHEME OF INTEREST SUBSIDY ON EDUCATIONAL LOANS FOR OVERSEAS STUDIES FOR THE STUDENTS BELONGING TO THE MINORITY COMMUNITIES (Effective from 2013-14) GOVERNMENT OF INDIA MINISTRY OF MINORITY
PADHO PARDESH - SCHEME OF INTEREST SUBSIDY ON EDUCATIONAL LOANS FOR OVERSEAS STUDIES FOR THE STUDENTS BELONGING TO THE MINORITY COMMUNITIES (Effective from 2013-14) GOVERNMENT OF INDIA MINISTRY OF MINORITY
RAJASTHAN CENTRALIZED ADMISSIONS TO BACHELOR OF PHYSIOTHERAPY COURSE-2017 (RCA BPT-2017) INFORMATION BOOKLET
 INFORMATION BOOKLET") RAJASTHAN UNIVERSITY OF HEALTH SCIENCES Kumbha Marg, Sector-18, Pratap Nagar, Tonk Road, Jaipur -302033 Phone: 0141-2792644, 2795527 Website: www.ruhsraj.org RAJASTHAN CENTRALIZED ADMISSIONS TO BACHELOR
RAJASTHAN UNIVERSITY OF HEALTH SCIENCES Kumbha Marg, Sector-18, Pratap Nagar, Tonk Road, Jaipur -302033 Phone: 0141-2792644, 2795527 Website: www.ruhsraj.org RAJASTHAN CENTRALIZED ADMISSIONS TO BACHELOR
The Impact of Honors Programs on Undergraduate Academic Performance, Retention, and Graduation
 University of Nebraska - Lincoln DigitalCommons@University of Nebraska - Lincoln Journal of the National Collegiate Honors Council - -Online Archive National Collegiate Honors Council Fall 2004 The Impact
Bosnia and Herzegovina
 Country Profile Education in Bosnia and Herzegovina Context Impact of the economic crisis Despite several years of economic growth and stability, the economy in Bosnia and Herzegovina (BiH) slowed considerably
Himani Verma Educational Consultant with Learning Links Foundation
 Innovative Use of ICT for Educational and Community Development: A Case Study of two Educational Initiatives in SSA 1 Collaboration Schools in Tamil Nadu, India Himani Verma Educational Consultant with
Using Proportions to Solve Percentage Problems I
 RP7-1 Using Proportions to Solve Percentage Problems I Pages 46 48 Standards: 7.RP.A. Goals: Students will write equivalent statements for proportions by keeping track of the part and the whole, and by
San Ignacio-Santa Elena Municipal Profile
 San Ignacio-Santa Elena Municipal Profile General San Ignacio-Santa Elena is an inland municipality, comprising of the twin towns of San Ignacio and Santa Elena. The twin towns are linked by the historic
Leprosy case detection using schoolchildren
 Lepr Rev (2004) 75, 34±39 Leprosy case detection using schoolchildren G. NORMAN, G. A. JOSEPH, P. UDAYASURIYAN, P. SAMUEL & M. VENUGOPAL Schieffelin Leprosy Research and Training Center, Karigiri, Vellore
BENCHMARK TREND COMPARISON REPORT:
 National Survey of Student Engagement (NSSE) BENCHMARK TREND COMPARISON REPORT: CARNEGIE PEER INSTITUTIONS, 2003-2011 PREPARED BY: ANGEL A. SANCHEZ, DIRECTOR KELLI PAYNE, ADMINISTRATIVE ANALYST/ SPECIALIST
Evaluation of a College Freshman Diversity Research Program
 Evaluation of a College Freshman Diversity Research Program Sarah Garner University of Washington, Seattle, Washington 98195 Michael J. Tremmel University of Washington, Seattle, Washington 98195 Sarah
Listening and Speaking Skills of English Language of Adolescents of Government and Private Schools
 Listening and Speaking Skills of English Language of Adolescents of Government and Private Schools Dr. Amardeep Kaur Professor, Babe Ke College of Education, Mudki, Ferozepur, Punjab Abstract The present
Education in Armenia. Mher Melik-Baxshian I. INTRODUCTION
 Education in Armenia Mher Melik-Baxshian I. INTRODUCTION Education has always received priority in Armenia a country that has a history of literacy going back 1,600 years. From the very beginning the school
Government of Tamil Nadu TEACHERS RECRUITMENT BOARD 4 th Floor, EVK Sampath Maaligai, DPI Campus, College Road, Chennai
 Advertisement No. 04/ 2017 Dated: 16.06.2017 Government of Tamil Nadu TEACHERS RECRUITMENT BOARD 4 th Floor, EVK Sampath Maaligai, DPI Campus, College Road, Chennai -600 006. NOTIFICATION / ADVERTISEMENT
Impact of Digital India program on Public Library professionals. Manendra Kumar Singh
 Manendra Kumar Singh Research Scholar, Department of Library & Information Science, Banaras Hindu University, Varanasi, Uttar Pradesh 221005 Email: manebhu007@gmail.com Abstract Digital India program is
Annex 1: Millennium Development Goals Indicators
 Annex 1: Millennium Development Goals Indicators Millennium Development Goals (MDGs) Goals and Targets(Millennium Declaration) Indicators for monitoring progress GOAL 1: ERADICATE EXTREME POVERTY AND HUNGER
University-Based Induction in Low-Performing Schools: Outcomes for North Carolina New Teacher Support Program Participants in
 University-Based Induction in Low-Performing Schools: Outcomes for North Carolina New Teacher Support Program Participants in 2014-15 In this policy brief we assess levels of program participation and
Gender and socioeconomic differences in science achievement in Australia: From SISS to TIMSS
 Gender and socioeconomic differences in science achievement in Australia: From SISS to TIMSS, Australian Council for Educational Research, thomson@acer.edu.au Abstract Gender differences in science amongst
National Survey of Student Engagement (NSSE) Temple University 2016 Results
 Temple University 2016 Results") Introduction The National Survey of Student Engagement (NSSE) is administered by hundreds of colleges and universities every year (560 in 2016), and is designed to measure the amount of time and effort
Introduction The National Survey of Student Engagement (NSSE) is administered by hundreds of colleges and universities every year (560 in 2016), and is designed to measure the amount of time and effort
Executive Summary. Laurel County School District. Dr. Doug Bennett, Superintendent 718 N Main St London, KY
 Dr. Doug Bennett, Superintendent 718 N Main St London, KY 40741-1222 Document Generated On January 13, 2014 TABLE OF CONTENTS Introduction 1 Description of the School System 2 System's Purpose 4 Notable
RCPCH MMC Cohort Study (Part 4) March 2016
 March 2016") RCPCH MMC Cohort Study (Part 4) March 2016 Acknowledgements Dr Simon Clark, Officer for Workforce Planning, RCPCH Dr Carol Ewing, Vice President Health Services, RCPCH Dr Daniel Lumsden, Former Chair,
RCPCH MMC Cohort Study (Part 4) March 2016 Acknowledgements Dr Simon Clark, Officer for Workforce Planning, RCPCH Dr Carol Ewing, Vice President Health Services, RCPCH Dr Daniel Lumsden, Former Chair,
Financing Education In Minnesota
 Financing Education In Minnesota 2016-2017 Created with Tagul.com A Publication of the Minnesota House of Representatives Fiscal Analysis Department August 2016 Financing Education in Minnesota 2016-17
Moving the Needle: Creating Better Career Opportunities and Workforce Readiness. Austin ISD Progress Report
 Moving the Needle: Creating Better Career Opportunities and Workforce Readiness Austin ISD Progress Report 2013 A Letter to the Community Central Texas Job Openings More than 150 people move to the Austin
A Study of Socio-Economic Status and Emotional Intelligence among Madrasa and Islamic School students towards Inclusive Development
 EUROPEAN ACADEMIC RESEARCH Vol. III, Issue 11/ February 2016 ISSN 2286-4822 www.euacademic.org Impact Factor: 3.4546 (UIF) DRJI Value: 5.9 (B+) A Study of Socio-Economic Status and Emotional Intelligence
Transportation Equity Analysis
 2015-16 Transportation Equity Analysis Each year the Seattle Public Schools updates the Transportation Service Standards and bus walk zone boundaries for use in the upcoming school year. For the 2014-15
Indian Institute of Ayurvedic Pharmaceutical Sciences [ISO (9001:2008) Certified College]
![Indian Institute of Ayurvedic Pharmaceutical Sciences [ISO (9001:2008) Certified College]](/thumbs/71/66215122.jpg "Indian Institute of Ayurvedic Pharmaceutical Sciences [ISO (9001:2008) Certified College]") Indian Institute of Ayurvedic Pharmaceutical Sciences [ISO (9001:2008) Certified College] Gujarat Ayurved University [NAAC Accreditation Grade A with CGPA 3.28] Frequently Asked Questions (FAQs) 1. How
Indian Institute of Ayurvedic Pharmaceutical Sciences [ISO (9001:2008) Certified College] Gujarat Ayurved University [NAAC Accreditation Grade A with CGPA 3.28] Frequently Asked Questions (FAQs) 1. How
Western Australia s General Practice Workforce Analysis Update
 Western Australia s General Practice Workforce Analysis Update NOVEMBER 2015 PUBLISHED MAY 2016 Rural Health West This work is copyright. Apart from any use as permitted under the Copyright Act 1968, no
2/3 9.8% 38% $0.78. The Status of Women in Missouri: 2016 ARE WOMEN 51% 22% A Comprehensive Report of Leading Indicators and Findings.
 A Missouri WOMAN WORKING FULL-TIME EARNS ONLY $0.78 FOR EACH DOLLAR A MAN EARNS 2/3 OF Missouri SENIORS LIVING IN POVERTY ARE WOMEN 9.8% The Status of Women in Missouri: 2016 A Comprehensive Report of