Relationships Between Level of Implementation of a Multi-Tiered System of Supports (MTSS), Educator Variables, and Student Growth
|
|
|
- Dwain Henderson
- 6 years ago
- Views:
Transcription


1 University of South Florida Scholar Commons Graduate Theses and Dissertations Graduate School Relationships Between Level of Implementation of a Multi-Tiered System of Supports (MTSS), Educator Variables, and Student Growth Thomas Makowski University of South Florida, tmakowsk@mail.usf.edu Follow this and additional works at: Part of the Education Commons, and the Psychology Commons Scholar Commons Citation Makowski, Thomas, "Relationships Between Level of Implementation of a Multi-Tiered System of Supports (MTSS), Educator Variables, and Student Growth" (2016). Graduate Theses and Dissertations. This Thesis is brought to you for free and open access by the Graduate School at Scholar Commons. It has been accepted for inclusion in Graduate Theses and Dissertations by an authorized administrator of Scholar Commons. For more information, please contact scholarcommons@usf.edu.
2 Relationships Between Level of Implementation of a Multi-Tiered System of Supports (MTSS), Educator Variables, and Student Growth by Thomas J. Makowski A thesis submitted in partial fulfillment of the requirements for the degree of Education Specialist Department of Educational and Psychological Studies College of Education University of South Florida Major Professor: Jose Castillo, Ph.D. George Batsche, Ed.D. Jeffrey Kromrey, Ph.D. Date of Approval: June 06, 2016 Keywords: MTSS, multi-tiered system of supports, educator beliefs, educator perceptions of practices Copyright 2016, Thomas J. Makowski
3 Acknowledgments I d like to thank Dr. Batsche and Dr. Kromrey for the support and guidance they provided during the writing of this thesis. I would be remiss not to draw special attention to the endless conversations, infinite patience, and ongoing efforts Dr. Castillo provided in keeping me motivated and working on this project that, at times, seemed to present insurmountable challenges to me I appreciate that more than you know. Finally and most of all, I d like to thank my wife, Bobbie Jo, for shouldering the responsibility of doing everything to keep our family, finances, and home going for the years it took me to finish. You took on far more than I did but we made it. I love you very much!
4 Table of Contents List of Tables... iii Abstract... iv Chapter 1: Introduction...1 Overview of the MTSS Model of Service Delivery...3 Research on MTSS...5 MTSS Implementation...6 Educator Outcomes...6 Purpose of the Study...8 Research Questions...8 Significance of the Study...8 Hypotheses...9 Chapter 2: Literature Review...10 Legislative Influences on MTSS Implementation...10 Service Delivery in the MTSS Model...11 Student Outcomes in the Traditional Model of Service Delivery...15 Student Outcomes in the MTSS Model of Service Delivery...21 Implementation Integrity...31 Educator Beliefs...38 Perceptions of MTSS Practices...43 Conclusion...45 Chapter 3: Methods...46 Research Design...46 Florida s PS/RtI Project...46 Study Participants...48 Pilot Schools...48 Study Variables and Measures...49 Beliefs Survey...49 Florida Comprehensive Assessment Test (FCAT)...50 Perceptions of Practices Survey...51 Self-Assessment of Problem-Solving Implementation (SAPSI) Survey...52 Data Collection and Entry Procedures...53 Data Collection...53 Data Entry...54 Data Analyses...54 Preliminary Analyses...54 i
5 Inferential Analyses...55 Chapter 4: Results...57 Descriptive Statistics...57 Assumptions of Multiple Regressions...59 Hypothesis One...62 Hypothesis Two...63 Hypothesis Three...64 Chapter 5: Discussion...66 Relationship between MTSS Implementation Activities and Educator Beliefs...67 Relationship between MTSS Implementation and Perceptions of Practices...70 Relationship between MTSS Implementation and Student Growth...71 Implications for Research and Practice...72 Limitations...75 Conclusion...76 References...77 Appendices...89 Appendix A MTSS Model...90 Appendix B Problem-Solving Model...91 Appendix C Beliefs Survey...92 Appendix D Perceptions of Practices Survey...97 Appendix E Self-Assessment of Problem-Solving Implementation (SAPSI) Appendix F IRB Exemption Certificate ii
6 List of Tables Table 1: Pilot School Demographic Characteristics...48 Table 2: Descriptive Statistics for Study Variables...58 Table 3: Chronbach s Alpha Scores for Study Variables...59 Table 4: Pearson-Product-Moment Correlations...61 Table 5: Implementation Factors and Educator Beliefs Factors...63 Table 6: Implementation Factors and Perceptions of Practices Factors...64 Table 7: Implementation Factors and Student Growth...65 iii
7 Abstract This study examined the relationship between the level of implementation of the Multi- Tiered System of Supports (MTSS) approach to service delivery in schools and educators beliefs regarding MTSS, their perceptions of MTSS practices in their schools, and student growth. The study used data from the Florida Problem Solving/Response to Intervention Project. Thirty-four pilot schools in seven school districts across the state of Florida were provided intensive coaching, training, and technical assistance in implementing the MTSS service delivery model for three years. The current study focused on the final year of support. Data collected as part of the project s program evaluation model were used to examine the relationships between study variables. Multiple regressions were conducted to determine the relationship between the level of implementation of MTSS and the study s dependent variables. Findings indicated that both Infrastructure and Implementation predicted educator beliefs about Data-Based Decision Making (DBDM), while Implementation alone predicted educator beliefs about the Academic Ability and Performance of Students with Disabilities (SWD). Furthermore, the overall regression model predicted educator perceptions of practices applied to both Academic and Behavior Content; however, none of the individual predictors were significantly related to either dependent measure. No other study dependent variables were significantly predicted by the level of MTSS implementation. Implications for practice and research involve the need for larger scale studies of MTSS implementation and the importance of researchers and practitioners utilizing reliable and valid measures to monitor implementation efforts. iv
8 Chapter 1: Introduction During the 1950 s and 1960 s, poverty and discrepant educational opportunities became increasingly prevalent. Efforts to confront the problem of unequal educational opportunities provided the incentive for much of the subsequent school-effectiveness research (Madaus, Airasian, and Kellaghan, 1980). The intent of these studies and the ensuing reform movement, referred to as the school effectiveness movement, was to identify the within-school factors that affect students academic achievement (Marzano, 2001). Edmonds (1979a) identified five school-level variables that he believed to be highly correlated with student achievement: (a) strong leadership, (b) an expectation that all students can achieve, (c) a structured atmosphere that is conducive to learning, (d) a focus on basic skill acquisition, (e) and frequent student progress monitoring. More than three decades later, these variables are some of the fundamental building blocks of contemporary school reform efforts. Education has entered an era of increased accountability relative to the academic achievement of students. In recent years, Congress has authorized legislation that legally mandated accountability for student performance and schools are the entity responsible for these outcomes. According to the No Child Left Behind Act of 2001 (NCLB, 2002), the goal of our education system was to ensure that all children have a fair, equal, and significant opportunity to obtain a high quality education, and to reach proficiency on challenging state academic achievement standards (NCLB, 2002). NCLB (2002) required each state to develop a single, statewide accountability system that is designed to ensure that all schools make adequate yearly progress (AYP) towards meeting challenging academic goals. These outcomes had to be applied 1
9 to all students. Specifically, results had to be disaggregated by race and ethnicity, Economically Disadvantaged (ED) status, English Language Learner (ELL) status, and disability status to address the marked discrepancies in achievement between these demographic groups and their higher SES, Caucasian counterparts (Aud et al., 2010). Although the recent reauthorization of NCLB (2002) has provided more flexibility to states (see the Every Student Succeeds Act, 2016), states are still required to monitor student proficiency and examine equity in educational outcomes. Racial minority and low-ses students are disproportionately represented in special education (Donovan & Cross, 2002; President s Commission on Excellence in Special Education [PCESE], 2002) as well. According to the PCESE (2002), minorities were being served in special education at disproportionately higher rates than would be anticipated based on the population (e.g., Black students were being identified as having mental retardation and emotional disturbances at significantly higher rates than Caucasian students). The Commission also found a threefold increase in students identified as having a specific learning disability (SLD) since It continued by suggesting that of those students identified as SLD, approximately 80% were identified as such because they had not learned to read. The PCESE (2002) suggested that a service delivery model emphasizing early identification and intervention be utilized, one that is based upon a student s response to evidence-based interventions and progress monitoring of children with disabilities. The Individuals with Disabilities Education Improvement Act of 2004 (IDEIA, 2004) addressed the recommendations from the PCESE (2002). IDEIA (2004) and the regulations that followed require schools to use a process based on a student s response to intervention as part of a comprehensive evaluation to determine eligibility for special education services. Schools must 2
10 implement research-validated interventions for a reasonable period of time and monitor students progress frequently to determine student response. Furthermore, schools must rule out ineffective instruction and other environmental factors before determining that a student is eligible for services. Research suggests that this method is more reliable and valid for identifying students in need of special education services (Batsche et al., 2005). Moreover, researchers have suggested that approaches based on the provision of evidence-based instruction and intervention and using data to monitor student progress improves the outcomes of all students as required by the Every Student Succeeds Act (ESSA, 2016), not just students with disabilities (Batsche, et al., 2005; Jimerson, Burns, and VanDerHeyden, 2007; PCESE, 2002). The Multi-Tiered System of Supports (MTSS) model of service delivery incorporates the use of evidence-based instruction and intervention as well as data-based decision making to help ensure student problems are accurately identified and addressed. MTSS is a broad term that can be used to describe many of the multi-tiered, problem solving approaches to service delivery such as Response to Intervention (RtI) and Positive Behavior Supports (PBS). Overview of the MTSS Model of Service Delivery The MTSS model of service delivery is based on a set of core principles that address the above mentioned issues noted in both ESSA (2016) and IDEIA (2004). According to Batsche et al. (2005), MTSS is intended to improve the outcomes of all students by using assessment to evaluate student academic and behavioral performance and to identify students who are not progressing as expected, by intervening early when academic and/or behavioral difficulties are present and by differentiating the type and intensity of instruction to meet the specific learning needs of each individual student. Although different MTSS models exist, many models organize 3
11 instruction and intervention into three tiers (Batsche et al., 2005; Burns & VanDerHeyden, 2006; Fletcher & Vaughn, 2009). Tier 1 in a MTSS model is defined by the curriculum and instruction typically provided to all students and universal screenings administered regularly (typically three times each year) to evaluate Tier 1 instruction and to identify students at-risk for failure. Approximately 80% of all students are expected to achieve proficiency by receiving only Tier 1 instruction. Tier 2 interventions involve supplemental support (instruction in addition to the core curriculum) to approximately 5-15% of students. Tier 2 interventions are generally provided to small groups of students with similar skill or performance deficits. Progress is monitored more frequently for students receiving Tier 2 interventions. When Tier 1 and Tier 2 responses are not sufficient to address the student s academic and/or behavioral needs, Tier 3 interventions are initiated. Tier 3 interventions are more intensive, more individualized interventions that approximately 1-5% of a given student population will require to be successful. Student response to the intervention at Tier 3 is monitored and analyzed the most frequently. Tier 3 interventions may involve special education for students who demonstrate the need for special education services to meet performance expectations (Batsche et al., 2005; Gutkin & Curtis, 2009; Tilly, 2008). See Appendix A for a visual representation of the MTSS model. MTSS models use a problem-solving process to make data-based decisions regarding instruction and intervention matched to student need (Batsche, Curtis, Dorman, Castillo, & Porter, 2007). Although numerous problem-solving models exist, most models include some combination of the following steps: (a) problem identification (what do we want students to know and be able to do?), (b) problem analysis (why is it not happening?), (c) intervention design and implementation (what are we going to do about it?), and (d) response to intervention 4
12 (did it work?) (Bergan & Kratochwill, 1990; Gutkin & Curtis, 2009). Importantly, data are collected at each step of the problem-solving process to inform decisions that are made. See Appendix A for a visual representation of the MTSS model. Research on MTSS Numerous studies support the use of MTSS as an effective means of increasing student achievement (Marston, Muyskens, Lau, & Carter, 2003; Torgeson, 2009; Stulkowski, Joyce, & Storch, 2011). Other studies have demonstrated that MTSS implementation is associated with decreases in the identification rates of students with disabilities (Burns, Appleton, & Stehouwer, 2005; VanDerHeyden, Witt, & Gilbertson, 2007; Torgeson, 2009). Studies also have demonstrated the effectiveness of MTSS in reducing disproportionate identification of minority students for special education (Gravois & Rosenfield, 2006; Marston et al., 2003; VanDerHeyden et al., 2007). However, although existing research on MTSS and/or other problem solving approaches in schools appears to be promising, several questions or limitations have been identified (Hughes & Dexter, 2011). Assumptions regarding the generalizability of these findings across settings should be made with caution because some of the studies have been conducted by well-funded research centers (VanDerHeyden et al., 2007), thereby calling into question the integrity with which a lesser funded and/or trained school could implement MTSS. Additionally, small sample sizes (VanDerHeyden & Burns, 2005) and homogenous sample compositions (VanDerHeyden & Burns, 2005; VanDerHeyden et al., 2007) may be reasons for cautious interpretation. Furthermore, little research has been conducted that examines how educators are impacted by MTSS implementation. Thus, questions also remain about how implementation relates to student and educator outcomes. 5
13 MTSS Implementation. Questions regarding whether schools can implement MTSS with fidelity require researchers to find ways to monitor implementation activities. MTSS is a model for organizing and evaluating multiple tiers of instruction and intervention that not only requires implementing certain practices, but also efforts to engage stakeholders and to provide the supports necessary for them to implement the model with fidelity. Kurns and Tilly (2008) established a framework for schools to use when implementing MTSS that can be useful to researchers when examining how school implementation activities related to important student and educator outcomes. They identified the three stages involved in implementing MTSS at the building level. The first stage, building consensus among key stakeholders, includes committing the necessary resources to successful implementation (time, support, tools, etc.) as well as ensuring that administrators, teachers, and other stakeholders understand the need for and commit to implementation of MTSS. Infrastructure Building, the second stage, entails putting the necessary structures in place to support implementation. Examples of necessary structures include the development of a building level leadership team that is appropriately trained to guide the reform process and the identification and adoption of assessment systems and effective instructional practices. Finally, implementation involves carrying out the practices associated with the model and ongoing data collection to monitor implementation integrity. Although Kurns and Tilly s (2008) framework has been adopted by researchers evaluating MTSS implementation (e.g., Castillo, Hines, Batsche, & Curtis, 2011), little empirical information is available regarding the relationship between engaging in the activities and student and educator outcomes. Educator Outcomes. Research has examined the relationship between implementation of MTSS and student outcomes; however, little research has examined outcomes associated with educators. One important educator outcome that has recently been explored is educator beliefs. 6
14 Researchers suggest that teachers beliefs are related to the practices they are willing to implement (Fang, 1996; Pajares, 1992). Some researchers argue that beliefs should be changed before implementing new practices while other suggest that changes in practices that result in improved student outcomes change beliefs (Bol et al., 1998). Although the direction of the relationship between beliefs and practices is not clear, studies have demonstrated a relationship between educators beliefs and MTSS practices and outcomes. Castillo et al. (2015) reported a relationship between educators beliefs regarding MTSS and implementation of problem-solving procedures at the Tier 1 and 2 levels. Nunn, Jantz, and Butikofer (2009) noted that increases in teacher beliefs were positively correlated with perceptions of improvement of intervention outcomes, the level of satisfaction stemming from student performance, collaboration between team members, and data-based decision making. Educator perceptions of how thoroughly their school has implemented MTSS practices also should be examined. Efforts to measure activities designed to facilitate MTSS implementation such as those associated with the Kurns and Tilly (2008) framework often represent the perspectives of a few raters who are responsible for facilitating schoolwide implementation (see Castillo et al., 2010 for an example of this type of measure). As a result, these measures do not capture the perspectives of individual educators in the school regarding the extent to which MTSS practices are being implemented. Thus, research examining the extent to which activities designed to facilitate MTSS implementation relate to educators perceptions of practices would provide information on the extent to which implementation efforts may be perceived by educators across a building. 7
15 Purpose of the Study Little large-scale research exists that explores the degree to which MTSS implementation relates to educator and student outcomes. The purpose of the current study was three-fold. First, the study examined the relationship between MTSS implementation and educators beliefs about MTSS. Second, the relationship between MTSS implementation and educators perceptions of MTSS practices was investigated. Finally, the implementation of MTSS and its relationship with student outcomes was examined. Given that schools increasingly are implementing MTSS, research investigating how implementation impacts these important educational outcomes is clearly needed. Research Questions Specific research questions that were investigated are: 1) What is the relationship between the level of implementation of MTSS and educator beliefs relative to MTSS? 2) What is the relationship between the level of implementation of MTSS and staff perceptions of MTSS practices implemented in the schools? 3) What is the relationship between the level of implementation of MTSS and student growth in reading performance? Significance of the Study To date, little empirical research has examined the relationships between MTSS implementation fidelity and important educational outcomes. Although some research has investigated MTSS implementation and student growth, little systematic research has focused on educator outcomes such as educator beliefs and their perceptions of practices. Findings from the current study add to the MTSS literature base by identifying whether hypothesized relationships 8
16 discussed in the literature (see below) are evident when investigated empirically. Empirical information on the presence or absence of hypothesized relationships can inform methods used to research MTSS implementation and practices engaged in by educators. Such information is important to obtain given widespread implementation of MTSS across the nation. Hypotheses Regarding research question 1, it is hypothesized that higher levels of Consensus, Implementation, and Infrastructure (as measured by the SAPSI) will predict higher levels of educator beliefs regarding: Academic Ability and Performance of Students with Disabilities (SWD), Data-Based Decision Making (DBDM), and Functions of Core and Supplemental Instruction (FOI). Regarding research question 2, it is hypothesized that higher levels of Consensus, Implementation, and Infrastructure (as measured by the SAPSI) will predict higher levels of educator perceptions of MTSS practices in their schools applied to both Academic and Behavior content. Finally, regarding research question 3, it is hypothesized that higher levels of Consensus, Implementation, and Infrastructure (as measured by the SAPSI) will predict higher rates of Student Growth in reading. 9
17 Chapter 2: Literature Review This chapter begins by discussing legislative influences that exert pressure on educators to implement the MTSS model. Next, the literature discussing service delivery in the MTSS model is reviewed followed by research on student outcomes in both the traditional and MTSS models. Finally, literature that addresses issues related to implementing MTSS and outcomes associated with educators are discussed. Legislative Influences on MTSS Implementation The ESSA (2016) and IDEIA (2004) hold states, districts, and schools accountable for the academic achievement of the students for whom they are entrusted to educate. The precursor to ESSA (2016), NCLB (2002) required states to develop rigorous academic standards and to monitor whether schools are making Adequate Yearly Progress (AYP) towards all students achieving grade-level performance. NCLB (2002) dictated the use of statewide assessments in order to monitor student academic progress and that these results be disaggregated by English Language Learner (ELL) status, Socioeconomic Status (SES), race and ethnicity, and disability status (students with disabilities). NCLB (2002) also emphasized the use of scientifically validated instructional practices to meet the needs of all students, including disaggregated subgroups. Although ESSA (2016) provides more discretion to states than did NCLB (2002), ESSA (2016) continues requirements to monitor student performance and address equity in outcomes that were cornerstones of NCLB (2002). Supporting the tenets of ESSA (2016), IDEIA (2004) identified scientifically validated instructional practices as an essential component of successful service provision to students with 10
18 disabilities. IDEIA (2004) mandates the monitoring of a child s response to research based intervention as a preferred method of determining the existence of a specific learning disability (SLD). IDEIA (2004) highlights the use of a student s progress monitoring data when making educational decisions about how students respond to interventions. Traditionally, decisions regarding eligibility have been made using the discrepancy model (i.e., a discrepancy between a student s intelligence and achievement levels). The movement toward a process that examines students response to intervention was consistent with the recommendations made by the PCESE (2002). The first recommendation made by the PCESE (2002) was to shift the focus of educational efforts away from the process of eligibility determination and compliance with specific procedures toward a process more focused on the outcomes of students in special education. Furthermore, they recommended IDEIA (2004) honor its mission of serving all children s needs, not merely identifying those in need of special education services. The PCESE (2002) recognized the systemic need to provide all students with the ongoing supports they require in order to succeed rather than focusing on the identification of special education services as the end result. The PCESE (2002) also identified the traditional model of special education as being outdated, calling it a wait to fail model. It recommended the use of a prevention and intervention model that incorporates the vigorous use of research-validated interventions. Thus, recommendations made by the PCESE (2002) and provisions of ESSA (2016) and IDEIA (2004) emphasize the importance of practices consistent with MTSS and data-based decision making in order to improve student outcomes. Service Delivery in the MTSS Model Consistent with the aims of current federal policy, MTSS includes the use of data to efficiently allocate financial and human capital resources in an effort to improve learning for all 11
19 students, especially those who are struggling (Batsche et al, 2005, Florida Department of Education, 2008). The goal of an MTSS model of service delivery is for schools to allocate their resources in such a way as to ensure every child is successful. Students are screened to identify learning difficulties as early as possible. Evidence-based interventions are designed and implemented that will effectively address students specific learning needs, and progress monitoring data are used to evaluate if the intervention efforts were successful and to identify what type of modifications may be needed (Kansas State Department of Education, 2011, Batsche et al., 2005; Jimerson et al., 2007). Batsche et al. (2005) identified three essential components of MTSS: (1) multiple tiers of intervention service delivery, (2) a problem-solving method, and (3) an integrated data collection/assessment system to inform decisions at each tier. Batsche et al. described the MTSS system as a tiered service delivery model that integrates increasing levels of instructional intensity and support that is in direct proportion to individual student needs. As such, ongoing assessment of a student s performance is a central tenet of MTSS, as is frequent progress monitoring to evaluate instruction at each level or tier (Batsche et al., 2005; Jimerson et al., 2007; Gresham, 2007). Batsche, et al (2005) identified Tier 1 as the scientifically validated core curricular and instructional programming provided to all students, including differentiated instruction to address the broad range of student needs. Universal screening is utilized to formatively assess each student s levels of academic or behavioral proficiency. Universal screenings are typically conducted approximately three times per year with the resulting data being analyzed for two specific purposes. First, screening data provide insight into the effectiveness of the core curriculum and instruction. If approximately 80% or more of the students are making satisfactory 12
20 progress towards standards or benchmarks, core instruction is assumed to be effective in meeting the needs of a majority of students. Second, universal screening data help identify the students who would benefit from differentiated instruction at Tier 1 or supplemental instruction and/or interventions at a Tier 2 level. Tier 2 or supplemental instruction is provided to those students who have demonstrated an insufficient response to Tier 1 instruction. These services may involve interventions developed through problem solving or standard protocol interventions (Batsche et al., 2005). Interventions derived from a problem-solving process typically are developed through the collaborative efforts of multidisciplinary teams. A four-step problem-solving process is used to identify why students are not mastering prescribed skill sets and allows the team to develop interventions tailored to the specific needs of groups of small groups of students. A four-step problem solving process involves educators who (1) identify the problem, (2) analyze the problem (why is it happening?), (3) design and implement an intervention, and (4) measure the student response to the intervention(s) implemented. (Batsche et al., 2005; Bergan and Kratochwill, 1990) (See Appendix B for a visual representation of the four-step problem solving process). Standard protocol interventions, on the other hand, are generally scripted or structured interventions delivered to small groups or individuals that have demonstrated positive change in student achievement when implemented with students with similar knowledge and skill deficits (Batsche, et al., 2005). Regardless of whether problem solving based or standard protocol interventions are used, students rate of response to the interventions provided is assessed using frequently administered progress monitoring assessments to determine how well they are working. Educators consider the size of the gap that exists between students performance levels and standards or benchmarks 13
21 and the extent to which the gap is closing as a result of the intervention (Batsche et al., 2005). Students who demonstrated positive responses to intervention may continue to receive the intervention until it can be successfully withdrawn (i.e., the goal is for students to be successful with Tier 1 instruction alone). Those students who need additional supports to make gains receive more intensive Tier 3 interventions (Brown-Chidsey and Steege, 2005). Tier 3 services are highly individualized, intensive interventions designed to increase a student s rate of progress when core (Tier 1) and supplemental (Tier 2) intervention efforts are insufficient. Typically, students are referred to a problem-solving team that has responsibility for engaging in the problem-solving process to develop an intervention plan for the student. Following the implementation of the intervention plan, the problem-solving team analyzes progress-monitoring data and makes determinations about the sufficiency of supports being provided. Outcomes of this process can include the continuation of interventions as provided, modifications to interventions, or the consideration of eligibility for special education services. While MTSS is supported by research that praises the benefits of this problem solving approach to service delivery, concerns about using MTSS have been expressed. Sugai and Horner (2009) state that experimental support for using MTSS when making high-stakes decisions is limited, offering the following as reasons to be cautious: 1) The questionable psychometric features of the measures utilized, 2) standardizing assessment and measurement schedules and procedures, 3) documenting cut-scores and benchmarks for the determination of response to intervention, 4) intervention effectiveness, relevance, and efficiency, 5) consideration of cultural context, and 6) applicability across disability, age, and grade, etc. (p. 226). 14
22 Sugai and Horner (2009) qualify these limitations by suggesting that the implementation of the MTSS approach to problem solving would be supported more robustly if additional information/data were collected and given consideration when attempting to improve upon educational decision-making. Other scholars also have voiced concerns or the need for caution when considering MTSS. Fuchs & Fuchs (2006) and Gresham (2007) suggest that the MTSS approach includes the potential of false positive overrepresentation of students eligible for, or in need of, special education services when compared to those receiving support in a standard treatment protocol approach. Kratochwill, Clements, and Kalymon (2007) suggest that the need to define what exactly is to be screened and subsequently monitored may be a point of contention regarding the MTSS model. Convention indicates the academic needs of a student are the primary focus; however, the authors identified the need to consider the social-emotional domains as being inextricably interrelated as well. Finally, it has been suggested that a lack of existing data regarding MTSS effectiveness (defined as student progress) exists to warrant large-scale implementation (Batsche, Kavale, & Kovaleski, 2006; Sugai & Horner, 2009) While these criticisms exist and should be considered, decades of research has demonstrated that the traditional discrepancy model is ineffective. Additionally, research available on MTSS models has been associated with positive outcomes. Research on student outcomes in the traditional and MTSS models are described in the following sections. Student Outcomes in the Traditional Model of Service Delivery The National Center for Education Statistics (NCES) within the United States Department of Education is the primary federal entity responsible for collecting, analyzing, and reporting data related to education in the United States (Planty et al., 2009). The NCES produces an annual report entitled The Condition of Education in which data pertaining to student 15
23 performance, to demographic subgroup performance discrepancies, to enrollment, and to resource allocation are included. The Condition of Education 2014 (Kena et al., 2014) reported 2013 student outcome data as determined by the National Assessment of Educational Progress (NAEP). While reading scores were the same for fourth grade students and two points higher for eighth grade students when compared to 2011, (reported on a scale of 0 to 500), fourth grade student scores were five points higher than in 1992, and eighth grade student scores were eight points higher than in Additional analyses of the 2013 data indicated that achievement gaps between diverse student groups were evident. Black fourth grade students scored, on average, 26 points lower than White students on their reading scores, while Hispanic students scored, on average, 25 points lower than White students. Black eighth grade students scored, on average, 26 points lower than their White counterparts on the reading assessment and Hispanics scored, on average, 20 points lower than their White peers (Kena et al., 2014). These numbers represent a glaringly disproportionate level of performance between White students and various subgroups, especially for Hispanic and Black students. However, it is worth noting that the 2013 reading achievement gaps for both Black and Hispanic students, when compared to White students in both fourth and eighth grades, had decreased from 1990 to The gap remained relatively consistent from 2011 to Service provision to children with disabilities has been a particular concern of educators within the context of the traditional approach to service delivery (Heller, Holtzman, & Messick, 1982; PCESE, 2002). As of , nearly 6.69 million students between the ages of 3-21 were receiving special education services under IDEA (Planty et al., 2009). Of those receiving special education services, 39.7% were identified as having a specific learning disability (SLD), 16
24 which was the largest disability group (Planty et al., 2009). Significant achievement gaps exist between students with disabilities and those without. For example, according to The Condition of Education (Aud et al., 2013), 73% of non-disabled students read at or above the basic level, whereas only 31% of students with disabilities read at or above basic levels. Concerns about the effectiveness of special education services have been present for decades. Heller et al. (1982) disseminated findings from a national panel that examined the causes of disproportionality in the composition of classrooms of educable mentally retarded (EMR) students. The panel examined a variety of topics, such as the role IQ testing plays in special education, the appropriateness of integrating special education students into general education classrooms, the origin of and the appropriate assessment of mental retardation, and race-based discrimination in education. After analyzing 12 years-worth of data from elementary and secondary schools, they identified two predominant reasons for special education disproportionality. These two reasons included the questionable validity of the assessment procedures used when identifying students eligible for special education and the overall quality of instruction provided to special education students. A more recent study conducted by Donovan and Cross, (2002) utilized data on special education placement by demographic group provided by state departments of education. Composition indices, risk indices, and odds ratios for gender and race/ethnicity were calculated. Black students were generally more at risk for being identified as mentally retarded (Risk Indices=2.64), emotionally disturbed (RI=1.45), and learning disabled (RI=6.49). Furthermore, the odds ratios of Black students, when compared to their Caucasian counterparts, were discrepant for the mentally retarded (Odds Ratio =2.24), emotionally disturbed (OR=1.59), and learning-disabled (OR=1.08) categories. The study findings also suggest that the risk for Black 17
25 students being labeled mentally retarded, emotionally disturbed, and learning disabled increased over time. Relative to gender, disproportionality was reported for males, who comprised 58% of those being identified as mentally retarded, 78% of those identified as emotionally disturbed, and 68% of those identified as learning disabled. Donovan and Cross (2002) concluded that special education processes and procedures as well as the effectiveness of general education contribute to disproportionality in special education. Forness (2001) also examined the effectiveness of special education by performing a review of 24 meta-analyses that looked at the effectiveness of 20 special education interventions. While special class placement had an effect size of (the only intervention studied to have a negative effect size and an indication of potential harm to the student), most of the studies of special class placement were of students with mild mental retardation. Of those special class placement studies including students with learning disabilities, the mean effect size was.29. The meta-analyses of all special education interventions resulted in an effect size of.55, which would suggest a rather substantial benefit of special education and related services (p. 191). However, the interventions producing the largest effect size were those that emphasized effective and research-based instructional techniques. The seven interventions that comprised this group (mnemonic strategies, reading comprehension strategies, direct instruction, formative evaluation, computer-assisted instruction, peer tutoring, and word recognition strategies) generated an effect size of.84 (large). On the other hand, interventions with less of an evidence-base for improving the outcomes of students with disabilities such as perceptual training (effect size -.08) and diet restrictions (ES=.12) contributed significantly less to the quality of special education and related services. These results indicated that the greatest benefit to special education students was derived from interventions that emphasized education rather than those that attempted to 18
26 overcome the negative effects of learning via accommodation or the application of ancillary supports. Despite research indicating that special education processes and procedures are linked to disproportional representation of racial/ethnic minorities and males and that special education s effectiveness varies based on the population served and interventions used, the number of students receiving SLD services had increased by more than 300 percent from 1976 until the early 2000s (PCESE, 2002). The PCESE (2002) was commissioned by President George W. Bush to recommend reforms to the nation s special education system to address poor outcomes associated with special education. The panel for this report consisted of researchers and educators with expertise in special education. The panel gathered information from 13 public hearings and meetings throughout the nation as well as collected written comments. The information was derived from the thoughts and suggestions of more than 100 special education and educational finance experts, educational and medical researchers, individuals with disabilities, teachers, and parents. The Commission s report concluded that: 1. While the implementation of IDEA provides basic safeguards for children with disabilities, the current system often places process above outcomes. 2. The current system utilizes a wait to fail model instead of a service delivery model that would place increased value on prevention and intervention efforts. 3. Educators and policy makers think about special education and general education as two mutually exclusive systems, whereby special education should be viewed as a service provided by both general education and special education providers. 4. Parents do not have satisfactory options (and/or recourse) when their child fails to make acceptable progress while receiving special education services. 19
27 5. Educating students needs to be the primary focus of educator efforts. Compliance requirements have diverted much of this focus. 6. The current model of service delivery mistakenly identifies thousands of children, while others are not identified early enough or potentially at all. 7. Highly qualified teachers are crucial when providing special education services to students in need. 8. Special education services would benefit from additional research and the utilization of evidence-based interventions and services. 9. Academic achievement and social well-being need to displace compliance as the focus of educator efforts. (PCESE, 2002, pp. 7-8) The Commission generated numerous recommendations that addressed each of the nine findings listed above, but three broad recommendations to guide the shift in focus and effort of special education were presented: 1. Educator focus needs to be oriented toward results, while maintaining appropriate legal and procedural safeguards. 2. Move towards a model of early identification and effective intervention to prevent failure. 3. Children with disabilities must be viewed as general education students first and foremost. (PCESE, 2002, pp. 8-9). MTSS appears to be consistent with the recommendations of the PCESE (2002) findings regarding the implementation of early intervention and prevention efforts. Both the PCESE (2002) recommendations and the MTSS model identify the need for early intervention and prevention, as well as the need to employ research-based intervention supports. Furthermore, a 20
28 central tenet of the recommendations and of MTSS is the accurate measurement of student response to the interventions provided when making service decisions. Student Outcomes in the MTSS Model of Service Delivery Research has been done that focuses on the effectiveness of the MTSS model of service delivery. Telzrow, McNamara, and Hollinger (2000) examined the fidelity of implementation of a problem-solving initiative by multi-disciplinary teams (MDT s) and the correlation it had to student outcomes. MDTs were comprised of the school principal, school psychologist, and special education and general education teachers in 227 schools. Eight problem-solving components were assessed via completion of MDT problem-solving worksheets and the Evaluation Team Report (ETR). The problem-solving components and their correlation with student outcomes (in parentheses) were: Behavioral definition of the problem (.17), baseline data (.18), clearly identified goal (.24), hypothesized reason for the problem (.02), systematic intervention plan (.13), treatment integrity (.06), data indicating student response to intervention (.20), and comparison of student performance with baseline (.16). Six of the eight problemsolving components demonstrated modestly significant correlations with ratings of student outcomes. The two exceptions were treatment integrity and hypothesized reasons for the problem. The authors offered two hypotheses to explain these exceptions. One hypothesis was that these two components were found to be unrelated to student outcomes because of low-levels of implementation fidelity while the second hypothesis was that student changes during the intervention implementation process may be attributed to factors unrelated to these components of the problem-solving model (Telzrow et al., 2000). Rahn-Blakeslee et al. (2005) investigated the quality of reading interventions created in a problem-solving service delivery model, as well as the students (n=32) response to the 21
29 interventions. The students cases were managed by educational consultants and school-based psychologists from the Heartland Area Educational Agency 11. Use of a problem-solving model of service delivery resulted in high quality interventions being designed and implemented for all 32 students (as measured by the rating scheme identified in Telzrow et al. [2000]). To assess the sufficiency of interventions, the University of Texas Center for Reading and Language Arts/Texas Education Agency (UTCRLA/TEA2003) Tier 2 intervention criteria were utilized. Sixty-seven percent of the students received supplemental instruction five days per week, 70% of which occurred in a small group setting. Ninety-one percent of the students were progress monitored twice per month using CBM, however, only 24% of students received intervention for at least 10 weeks and only 36% received intervention for at least 30 minutes per session. Goal ambitiousness was compared to the Fuchs et al. (1993) growth standards. Seventy-five percent of the interventions had ambitious goals established. When evaluating meaningfulness of behavior change (growth) in students, 34% of the students graphed performances surpassed Fuchs et al. s (1993) standard for ambitious ; 25% exceeded those required to catch up a student to instructional placement standards; 91% exhibited performance levels following the intervention that were higher than those established at baseline, and 28% of the students were performing at instructional levels following the interventions. Finally, according to a measure utilized in the study (Student Outcome Ratings), 44% of the children made progress toward the personal goals established for them utilizing MTSS service delivery, with 28% meeting (or exceeding) their goals. When direct measures of student achievement were analyzed (and compared to ambitious growth standards), 25% - 34% of the students in the study made significant gains in growth. Marston, Muyskens, Lau, and Canter (2003) examined the student outcomes associated with a large-scale implementation of the MTSS model of service delivery in the Minneapolis 22
30 Public Schools. The study collected and analyzed data from the years (prior to problem solving implementation) through 2001 (following problem solving implementation). Their analysis revealed that the number of students receiving special education services when engaged in the problem solving approach to service deliver remained relatively constant (approximately 7%). The rates of eligibility determination decreased slightly for learning disabilities (approximately 6% to just under 3%) and for mild mental impairment (1% to approximately.5%). The study found that the implementation of MTSS in the Minneapolis School District also had a positive impact on the disproportionality of African-American students being found eligible for special education services. In 1997, 44% of the overall student population was African-American, yet 69% of those referred and 69% of those found eligible for ESE services were African-American. In 2001, however, following the full-scale implementation of MTSS in the school district, approximately 59% of students referred and 55% of the students found eligible for ESE services were African-American (45% of the population was African- American). Upon analysis of the data for Native-American students, similar positive trends were not realized, however, the number of Native-American students was much smaller. The authors acknowledge the lack of a control group as a limitation to the study, along with the complex nature of MTSS (and the difficulty generalizing one school-teams decision making across settings to another school). The author concluded that problem solving (a critical component of MTSS) enhances the assessment and decision-making processes involved in special education referral and placement and helps general education students by enriching and streamlining their learning. The disproportionate representation of minority students also appears to improve when engaging in MTSS problem solving. 23
31 Two studies (O Connor, Fulmer, & Harty 2003; O Conner, Harty, & Fulmer 2005) examined the longitudinal effectiveness of MTSS at two separate elementary schools (both agreed to four-year commitments for the study). One school was characterized as being from a low- to mid-income community, while students from the second school were from a higher SES community. A total of 400 students were represented from the two schools (kindergarten through third grade), 92 of whom received Tier 2 and/or Tier 3 intervention supports as required. Three levels of intervention were provided: Tier one consisted of a professional development program for the teachers, the content of which was aligned with the findings of the National Reading Panel. Tier 2 was supplemental, small group instruction provided three days per week to students with early literacy skill deficits in the areas of letter knowledge and phonemic awareness who were making poor progress in the general education setting. Tier 3 intensive small group instruction was provided in a 1:1 setting daily for 30 minutes per day. Results of this study indicated that students receiving Tier 2 and/or Tier 3 supports showed improvements in reading achievement in the areas of word identification (d = 0.4), word attack (d = 1.8), passage comprehensions (d = 1.4), and fluency (d = 1.4) when compared to those in the control group. Additionally, O Conner et al. (2005) reported that students with disabilities receiving supports in the MTSS model also showed improved scores in reading achievement. Finally, it is important to note that students who received tiered supports demonstrated a decrease in rates of special identification. Overall, before the implementation of MTSS, students in the control group were placed in special education at an average rate of 15%. After the fourth year of implementation of MTSS, however, students who received Tier 2 and Tier 3 supports were placed at a rate of just 8%. O Connor et al., (2005) suggest that MTSS supports appeared to aide students who were having difficulty developing their early literacy skills, however, the study 24
32 acknowledged the complicated (p. 537) nature of reading and the difficulty quantifying the requisite skills needed to become a successful reader as one passes through the grades. VanDerHeyden, Witt, and Gilbertson (2007) conducted a study that examined the effects of implementing an MTSS model relative to the evaluating and eventual identification of children for special education services. The study evaluated the use of the System to Enhance Educational Performance (STEEP) model of problem solving to evaluate the referral and identification processes, as well as the resultant student outcomes. In this study, STEEP utilized curriculum-based probes in reading and math to determine the students level of academic performance and identify areas of weakness, plan intervention support efforts, and evaluate the effectiveness of the interventions implemented. Teachers and students worked with trained consultants to learn how to implement the model as intended, as well as utilize prescribed decision rules at each of the four stages: (1) universal screening, (2) tier 1 interventions, (3) assessing the effect of incentives implemented to enhance performance, and (4) assessment of each student s response to research based interventions that were delivered within the primary classroom setting. The study was comprised of five schools, with their respective school psychologists being trained to collect the required intervention data. The total number of evaluations conducted, various pieces of demographic information for those students who were placed in special education programs, and the outcome data from each student s evaluation were collected to establish a baseline. Baseline data for two schools included in the study were collected in , one school in , and the two remaining schools during the school year. VanDerHeyden et al. (2007) determined that all participating schools experienced a reduction in the special education evaluations from baseline through the point of implementation 25
33 of STEEP. During baseline, between ten and thirty evaluations were completed. The next year, following the implementation of STEEP, between six and nine evaluations were completed. Of the students identified who would likely benefit from special education services, 41% of those evaluated at baseline qualified, while 71% qualified following implementation of STEEP the next year. One can infer from these findings that the STEEP program may be a more accurate identifier of students in need of special education services. In the school year following the introduction of STEEP ( ), there was a 6% reduction in the number of students being identified with a specific learning disability district-wide. Torgeson (2009) examined the effect of the implementation of an MTSS model of service delivery in Reading First schools in the state of Florida. The goal of the Reading First program was to prevent early reading difficulties by implementing a multi-tier model of service delivery in the schools, especially in those that are predominately comprised of minority and/or low SES students. A total of 318 schools were part of the first cohort in Between Year one and Year 3, these schools experienced an 81% decrease (from approximately 2% to 0.4%) in the number of kindergarten students identified as learning disabled. They also realized a 67% decrease in the number of students identified as learning disabled in first grade, a 53% decrease in second grade, and a 42% decrease in third grade. Moreover, those identified as having significant difficulties in reading (defined as scoring at or below the 20 th percentile on a formative assessment of a student s reading comprehension) was reduced by 40% for kindergarten students, and approximately 30% for students in first, second, and third grades. These findings indicate that implementing the MTSS model should lead to earlier identification of those in need of intervention services. Torgeson et al., (2009) provided a qualifying statement, 26
34 however, suggesting that this benefit will be realized as long as the interventions provided are adequately powerful to prevent the development of more significant reading difficulties. Mellard, Frey, and Woods (2012) conducted a study to examine the effects of MTSS on school-wide student reading achievement. A total of five schools were chosen to participate in the study after a lengthy review process of over 40 schools around the United States. This review process included each school responding to a set of survey and interview items, which were reviewed by two different judges and given a percentage score (0 to 100) based on how well they implemented each feature. These survey and interview items allowed the schools to document their progress on the implementation of different aspects of MTSS, which includes a tiered structure, progress monitoring, and decision-making rules. The five schools that were chosen met the criteria of receiving a score of 80% or higher from the jurors on the survey as well as a score of 75% or higher on the feature of identification of students with a learning disability. Finally, all five schools included were elementary schools, with a wide range of students enrolled in each, from 366 students in one school to 977 students in the school with the most students. Outcome measures used by Mellard et al. (2012) included the DIBELS, which were already in use by the schools who were participating. Additionally, some schools were using standardized reading tests, so they were included. The data analysis for this study included the calculation of effect sizes in order to help quantify the difference in the gains of one academic year between the students from the schools in the study and a normative sample. Results of their study indicated that one school began the year with below-level norms in reading skills, but were able to close this performance gap. The other four schools began the year with above-norm level skills. However, only three of these four schools continued to increase at a rate higher than was expected for that school year. The final school, which had above level skills at the beginning of 27
35 the year, did not continue to make the expected increases in reading skills over the school year. Although there was one school from this study that did not see the expected increases, results of this study do indicate a positive improvement in reading scores for many students. Burns, Appleton, and Stehouwer (2005) performed a meta-analytic review of research pertaining to four existing large-scale field-based MTSS models (Heartland Agency Model, Ohio s Intervention Based Assessment Model, Pennsylvania s Instruction Support Teams Model, and The Minneapolis Public School s Problem-Solving Model) as well as of additional MTSS service delivery models designed specifically for research purposes. The effectiveness of both research and field-based problem-solving service delivery models were examined. Positive results were realized with both the field-based and research based MTSS models. In the study, 24 unbiased estimates of effect (UEE) (Hedges, 1982), which are weighted estimates of effect using sample size and effect size from each of the studies being analyzed, were generated. UEEs of 1.42 for the field-based MTSS models and of 0.92 for those used in university-based research settings were found. Outcomes across studies were also measured, with student outcomes (including academic skill assessments, estimates of growth in skill acquisition, observations of time on-task, and task completion) measured at a median UEE of 1.02 (a large effect size), and systemic outcomes (including referrals to or placement in special education programs, time spent receiving special education services, and the number of students retained) being measured with a median UEE of Interestingly, when further disaggregating outcome data across settings, student outcomes were higher than systemic outcomes in research settings (UEE s of 1.14 and.47 respectively), whereas the opposite occurred in field settings with UEE s of.94 for student outcomes and 1.80 for systemic outcomes. The study findings indicate that both research- and field-based MTSS models resulted in positive effects, but when factoring in outcome data, did so 28
36 inconsistently between settings. Burns et al. (2005) also examined the rates of identification of students determined to be learning disabled (LD). Lerner (2002) estimated that approximately 5% of the student population experiences a learning disability, whereas the studies Burns et al. (2005) synthesized indicate that within the schools utilizing the MTSS model of service delivery, less than 2% of the student population was identified as LD. Based upon these findings, Burns, et al. (2005) suggest that the implementation of an MTSS model would serve to reduce the number of students receiving special education services. Additionally, Hughes and Dexter (2011) reviewed a total of 13 studies examining the effectiveness of MTSS on student academic or behavioral outcomes and systemic outcomes. In order to be included in their review, these studies must have utilized at least two tiers of the MTSS model and contain quantitative measures of student academic and behavioral outcomes, or systemic outcomes. All of the studies reviewed were conducted at the elementary school level, typically focusing on fourth grade or below. In terms of outcome measures, the studies focused on reading achievement, math achievement, behaviors related to academics (such as time on task), frequency of problematic behaviors (e.g., discipline referrals), general academic performance such as statewide achievement tests, and special education referrals and placement. Results of their review revealed that all of the studies showed improvements in academic achievement, which the authors attributed to MTSS. Additionally, most students who participated in this study were at-risk students. Thus, this finding provides support that an MTSS approach can improve academic performance for at-risk students. Moreover, they concluded that most of the studies provided support for early reading skill improvements at the elementary level. There was some evidence that an MTSS approach improved early math outcomes. However, only two studies examined the effect of MTSS on early math outcomes, providing 29
37 only minimal support. Finally, with respect to special education referrals and placements, it was noted that rates were fairly constant, with a few studies providing support for decreases. However, Hughes and Dexter (2011) mention that the lack of experimental research designs and the fact that many studies did not specifically identify non-responders or discuss eligibility requirements make it difficult to make definitive conclusions. Although the studies described above show promising results for the implementation of MTSS relative to student and systemic outcomes, there are some limitations that need to be considered. Many studies utilized relatively small sample sizes, limiting the generalizability of findings from one student or school setting to another (VanDerHeyden et al., 2007; Burns, et al., 2005; Rahn-Blakeslee et al., 2005). The lack of control groups in MTSS research has also been cited as a limitation (Hughes and Dexter, 2011; Marston et al., 2003; O Connor et al., 2003). True control groups/schools rarely exist in studies including schools/districts that have been implementing MTSS. While specific supports may not be provided to the controls (MTSS coaches, etc.), elements of MTSS (e.g., problem-solving) are usually in place, making it difficult to determine the impact of the MTSS influences on either systemic or student outcomes. Furthermore, much of the MTSS research conducted to date was done so by well-funded research entities (VanDerHeyden et al., 2007), likely resulting in a decrease in implementation fidelity when applied in the schools. Finally, Hughes and Dexter (2011) identified the lack of research on MTSS impact and student outcomes at the secondary level, citing that most, if not all, research has involved early reading and math skills. While problem solving may be effective when addressing early literacy and math skills, for example, how it will generalize to working with students in a secondary setting is largely unknown. 30
38 Implementation Integrity Despite the positive outcomes researchers have reported relative to MTSS implementation, questions regarding the relationship between the integrity of MTSS implementation and student outcomes remain. Implementation integrity refers to the degree to which a change initiative is implemented in the manner in which it was intended (Gresham, MacMillan, Boebe-Frankenberger, & Bocian, 2000). Noell and Gansle (2006) argue implementation integrity must be evaluated because educators cannot make decisions about a student s response to intervention without demonstrating that the intervention was indeed implemented with integrity. If implementation integrity is not measured, then it would be impossible to argue whether a student s failure to respond to the intervention was due to the fact that critical components of the intervention were not implemented with a high level of acceptability or if other factors contributed (e.g., the intervention was not the right match for the students needs, presence of a disability requiring specialized services). Focusing more on individual student-level services, Noell and Gansle (2006) identified treatment integrity as a critical component of MTSS. They continued by suggesting that because some of the services provided within an MTSS framework need to be implemented at the point of referral, if the intervention is not implemented with integrity, MTSS becomes little more than a process in which meetings are had, student data are collected, pre-determined decision rules are applied, and time passes purposelessly on until a decision is made to either declare a student eligible or ineligible for services (p. 37). Noell and Gansle, (2006) suggest that three questions need to be answered regarding treatment plan implementation or integrity of implementation. The first question to consider is how closely the intervention is being implemented as was intended. In order to answer this 31
39 question, one must consider two things. First, it is important to consider how the actual interventions are defined. Second, one must consider which specific aspects of the intervention are most critical in determining integrity. The second question to consider is how implementation integrity should be defined and subsequently measured (Noell & Gansle, 2006). When answering this question, one must determine the critical components of the intervention. More specifically, it is important to determine if one should focus on these factors from either a micro or macro perspective. A third possibility is that the factors may be examined at an intermediate level. That is, those critical components are clearly defined and specified; yet, they are defined more broadly in order to assess more feasibly. Research recommends that these critical aspects be defined at the intermediate level, as this yields better reliability in assessing implementation integrity (Noell et al., 2005). In terms of how educators should measure or assess critical components, Noell and Gansle (2006) recommend that observations and permanent products be used. The third question to be considered is how to ensure acceptable levels of implementation integrity (Noell & Gansle, 2006). In order to ensure acceptable implementation integrity, it is recommended that effective training and professional development be provided. Such effective training includes multiple steps such as theory, demonstration, opportunity to practice, and timely corrective feedback (Showers & Joyce, 1996). Several studies have examined implementation integrity of interventions or of MTSS. Noell, Duhon, Gatti, and Connell (2002) examined implementation integrity of a behavioral intervention for four elementary school teachers. The intervention was implemented with eight general education students who were referred for their disruptive and challenging behaviors in the classroom (i.e., talking and leaving their seat). A non-concurrent multiple baseline design 32
40 was utilized for this study. In order to measure implementation integrity, the researchers collected permanent products that were used as part of the intervention. These products included behavior-monitoring records, which measured the occurrence of the target behavior and whether the student earned the reward for meeting their goals. Additionally, these forms were divided into the number of periods that aligned with their classroom schedule. To determine implementation integrity, researchers calculated a percentage of steps correctly implemented each day (i.e., behavior recording and reward determination). The teachers implementation of the interventions varied in the beginning, but eventually became unstable and had a downward trend. As their implementation exhibited downward trends, meetings and consultations were scheduled in order to review their materials and determine how to better implement them. As the teachers implementation became more acceptable, these meetings and consultation sessions were faded. Results of Noell, Gresham, and Gansle s (2002) study indicated that the brief consultation meetings resulted in improved implementation integrity for one teacher. Some improvements were made for two of the other teachers, while no improvement was shown for the fourth teacher. However, when reviewing data was added to the meetings, implementation integrity increased and remained stable. Less stability in implementation integrity was exhibited as the meetings were faded, but still remained high. Additionally, implementation integrity for later referrals resulted in higher scores. These results indicate that implementation integrity varies by teachers, and that it is important to examine each factor that contributes to implementation integrity. A study by Noell et al. (2005) expanded on the previous study by further examining teachers implementation of prescribed treatment plans following consultation in child behavior 33
41 therapy. The intervention was implemented at six suburban elementary schools in a southeastern state, with 45 teachers and the 45 elementary students they referred for either academic and/or behavioral infractions. The schools were in low SES areas and the students in the schools were almost exclusively (96%) African-American. Following the referrals, one of three consultation strategies - (1) weekly Plan Evaluation Interview (PEI; a short follow-up meetings between the teacher and the consultant, (2) Commitment emphasis (CE; all weekly components plus a process of evaluating teacher willingness to implement the interventions), and (3) Performance feedback (PFB; meeting with teacher to review permanent products and graph both intervention implementation and student behavior data) - was implemented for a three week period. Results of this study indicate that feedback on the teachers performance (PFB) increased implementation integrity above and beyond the other two strategies. Additionally, Noell et al. (2005) examined student outcomes and the relationship to each consultation process. Results indicated that students performed best under the consultative process of providing performance feedback to teachers (PFB). These findings indicate that students benefitted most and saw greater gains in the condition in which teachers had the highest implementation integrity. In a study by Davis-Bianco (2010), a New Jersey school district was in the fourth year of MTSS implementation. In an effort to increase as well as measure treatment fidelity, the district implemented three supports; a tracking form, a reading coach, and video clips. With the intervention tracking form, teachers were asked to document the intervention attempted, the frequency of the intervention (number of days per week), the duration of the intervention (number of minutes per session), the intensity (represented either by an individual session or the number of students per group), and the students response to intervention. Additionally, teachers were asked to document any deviations from the original intervention plan. Reading coaches 34
42 were available to offer assistance each week to any teachers that were not implementing the intervention as planned, saw a lack of student progress, or were not recording the interventions implemented. Finally, videos were recorded of teachers as they implemented specific aspects of instruction during the pilot study year. These clips were distributed throughout the district at the end of each grading period in order to provide encouragement for additional tapings, as well as to reinforce their viewings. When reflecting upon the effort, they stated that the most challenging goal their school district encountered was the mandate to maintain and ensure fidelity of implementation of the MTSS service delivery model. Unfortunately, the author does not report the specific level of implementation fidelity. Much of the empirical literature examining implementation integrity has focused on interventions implemented with individual students. However, researchers investigating MTSS implementation have indicated a need to examine fidelity of MTSS implementation across tiers of service delivery. Potential ways to measure and review the implementation of MTSS practices include observations, permanent product reviews and self-report (Noell & Gansle, 2006; Roach, Lawton, & Elliott, 2014). Observations are often considered to be the best method in terms of accuracy (Noell & Gansle, 2006); however, there are some limitations to this method. One limitation includes observer bias in which those being observed are influenced by the presence of the observer to increase their level of implementation. Additionally, observations often require more resources (both time and personnel) in order to conduct (Cohen, Kincaid, & Childs, 2007). Permanent product reviews are, in general, much more efficient than are observations, relative to the time commitment required to collect the data (Castillo, et al. 2010). Permanent products can include student worksheets, MTSS data, or numerous other products that leave a physical paper trail for 35
43 review. Noell and Gansle (2006) identified permanent product reviews as being less reliable than observations, however, but more reliable than self-reports. In contrast to observations and permanent product reviews, self-report measures require far less resources and provide the ability to quantify the level of MTSS practices. Noell and Gansle (2006) identified the upward bias of self -report measures (the prominent perceptions assessment and measurement tool), suggesting they be interpreted with caution and supplemented with other measures. Noell and Gansle (2006) did provide a rationale for the selfreport method being a valid and often used method for collecting data when evaluating the perceptions of those involved in large-scale initiatives such as MTSS. They concluded that selfreport is often used, especially with large samples, because they are an efficient use of available resources when collecting data and may well provide unencumbered insight into one s perceptions of how well MTSS is being implemented without fear of reprisal (assuming anonymity is guaranteed). Although the authors note self-report data is often used due to its simplicity, they also mention that self-reports are often biased. Therefore, they recommend that self-reports not be used in isolation, but instead be combined with other strategies. Desimone s (2009) review of research, however, concluded that when educators self-report certain data, such as professional development and teaching behavior, a moderate to high correlation exists between these data and those generated by observation of their behavior by others. In other words, despite the need to interpret self-report data with caution, some evidence exists that supports the use of self-report measures to evaluate implementation integrity. Attempts to evaluate MTSS implementation integrity across tiers have been made by several large-scale initiatives across the country. Consistent among these is the use of multiple tools to assess implementation integrity. Florida s Problem Solving/Response to Intervention 36
44 project used the Tier I and Tier II Observation Checklist and the Tier I and Tier II Critical Components Checklist (both of which are integrity measures looking at the extent schools are implementing the central components of MTSS germane to Tier 1 and Tier 2 instruction), the Problem-Solving Team Meeting Checklists (assesses the degree to which the central components of the problem solving process are being implemented in the schools during sessions focused on the individual student s progress), and the Tier III Critical Components Checklist (measures the degree to which the central components of the problem solving process are being implemented in the schools relative to the Tier 3 instructional supports) (Castillo, et al., 2010). Florida also utilized the Self-Assessment of Problem Solving Implementation (SAPSI), which is a self-report progress monitoring tool completed by the schools School Based Leadership Team (SBLT) that was used to assess the extent to which schools were making progress towards full implementation of MTSS practices (Castillo, et al., 2010). Michigan s Integrated Behavior and Learning Support Initiative (MiBLSi) utilized various program quality and fidelity assessments to measure implementation integrity. Amongst other tools, Tier 1 fidelity was measured via the School-wide Evaluation Tool for Reading Self Assessment (SWETR-S). This tool assessed Michigan s implementation of their school wide Tier 1 reading program within their MTSS problem solving structure, whereas the Tier 1 behavioral fidelity was measured utilizing the School-wide Positive Behavioral Interventions and Supports (SWPBIS). At Tiers 2 and 3, MiBLSi used their Benchmarks for Advanced Tiers (BAT), which provided their SBLT s the opportunity to assess not only Tier 1 implementation, but also Tier 2 (targeted) and Tier 3 (intensive) behavior supports at the building/school level (Michigan s Integrated Behavior and Learning Support Initiative (MIBLSI). 37
45 Similarly, Illinois Alliance for School-based Problem-solving and Intervention Resources in Education (ASPIRE) utilized multiple tools to assess implementation integrity. The Fidelity of Implementation Checklist allowed for an external entities verification of implementation integrity of their problem solving processes at the school level, including reviews of the progress monitoring and trainings, as well as of the screening data collected. The Self-Assessment of Problem Solving Implementation (SAPSI) allowed Illinois to assess the degree to which implementation of problem solving is occurring at the building level (ASPIRE, I. 2007). While the tools used between states and programs vary, the need to measure implementation integrity is an element that remains consistent among them. Furthermore, all initiatives have incorporated at least one self-report measure in the evaluation of implementation integrity. Moreover, some reliability and validity information is available for the tools to support their use in measuring MTSS implementation integrity. Educator Beliefs While there are many elements of a change initiative in a school that can impact the degree to which it is implemented, educator beliefs about the initiative and commitment to implementation must be considered. Accurately and constructively defining teacher beliefs can, however, be a challenge (Pajares, 1992). Kagan (1992) broadly defined teacher belief as tacit, often unconsciously held assumptions about students, classroom, and the academic material to be taught (p. 65). Sparks (2002) noted the way an educators sense of efficacy (both collective and individual) and their mental model (p. 130) influence their practices in the schools. He suggested that it could serve as a conduit for change or limit the ability to adapt and change. He posited that the most powerful mental constraints occur when teachers claim only certain 38
46 students can achieve at a high level and that the ability to teach is a natural talent which cannot be enhanced through practice and/or further study. Sparks (2002) stated that among other things, the educator s beliefs about a student s ability to learn was a significant barrier to improvement, as is a sense of powerlessness and resignation (p. 130) experienced by many educators. He states that if educators believe they are powerless to effect change or make improvements, they will not make the effort to create and implement action plans. Fang (1996) reviewed a number of studies that explored the complex relationship between teacher beliefs and practices. The idea of there being inconsistencies between a teacher s beliefs and their classroom practices may not be an inconceivable notion. Fang reviewed a study by Duffy (1982) which suggests that while a teacher may attempt to provide instruction that aligns well with their theoretical convictions, the complexities of the life in the classroom and the instructional practices required to accommodate may well create an incongruency that is difficult to overcome. This demonstrates the premise that external contextual factors can strongly influence an educator s beliefs and impact the educational practices implemented in the classroom. In another study reviewed by Fang, Ashton (1990) presented the idea that educators have preconceptions about students and the subject taught to them as well as about their own responsibilities to the educational process, and that these wellentrenched beliefs strongly influence the practices implemented in school. Finally, Fang (1996) discussed the study by Richardson et al. (1991), in which they explored teacher beliefs and practices specific to reading instruction. He posited that an educator s beliefs are indeed directly related to the practices implemented inside the classroom. Teachers in this particular study who subscribed to the idea that early literacy skill development was a prerequisite to text comprehension usually applied a skill/word approach to instruction, whereas those who felt 39
47 whole language reading immersion was required to teach reading were more likely to implement a literacy structure approach to instruction. From his review, Fang (1996) concluded that beliefs and practices are incontrovertibly related, but that the relationship is not necessarily linear in nature. Kagan (1992) suggests that we lack an understanding of the processes that actually influence the changing of teacher beliefs. A study reviewed by Kagan, Herrmann and Duffy (1989) characterized teacher beliefs as being quite stable and rather slow to change. However, another article reviewed by Kagan, Martin (1989), suggested that teacher beliefs tend to reflect a consistency in approach to teaching that is evident across grade levels. Kagan (1992) posited that educator beliefs should not be inferred from their classroom behaviors since teachers develop and implement behavioral patterns for differing reasons. A study by Pajares (1992) concluded that the research community has had difficulty studying educator beliefs because of difficulty defining and conceptualizing beliefs, and the varied understandings or perceptions of beliefs and belief structures. This meta-analysis reviewed numerous studies, resulting in the following conclusions (or generalizations) about beliefs: 1) Beliefs form early and persevere 2) Belief systems are constructed of beliefs attained via cultural transmission 3) Belief systems are adaptive in that they assist individuals in defining and understanding themselves, as well as the world they live in 4) Knowledge and belief systems are interconnected 5) Belief structures screen, distort, and redefine cognition and information processing 6) Beliefs are central in interpreting knowledge and overseeing cognition 40
48 7) Beliefs are prioritized according to their relationship with other cognitions or beliefs 8) Educational belief structures must be interpreted in the context of their relationships to each other as well as to other beliefs 9) Some beliefs are more indisputable than others 10) The earlier a belief is introduced into a belief framework, the more entrenched it becomes. Recently acquired beliefs are more likely to change than long-held beliefs 11) Beliefs rarely change during adulthood. Individuals will hold onto beliefs that are predicated upon incorrect or incomplete information, even though scientifically validated explanations are provided 12) Beliefs aid in defining tasks and selecting the tools used to cognitively interpret, develop, and make decisions about these tasks 13) Beliefs greatly influence one s perception, but are often distinctly different from reality 14) One s beliefs greatly influence their own behavior 15) Beliefs are inferences 16) A student s belief structure relative to teaching is well developed by the time they get to college (pp ) Nunn and Jantz, (2009) identified a significant indicator of how educators perceive their own abilities to influence student learning outcomes in a problem solving/mtss setting as that of teacher efficacy, or the belief that they can positively influence or control student learning as a result of their own actions. In their study, Nunn et al. (2009) collected data from 429 K-12 administration, teachers, and support staff members from a western state who were trained in a year-long MTSS implementation program that included continued ongoing training over a period of four years. They identified teacher beliefs as potentially being influenced by the degree of 41
49 collaborative teacher involvement in the MTSS Teams at their schools or MTSS Involvement (RtI-INV) and the level of demonstrated expertise of the school-based MTSS Team relative to the implementation of MTSS practices in their schools (RtI-IMP). They utilized their previously created Teacher Efficacy Beliefs and Behaviors Scale (TEBBS) as the measure of teacher beliefs. The study provided the MTSS training throughout the academic school year for five days at a time, at six-week intervals. The School-Based Collaborative Team assignments were identified and follow-up consultations were executed to monitor implementation. Finally, the TEBBS was administered following the last day of training to all study participants, with an 88% rate of completion. A two-way analysis of variance was completed. Their results concluded that both MTSS implementation of practices and MTSS involvement were significantly associated with educator beliefs on two of the TEBBS scales Intervention Skills Efficacy (ISE) and Motivational Skills Efficacy (MSE), but not with External Control Efficacy (ECE). Nunn, Jantz, and Butikofer (2009) looked at the relationship between educator beliefs and their perceptions of response to intervention outcomes, utilizing the above mentioned study participants and procedures. The study findings indicate that increases in educator beliefs (teacher efficacy) were significantly related to satisfaction with results (.49), data-based decision making (.31), perceptions of improved outcomes of interventions (.15), and collaborative team processes (.39). While Nunn, Jantz, and Butikofer (2009) looked at teacher efficacy (which often includes beliefs), there has been a lack of valid and reliable tools the research community has had at its disposal to assess educator beliefs relative to MTSS. Recently, the Florida Problem Solving & Response to Intervention Project developed such a measure, the Beliefs Survey (described in greater detail in the Study Variable and Measures section of this document; Castillo et al., 2010; 42
50 Castillo et al., 2015). The Beliefs Survey gave Project researchers the opportunity to quantify an educator s beliefs on an array of instruction related topics, including assessment and instruction, intervention, and eligibility determination for students who may benefit from special education services. Preliminary evidence indicates that the beliefs assessed by the survey are related to MTSS implementation consistent with the literature on teacher beliefs. Thus, information derived from beliefs surveys focused on MTSS may be valuable in that it may help identify specific beliefs that are commonly held by educators that either promote or hinder MTSS implementation efforts. Perceptions of MTSS Practices An educator s perception of how well or to what degree an initiative is being implemented in their school, be it a change initiative or an existing program, may impact their level of buy-in and cooperation when working towards the goals established for the initiative. An understanding of an educator s perceptions of practices, therefore, provides valuable insight when evaluating the viability and sustainability of a program, such as MTSS. In this context, an educator should include not only the teachers, but also the other key stakeholders at the building level, such as administration and support staff those whose actions and beliefs exert a direct influence on the implementation integrity of the MTSS model. While research on MTSS is growing, research on educator s perceptions of practices of MTSS implementation at the building level specifically, appears to be sparse. Dulaney, Hallam, and Wall (2013) qualitatively examined the perceptions of various MTSS components and practices (including implementation level) from an administrators perspective. The study was conducted in a state in the Southwestern US with 41 districts comprised of 562 elementary and 306 secondary schools (slightly greater than 68,000 students 43
51 collectively). The school system employed approximately 30,000 teachers and specialists, 1,600 administrative personnel, and 41 district superintendents. Surveys were sent to the 41 district superintendents with a return rate of 66%. From the respondents, nine were interviewed for this study, based upon their district s readiness to implement MTSS, as well as their district s size. The survey was subdivided into three sections: evidence-based practices, collaborative processes, and data based decision-making. Each of the three sections contained various statements regarding the respondent s perception of MTSS implementation in their schools, and the degree to which it is implemented (always, often, sometimes, or never). A respondent from a large district whose school did not have an MTSS plan in place, professed to having effective conversations, conceptual plans and book studies regarding MTSS, but did not believe there was a chart posted on a faculty lounge wall stating Here s the district MTSS model; make sure you re implementing that tomorrow (p. 38). Another expressed a much greater understanding of the importance of an established MTSS framework, suggesting that it was the common language (p. 38) used by the district to establish guidelines to be used at the building level to structure their problem-solving plan. As a whole, the superintendents perception was that their districts were making advancements in school improvement efforts, however, most felt the districts had failed to explicitly develop a systemic plan to support and promote this improvement. While these qualitative findings are informative, caution should be exercised when making inferences about the actual district readiness and levels of MTSS implementation in place, or about any other school based employees perceptions of how thoroughly MTSS practices were in place in their schools. The responses contained anonymous, individual selfreport data from the district superintendents perspective only. 44
52 The Florida Problem Solving and Response to Intervention Project developed a Perceptions of Practices Survey that addresses the need for a survey that examines the perceptions of large numbers of educators (described in greater detail in the Study Variable and Measures section of this document). The survey assesses - via self-report - the extent to which educators perceived their schools are implementing MTSS practices, both academically and behaviorally (Castillo et al., 2010). Items measure the components of the problem-solving process across tiers of service delivery. Importantly, the survey is designed to measure perspectives regarding implementation from all educators in a school as opposed to the small subsets of educators who complete many of the more frequently used fidelity measures. If schools are implementing the model with fidelity then one would expect to see a relationship between MTSS implementation and educators perceptions regarding what is being implemented in their school. Conclusion Data on MTSS models when compared to the traditional ability/achievement discrepancy model indicates that MTSS may be a viable alternative approach to service delivery. However the impact of varying levels of implementation of MTSS on educator variables and student growth is not well understood. For this reason, studies are needed that examine the relationship between implementation of MTSS and important educator outcomes. Educators outcomes explored in this literature review included educator beliefs, perceptions of MTSS implementation/practices at the building level, and student growth. 45
53 Chapter 3: Methods Research Design A correlational research design was employed to address the research questions posed in this study. A secondary data analysis was undertaken with data collected from the Florida Problem Solving/Response to Intervention (PS/RtI) Project, a collaborative initiative between the Florida Department of Education (FDOE) and the University of South Florida (USF). Data were analyzed to evaluate the relationship between the level of implementation of MTSS in schools and educator beliefs about MTSS, their perceptions of MTSS practices being implemented in their schools, and student growth. An overview of Florida s PS/RtI Project and the methods that were used to evaluate these relationships follow. Florida s PS/RtI Project The FDOE funded and approved the Florida PS/RtI Project in The goal of the project was to evaluate the implementation of MTSS in pilot schools across the state for a 3-year period. Outcomes to be evaluated included the impact of implementing an MTSS model on districts, schools, educators, and students (Castillo et al., 2010). Project staff was comprised of two co-directors, one project leader, two project evaluators and three regional coordinators. Members of this team were responsible for Project planning, administrative duties, and providing training, technical assistance, and support to pilot schools to facilitate implementation and evaluation of MTSS practices. Funding, training, technical assistance, and follow-up support were provided to pilot elementary schools for a period of three years to facilitate implementation of MTSS. 46
54 School-Based Leadership Teams (SBLTs) were the primary focus of professional development provided by the three Regional Coordinators and Project staff. SBLTs were comprised of teams of educators identified as being responsible for facilitating implementation of MTSS in their schools. Teams typically had six to eight members and were multidisciplinary (e.g., administrators, general and special education teachers, instructional and student support personnel). Regional Coordinators provided 13 full-day trainings to SBLTs across the three-year period. Training content focused on the rationale for implementing MTSS, systems change principles needed to implement the model with fidelity, and the critical components of MTSS (i.e., features of multiple tiers of instruction and intervention and applications of the problemsolving process across tiers). In addition to the professional development and support received from Project staff, each school district was allocated funding for one full-time MTSS Coach for every three pilot schools. The MTSS Coaches were employed by the school districts, but were supported by funding from the Project ($50,000 was allocated to each district with three pilot schools, $100,000 to those with 6 pilot schools). The coaches received training from Project staff on MTSS practices and strategies for coordinating the implementation of the MTSS model in schools. Each coach was responsible for collecting data and for providing additional training, technical assistance, and follow-up support to each school s SBLTs. Coaches also provided training on MTSS practices and procedures to school staff in each of the schools for which they were responsible. Coaches worked directly with the Project s Regional Coordinators and Evaluators to coordinate the implementation and ongoing evaluation of MTSS practices. See Castillo, Hines, Batsche, and Curtis (2011) for more information on the professional development and coaching provided during the project. 47
55 Study Participants Pilot Schools. Participation in the Project was the result of a competitive selection process. All 67 school districts in the state of Florida received a Request for Proposal (RFP) from the FDOE to apply to participate. Twelve districts (approximately 20% of the districts in Florida) submitted applications. The applications were reviewed through a structured process. Based upon a review of the applications, eight school districts were selected for inclusion. The districts were representative of districts throughout Florida in terms of demographic factors (e.g., size, location, student population). A total of 40 pilot schools were identified for inclusion from these eight school districts. Following the first year of the Project, one of the districts decided to discontinue their involvement in the project. Therefore, seven districts with a total of 34 pilot schools remained. The current study used data collected from these 34 pilot schools from the school year. The pilot schools were demographically diverse, with approximately half of the students being White and one quarter Black. The students receiving Free-Reduced Lunch, however, comprised approximately 60% of the pilot school population. Pilot school demographic information is presented in Table 1 below. Table 1 Pilot School Demographic Characteristics: Mean Percentage and Standard Deviation by Demographic Category for the School Year Characteristic % (SD) Race White 53 (28) Black 26 (28) Hispanic 15 (11) Asian 2 ( 3) Native American <1(<1) Multi-racial 3 (2) Free-Reduced Lunch 60 (26) English Language Learners 9 (11) Students with Disabilities 15 (6) Note. Standard deviations are in parentheses. 48
56 Study Variables and Measures The independent variable (IV) in the current study is the level of implementation of MTSS. The dependent variables (DV) are (a) the staff perceptions of MTSS practices, (b) educator beliefs relative to MTSS, and (c) student growth in reading performance. The staff perceptions of MTSS practices is an assessment of the extent to which educators perceived MTSS practices as occurring in their schools. Educator beliefs refer to beliefs about MTSS practices. Finally, student growth in reading involves changes in reading performance on statewide assessments to which schools are held accountable. Instrumentation utilized to measure the IVs and DVs was developed by the Project. The literature on MTSS identified the characteristics of MTSS and processes required to facilitate implementation; however, empirically validated measures of MTSS and its implementation did not exist. Therefore, Project staff developed tools to monitor MTSS implementation. An Educator Expert Validation Panel (EEVP) was used to examine the content validity for two of the measures discussed below (the Beliefs Survey and the Perceptions of Practices Survey). Comprised of 14 members (teachers, administrators, school psychologists, guidance counselors, and program supervisors), the panel reviewed proposed items on the tools and evaluated the relevance and clarity of the Items. Panel members also could suggest modifications to items or the addition of items. Feedback received from the EEVP was used by the Project to revise items on the instruments prior to their use in pilot schools. See Castillo et al. (2010) for information on the development of the tools described below and how they were designed to be used. Beliefs Survey. The Beliefs Survey was a self-report instrument designed to assess educators beliefs about assessment practices, core (Tier 1) instruction, intervention, and special education eligibility determination (Castillo et al., 2010). The SBLT as well as the instructional 49
57 staff members at each of the pilot schools completed the Beliefs Survey. The Beliefs Survey items (27 items) used a 5-point Likert-type scale with response options as follows: 1 = Strongly Disagree, 2 = Disagree, 3 = Neutral, 4 = Agree, and 5 = Strongly Agree. The content validity of the Beliefs Survey was examined using the above-mentioned EEVP. Evidence of construct validity was demonstrated via an exploratory common factor analytic procedure used to determine the underlying factor structure (Castillo, et al., 2010). A factor analysis was completed using the responses received from 1,998 educators from the 62 schools during the fall of Following analysis of the Eigen values (percentage of variance explained by the factors), an oblique rotation (Promax) method was used to aid in the interpretability of the factors. Threefactors were retained (Academic Ability and Performance of Students with Disabilities, Data- Based Decision Making, Functions of Core and Supplemental Instruction). Internal consistency reliability estimates for each of the factors were.87,.79, and.85, respectively. See Appendix C for the Beliefs Survey. Florida Comprehensive Assessment Test (FCAT): The Florida Comprehensive Assessment Test (FCAT) was a criterion-referenced assessment in mathematics, reading, science, and writing that was designed to measure a student s progress toward meeting the Sunshine State Standard (SSS) benchmarks (FDOE, 2008). The FCAT was administered to all Florida public school students in grades 3-10, with a few exceptions (e.g., students with low-incidence disabilities) (FDOE, 2008). FCAT data were collected from those students who took the FCAT in grades 3-5 in the pilot schools. The current study utilized the Reading Scale Scores (which range from 100 to 500) derived from the FCAT Reading subtest to measure student growth. The FCAT Technical adequacy data reported by the FDOE evaluated the alignment between the Sunshine State Standards (SSS) and the four content areas of the grade three FCAT 50
58 Reading subtest. Relative to Categorical Concurrence and Depth of Knowledge Consistency, the FDOE reported an acceptable level of alignment, while the alignment with Range of Knowledge Consistency and Balance of Representation was weak (FDOE, 2008). The FCAT Reading reliability coefficient for third grade was.89 using Chronbach s Alpha (Chronbach s, 1959). The FCAT criterion related validity was established utilizing the Stanford 9 (SAT9) as the norm-referenced comparison to the FCAT. The correlation for third grade was.84 (FDOE, 2007). Perceptions of Practices Survey. The Perceptions of Practices Survey was a self-report measure that assessed the extent to which educators perceived MTSS practices were occurring in their schools (Castillo, et al. 2010). Items assessed the extent to which the problem-solving process was being applied across tiers of service delivery. Each of the 17-items was scored using a 5-point Likert-type response scale: 1 = Never Occurs (NO); 2 = Rarely Occurs (RO); 3 = Sometimes Occurs (SO); 4 = Often Occurs (OO); 5 = Always Occurs (AO); and Do Not Know (DK). Members of the SBLT and all instructional staff in the pilot schools completed the survey. Content validity of the Perceptions of Practices Survey was established in two ways. First, Project staff analyzed previous literature on MTSS and its implementation and existing instruments from program evaluation projects. Second, an EEVP was used to review each item and to provide feedback about the degree to which each item was relevant, clear, and concise (see above). Evidence for construct validity was established when a common factor analysis was conducted using data collected from the Perceptions of Practices Surveys from educators in 62 schools during the fall of The principal components factor extraction method was employed and upon examination of the Eigen values and a scree plot, two factors were retained - Perceptions of RtI Practices Applied to Academic Content and Perceptions of RtI Practices 51
59 Applied to Behavior Content. These two factors accounted for approximately 75% of the common variance in perceived practices. The internal consistency reliability estimates were.97 for the first factor and.96 for the second factor. See Appendix D for the Perceptions of Practices Survey. Self-Assessment of Problem-Solving Implementation (SAPSI) Survey. The Self- Assessment of Problem-Solving Implementation Survey (SAPSI) was a progress-monitoring tool used to assess the extent to which schools were making progress towards implementation of MTSS practices and was the primary measure of the IV in the current study. The SAPSI contained 27 items that measured the degree to which schools were (1) building consensus among key stakeholders, (2) developing the infrastructure required to support implementation, and (3) implementing MTSS practices and procedures (Castillo et al., 2010). These three domains aligned with the school-level change framework proposed by Kurns and Tilly (2008). The SAPSI was completed by the SBLTs using the following scale: N = Not Started (activity occurs less than 25% of the time); I = In Progress (activity occurs between 25-74% of the time); A= Achieved (activity occurs % of the time); and M = Maintaining (activity was rated as achieved the last time measured and continues to occur % of the time). Content validity for the SAPSI was examined by reviewing existing literature on the critical components of MTSS and on systems change, and by reviewing existing implementation instrumentation from other statewide projects facilitating MTSS implementation. Following the development of a SAPSI item set, content validity was further examined by comparing the items to those on an existing instrument, the IL-ASPIRE SAPSI v It was determined that the items generally were consistent with those on the Illinois instrument; however, some differences did exist to address Project specific needs (Castillo, et al., 2010). Internal consistency reliability 52
60 estimates were generated for the three domains measured by the instrument: Consensus, Infrastructure Development, and Implementation. The SAPSIs administered during the winter of 2010 in the 34 pilot schools were used to calculate reliability coefficients. The data analysis yielded internal consistency reliability coefficients (Chronbach s Alpha, 1951) of.64 for Consensus,.89 for Infrastructure Development, and.91 for Implementation (Castillo et al., 2010). See Appendix E for the SAPSI. Data Collection and Entry Procedures Data Collection. Data collected during the spring of the school year (the third year of the Project) were used in the current study. The Regional Coordinators and MTSS Coaches were responsible for administering the Beliefs and Perceptions of Practices Surveys in each of the pilot schools. Regional Coordinators provided the surveys to SBLT members during SBLT trainings. MTSS Coaches administered the surveys to instructional staff via a number of methods. Every attempt was made to administer the surveys during staff- or grade-level meetings to increase return rates. When the surveys could not be administered in this way, Coaches placed the surveys in staff mailboxes with directions for completing and returning them. Return rates for the Beliefs and Perceptions of Practices Surveys were calculated as part of the current study. SBLT members completed the SAPSI. RtI Coaches were asked to help review the SAPSI questions with the SBLT members so all understood the content and format of the document. It was recommended that each of the SBLT members complete the assessment individually prior to completing it as a team. Ultimately, one SAPSI was submitted per pilot school. SBLTs met to engage in discussions about each item until consensus could be reached regarding the rating to provide. 53
61 MTSS Project Evaluators received student achievement (FCAT) data from each of the seven pilot districts. The FCAT data were provided by the FDOE (scale scores for individual students) for students in grades 3-5. The student identification numbers provided to the project were changed to protect student confidentiality, but school identification numbers allowed for analysis at the school-level. Data Entry. Graduate Research Assistants were trained by Project staff to manually enter survey and SAPSI data into databases. Fifteen percent of the data points that were entered were randomly selected and reviewed for accuracy. If the rate of accuracy fell below 90%, the data would have been reviewed in their entirety. Accuracy for the Beliefs Survey ranged from % with a median of 100% agreement. Accuracy for the Perceptions of Practices Survey ranged from % with a median of 100%. Finally, accuracy for the SAPSI ranged from % with a median of 100%. Data Analyses Preliminary Analyses. The data analysis was based upon the school mean scores derived from all personnel (individual or teams) who completed the self-report measures as well as from student growth scores from each school (derived from the FCAT). Descriptive statistics were calculated for all variables. The descriptive data included means and standard deviations for all variables of interest. Scores were calculated for each domain of the SAPSI (Consensus, Infrastructure, and Implementation) and for each factor from the Beliefs Survey (SWD, DBDM, and FOI) and the Perceptions of Practices Survey (Perceptions of RtI Practices Applied to Academic Content and Perceptions of RtI Practices Applied to Behavior Content). Chronbach s Alpha (Chronbach, 1951) was calculated for each factor to determine their internal consistency when utilized with the current sample. Student growth was measured by changes in student 54
62 achievement (FCAT Reading Scale Scores) between Years 2 and 3. Year 2 scale scores were subtracted from Year 3 scale scores for each individual student. Students with missing data for one of the years were deleted before growth scores were averaged for each school. To assess the direction and strength of the bivariate relationships between the independent variables (SAPSI scores) and the dependent variables (educator beliefs, perceptions of practice, and student growth), eighteen separate Pearson Product Moment Correlations (PPMC) were conducted with the resulting information being generated in scatterplots. Additionally, the underlying assumptions of multiple regression - the statistical method that will be used to address the research questions (described below) - were examined. These include the assumptions of normality, reliability, linearity, and homoscedasticity (assumption that the variance of error is the same across all levels of the IV). Residuals also were also analyzed for outliers. Inferential Analyses. To determine which domains of implementation of MTSS at the building level were most predictive of educator beliefs, staff perceptions of practices, and student growth, a series of six multiple regressions were conducted (one for each of the six outcome variables). Factor scores from the SAPSI, Beliefs Survey, and Perceptions of Practices Survey were used. FCAT growth scores were utilized to represent student growth in the analysis. The multiple regressions allowed for the examination of how level of implementation of MTSS at the building level predicts each of the dependent (criterion) variables. Separate SAPSI scores were entered for Consensus, Infrastructure, and Implementation, resulting in three predictors for each model. A sample equation is presented below: Mean Student Growth (as measured by the FCAT Scale Score) = β SAPSI (Consensus) + β SAPSI (Infrastructure) + β SAPSI (Implementation) + e 55
63 The obtained and adjusted R 2 values, and standardized regression coefficients were reported. Prior to conducting the regression analyses, a power analysis was conducted to determine the alpha level that was used. Given the sample size of 34 schools and the hypothesized effect size, alpha was set to
64 Chapter 4: Results Three phases of analyses were conducted to answer the research questions posed in this study. First, descriptive data for the IVs and DVs were calculated. Next, assumptions of a multiple regression analysis were addressed, which include normality, linearity, reliability, and homoscedasticity, followed by a review of the study variables correlations. Finally, the multiple regression analyses were conducted. Descriptive Statistics Descriptive statistics were calculated for all of the variables in the study, and are presented in Table 2. The mean score for Consensus was 2.56 with a standard deviation of.45, indicating the average school was somewhere between achieving and maintaining the development of consensus regarding implementation of MTSS amongst key stakeholders. The mean score for Infrastructure was 2.63 with a standard deviation of.32, indicating the average school was somewhere between achieving and maintaining the infrastructure development required to support implementation of the MTSS model. The mean score for Implementation was 2.42 with a standard deviation of.36, indicating that the average school was somewhere between achieving and maintaining implementation of MTSS. Mean scores of factors measured on the Beliefs Survey ranged from 3.17 to More specifically, the mean school-level score for educator beliefs about SWDs was 3.17 with a standard deviation of.24, indicating the average school-level score was between neutral and agree in terms of educators beliefs about whether students with disabilities are currently learning and possess the capacity to learn. The mean scores for educator beliefs about DBDM was 3.91 with a standard deviation of.16, indicating the average school-level educator score was 57
65 between neutral and agree in terms of educators possessing positive beliefs about the role of data in making instructional decisions The mean school-level score for educator beliefs about the FOI were 4.12 with a standard deviation of.17, indicating the average school-level educator score was between agree and strongly agree in terms of assumptions about the effectiveness of Tier 1 and 2 instruction in MTSS models. The mean scores of factors measured on the Perceptions of Practices Survey ranged from 3.79 to Specifically, the mean school-level score for Perceptions of Practices Applied to Academic Content was 4.35 with a standard deviation of.25, indicating that the average schoollevel score was between often and always occurring. The mean scores for perceptions of Behavior Content was 3.79 with a standard deviation of.43, indicating the average school-level score was between sometimes and often occurring. Finally, the mean school-level student growth score was with a standard deviation of These data indicated that, on average, a slight decrease in FCAT Reading Scale scores occurred between years. Table 2 Descriptive Statistics for Study Variables Variable N Min. Max. Mean Std. Dev. Consensus Infrastructure Implementation Beliefs (SWD) Beliefs (DBDM) Beliefs (FOI) Perceptions (Academic) Perceptions (Behavior) Student Growth Note: SWD = Academic Ability and Performance of Students with Disabilities; DBDM = Data-Based Decision Making; FOI = Function of Core and Supplemental Instruction. 58
66 Chronbach s Alpha scores were also calculated to measure the internal consistency of the factors being analyzed. Scores ranged from a low of.62 (Consensus for the SAPSI) up to.99 (Perceptions of Practices Applied to Behavior Content for the Perceptions of Practices Survey). Generally, a reliability coefficient of.70 or higher is preferred when assessing the internal consistency of the variable factors. See Table 3 for the Chronbach s Alpha coefficients for each study variable. Table 3 Chronbach s Alpha scores for Study Variables Variable Factors Chronbach s Alpha Consensus.62 Infrastructure.82 Implementation.84 SWD.77 DBDM.88 FOI.73 Academic.98 Behavior.99 Note: SWD = Academic Ability and Performance of Students with Disabilities; DBDM = Data- Based Decision Making; FOI = Functions of Core and Supplemental Instruction Assumptions of Multiple Regressions Statistical tests rely upon specific assumptions regarding the variables utilized in the analysis. Violation of these assumptions may provide unreliable analysis results. The regression analysis in the current study assumed the variables had normal distributions, something that can be identified through the inspection of skewness, kurtosis, and outlier distribution. The current study variables were all within the normal range, with the exception of SWDs. A review of the 59
67 histograms generated via this analysis identified a kurtosis value for the SWDs at 8.02, which indicates a greater concentration of values around the mean and lower variation amongst the variables observed. The second assumption of linearity relied upon a linear relationship between the independent and dependent variables to avoid underestimating the true relationship that exists. A review of data presented in scatterplots indicated linear relationships existed between the study IVs and DVs. The third assumption, reliability, involves whether the variables were measured with limited error and are measuring the same construct. Utilizing Chronbach s Alpha standardized reliability coefficients, all variables measured were acceptably reliable (as ranged from.62 to.99 across variables with all but one estimate meeting or exceeding.73). The assumption of homoscedasticity was that the variance of errors is similar across levels of the independent variables. A visual inspection of plots of the standardized residuals or errors for each of the predictor variables indicated a relatively even distribution. To examine the relationships between the study variables, 18 Pearson-Product-Moment Correlations (PPMC) analyses were conducted (the six DVs and their correlations with the 3 IVs) to determine the direction and strength of the relationships (i.e., to rule out multicollinearity). The data generally indicated small to moderate relationships between study variables (ranging between -.28 and.83), however, two noteworthy patterns did emerge (see Table 4). First, the correlations between the IVs (Consensus, Infrastructure, and Implementation factor scores) were moderate to high. Second, the Academic Ability and Performance of SWDs was the only dependent variable that was significantly related to all of the other dependent variables, including to student growth. Potential explanations for and implications of these patterns are discussed below in the Discussion section. 60
68 Given moderate to strong correlations between the Consensus, Infrastructure, and Implementation domain scores to be entered as predictors in multiple regression models, a tolerance analysis was conducted for each model to further examine the potential for multicollinearity. While Tabachnick & Fedell (2001) identify a tolerance value of.10 as the minimum level recommended, Huber & Stephens (1993) suggest a tolerance value of.25 would be acceptable. Tolerance estimates between.28 and.64 for the predictors were found in the current study. Thus, the fact that all values exceeded the.25 threshold for acceptability indicated that multicollinearity did not appear to be an issue. Table 4 Pearson Product-Moment Correlations Variables Cons. Infra. Implem. SWD DBDM FOI Acad. Behav. Growth Consensus Infrastructure.59* Implementation.55*.83* SWD DBDM * FOI *.80* Academic.34*.45*.43*.33* Behavior.29.46*.38*.33* * Growth * Note: Cons. = Consensus; Infra. = Infrastructure; Implem. = Implementation; SWD = Academic Ability and Performance of Students with Disabilities; DBDM =Data-Based Decision Making; FOI = Functions of Core and Supplemental Instruction; Acad. = Perceptions of RtI Practices Applied to Academic Content; Behav. = Perceptions of RtI Practices Applied to Behavior Content. *p<.10 61
69 Hypothesis One It was hypothesized that higher levels of Consensus, Implementation, and Infrastructure (as measured by the SAPSI) would predict higher levels of educator beliefs regarding SWDs, DBDM, and FOI. To determine the extent to which the level of implementation of MTSS predicted educator beliefs, three separate multiple regressions were conducted with SWD, DBDM, and FOI scores entered as the dependent variables. Consensus, Infrastructure, and Implementation scores from the SAPSI were entered as the independent variables in a block. Overall, the model predicting beliefs regarding SWDs was not statistically significant, F(3, 30) = 1.33, p =.28. The IVs accounted for 12% of the variance in beliefs regarding SWDs. The implementation domain, however, negatively predicted beliefs regarding SWDs, B = -.36, β = -.53 SE =.21, p <.10 (see Table 5). The second regression analysis examined the extent to which the SAPSI domains predicted educator beliefs regarding DBDM. Overall, the model predicting DBDM was statistically significant, F(3, 30) = 3.94, p <.10. The SAPSI factor scores accounted for 28% of the variance in DBDM beliefs. A review of the model indicated that two SAPSI factors significantly predicted DBDM, Infrastructure, B =.38, β =.77, SE =.14, p <.10, and Implementation, B = -.42, β = -.96, SE =.12, p <.10. (see Table 5). Infrastructure was positively related to beliefs regarding DBDM while Implementation was negatively related. The third regression model predicting beliefs regarding FOI was not statistically significant, F(3, 30) =.98, p =.41. The IVs accounted for 9% of the variance in the FOI beliefs. None of the predictor variables were statistically significant (see Table 5). 62
70 Table 5 Implementation Factors and Educator Beliefs Factors Beliefs SWD Beliefs DBDM Beliefs FOI IV B β SE Toler. B β SE Toler. B β SE Toler. Consensus Infrastructure ** Implementation -.36* *** Note: Toler. = Tolerance R 2 =.12, Adjusted R 2 =.03 for Beliefs re: Academic Ability and Performance of Students with Disabilities (SWD); R 2 =.28, Adjusted R 2 =.21 for Data-Based Decision Making (DBDM); R 2 =.09, Adjusted R 2 = for Functions of Core and Supplemental Instruction (FOI). *p<.10. **p<.05. ***p<.01. Hypothesis Two It was hypothesized that higher levels of Consensus, Implementation, and Infrastructure (as measured by the SAPSI) would predict higher levels of educator perceptions of MTSS practices in their schools applied to both Academic and Behavior content. To determine the extent to which the level of implementation of MTSS predicted educator perceptions of MTSS practices, two separate multiple regressions were conducted with Perceptions of RtI Practices Applied to Academic Content and Perceptions of RtI Practices Applied to Behavior Content scores entered as the dependent variables. Consensus, Infrastructure, and Implementation scores from the SAPSI were entered as the independent variables in a block. Overall, the model predicting Perceptions of RtI Practices Applied to Academic Content was statistically significant, F(3, 30) = 2.79, p <.10. The IVs accounted for 22% of the variance in Perceptions of RtI Practices Applied to Academic Content scores; however, none of the predictor variables were statistically significant (see Table 6). The second regression analysis examined the extent to 63
71 which the SAPSI domains predicted educator Perceptions of RtI Practices Applied to Behavior Content. Overall, the model predicting Behavior was statistically significant, F(3, 30) = 2.74, p <.10. The IVs accounted for 22% of the variance in Behavior, however, a review of the model indicates none of the predictor variables individually were significant (see Table 6). Table 6 Implementation Factors and Perceptions of Practices Factors Academic Behavior IV B β SE Toler. B β SE Toler. Consensus Infrastructure Implementation Note: Toler. = Tolerance R 2 =.22, Adjusted R 2 =.14 for Perceptions of Practices re: Perceptions of RtI Practices Applied to Academic Content (Academic); R 2 =.22, Adjusted R 2 =.14 for Perceptions of RtI Practices Applied to Behavior Content (Behavior). *p<.10. **p<.05. ***p<.01. Hypothesis Three It was hypothesized that higher levels of Consensus, Implementation, and Infrastructure (as measured by the SAPSI) would predict higher rates of student growth in reading. To determine the extent to which the level of implementation of MTSS predicted student growth, one multiple regression was conducted with Student Growth scores entered as the dependent variable. Consensus, Infrastructure, and Implementation scores from the SAPSI were entered as the independent variables in a block. Overall, the model predicting student growth was not 64
72 statistically significant, F(3, 30) =.48, p =.70. The IVs accounted for 5% of the variance in Student Growth. None of the predictor variables were statistically significant (see Table 7). Table 7 Implementation Factors and Student Growth Student Growth IV B β SE Toler. Consensus Infrastructure Implementation Note: Toler. = Tolerance R 2 = -.05, Adjusted R 2 = -.05 for Student Growth. *p<.10. **p<.05. ***p<.01 65
73 Chapter 5: Discussion The current study sought to identify which outcome variables of interest were predicted by the level of Consensus, Infrastructure, and Implementation at the building level. Educator beliefs about DBDM was predicted by Infrastructure and Implementation levels and educator beliefs about SWDs was predicted by Implementation level. Although the overall regression model predicted educator perceptions of practices applied to both Academic and Behavior Content, neither Consensus, Infrastructure, nor Implementation were significant predictors. No other study dependent variables (i.e. educator beliefs regarding FOI, and Student Growth) were significantly predicted by the MTSS activities. Before discussing the findings from the multiple regression analyses, a discussion of two particularly noteworthy patterns that emerged from correlations among the study variables is warranted. First, the moderate to high correlations between the Consensus, Infrastructure, and Implementation factors from the SAPSI indicated that some shared variance existed between the predictors. Although tolerance statistics indicated that multiple regression analyses were justified, it is plausible that predicting MTSS implementation levels with three factors may not have resulted in relationships being detected given shared variance among the independent variables. Therefore, future research should examine one combined factor score that aggregates Consensus, Infrastructure, and Implementation items to predict dependent variables of interest. Second, the Academic Ability and Performance of SWDs was the only dependent variable that was strongly related to all the other dependent variables, including Student Growth. A possible explanation for this finding is that educator beliefs regarding SWDs may be an 66
74 indicator of foundational beliefs that underscore other critical beliefs as well as actions in which educators will engage. For example, if an educator believes students with the greatest needs (SWDs) can grow and achieve academically, one may be more inclined to believe in data-based decision making to improve outcomes as well as to believe in the benefit of providing sound core and supplemental instruction to all students. In turn, these beliefs likely will translate to a greater implementation of MTSS practices, which may result in student growth (Nunn, Jantz, and Butikofer, 2009). However, future research is needed to determine how beliefs regarding SWDs influence the implementation of MTSS practices and ultimately, student growth. Relationship between MTSS Implementation Activities and Educator Beliefs MTSS Infrastructure and Implementation activities positively and negatively predicted educator beliefs about DBDM, respectively, and Implementation negatively predicted educator beliefs about the SWDs. The fact that Infrastructure positively predicted beliefs about DBDM is consistent with the literature. The SAPSI items that comprise the Infrastructure component measure data collection and utilization processes, as well as the school-based MTSS team structure and activities. Ensuring that the data needed to engage in decision-making are collected and available for use and that trained team members at data meetings are supporting educators in making data-based decisions is consistent with suggestions that providing access to resources and supporting educators to learn new skills are important facilitators of implementation (Batsche et al., 2005; Fullan, 2010; Hall & Hord, 2015). Having structures in place to support implementation may result in key stakeholders holding more positive beliefs about the merit of the data and decisions being made, thereby increasing their commitments to effective implementation efforts. 67
75 On the other hand, the relationship between implementation of MTSS and educator beliefs regarding DBDM was negative, contrary to the direction that was hypothesized. More research is needed to explain this finding, however, there are some possible contributing factors that will be explored here. The SAPSI is a self-report tool completed only by the SBLT members who received additional training and MTSS support. SBLT members represented a small percentage of the educators at a school who were responsible for supporting the remaining staff to implement MTSS. Researchers suggest that many schools do not provide effective professional development to staff (Darling-Hammond, Wei, Andree, Richardson, & Orphanos, 2009). Therefore, it is likely that at least some educators at the participating schools had not received sufficient support and training needed to implement MTSS effectively. This circumstance may have resulted in educators attempting to use data to make decisions about instruction and interventions, but without the knowledge, skills, or support to utilize data effectively, thereby contributing to more negative beliefs regarding DBDM. Another related hypothesis involves the fact that schools in the southeastern state in which the study took place were required to use data-based problem-solving to determine eligibility for special education. The Florida Department of Education mandated the use of a process based on problem-solving and response to intervention (i.e., MTSS) to determine eligibility for Exceptional Student Education (ESE) programs. Specifically, general education intervention procedures for any student being considered for ESE eligibility (FDOE, 2007) as well as procedures for students with Specific Learning Disabilities (SLD, 2007) and Emotional/Behavioral Disabilities (EBD, 2006) were revised just prior to the onset of the project from which the current study was conducted. Given the mandates to engage in problem-solving and measure student response to intervention, educators may have been making attempts to 68
76 follow procedures knowing their efforts were to be evaluated, however, they may have adapted their behaviors minimally without embracing the change process. Researchers have suggested that educators often have adapted to policy mandates by engaging in the minimum amount of change necessary to adhere to procedures, rather than the systems change needed to facilitate implementation with fidelity (Castillo & Curtis, 2014; Fullan, 2010; Sarason, 1990). Schools may have established procedures for complying with the accountability requirement (e.g., meetings, documentation of procedures), but may not have facilitated implementation in a systematic manner that facilitated teacher understanding and active engagement in the problem solving process. Stakeholder involvement in implementation is a critical element of implementing any innovation with fidelity (Castillo & Curtis, 2014; Fullan, 2010; Hall & Hord, 2015) and it is plausible that engaging in activities without meaningful involvement resulted in more negative beliefs about data-based decision-making. While the Implementation factor significantly predicted the SWDs, this relationship was negative as well. It is possible that educators preconceptions about SWDs abilities played a role in the finding. Sparks (2002) suggested that some educators believe there are students who are incapable of achieving at higher levels and this trajectory of achievement is unlikely to be enhanced through additional supports and practices. Thus, implementing problem-solving processes that are a critical element of MTSS and require time and effort may seem futile to some and, in the absence of systematic implementation efforts described above, may have the opposite effect on educators beliefs about students with disabilities abilities and performance than was intended. It is not clear why Consensus activities did not predict beliefs regarding DBDM or the SWDs. It also is not clear why Infrastructure did not significantly relate to educator beliefs about 69
77 the SWDs. Finally, it is not clear why beliefs regarding the FOI were not predicted by Consensus, Infrastructure, or Implementation. These results were inconsistent with what was hypothesized, but may be explained by the existing body of literature. Sparks (2002) determined that educator beliefs may establish parameters within which only certain students may achieve at a high level academically, and that their own abilities to teach are talents that cannot be developed through additional study or practice. Pajares (1992) also posited that beliefs very rarely change during adulthood, and that an educators belief structure regarding their teaching approach is well-developed and unalterable early in their careers. Therefore, educators beliefs about the how effective core and supplemental instruction should be may have been difficult to change through systematic implementation activities. Statistical power must be considered as a potential explanation as well. The sample size in the current study was 34 schools. Larger numbers of schools would provide more power to detect relationships between MTSS implementation activities and school-level beliefs. A larger sample size also may have resulted in a greater degree of variability in Consensus, Infrastructure, and Implementation activities. The current sample involved schools that had been trained for three years in MTSS and most schools reported high levels of Consensus, Infrastructure, and Implementation activities. Samples with greater variability would make it more likely to detect relationships. Relationship between MTSS Implementation and Perceptions of Practices Although the level of Consensus, Infrastructure, or Implementation of MTSS at the building level significantly did not relate to educator perceptions of practices (for both Academic and Behavior Content) individually, the overall regression models did significantly predict perceptions of practices (for both Academics and Behavior). The level of implementation of 70
78 MTSS accounted for 22% of the variability in each of the Perceptions of Practices Survey factors. These results were consistent with Dulaney, Hallam, and Wall s (2013) study exploring school administrators perceptions of varied MTSS practices and implementation components. The authors reported that some respondents perceived that the MTSS framework provided a common language (p. 38) the school district employed as a building-level guideline for implementing a unified problem-solving plan. Establishing a common language of procedural expectations, available resources, and supports provided may create a school culture within which educators understand MTSS processes fully committing to and becoming stake-holding participants in these processes (Dulaney et al., 2013). This participation may create an internalized perception that the school is effectively engaging in MTSS practices both academically and behaviorally. Castro-Villarreal, Rodriguez, and Moore (2014) also identified components crucial to effective MTSS implementation including levels of training received, time required to fully implement, and the resources available to implement that they suggested shaped educator perceptions of how well MTSS was being implemented in their schools. It is unclear, however, why none of the SAPSI factors individually predicted educators perceptions of practices. It is possible that the individual components of Consensus, Infrastructure, and Implementation do not relate to educators perceived practices, but rather the overall level of implementation activities may predict staff perceptions. Other hypotheses involve the relatively small sample size used in the current study and the limited variability in the participating schools implementation activities discussed above. Relationship between MTSS implementation and Student Growth MTSS Consensus, Infrastructure, and Implementation activities at the building level were not significantly related to Student Growth at the building level. In fact, Consensus, 71
79 Infrastructure, and Implementation activities accounted for only 5% of the variability in student growth. These results were contrary to the hypothesized outcome and to findings in the existing literature. One potential explanation for these discrepant findings involves the duration of MTSS implementation at participating schools. Batsche et al. (2005) suggest fully implementing MTSS in schools requires four to six years; however, participating schools only were implementing for three years. Therefore, more time may have been needed to detect relationships between MTSS activities and Student Growth. Related to the issue of time is the notion that the FCAT the measured used to assess Student Growth, may not have been sensitive enough to detect significant growth in other reading skills (e.g., phonemic awareness, phonics, fluency) reflective of the instructional and intervention efforts that may have been occurring in the classroom. In fact, studies examining these skills have demonstrated relationships between MTSS implementation and reading outcomes other than comprehension (Hughes & Dexter, 2011). For instance, O Connor, Fulmer, & Harty (2003) found that students provided supplemental Tier 2 and intensive Tier 3 instruction in the areas of letter knowledge and phonemic awareness showed improvements in reading fluency, word identification, and word attack when compared to their peers in the control groups. Additionally, other hypotheses involve power and limited variability raised above. Larger samples with more variability may detect relationships between these activities and Student Growth. Implications for Research and Practice More research is needed to investigate the varied findings regarding the significance and direction of the relationships between Consensus, Infrastructure, and Implementation and the outcomes studied. Given issues of statistical power raised earlier, larger samples with increased 72
80 variability in implementation levels are needed. Researchers also may explore the benefits of collapsing the three domain scores from the SAPSI into one total score when conducting regression analysis. Because of the moderate to strong relationships that existed between the SAPSI factor scores, one score may be more indicative of the relationships that exist between MTSS implementation activities and outcome variables being investigated. Another issue to consider for future studies would be the utilization of MTSS implementation activity measurement tools with more reliability and validity evidence. While the SAPSI has some evidence to supports its use as a measure of MTSS implementation activity, the available evidence is limited to a review of pre-existing tools and internal consistency estimates (Castillo et al., 2010). In fact, internal consistency estimates for one of the factors (Consensus) did not meet the typical.70 threshold (Nunnally, 1978). Researchers have begun to look at alternative tools for measuring MTSS implementation activities. For instance, preliminary studies of one tool, the Self-Assessment of Multi-Tier System of Supports (SAM), provide evidence for content and construct validity as well as internal consistency of the factors measured (Stockslager, Castillo, Brundage, Childs, & Romer, 2016). As an alternative to self-report measures, research informed by permanent product reviews and direct observations will likely provide additional, more accurate data to explore relationships between implementation and various outcomes. These methodologies have been identified in the existing research as more reliable given increased objectivity associated with more direct observation of the phenomenon being studied. Noell & Gansle (2006) state the observation method of data collection is most accurate, albeit with some limitations. Observer bias and the expenditure of additional resources to collect the data may make direct observation difficult in certain situations (Cohen, Kincaid, & Childs, 2007). Noell and Gansle (2006) identify 73
81 the use of permanent product review as an efficient alternative to observation stating the time commitment required to collect the data from a product review is often significantly less than observations. Ultimately, studies using multiple methods to assess MTSS activities may be needed to develop an accurate understanding of MTSS activities and their relationship to identified outcomes (Noell & Gansle, 2006; Roach et al., 2014). Despite the need for future research, the current study findings may provide some direction for practitioners in the schools. Batsche et al. (2005) suggest full implementation of MTSS at the building level will require four to six years. While drawing summative conclusions from data generated earlier should be avoided, data collected during initial implementation efforts should be viewed as a source of information to be used to formatively improve MTSS implementation fidelity (Castillo, 2014). Educators should systematically use data to identify strengths in their implementation and areas in need of improved implementation and develop action plans to address needs. Data collected can then be used to determine how to adjust strategies to maximize implementation in the building. Additionally, the reliance upon self-report measures of fidelity also should be a point of consideration for practitioners. The realities of time constraints and limited resources available in the schools often dictate the use of such tools. Those utilizing self-report measures must realize the potential pitfalls associated with their use. Self-report measures are less reliable sources of data than would be collected via permanent product review and/or direct observation and are susceptible to an upward bias (Noell and Gansle, 2006). However, Noell and Gansle (2006) recommend the use of self-report as a source of data collection to be used in conjunction with other methods (e.g., direct observation, permanent product review). 74
82 Limitations Several limitations should be considered relative to the current study. First, Batsche et al. (2005) suggest it will take between four to six years to fully implement MTSS in schools; however, data used in the current study were collected during the third and final year of a Project to evaluate MTSS implementation. This limitation is noteworthy, because one can conclude that while the levels of implementation likely varied across the pilot schools, all schools likely were acting in a state of less-than-full implementation, despite the SAPSI scores. A related limitation involves the fact that self-reported data were utilized extensively. Noell & Gansle (2006) state an upward bias may exist which indicates that SAPSI scores may have reflected higher implementation levels than would be expected during the third year of implementation. Additionally, the focus of the current study is on elementary students. As a result, results from the current study may not be generalized to middle or high school settings. Another limitation involves the small sample size (n = 34) used, which resulted in less power to detect relationships. The psychometric characteristics of the SAPSI, the tool used to measure level of implementation of MTSS in the current study represent another potential limitation. Tools with more evidence of their reliability and validity may provide more accurate information to detect relationships among MTSS activities and identified outcomes. Finally, in light of the limitations identified in the current study, interpretation of the findings should be made with caution. Although some relationships between implementation activities and educator and student outcomes were found, additional research that addresses concerns regarding issues such as sample size, how implementation scores are modeled, and the tools used to measure implementation is needed before more definitive conclusions can be reached. 75
83 Conclusion The current study sought to understand the relationships that exist between the level of implementation of MTSS at the building (school) level, educator beliefs about MTSS, their perceptions of MTSS practices as implemented in the school, and student growth. Findings indicated that Consensus, Infrastructure, and Implementation either did not predict the outcomes being examined or the prediction was in the opposite direction as was hypothesized for the majority of dependent variables. Additional research with greater numbers of schools and using other methods for evaluating MTSS activities are needed. Despite the questions that remain, the findings may have some implications in terms of how educators measure MTSS fidelity and the use of formative decision-making principles when evaluating MTSS implementation and its relationship to important educational outcomes. 76
84 References Ashton, P. T. (1990). Editorial. Journal of Teacher Education, 41, 1. ASPIRE, I. (2007). Alliance for school-based problem-solving and intervention resources in education, an Illinois State Board of Education initiative. Aud, S., Hussar, W., Planty, M., Snyder, T., Bianco, K., Fox, M., Frohlich, L., Kemp, J., Drake, L. (2010). The Condition of Education 2010 (NCES ). National Center for Education Statistics, Institute of Education Sciences, U.S. Department of Education. Washington, DC. Aud, S., Wilkinson-Flicker, S., Kristapovich, P., Rathbun, A., Wang, X., and Zhang, J. (2013). The Condition of Education 2013 (NCES ). U.S. Department of Education, National Center for Education Statistics. Washington, DC. Retrieved [date] from Batsche, G. M., Curtis, M. J., Dorman, C., Castillo, J. M., & Porter, L. J. (2007). The Florida problem-solving/response to intervention model: Implementing a statewide initiative. In S. R. Jimerson, M. K. Burns, & A. M. VanDerHeyden (Eds.), Handbook of Response to Intervention: The Science and Practice of Assessment and Intervention (pp ). New York, NY: Springer. Batsche, G. M., Elliot, J., Graden, J. L., Grimes, J., Kovaleski, J. F., Prasse, D., Reschly, D. J., Schrag, J., & Tilly III, W. D. (2005). Response to intervention: Policy considerations and implementation. Alexandria, VA: National Association of State Directors of Special Education, Inc. 77
85 Batsche. G. M., Kavale, K. A., & Kovaleski, J. F. (2006). Competing views: A dialogue on response to intervention. Assessment for Effective Intervention. 32 (6). Bergan, J. & Kratochwill, T. R. (1990). Behavioral consultation and therapy. New York: Plenum Press. Bol, L., Nunnery, J. A., Lowther, D. L., Dietrich, A. P., Pace, J. B., Anderson, R. S., Bassoppo- Moyo, T.C., Phillipsen, L. C. (1998). Inside-in and outside-in support for restructuring: The effects of internal and external support on change in the New American Schools. Education and Urban Society, 30(3), doi: / Brown-Chidsey, R., & Steege, M. W. (2005). Response to intervention: Principles and strategies for effective practice. New York: Guilford Press Burns, M. K., Appleton, J. J., & Stehouwer, J. D. (2005). Meta-analytic review of responsiveness-to-intervention research: Examining field-based and researchimplemented models. Journal of Psychoeducational Assessment, 23, doi: / Burns, M. K., & VanDerHeyden, A. M. (2006a). Using response to intervention to assess learning disabilities [Special issue]. Assessment for Effective Intervention, 32, Castillo, J.M. (2014). Best practices in program evaluation in a model of Response to Intervention/Multi-Tiered System of Supports. In P.L. Harrison & A. Thomas (Eds.), Best practices in school psychology: Foundations (pp ). Bethesda, MD: National Association of School Psychologists. 78
86 Castillo, J. M., Batsche, G. M., Curtis, M. J., Stockslager, K., March, A., & Minch, D. (2010). Problem Solving/Response to Intervention: Evaluation Tool Technical Assistance Manual. Retrieved from Castillo, J. M., Dedrick, R. F., Stockslager, K. M., March, A. L., Hines, C. V., and Tan, S. Y. (2015). Development and initial validation of a scale measuring the beliefs of educators regarding response to intervention. Journal of Applied School Psychology, 31:1, DOI: / Castillo, J. M., Hines, C. V., Batsche, G. M., and Curtis, M. J. (2011). The Problem Solving/Response to Intervention Project: Year 3 Evaluation Report. University of South Florida, Florida Problem Solving/Response to Intervention Project. Retrieved from Castillo, J. M., and Curtis, M. J (2014). Best practices in systems-level change. Best practices in school psychology: Systems-level services: Castro-Villarreal, F., Rodriguez, B.J., and Moore, S. (2014). Teachers perceptions and attitudes about response to intervention (RTI) in their schools: A qualitative analysis. Teaching and Teacher Education, 40, Cohen, R., Kincaid, D., Childs, K. (2007). Measuring school-side positive behavior support implementation: Development and validation of the Benchmarks of Quality. Journal of Positive Behavior Interventions, 9, Cook, C. R., Lyon, A. R., Kubergovic, D, Wright, D. B., & Zhang, Y. (2015). A supportive beliefs intervention to facilitate the implementation of evidence-based practices within a multi-tiered system of supports. School Mental Health, 7,
87 Chronbach L. J. (1951). "Coefficient alpha and the internal structure of tests." Psychometrika 16, (3): Darling-Hammond, L., Wei, R. C., Andree, A., Richardson, N., & Orphanos, S. (2009). Professional learning in the learning profession. Washington, DC: National Staff Development Council. Davis-Bianco, S. (2010). Improving Student Outcomes: Data-driven Instruction and Fidelity of Implementation in a Response to Intervention (RTI) Model. TEACHING Exceptional Children Plus, 6(5) Article 1. Retrieved Dec 9, 2011, from Desimone, L.M. (2009). Improving impact studies of teachers professional development: Toward better conceptualizations and measures. Educational Researcher, 38(3), Donovan, M.S., & Cross, C.T. (Eds.) (2002). Minority students in special and gifted education. Washington, DC: National Academy Press. Duffy, G. (1982). Fighting off the alligators: what research in real classrooms has to say about reading instruction. Journal of Reading Behavior, 14, Dulaney, S. K., Hallam, P. R., & Wall, G. W. (2013). Superintendent perceptions of multi-tiered systems of support (MTSS): Obstacles and opportunities for school system reform. AASA Journal of Scholarship and Practice, 10(2) summer, Edmonds, R. R. (1979a). A discussion of the literature and issues related to effective schooling. Cambridge, MA: Center for Urban Studies, Harvard Graduate School of Education. Every Student Succeeds Act, U.S.C. 114 STAT (2016) Fang, Z. (1996). A review of research on teacher beliefs and practices. Educational Research, 38(1), spring,
88 Fletcher, J. M., & Vaughn, S. (2009). Response to Intervention: Preventing and remediating academic difficulties. Child Development Perspectives, 3, Florida Department of Education (2007). Assessment and accountability briefing book. FCAT/school accountability/teacher certification Retrieved from fcat.fldoe.org/pdf.briefingbook07.web.pdf Florida Department of Education (2008). Statewide response to instruction/intervention (RtI) implementation plan. Retrieved Dec 5, 2011, from Florida Department of Education Specific Learning Disabilities Eligibility Determination Rule (6A ) Florida Department of Education Emotional Behavioral Disabilities Eligibility Determination Rule (6A ) Forness, S. R. (2001). Special education and related services: What have we learned from metaanalyses? Exceptionality, 9(4), doi: /S EX0904_3 Fuchs, L. S., Fuchs, D. (2006). Introduction to response to intervention: What, why, and how valid is it? Reading Research Quarterly, 41(1), Fuchs, L. S., Fuchs, D., Hamlett, C. L., Walz, L., & Germann, G. (1993). Formative evaluation of academic progress: How much growth can we expect? School Psychology Review, 22, Fullan, Michael. All systems go: The change imperative for whole system reform. Corwin Press, Gravois, T.A., & Rosenfield, S.A. (2006). Impact of educational consultation teams on the disproportionate referral and placement of minority students in special education. Remedial and Special Education, 27,
89 Gresham, F. M. (2007). Evolution of the response-to-intervention concept. In S. R. Jimerson, M. K. Burns, & A. M. VanDerHeyden (Eds.), Handbook of Response to Intervention: The Science and Practice of Assessment and Intervention (pp.10-24). New York, NY: Springer. Gresham, F.M., MacMillan, D.L., Beebe- Frankenberger, M.E., & Bocian, K.M. (2000). Treatment integrity in learning disabilities intervention research: Do we really know how treatments are implemented? Learning Disabilities Research & Practice, 15(4), Gutkin, T. B., & Curtis, M. J. (2009). School-based consultation: The science and practice of indirect service delivery. In T. B. Gutkin & C. R. Reynolds (Eds.), The handbook of school psychology (4 th Ed.)(pp ). Hoboken, NJ: Wiley. Hall, G. E., & Hord, S. M. (2015). Implementing change: Patterns, principles and potholes (4 th Ed.). Boston, MA: Pearson. Hedges, L. (1982). Estimation of effect size from series of independent experiments. Psychological Bulletin, 92, Heller, K.A., Holtzman, W.H., & Messick, S. (Eds.). (1982). Placing children in special education: A strategy for equity. Washington, DC: National Academy Press. Herrmann, B. A., & Duffy, G. G. (1989, March). Relationships between teachers' conceptual understandings, teacher responsiveness, and student outcomes: Two exploratory studies in teacher education settings. Paper presented at the annual meeting of the American Educational Research Association, San Francisco. Hughes, C. A. & Dexter, D. D. (2011) Response to intervention: A research-based summary, Theory into practice, 50:1, 4-11, DOI: /
90 Huber, E. & Stephens, J.D. (1993). Political Practices and Public Pensions: A quantitative analysis, Acta Sociologica, 36, Individuals with Disabilities Education Improvement Act, U.S.C. H.R (2004). Jimerson, S.R., Burns, M. K., & VanDerHeyden, A. M. (2007), Handbook of Response to Intervention: The Science and Practice of Assessment and Intervention, (pp. 3-9). New York, NY: Springer. Kagan, D. M. (1992). Implications of research on teacher belief. Educational Psychologist, 27(1), Kansas State Department of Education. (2011) Kansas MTSS Symposium. Retrieved Dec 8, 2011 from Kena, G., Aud, S., Johnson, F., Wang, X., Zhang, J., Rathbun, A., Wilkinson-Flicker, S., and Kristapovich, P. (2014). The Condition of Education 2014 (NCES ). U.S. Department of Education, National Center for Education Statistics. Washington, DC. Retrieved March 24, 2015 from Kratochwill, T. R., Clements, M. A., & Kalymon, K. M. (2007). Response to intervention: Conceptual and methodological issues in implementation. In S. R. Jimerson, M. K. Burns, & A. M. VanDerHeyden (Eds.), Handbook of Response to Intervention: The Science and Practice of Assessment and Intervention (pp.25-52). New York, NY: Springer. Kurns, S. M. A. & Tilly, D. W. (2008). Response to intervention: Blueprints for implementation. Alexandria, VA: National Association of State Directors of Special Education, Inc. Lerner, J. W. (2002). Learning disabilities: Theories, diagnosis, and teaching strategies (8 th ed.). Boston: Houghton-Mifflin. 83
91 Madaus, G. F., Airasian, P. W., & Kellaghan, T. (1980). School effectiveness: A reassessment of the evidence. New York: McGraw-Hill. Marston, D., Muyskens, P., Lau, M, & Canter, A. (2003). Problem-solving model for decision making with high-incidence disabilities: The Minneapolis experience. Learning Disabilities Research and Practice, 18(3), doi: / Martin, G. 0. (1989, March). Factors that are associated with change in teachers' use of new materials and teaching strategies. Paper presented at the annual meeting of the American Educational Research Association, San Francisco. Martinez, R. & Young, A (2011). Response to intervention: How is it practiced and perceived? International Journal of Special Education 26(1), Marzano, R. (2001). A new era of school reform: Going where the research takes us. Midcontintent Research for Education and Learning, Aurora, CO. McREL Mellard, D. F., Frey, B. B., Woods, K. L. (2012). School-wide student outcomes of response to intervention frameworks. Learning Disabilities: A Contemporary Journal, 10(2), Michigan s Integrated Behavior and Learning Support Initiative. Program quality/fidelity assessments. Retrieved from TabID=505. National Center for Education Statistics (2011). The Nation s Report Card: Mathematics 2011 (NCES ). Institute of Education Sciences, U.S. Department of Education, Washington, D.C. National Center for Education Statistics (2011). The Nation s Report Card: Reading 2011 (NCES ). Institute of Education Sciences, U.S. Department of Education, Washington, D.C. No Child Left Behind Act, U.S.C. 115 STAT (2002). 84
92 Noell, G. H., Duhon, G. J., Gatti, S. L., & Connell, J. E. (2002). Consultation, follow-up, and implementation of behavior management interventions in general education. School Psychology Review, 31(2), Noell, G. H., & Gansle, K. A. (2006). Assuring the form has substance: Treatment plan implementation as the foundation of assessing response to intervention. Assessment for Effective Intervention, 32(1). Noell, G. H., Gresham, F. M., & Gansle, K. A. (2002). Does treatment integrity matter? A preliminary investigation of instructional implementation and mathematics performance. Journal of Behavioral Education, 11, Noell, G.H., Witt, J.C., Slider, N.J., Connell, J.E., Gatti, S.L., Williams, K.L., Duhon, G.J. (2005). Treatment implementation following behavioral consultation in schools: A comparison of three follow-up strategies. School Psychology Review, 34, Nunn, G. D., & Jantz, P. B. (2009). Factors within response to intervention implementation training associated with teacher efficacy beliefs. Education, summer, 129 (4), Nunn, G. D., Jantz, P. B., & Butikofer, C. (2009). Concurrent validity between teacher efficacy and perceptions of response to intervention outcomes. Journal of Instructional Psychology, 36(3), Nunnally, S. C. Psychometric Theory: Second Edition. New York: McGraw-Hill, 1978 O Connor, R.E., Fulmer, D., & Harty, K. (2003, December). Tiers of intervention in kindergarten through third grade. Paper presented at the National Research Center on Learning Disabilities Responsiveness-to-Intervention Symposium, Kansas City, MO. 85
93 O Conner, R.E., Harty, K.R., & Fulmer, D. (2005). Tiers of intervention in kindergarten through third grade. Journal of Learning Disabilities, 38 (6), Pajares, F. M. (1992). Teachers beliefs and educational research: Cleaning up a messy construct. Review of Educational Research, fall 1992, 62(3), Planty, M., Hussar, W., Snyder, T., Kena, G., Kewal Ramani, A., Kemp, J., Bianco, K., & Dinkes, R., (2009). The Condition of Education 2009 (NCES ). National Center for Education Statistics, Institute of Education Sciences, U.S. Department of Education. Washington, DC. President s Commission on Excellence in Special Education (2002). A new era: Revitalizing special education for children and their families (U.S. Department of Education Contract No. ED-02-PO-0791). Washington, DC: U.S. Department of Education. Rahn-Blakeslee, A., Ikeda, M. J., & Gustafson, J. (2005). Evaluating the quality and responsiveness of reading interventions developed through problem solving. Journal of Psychoeducational Assessment, 23, Richardson, V., Anders, P, Tidwell, D. and Lloyd, C (1991). The relationship between teachers beliefs and practices in reading comprehension instruction, American Educational Research Journal, 28,3, Roach, A.T., Lawton, K., and Elliott, S.N. (2014). Best practices in facilitating and evaluating the integrity of school-based interventions. In A. Thomas and P. Harrison (Eds.) Best Practices in School Psychology: Data-Based and Collaborative Decision-Making. (pp ). Bethesda, MD: National Association of School Psychologists. 86
94 Sarason, S.B. The predictable failure of educational reform: Can we change course before it s too late? The jossey-bass education series and the jossey-bass social and behavioral science series. Jossey-Bass, Inc., Publishers, Schafer, J. L. & Graham, J. W. (2002). Missing data: our view of the state of the art. Psychological Methods, 7(2), Showers, B., & Joyce, B. (1996). The evolution of peer coaching. Educational Leadership, 53(6), Sparks, D. (2002). Designing powerful professional development for teachers and principals. National Staff Development Council: Oxford, OH. Stockslager, K., Castillo, J.M., Brundage, A., Romer, N., & Childs, K. (2016, February). Development of a school-level tool to monitor MTSS implementation. Paper presented at the National Association of School Psychologists Annual Convention, New Orleans, LA. Sugai, G., & Horner, R. H. (2009). Responsiveness-to-intervention and school wide positive behavior supports: Integration of multi-tiered system approaches. Exceptionality, 17, Sulkowski, M. L., Joyce, D. K., & Storch, E. A. (2011). Treating childhood anxiety in schools: Service delivery in a response to intervention paradigm. Journal of Child and Family Studies, 21, doi: /s Tabachnick, B. G., & Fidell, L. S. (2001). Using multivariate statistics (4 th ed.). Boston, MA: Allyn and Bacon. Telzrow, C. F., McNamara, K., & Hollinger, C. L. (2000). Fidelity of problem-solving implementation and relationship to student performance. School Psychology Review, 29(3),
95 Tilly, W. D. (2008). The evolution of school psychology to science-based practice: Problem solving and the three-tiered model. In A. Thomas & J. Grimes (Eds.), Best practices in school psychology V (pp ). Bethesda, MD: National Association of School Psychologists Torgeson, J. K. (2009). The response to intervention instructional model: Some outcomes from a large-scale implementation in Reading First schools. Child Development Perspectives, 3(1), doi: /j x U.S. Department of Education, Office of Planning, Evaluation and Policy Development, ESEA Blueprint for Reform, Washington, D.C., VanDerHeyden, A. M., & Burns, M. K. (2005). Using curriculum-based assessment and curriculum-based measurement to guide elementary mathematics instruction: Effect on individual and group accountability scores. Assessment for Effective Intervention, 30(3), doi: / VanDerHeyden, A. M., Witt, J. C., & Gilbertson, D. (2007). A multi-year evaluation of a response to intervention (RTI) model on identification of children for special education. Journal of School Psychology, 45, doi: /j.jsp
96 Appendices 89

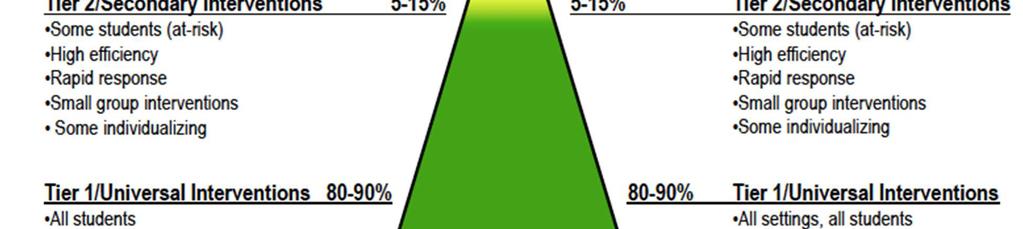
97 Appendix A: MTSS Model 90
98 Appendix B: Problem-Solving Model 91
99 Appendix C: Beliefs Survey Beliefs Survey 1.a. Your PS/RtI Project ID: Your PS/RtI Project ID was designed to assure confidentiality while also providing a method to match an individual s responses across instruments. In the space provided (first row), please write in the last four digits of your Social Security Number followed by the last two digits of the year you were born. Then, shade in the corresponding circles b. Are you a School-Based Leadership Team (SBLT) member? Your school s team may be called something else (e.g., RtI Training Team, RtI Team). Regardless of what your school calls the team, only members of the school leadership team responsible for facilitating the implementation of Problem Solving/Response to Intervention at your school should respond, Yes. Yes No 1.c. In which district are you employed? 1.d. In which school are you employed? 92
100 Directions: For items 2-5 below, please shade in the circle next to the response option that best represents your answer. 2. Job Description: PS/RtI Coach Teacher-General Education Teacher-Special Education School Counselor School Psychologist School Social Worker Principal Assistant Principal Other (Please specify): 3. Years of Experience in Education: Less than 1 year 1 4 years 5-9 years years years years 25 or more years Not applicable 4. Number of Years in your Current Position: Less than 1 year 1 4 years 5-9 years years years 20 or more years 5. Highest Degree Earned: B.A./B.S. M.A./M.S. Ed.S. Ph.D./Ed.D. Other (Please specify): Directions: Using the scale below, please indicate your level of agreement or disagreement with each of the following statements by shading in the circle that best represents your response. 1 = Strongly Disagree (SD) 93
101 2 = Disagree (D) 3 = Neutral (N) 4 = Agree (A) 5 = Strongly Agree (SA) SD D N A SA 6. I believe in the philosophy of No Child Left Behind (NCLB) even if I disagree with some of the requirements Core instruction should be effective enough to result in 80% of the students achieving benchmarks in 7.a. reading b. math The primary function of supplemental instruction is to ensure that students meet grade-level benchmarks in 8.a. reading b. math The majority of students with learning disabilities achieve gradelevel benchmarks in 9.a. reading b. math The majority of students with behavioral problems (EH/SED or EBD) achieve grade-level benchmarks in 10.a. reading b. math Students with high-incidence disabilities (e.g. SLD, EBD) who are receiving special education services are capable of achieving gradelevel benchmarks (i.e., general education standards) in 11.a. reading b. math
102 SD D N A SA 12. General education classroom teachers should implement more differentiated and flexible instructional practices to address the needs of a more diverse student body. 13. General education classroom teachers would be able to implement more differentiated and flexible interventions if they had additional staff support. 14. The use of additional interventions in the general education classroom would result in success for more students. 15. Prevention activities and early intervention strategies in schools would result in fewer referrals to problem-solving teams and placements in special education. 16. The severity of a student s academic problem is determined not by how far behind the student is in terms of his/her academic performance but by how quickly the student responds to intervention. 17. The severity of a student s behavioral problem is determined not by how inappropriate a student is in terms of his/her behavioral performance but by how quickly the student responds to intervention. 18. The results of IQ and achievement testing can be used to identify effective interventions for students with learning and behavior problems. 19. Many students currently identified as LD do not have a disability, rather they came to school not ready to learn or fell too far behind academically for the available interventions to close the gap sufficiently. 20. Using student-based data to determine intervention effectiveness is more accurate than using only teacher judgment. 21. Evaluating a student s response to interventions is a more effective way of determining what a student is capable of achieving than using scores from tests (e.g., IQ/Achievement test)
103 SD D N A SA 22. Additional time and resources should be allocated first to students who are not reaching benchmarks (i.e., general education standards) before significant time and resources are directed to students who are at or above benchmarks. 23. Graphing student data makes it easier for one to make decisions about student performance and needed interventions. 24. A student s parents (guardian) should be involved in the problemsolving process as soon as a teacher has a concern about the student. 25. Students respond better to interventions when their parent (guardian) is involved in the development and implementation of those interventions. 26. All students can achieve grade-level benchmarks if they have sufficient support. 27. The goal of assessment is to generate and measure effectiveness of instruction/intervention
104 Appendix D: Perceptions of Practices Survey Perceptions of Practices Survey 1. Your PS/RtI Project ID: Your PS/RtI Project ID was designed to assure confidentiality while also providing a method to match an individual s responses across instruments. In the space provided (first row), please write in the last four digits of your Social Security Number and the last two digits of the year you were born. Then, shade in the corresponding circles Directions: For each item on this survey, please indicate how frequently or infrequently the given practice occurs in your school for both academics (i.e., reading and math) and behavior. Please use the following response scale: 1 = Never Occurs (NO) 2 = Rarely Occurs (RO) 3 = Sometimes Occurs (SO) 4 = Often Occurs (OO) 5 = Always Occurs (AO) = Do Not Know (DK) 97
105 In my School: NO RO SO OO AO DK 2. Data (e.g., Curriculum-Based Measurement, DIBELS, FCAT, Office Discipline Referrals) are used to determine the percent of students receiving core instruction (general education classroom only) who achieve benchmarks (district grade-level standards) in: a. Academics b. Behavior Data are used to make decisions about necessary changes to the core curriculum or discipline procedures to increase the percent of students who achieved benchmarks (district grade-level standards) in: a. Academics b. Behavior Data are used (e.g., Curriculum-Based Measurement, DIBELS, Office Discipline Referrals) to identify at-risk students in need of supplemental and/or intensive interventions for: a. Academics b. Behavior The students identified as at-risk routinely receive additional (i.e., supplemental) intervention(s) for: a. Academics b. Behavior Progress monitoring occurs for all students receiving supplemental and/or intensive interventions for: a. Academics b. Behavior Progress monitoring data (e.g., Curriculum-Based Measurement, DIBELS, behavioral observations) are used to determine the percent of students who receive supplemental and/or intensive interventions and achieve grade-level benchmarks for: a. Academics b. Behavior
106 In my School: NO RO SO OO AO DK 8. A standard protocol intervention (i.e., the same type of intervention used for similar problems) is used initially for all students who required supplemental instruction for: a. Academics b. Behavior Directions: Items 9-18 refer to the typical Problem-Solving Team (i.e., Student Support Team, Intervention Assistance Team, School-Based Intervention Team, Child Study Team) meeting in your school last year (i.e., ) that included a student who had been referred for problem-solving or a special education evaluation. While addressing each item for academics (math and reading), think of a typical case in which a student is referred for an academic concern. While addressing each question for behavior, think of a typical case in which a student is referred for a behavioral concern. Then, please indicate how frequently each of the given practices occurred in your school using the same scale. In my School: NO RO SO OO AO DK 9. The target behavior is routinely defined in terms of the desired behavior (e.g., Johnny will raise his hand to ask a question, Susie will read 90 correct words per minute) instead of the problem behavior (e.g., Johnny talks out of turn, Susie reads below grade-level) for: a. Academics b. Behavior Quantifiable data (e.g., reading fluency score, percent compliance, percent on-task behavior) are used to a. identify the target student s current performance in the area of concern for: Academics Behavior b. identify the desired level of performance (i.e., the benchmark) in the area of concern for: Academics Behavior c. identify the current performance of same-age peers using the same data as the target student for: Academics
107 In my School: NO RO SO OO AO DK Behavior The Problem-Solving Team routinely develops hypotheses (i.e., proposed reasons) explaining why the target student is not demonstrating the desired behavior for: a. Academics b. Behavior Data are collected to confirm the reasons that the student is not achieving the desired level of performance for: a. Academics b. Behavior Intervention plans are routinely developed based on the confirmed reasons that the student is not achieving the desired level of performance for: a. Academics b. Behavior The teacher of a student referred for problem-solving routinely receives staff support to implement the intervention plan developed by the Problem-Solving Team for: a. Academics b. Behavior Data are collected routinely to determine the degree to which the intervention plans are being implemented as intended for: a. Academics b. Behavior Data are graphed routinely to simplify interpretation of student performance for: a. Academics b. Behavior Progress monitoring data are used to determine a. the degree to which the target student s rate of progress has improved for: Academics Behavior
108 In my School: b. whether the gap has decreased between the target student s current performance and the desired level of performance (i.e., benchmark) for: NO RO SO OO AO DK Academics Behavior c. whether the gap has decreased between the target student s current performance and the performance of same-age peers for: Academics Behavior A student s response-to-intervention data (e.g., rate of improvement) are used routinely to determine whether a student is simply behind and can learn new skills or whether the student s performance is due to a disability for: a. Academics b. Behavior
109 Appendix E: Self-Assessment of Problem-Solving Implementation (SAPSI) Self-Assessment of Problem-Solving Implementation (SAPSI) PS/RtI Implementation Assessment Directions: In responding to each item below, please use the following response scale: Not Started (N) (The activity occurs less than 24% of the time) In Progress (I) (The activity occurs approximately 25% to 74% of the time) Achieved (A) (The activity occurs approximately 75% to 100% of the time) Maintaining (M) (The activity was rated as achieved last time and continues to occur approximately 75% to 100% of the time) For each item below, please write the letter of the option (N, I, A, M) that best represents your School-Based Leadership Team s response in the column labeled Status. In the column labeled Comments/Evidence, please write any comments, explanations and/or evidence that are relevant to your team s response. When completing the items on the SAPSI, the team should base its responses on the grade levels being targeted for implementation by the school. Consensus: Comprehensive Commitment and Support Status Comments/Evidence 1. District level leadership provides active commitment and support (e.g., meets to review data and issues at least twice each year). 2. The school leadership provides training, support and active involvement (e.g., principal is actively involved in School-Based Leadership Team meetings). 3. Faculty/staff support and are actively involved with problem solving/rti (e.g., one of top 3 goals of the School Improvement Plan, 80% of faculty document support, 3-year timeline for implementation available). 4. A School-Based Leadership Team is established and represents the roles of an administrator, facilitator, 102
110 data mentor, content specialist, parent, and teachers from representative areas (e.g., general ed., special ed.) 5. Data are collected (e.g., beliefs survey, satisfaction survey) to assess level of commitment and impact of PS/RtI on faculty/staff. Additional Comments/Evidence: PS/RtI Implementation Assessment (Cont d) Scale: Not Started (N) (The activity occurs less than 24% of the time) In Progress (I) (The activity occurs approximately 25% to 74% of the time) Achieved (A) (The activity occurs approximately 75% to 100% of the time) Maintaining (M) (The activity was rated as achieved last time and continues to occur approximately 75% to 100% of the time) Infrastructure Development: Data Collection and Team Structure Status Comments/Evidence 6. School-wide data (e.g., DIBELS, Curriculum-Based Measures, Office Discipline Referrals) are collected through an efficient and effective systematic process. 7. Statewide and other databases (e.g., Progress Monitoring and Reporting Network [PMRN], School- Wide Information System [SWIS]) are used to make data-based decisions. 8. School-wide data are presented to staff after each benchmarking session (e.g., staff meetings, team meetings, grade-level meetings). 9. School-wide data are used to evaluate the effectiveness of core academic programs. 10. School-wide data are used to evaluate the effectiveness of core behavior programs. 11. Curriculum-Based Measurement (e.g., DIBELS) data are used in conjunction with other data sources to identify students needing targeted group interventions and individualized interventions for academics. 103
111 12. Office Disciplinary Referral data are used in conjunction with other data sources to identify students needing targeted group interventions and individualized interventions for behavior. 13. Data are used to evaluate the effectiveness (RtI) of Tier 2 intervention programs. 14. Individual student data are utilized to determine response to Tier 3 interventions. 15. Special Education Eligibility determination is made using the RtI model for the following ESE programs: a. Emotional/Behavioral Disabilities (EBD) b. Specific Learning Disabilities (SLD) PS/RtI Implementation Assessment (Cont d) Scale: Not Started (N) (The activity occurs less than 24% of the time) In Progress (I) (The activity occurs approximately 25% to 74% of the time) Achieved (A) (The activity occurs approximately 75% to 100% of the time) Maintaining (M) (The activity was rated as achieved last time and continues to occur approximately 75% to 100% of the time) Infrastructure Development: Data Collection and Team Structure (Cont d) Status Comments/Evidence 16. The school staff has a process to select evidence-based practices. a. Tier 1 b. Tier 2 c. Tier The School-Based Leadership Team has a regular meeting schedule for problem-solving activities. 18. The School-Based Leadership Team evaluates target student s/students RtI at regular meetings. 19. The School-Based Leadership Team involves parents. 20. The School-Based Leadership Team has regularly scheduled data day meetings to evaluate Tier 1 and Tier 2 data. 104
112 Additional Comments/Evidence: PS/RtI Implementation Assessment (Cont d) Scale: Not Started (N) (The activity occurs less than 24% of the time) In Progress (I) (The activity occurs approximately 25% to 74% of the time) Achieved (A) (The activity occurs approximately 75% to 100% of the time) Maintaining (M) (The activity was rated as achieved last time and continues to occur approximately 75% to 100% of the time) Implementation: Three-Tiered Intervention System and Problem-Solving Process Status Comments/Evidence 21. The school has established a three-tiered system of service delivery. a. Tier 1 Academic Core Instruction clearly identified. b. Tier 1 Behavioral Core Instruction clearly identified. c. Tier 2 Academic Supplemental Instruction/Programs clearly identified. d. Tier 2 Behavioral Supplemental Instruction/Programs clearly identified. e. Tier 3 Academic Intensive Strategies/Programs are evidence-based. f. Tier 3 Behavioral Intensive Strategies/Programs are evidence-based. 22. Teams (e.g., School-Based Leadership Team, Problem- Solving Team, Intervention Assistance Team) implement effective problem solving procedures including: a. Problem is defined as a data-based discrepancy (GAP Analysis) between what is expected and what is occurring (includes peer and benchmark data). 105
113 b. Replacement behaviors (e.g., reading performance targets, homework completion targets) are clearly defined. c. Problem analysis is conducted using available data and evidence-based hypotheses. d. Intervention plans include evidence-based (e.g., research-based, data-based) strategies. e. Intervention support personnel are identified and scheduled for all interventions. PS/RtI Implementation Assessment (Cont d) Scale: Not Started (N) (The activity occurs less than 24% of the time) In Progress (I) (The activity occurs approximately 25% to 74% of the time) Achieved (A) (The activity occurs approximately 75% to 100% of the time) Maintaining (M) (The activity was rated as achieved last time and continues to occur approximately 75% to 100% of the time) Implementation: Three-Tiered Intervention System and Problem-Solving Process (Cont d) Status Comments/Evidence f. Intervention integrity is documented. g. Response to intervention is evaluated through systematic data collection. h. Changes are made to intervention based on student response. i. Parents are routinely involved in implementation of interventions. Additional Comments/Evidence: 106
114 107
115 PS/RtI Implementation Assessment (Cont d) Scale: Not Started (N) (The activity occurs less than 24% of the time) In Progress (I) (The activity occurs approximately 25% to 74% of the time) Achieved (A) (The activity occurs approximately 75% to 100% of the time) Maintaining (M) (The activity was rated as achieved last time and continues to occur approximately 75% to 100% of the time) Implementation: Monitoring and Action Planning Status Comments/Evidence 23. A strategic plan (implementation plan) exists and is used by the School-Based Leadership Team to guide implementation of PS/RtI. 24. The School-Based Leadership Team meets at least twice each year to review data and implementation issues. 25. The School-Based Leadership Team meets at least twice each year with the District Leadership Team to review data and implementation issues. 26. Changes are made to the implementation plan as a result of school and district leadership team data-based decisions. 27. Feedback on the outcomes of the PS/RtI Project is provided to school-based faculty and staff at least yearly. Additional Comments/Evidence: 108

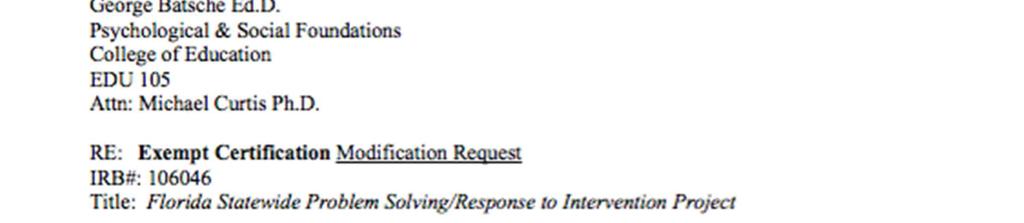
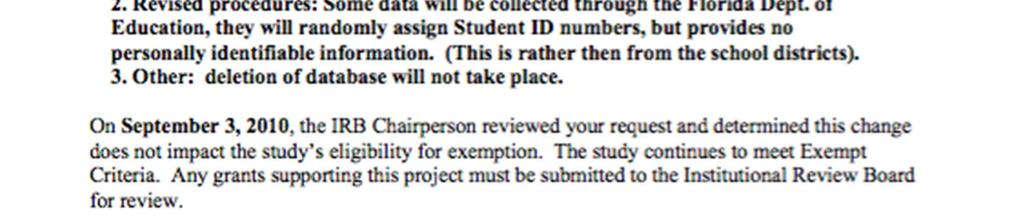
116 Appendix F: IRB Exemption Certificate 109
117 110
A Guide to Adequate Yearly Progress Analyses in Nevada 2007 Nevada Department of Education
 A Guide to Adequate Yearly Progress Analyses in Nevada 2007 Nevada Department of Education Note: Additional information regarding AYP Results from 2003 through 2007 including a listing of each individual
Instructional Intervention/Progress Monitoring (IIPM) Model Pre/Referral Process. and. Special Education Comprehensive Evaluation.
 Model Pre/Referral Process. and. Special Education Comprehensive Evaluation.") Instructional Intervention/Progress Monitoring (IIPM) Model Pre/Referral Process and Special Education Comprehensive Evaluation for Culturally and Linguistically Diverse (CLD) Students Guidelines and Resources
Instructional Intervention/Progress Monitoring (IIPM) Model Pre/Referral Process and Special Education Comprehensive Evaluation for Culturally and Linguistically Diverse (CLD) Students Guidelines and Resources
5 Programmatic. The second component area of the equity audit is programmatic. Equity
 5 Programmatic Equity It is one thing to take as a given that approximately 70 percent of an entering high school freshman class will not attend college, but to assign a particular child to a curriculum
Applying Florida s Planning and Problem-Solving Process (Using RtI Data) in Virtual Settings
 in Virtual Settings") Applying Florida s Planning and Problem-Solving Process (Using RtI Data) in Virtual Settings As Florida s educational system continues to engage in systemic reform resulting in integrated efforts toward
Applying Florida s Planning and Problem-Solving Process (Using RtI Data) in Virtual Settings As Florida s educational system continues to engage in systemic reform resulting in integrated efforts toward
An Empirical Analysis of the Effects of Mexican American Studies Participation on Student Achievement within Tucson Unified School District
 An Empirical Analysis of the Effects of Mexican American Studies Participation on Student Achievement within Tucson Unified School District Report Submitted June 20, 2012, to Willis D. Hawley, Ph.D., Special
African American Male Achievement Update
 Report from the Department of Research, Evaluation, and Assessment Number 8 January 16, 2009 African American Male Achievement Update AUTHOR: Hope E. White, Ph.D., Program Evaluation Specialist Department
California Professional Standards for Education Leaders (CPSELs)
") Standard 1 STANDARD 1: DEVELOPMENT AND IMPLEMENTATION OF A SHARED VISION Education leaders facilitate the development and implementation of a shared vision of learning and growth of all students. Element
Standard 1 STANDARD 1: DEVELOPMENT AND IMPLEMENTATION OF A SHARED VISION Education leaders facilitate the development and implementation of a shared vision of learning and growth of all students. Element
Shelters Elementary School
 Shelters Elementary School August 2, 24 Dear Parents and Community Members: We are pleased to present you with the (AER) which provides key information on the 23-24 educational progress for the Shelters
Foundations of Bilingual Education. By Carlos J. Ovando and Mary Carol Combs
 Foundations of Bilingual Education T tb k Bili l d ESL Cl Textbook: Bilingual and ESL Classrooms By Carlos J. Ovando and Mary Carol Combs Chapter 2 Policy and Programs The Politics of Bilingual Education
ISD 2184, Luverne Public Schools. xcvbnmqwertyuiopasdfghjklzxcv. Local Literacy Plan bnmqwertyuiopasdfghjklzxcvbn
 qwertyuiopasdfghjklzxcvbnmqw ertyuiopasdfghjklzxcvbnmqwert yuiopasdfghjklzxcvbnmqwertyui opasdfghjklzxcvbnmqwertyuiopa sdfghjklzxcvbnmqwertyuiopasdf ghjklzxcvbnmqwertyuiopasdfghj klzxcvbnmqwertyuiopasdfghjklz
MIDDLE SCHOOL. Academic Success through Prevention, Intervention, Remediation, and Enrichment Plan (ASPIRE)
") MIDDLE SCHOOL Academic Success through Prevention, Intervention, Remediation, and Enrichment Plan (ASPIRE) Board Approved July 28, 2010 Manual and Guidelines ASPIRE MISSION The mission of the ASPIRE program
MIDDLE SCHOOL Academic Success through Prevention, Intervention, Remediation, and Enrichment Plan (ASPIRE) Board Approved July 28, 2010 Manual and Guidelines ASPIRE MISSION The mission of the ASPIRE program
Systemic Improvement in the State Education Agency
 Systemic Improvement in the State Education Agency A Rubric-Based Tool to Develop Implement the State Systemic Improvement Plan (SSIP) Achieve an Integrated Approach to Serving All Students Continuously
Kansas Adequate Yearly Progress (AYP) Revised Guidance
 Revised Guidance") Kansas State Department of Education Kansas Adequate Yearly Progress (AYP) Revised Guidance Based on Elementary & Secondary Education Act, No Child Left Behind (P.L. 107-110) Revised May 2010 Revised May
Kansas State Department of Education Kansas Adequate Yearly Progress (AYP) Revised Guidance Based on Elementary & Secondary Education Act, No Child Left Behind (P.L. 107-110) Revised May 2010 Revised May
Data-Based Decision Making: Academic and Behavioral Applications
 Data-Based Decision Making: Academic and Behavioral Applications Just Read RtI Institute July, 008 Stephanie Martinez Florida Positive Behavior Support Project George Batsche Florida Problem-Solving/RtI
Early Warning System Implementation Guide
 Linking Research and Resources for Better High Schools betterhighschools.org September 2010 Early Warning System Implementation Guide For use with the National High School Center s Early Warning System
Getting Results Continuous Improvement Plan
 Page of 9 9/9/0 Department of Education Market Street Harrisburg, PA 76-0 Getting Results Continuous Improvement Plan 0-0 Principal Name: Ms. Sharon Williams School Name: AGORA CYBER CS District Name:
State Parental Involvement Plan
 A Toolkit for Title I Parental Involvement Section 3 Tools Page 41 Tool 3.1: State Parental Involvement Plan Description This tool serves as an example of one SEA s plan for supporting LEAs and schools
Governors and State Legislatures Plan to Reauthorize the Elementary and Secondary Education Act
 Governors and State Legislatures Plan to Reauthorize the Elementary and Secondary Education Act Summary In today s competitive global economy, our education system must prepare every student to be successful
RtI: Changing the Role of the IAT
 RtI: Changing the Role of the IAT Aimee A. Kirsch Akron Public Schools Akron, Ohio akirsch@akron.k12.oh.us Urban Special Education Leadership Collaborative November 3, 2006 1 Introductions Akron Public
Evaluation of Teach For America:
 EA15-536-2 Evaluation of Teach For America: 2014-2015 Department of Evaluation and Assessment Mike Miles Superintendent of Schools This page is intentionally left blank. ii Evaluation of Teach For America:
Cuero Independent School District
 Cuero Independent School District Texas Superintendent: Henry Lind Primary contact: Debra Baros, assistant superintendent* 1,985 students, prek-12, rural District Description Cuero Independent School District
NCEO Technical Report 27
 Home About Publications Special Topics Presentations State Policies Accommodations Bibliography Teleconferences Tools Related Sites Interpreting Trends in the Performance of Special Education Students
Trends & Issues Report
 Trends & Issues Report prepared by David Piercy & Marilyn Clotz Key Enrollment & Demographic Trends Options Identified by the Eight Focus Groups General Themes 4J Eugene School District 4J Eugene, Oregon
Massachusetts Department of Elementary and Secondary Education. Title I Comparability
 Massachusetts Department of Elementary and Secondary Education Title I Comparability 2009-2010 Title I provides federal financial assistance to school districts to provide supplemental educational services
Miami-Dade County Public Schools
 ENGLISH LANGUAGE LEARNERS AND THEIR ACADEMIC PROGRESS: 2010-2011 Author: Aleksandr Shneyderman, Ed.D. January 2012 Research Services Office of Assessment, Research, and Data Analysis 1450 NE Second Avenue,
Collaborative Classroom Co-Teaching in Inclusive Settings Course Outline
 Collaborative Classroom Co-Teaching in Inclusive Settings Course Outline Course Description The purpose of this course is to provide educators with a strong foundation for planning, implementing and maintaining
Cooper Upper Elementary School
 LIVONIA PUBLIC SCHOOLS http://cooper.livoniapublicschools.org 215-216 Annual Education Report BOARD OF EDUCATION 215-16 Colleen Burton, President Dianne Laura, Vice President Tammy Bonifield, Secretary
NATIONAL CENTER FOR EDUCATION STATISTICS RESPONSE TO RECOMMENDATIONS OF THE NATIONAL ASSESSMENT GOVERNING BOARD AD HOC COMMITTEE ON.
 NATIONAL CENTER FOR EDUCATION STATISTICS RESPONSE TO RECOMMENDATIONS OF THE NATIONAL ASSESSMENT GOVERNING BOARD AD HOC COMMITTEE ON NAEP TESTING AND REPORTING OF STUDENTS WITH DISABILITIES (SD) AND ENGLISH
EFFECTS OF MATHEMATICS ACCELERATION ON ACHIEVEMENT, PERCEPTION, AND BEHAVIOR IN LOW- PERFORMING SECONDARY STUDENTS
 EFFECTS OF MATHEMATICS ACCELERATION ON ACHIEVEMENT, PERCEPTION, AND BEHAVIOR IN LOW- PERFORMING SECONDARY STUDENTS Jennifer Head, Ed.S Math and Least Restrictive Environment Instructional Coach Department
Pyramid. of Interventions
 Pyramid of Interventions Introduction to the Pyramid of Interventions Quick Guide A system of academic and behavioral support for ALL learners Cincinnati Public Schools is pleased to provide you with our
School Performance Plan Middle Schools
 SY 2012-2013 School Performance Plan Middle Schools 734 Middle ALternative Program @ Lombard, Principal Roger Shaw (Interim), Executive Director, Network Facilitator PLEASE REFER TO THE SCHOOL PERFORMANCE
Minnesota s Consolidated State Plan Under the Every Student Succeeds Act (ESSA)
") Minnesota s Consolidated State Plan Under the Every Student Succeeds Act (ESSA) To be submitted to the U.S. Department of Education in September 2017 IMPORTANT NOTE: This is an early draft prepared for
Minnesota s Consolidated State Plan Under the Every Student Succeeds Act (ESSA) To be submitted to the U.S. Department of Education in September 2017 IMPORTANT NOTE: This is an early draft prepared for
Bureau of Teaching and Learning Support Division of School District Planning and Continuous Improvement GETTING RESULTS
 PENNSYLVANIA DEPARTMENT OF EDUCATION A Framework for Continuous School Improvement Planning (Summer 2009) GETTING RESULTS Continuous School Improvement Plan Gen 6-2 Year Plan Required for Schools in School
Implementing Response to Intervention (RTI) National Center on Response to Intervention
 National Center on Response to Intervention") Implementing (RTI) Session Agenda Introduction: What is implementation? Why is it important? (NCRTI) Stages of Implementation Considerations for implementing RTI Ineffective strategies Effective strategies
Implementing (RTI) Session Agenda Introduction: What is implementation? Why is it important? (NCRTI) Stages of Implementation Considerations for implementing RTI Ineffective strategies Effective strategies
Cooper Upper Elementary School
 LIVONIA PUBLIC SCHOOLS www.livoniapublicschools.org/cooper 213-214 BOARD OF EDUCATION 213-14 Mark Johnson, President Colleen Burton, Vice President Dianne Laura, Secretary Tammy Bonifield, Trustee Dan
BENCHMARK TREND COMPARISON REPORT:
 National Survey of Student Engagement (NSSE) BENCHMARK TREND COMPARISON REPORT: CARNEGIE PEER INSTITUTIONS, 2003-2011 PREPARED BY: ANGEL A. SANCHEZ, DIRECTOR KELLI PAYNE, ADMINISTRATIVE ANALYST/ SPECIALIST
Executive Summary. Belle Terre Elementary School
 Flagler County School District Dr. TC Culver, Principal 5545 Belle Terre Pkwy Palm Coast, FL 32137-3847 Document Generated On February 6, 2013 TABLE OF CONTENTS Introduction 1 Description of the School
EDUCATIONAL ATTAINMENT
 EDUCATIONAL ATTAINMENT By 2030, at least 60 percent of Texans ages 25 to 34 will have a postsecondary credential or degree. Target: Increase the percent of Texans ages 25 to 34 with a postsecondary credential.
Your Guide to. Whole-School REFORM PIVOT PLAN. Strengthening Schools, Families & Communities
 Your Guide to Whole-School REFORM PIVOT PLAN Strengthening Schools, Families & Communities Why a Pivot Plan? In order to tailor our model of Whole-School Reform to recent changes seen at the federal level
The State and District RtI Plans
 The State and District RtI Plans April 11, 2008 Presented by: MARICA CULLEN and ELIZABETH HANSELMAN As of January 1, 2009, all school districts will be required to have a district RtI plan. This presentation
2013 TRIAL URBAN DISTRICT ASSESSMENT (TUDA) RESULTS
 RESULTS") 3 TRIAL URBAN DISTRICT ASSESSMENT (TUDA) RESULTS Achievement and Accountability Office December 3 NAEP: The Gold Standard The National Assessment of Educational Progress (NAEP) is administered in reading
3 TRIAL URBAN DISTRICT ASSESSMENT (TUDA) RESULTS Achievement and Accountability Office December 3 NAEP: The Gold Standard The National Assessment of Educational Progress (NAEP) is administered in reading
Elementary and Secondary Education Act ADEQUATE YEARLY PROGRESS (AYP) 1O1
 1O1") Elementary and Secondary Education Act ADEQUATE YEARLY PROGRESS (AYP) 1O1 1 AYP Elements ALL students proficient by 2014 Separate annual proficiency goals in reading & math 1% can be proficient at district
Elementary and Secondary Education Act ADEQUATE YEARLY PROGRESS (AYP) 1O1 1 AYP Elements ALL students proficient by 2014 Separate annual proficiency goals in reading & math 1% can be proficient at district
Exceptional Student Education Monitoring and Assistance On-Site Visit Report Sarasota County School District February 12-14, 2014
 2013-14 Exceptional Student Education Monitoring and Assistance On-Site Visit Report Sarasota County School District February 12-14, 2014 Florida Department of Education Bureau of Exceptional Education
Running Head GAPSS PART A 1
 Running Head GAPSS PART A 1 Current Reality and GAPSS Assignment Carole Bevis PL & Technology Innovation (ITEC 7460) Kennesaw State University Ed.S. Instructional Technology, Spring 2014 GAPSS PART A 2
2012 ACT RESULTS BACKGROUND
 Report from the Office of Student Assessment 31 November 29, 2012 2012 ACT RESULTS AUTHOR: Douglas G. Wren, Ed.D., Assessment Specialist Department of Educational Leadership and Assessment OTHER CONTACT
School Leadership Rubrics
 School Leadership Rubrics The School Leadership Rubrics define a range of observable leadership and instructional practices that characterize more and less effective schools. These rubrics provide a metric
RAISING ACHIEVEMENT BY RAISING STANDARDS. Presenter: Erin Jones Assistant Superintendent for Student Achievement, OSPI
 RAISING ACHIEVEMENT BY RAISING STANDARDS Presenter: Erin Jones Assistant Superintendent for Student Achievement, OSPI Agenda Introductions Definitions History of the work Strategies Next steps Debrief
CONNECTICUT GUIDELINES FOR EDUCATOR EVALUATION. Connecticut State Department of Education
 CONNECTICUT GUIDELINES FOR EDUCATOR EVALUATION Connecticut State Department of Education October 2017 Preface Connecticut s educators are committed to ensuring that students develop the skills and acquire
Orleans Central Supervisory Union
 Orleans Central Supervisory Union Vermont Superintendent: Ron Paquette Primary contact: Ron Paquette* 1,142 students, prek-12, rural District Description Orleans Central Supervisory Union (OCSU) is the
Race, Class, and the Selective College Experience
 Race, Class, and the Selective College Experience Thomas J. Espenshade Alexandria Walton Radford Chang Young Chung Office of Population Research Princeton University December 15, 2009 1 Overview of NSCE
K-12 Academic Intervention Plan. Academic Intervention Services (AIS) & Response to Intervention (RtI)
 & Response to Intervention (RtI)") K-12 Academic Intervention Plan Academic Intervention Services (AIS) & Response to Intervention (RtI) September 2016 June 2018 2016 2018 K 12 Academic Intervention Plan Table of Contents AIS Overview...Page
K-12 Academic Intervention Plan Academic Intervention Services (AIS) & Response to Intervention (RtI) September 2016 June 2018 2016 2018 K 12 Academic Intervention Plan Table of Contents AIS Overview...Page
FOUR STARS OUT OF FOUR
 Louisiana FOUR STARS OUT OF FOUR Louisiana s proposed high school accountability system is one of the best in the country for high achievers. Other states should take heed. The Purpose of This Analysis
A Pilot Study on Pearson s Interactive Science 2011 Program
 Final Report A Pilot Study on Pearson s Interactive Science 2011 Program Prepared by: Danielle DuBose, Research Associate Miriam Resendez, Senior Researcher Dr. Mariam Azin, President Submitted on August
Children and Adults with Attention-Deficit/Hyperactivity Disorder Public Policy Agenda for Children
 Children and Adults with Attention-Deficit/Hyperactivity Disorder Public Policy Agenda for Children 2008 2009 Accepted by the Board of Directors October 31, 2008 Introduction CHADD (Children and Adults
Practices Worthy of Attention Step Up to High School Chicago Public Schools Chicago, Illinois
 Step Up to High School Chicago Public Schools Chicago, Illinois Summary of the Practice. Step Up to High School is a four-week transitional summer program for incoming ninth-graders in Chicago Public Schools.
64% :Trenton High School. School Grade A; AYP-No. *FCAT Level 3 and Above: Reading-80%; Math-
 I. Current School Status: A. School Information: 1. School-Level Information: a. School: Trenton High School b. Principal's name: Cheri Langford c. School Advisory Council chair's name: Heather Rucker
Definitions for KRS to Committee for Mathematics Achievement -- Membership, purposes, organization, staffing, and duties
 158.842 Definitions for KRS 158.840 to 158.844 -- Committee for Mathematics Achievement -- Membership, purposes, organization, staffing, and duties of committee -- Report to Interim Joint Committee on
Legacy of NAACP Salary equalization suits.
 Why tests, anyway? Legacy of NAACP Salary equalization suits. If you can t beat em, test em. Boom! Legacy of teacher tests NTE PRAXIS-II Pearson Content Examinations GRE ACT SAT All are statistically significantly
Exceptional Student Education Monitoring and Assistance On-Site Visit Report. Sarasota County School District April 25-27, 2016
 2015-16 Exceptional Student Education Monitoring and Assistance On-Site Visit Report Sarasota County School District April 25-27, 2016 This publication is produced through the Bureau of Exceptional Education
SSIS SEL Edition Overview Fall 2017
 Image by Photographer s Name (Credit in black type) or Image by Photographer s Name (Credit in white type) Use of the new SSIS-SEL Edition for Screening, Assessing, Intervention Planning, and Progress
1.0 INTRODUCTION. The purpose of the Florida school district performance review is to identify ways that a designated school district can:
 1.0 INTRODUCTION 1.1 Overview Section 11.515, Florida Statutes, was created by the 1996 Florida Legislature for the purpose of conducting performance reviews of school districts in Florida. The statute
Proficiency Illusion
 KINGSBURY RESEARCH CENTER Proficiency Illusion Deborah Adkins, MS 1 Partnering to Help All Kids Learn NWEA.org 503.624.1951 121 NW Everett St., Portland, OR 97209 Executive Summary At the heart of the
Effective practices of peer mentors in an undergraduate writing intensive course
 Effective practices of peer mentors in an undergraduate writing intensive course April G. Douglass and Dennie L. Smith * Department of Teaching, Learning, and Culture, Texas A&M University This article
Testimony to the U.S. Senate Committee on Health, Education, Labor and Pensions. John White, Louisiana State Superintendent of Education
 Testimony to the U.S. Senate Committee on Health, Education, Labor and Pensions John White, Louisiana State Superintendent of Education October 3, 2017 Chairman Alexander, Senator Murray, members of the
Meeting the Challenges of No Child Left Behind in U.S. Immersion Education
 The Bridge: From Research to Practice Meeting the Challenges of No Child Left Behind in U.S. Immersion Education Mike Anderson, Ph.D., Visiting Assistant Professor, University of Minnesota, Minneapolis,
BSP !!! Trainer s Manual. Sheldon Loman, Ph.D. Portland State University. M. Kathleen Strickland-Cohen, Ph.D. University of Oregon
 Basic FBA to BSP Trainer s Manual Sheldon Loman, Ph.D. Portland State University M. Kathleen Strickland-Cohen, Ph.D. University of Oregon Chris Borgmeier, Ph.D. Portland State University Robert Horner,
Executive Summary. Sidney Lanier Senior High School
 Montgomery County Board of Education Dr. Antonio Williams, Principal 1756 South Court Street Montgomery, AL 36104 Document Generated On October 7, 2015 TABLE OF CONTENTS Introduction 1 Description of the
National Survey of Student Engagement Spring University of Kansas. Executive Summary
 National Survey of Student Engagement Spring 2010 University of Kansas Executive Summary Overview One thousand six hundred and twenty-one (1,621) students from the University of Kansas completed the web-based
EDUCATIONAL ATTAINMENT
 EDUCATIONAL ATTAINMENT By 2030, at least 60 percent of Texans ages 25 to 34 will have a postsecondary credential or degree. Target: Increase the percent of Texans ages 25 to 34 with a postsecondary credential.
The Condition of College & Career Readiness 2016
 The Condition of College and Career Readiness This report looks at the progress of the 16 ACT -tested graduating class relative to college and career readiness. This year s report shows that 64% of students
Executive Summary. Laurel County School District. Dr. Doug Bennett, Superintendent 718 N Main St London, KY
 Dr. Doug Bennett, Superintendent 718 N Main St London, KY 40741-1222 Document Generated On January 13, 2014 TABLE OF CONTENTS Introduction 1 Description of the School System 2 System's Purpose 4 Notable
Identifying Students with Specific Learning Disabilities Part 3: Referral & Evaluation Process; Documentation Requirements
 Identifying Students with Specific Learning Disabilities Part 3: Referral & Evaluation Process; Documentation Requirements Section 3 & Section 4: 62-66 # Reminder: Watch for a blue box in top right corner
ILLINOIS DISTRICT REPORT CARD
 -6-525-2- Hazel Crest SD 52-5 Hazel Crest SD 52-5 Hazel Crest, ILLINOIS 2 8 ILLINOIS DISTRICT REPORT CARD and federal laws require public school districts to release report cards to the public each year.
UK Institutional Research Brief: Results of the 2012 National Survey of Student Engagement: A Comparison with Carnegie Peer Institutions
 UK Institutional Research Brief: Results of the 2012 National Survey of Student Engagement: A Comparison with Carnegie Peer Institutions November 2012 The National Survey of Student Engagement (NSSE) has
Rhyne Elementary School Improvement Plan
 2014-2016 Rhyne Elementary School Improvement Plan Rhyne Elementary School Contact Information School Rhyne Elementary School Courier Number 360484 Street Address 1900 West Davidson Avenue Phone Number
How To: Structure Classroom Data Collection for Individual Students
 How the Common Core Works Series 2013 Jim Wright www.interventioncentral.org 1 How To: Structure Classroom Data Collection for Individual Students When a student is struggling in the classroom, the teacher
Short Term Action Plan (STAP)
") Short Term Action Plan (STAP) 10/14/2017 1 Managing Complex Change Vision Skills Incentives Resources Action Plan Assessment Meaningful Change Skills Incentives Resources Action Plan Assessment Confusion
Short Term Action Plan (STAP) 10/14/2017 1 Managing Complex Change Vision Skills Incentives Resources Action Plan Assessment Meaningful Change Skills Incentives Resources Action Plan Assessment Confusion
Transportation Equity Analysis
 2015-16 Transportation Equity Analysis Each year the Seattle Public Schools updates the Transportation Service Standards and bus walk zone boundaries for use in the upcoming school year. For the 2014-15
Delaware Performance Appraisal System Building greater skills and knowledge for educators
 Delaware Performance Appraisal System Building greater skills and knowledge for educators DPAS-II Guide for Administrators (Assistant Principals) Guide for Evaluating Assistant Principals Revised August
Charter School Performance Comparable to Other Public Schools; Stronger Accountability Needed
 April 2005 Report No. 05-21 Charter School Performance Comparable to Other Public Schools; Stronger Accountability Needed at a glance On average, charter school students are academically behind when they
Progress Monitoring & Response to Intervention in an Outcome Driven Model
 Progress Monitoring & Response to Intervention in an Outcome Driven Model Oregon RTI Summit Eugene, Oregon November 17, 2006 Ruth Kaminski Dynamic Measurement Group rkamin@dibels.org Roland H. Good III
QUESTIONS ABOUT ACCESSING THE HANDOUTS AND THE POWERPOINT
 Answers to Questions Posed During Pearson aimsweb Webinar: Special Education Leads: Quality IEPs and Progress Monitoring Using Curriculum-Based Measurement (CBM) Mark R. Shinn, Ph.D. QUESTIONS ABOUT ACCESSING
The Oregon Literacy Framework of September 2009 as it Applies to grades K-3
 The Oregon Literacy Framework of September 2009 as it Applies to grades K-3 The State Board adopted the Oregon K-12 Literacy Framework (December 2009) as guidance for the State, districts, and schools
Aligning and Improving Systems for Special Education Services in St Paul Public Schools. Dr. Elizabeth Keenan Assistant Superintendent
 Aligning and Improving Systems for Special Education Services in St Paul Public Schools Dr. Elizabeth Keenan Assistant Superintendent 1 Aligning and Improving Systems for Special Education Student Purpose:
STANDARDS AND RUBRICS FOR SCHOOL IMPROVEMENT 2005 REVISED EDITION
 Arizona Department of Education Tom Horne, Superintendent of Public Instruction STANDARDS AND RUBRICS FOR SCHOOL IMPROVEMENT 5 REVISED EDITION Arizona Department of Education School Effectiveness Division
Iowa School District Profiles. Le Mars
 Iowa School District Profiles Overview This profile describes enrollment trends, student performance, income levels, population, and other characteristics of the public school district. The report utilizes
Status of Women of Color in Science, Engineering, and Medicine
 Status of Women of Color in Science, Engineering, and Medicine The figures and tables below are based upon the latest publicly available data from AAMC, NSF, Department of Education and the US Census Bureau.
Greek Teachers Attitudes toward the Inclusion of Students with Special Educational Needs
 American Journal of Educational Research, 2014, Vol. 2, No. 4, 208-218 Available online at http://pubs.sciepub.com/education/2/4/6 Science and Education Publishing DOI:10.12691/education-2-4-6 Greek Teachers
Newburgh Enlarged City School District Academic. Academic Intervention Services Plan
 Newburgh Enlarged City School District Academic Academic Intervention Services Plan Revised September 2016 October 2015 Newburgh Enlarged City School District Elementary Academic Intervention Services
Gaps in Family and Teacher Involvement Beliefs
 Walden University ScholarWorks Walden Dissertations and Doctoral Studies Walden Dissertations and Doctoral Studies Collection 2017 Gaps in Family and Teacher Involvement Beliefs Malia DeCourcy Sakamoto
John F. Kennedy Middle School
 John F. Kennedy Middle School CUPERTINO UNION SCHOOL DISTRICT Steven Hamm, Principal hamm_steven@cusdk8.org School Address: 821 Bubb Rd. Cupertino, CA 95014-4938 (408) 253-1525 CDS Code: 43-69419-6046890
Executive Summary. Walker County Board of Education. Dr. Jason Adkins, Superintendent 1710 Alabama Avenue Jasper, AL 35501
 Dr. Jason Adkins, Superintendent 1710 Alabama Avenue Jasper, AL 35501 Document Generated On November 3, 2016 TABLE OF CONTENTS Introduction 1 Description of the School System 2 System's Purpose 4 Notable
PROFESSIONAL TREATMENT OF TEACHERS AND STUDENT ACADEMIC ACHIEVEMENT. James B. Chapman. Dissertation submitted to the Faculty of the Virginia
 PROFESSIONAL TREATMENT OF TEACHERS AND STUDENT ACADEMIC ACHIEVEMENT by James B. Chapman Dissertation submitted to the Faculty of the Virginia Polytechnic Institute and State University in partial fulfillment
Basic Skills Initiative Project Proposal Date Submitted: March 14, Budget Control Number: (if project is continuing)
") Basic Skills Initiative Project Proposal 2016-2017 Date Submitted: March 14, 2016 Check One: New Proposal: Continuing Project: X Budget Control Number: (if project is continuing) Control # 87-413 - EOPS
Basic Skills Initiative Project Proposal 2016-2017 Date Submitted: March 14, 2016 Check One: New Proposal: Continuing Project: X Budget Control Number: (if project is continuing) Control # 87-413 - EOPS
Hokulani Elementary School
 Hokulani Elementary Code: 109 Status and Improvement Report Year -11 Contents Focus On Standards Grades K-5 This Status and Improvement Report has been prepared as part of the Department's education accountability
ASCD Recommendations for the Reauthorization of No Child Left Behind
 ASCD Recommendations for the Reauthorization of No Child Left Behind The Association for Supervision and Curriculum Development (ASCD) represents 178,000 educators. Our membership is composed of teachers,
5 Early years providers
 5 Early years providers What this chapter covers This chapter explains the action early years providers should take to meet their duties in relation to identifying and supporting all children with special
Expanded Learning Time Expectations for Implementation
 I. ELT Design is Driven by Focused School-wide Priorities The school s ELT design (schedule, staff, instructional approaches, assessment systems, budget) is driven by no more than three school-wide priorities,
ILLINOIS DISTRICT REPORT CARD
 -6-525-2- HAZEL CREST SD 52-5 HAZEL CREST SD 52-5 HAZEL CREST, ILLINOIS and federal laws require public school districts to release report cards to the public each year. 2 7 ILLINOIS DISTRICT REPORT CARD
Colorado s Unified Improvement Plan for Schools for Online UIP Report
 Colorado s Unified Improvement Plan for Schools for 2015-16 Online UIP Report Organization Code: 2690 District Name: PUEBLO CITY 60 Official 2014 SPF: 1-Year Executive Summary How are students performing?