EFFECTIVELY UTILIZING DATA TO INFORM DECISION-MAKING (DISPROPORTIONALITY)
|
|
|
- Sylvia Potter
- 6 years ago
- Views:
Transcription

1 EFFECTIVELY UTILIZING DATA TO INFORM DECISION-MAKING (DISPROPORTIONALITY) LRE Training Module Office of Special Education New Jersey Department of Education 2015/2016 School Year Photo:


2 2 Welcome! Introduction of Presenter and Professional Background Purpose and Objectives of the Workshop General Housekeeping Sign In Reference Documents Facilities Electronic Devices Workshop Time Frame
3 3 Workshop Goals Define disproportionate representation and identify the potential success gaps associated with the causes of disproportionate representation of minority students in our special education classrooms. Identify quality indicators associated with addressing success gaps among students and district data elements that inform these indicators. Review the Optional Data Collection tool to identify and address patterns of referral and placement of students. To utilize the Equity, Inclusion, and Opportunity Addressing Success Gaps Rubric to identify areas for focus including gaps in achievement, discipline, over identification and placement.
4 What is SWIFT? NJDOE OSEP

5 5 Utilizing Data to Address Disproportionality
6 6 Why Utilize Data to Address Disproportionality? If NJDOE Then Then Then Provides training and technical assistance on strategies for appropriate collection, analysis, interpretation and use of data to address success gaps that contribute toward the disproportionate representation of minority students in special education more schools will use the NJ Optional Data Collection Tool and Addressing Success Gap Rubric to analyze quality indicators that measure school effectiveness school leaders will use data that informs the improvement of quality indicators educators will correctly use data to reduce success gaps in quality indicators educators will focus on school improvement measures that support high quality instruction and inclusiveness for all students student accountability measures will demonstrate growth particularly for minority students students are provided an education specific, responsive, and relevant to needs resulting in education success an increased percentage of students with IEPs will benefit from education in general education settings for a greater percentage of their school day.
")
7 7 Equality & Social Justice Brown vs. Board of Education Section 504 of the Rehabilitation Act Public Law Individuals with Disabilities Education Act No Child Left Behind (NCLB) Individuals with Disabilities Education Improvement Act (IDEIA) Results Driven Accountability North Charleston

8 8 Disproportionate Representation: What is it and why is it important for us to identify and address it? A child miseducated is a child lost. -John F. Kennedy Photo:

9 What is Disproportionality? Disproportionality is an over-representation in special education services, or under-representation of a particular racial or ethnic group in special or gifted education relative to the presence of this group in the overall student population. - National Association for Bilingual Education, 2002 Photo:
10 Disproportionality Disproportionality exists in various forms: National, state and district levels over-identification of students as disabled, or under identified as gifted/talented. Over-representation can occur in classification, placement and suspension. Under-representation can occur in intervention services, resources, access to programs and rigorous curriculum and instruction. Higher incidence rates for certain populations in specific special education categories, such as cognitively impaired or emotionally handicapped. Excessive incidence, duration, and types of disciplinary actions, including suspensions and expulsions experienced by minority students.
11 Why is Disproportionality a Concern? Services provided are not designed to meet student needs. Labeling a student tends to remain throughout school career. Lower expectations can lead to diminished academic and post-secondary opportunities. Students identified as disabled have a greater risk of dropping out. Students in special education programs may be educated separate from their typical peers and denied access to general education curriculum. Students identified as disabled are often stigmatized socially contributing to social emotional challenges. The over identification of students from minority populations can contribute to significant racial separation, because they are more likely to be placed in segregated classes. Students who are not disabled are treated as if they are. National Education Association (2007). Truth in Labeling: Disproportionality in Special Education. (available online at
12 CASE STUDY: THE STORY OF JALEN At your tables, read the case study and as a group, identify all the possible indicators that may have contributed to the identification and placement of Jalen in a class for the cognitively impaired. Be prepared to share. NASP (2003). Portraits of the Children: Culturally Competent Assessment
13 Factors Contributing to Over-Identification and Disproportionality Discipline policies and practices Suspension/Expulsion Lack of interventions and variable rates of referrals Limited opportunities to learn in the classroom Variability in assessment practices Differential access to educational opportunities Family and community Detrimental views and interaction with families Teacher expectations and misconceptions Cultural biases District socio-demographics

14 IDEA 2004 Title 1(A)(601)(C)(12)(A) Greater efforts are needed to prevent the intensification of problems connected with mislabeling and high dropout rates among minority children with disabilities.
15 Federal Requirements The federal government monitors states on two performance indicators related to the disproportionate representation of minority students: Indicator B9: Percent of districts with disproportionate representation of racial and ethnic groups in special education and related services that is the result of inappropriate identification; and Indicator B10: Percent of districts with disproportionate representation of racial and ethnic groups in specific disability categories that is the result of inappropriate identification.
16 Federal Requirements 1. Determine which districts meet the state s definition of disproportionality. 2. Determine if disproportionality is due to inappropriate identification through a review of policies, procedures and practices. 3. Data is collected annually to determine if significant disproportionality base on race of ethnicity occurs relate to: 1. The identification of a child as a child with a disability; including particular disabilities. 2. Placement of a child in separate educational environments; and 3. Incidence, duration and type of disciplinary actions, including suspensions and expulsions.

17 Calculating Disproportionality States have the flexibility to choose their own definitions of disproportionality Methods for calculating disproportionality include; Risk ratios, weighted risk ratios, alternate risk ratios, composition, E-formula, etc. Thresholds for disproportionality (e.g., risk ratio thresholds of 2.0)
18 18 CALCULATION OF A RISK RATIO A relative risk GREATER than 1 means the risk is INCREASED for that population A relative risk of 1.0 means 1.5 there is NO association 1.3 between the risk factor and the population times the risk 2.5 times the risk 2.0 times the risk A relative risk LESS than 1 means the risk is decreased for that population Image recreated from:

19 NJ Calculating Risk New Jersey formula for calculating risk was developed with assistance from the United States Office for Civil Rights and uses multiple measures to determine disproportionate representation. The measure includes three descriptive statistics Unweighted risk ratio Risk rate comparison A measure of impact comparing expected vs. observed numbers of students identified as eligible for special education The measures included a statistical test of significance chi squared Districts are ranked on each of the three measures. Ranks for the three-year are totaled and those districts with the lowest ranks and an impact number of more than 25 students were identified as having disproportionate representation.
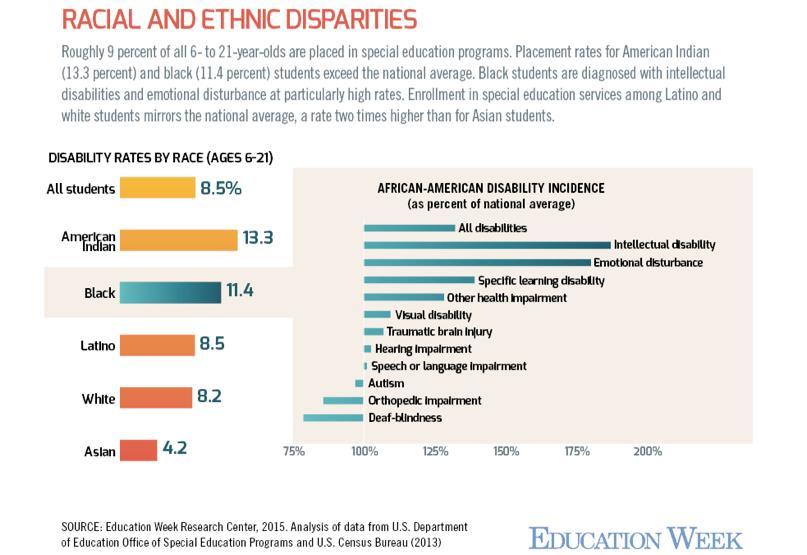
20 20 National Patterns of Disproportionality All Disabilities, age 6-21 (National Research Council Report) Group Risk Risk Ratio African American: 14.3% 1.2 times Native Am. Indian: 13.1% 1.1 times White: 12.1% 1.0 times Hispanic: 11.3%.9 times Asian Pacific-Islander: 5.3%.4 times Pearson, Jane, (2015) Disproportionality: What is it? What Can We Do About It? US Department of Education. (Available online at
21 21 National Patterns of Disproportionality Mental Retardation (MR) Cognitively Impaired Composition: 35% of Students served in the category of MR are African American; 17% of the overall student population is African-American Risk: Odds Ratio: 2.6% of African Americans are served in the category of MR Rate for African Americans is 2.4 times higher than that of White Students No other groups are overrepresented in MR Pearson, Jane, (2015) Disproportionality: What is it? What Can We Do About It? US Department of Education. (Available online at
22 22 National Patterns of Disproportionality Emotional Disturbance (ED) Composition: 26.4% of Students served in the category of ED are African American; 17% of the overall student population is African-American Risk: Odds Ratio: 1.6% of African-American Students are served in the category of ED Rate for African American Students is 1.6 times higher than that of White Students No other group overrepresented in ED Pearson, Jane, (2015) Disproportionality: What is it? What Can We Do About It? US Department of Education. (Available online at
23 23 National Patterns of Disproportionality Learning Disabilities (LD) Composition: 1.37% of Students with LD are Native American Indian; 1.1% of the overall student population is Native American Indian Risk: Odds Ratio: 7.3% of Native American Indian Students are in LD Native American Indian Students are 1.2 times more likely to be in LD than White Students No other group is overrepresented in LD Pearson, Jane, (2015) Disproportionality: What is it? What Can We Do About It? US Department of Education. (Available online at

24 24 Reflection: LRE Data Review your district trend data and answer the following: Is there anything about your data that surprises you? Do you have any questions about the data? Are there any areas you would like to investigate further? Photo:
25 SUCCESS FOR ALL REVIEW OF NATIONAL AND STATE SUCCESS GAPS Photo:

26 Definition of Success Gap Differences or gaps in a variety of educational factors and outcomes that affect the educational success for some groups of students compared to their peers. Results Driven Accountability require states to address achievement gaps. Identification and/or placement in special education Suspension/Expulsion College and Career Preparation Graduation Rates

27 National Identification/Placement Data
28 National Suspension/Expulsion Data K-12 60% 50% 40% Enrollment 16% Out of School Expulsion 34% 30% 20% 10% 0% White Two or More Races Hispanic/L atino of any Race Black/Afri can American Native Hawaiian/ Other Pacific Islander Asian American Indian/Ala ska Native Enrollment 51% 2% 24% 16% 0.50% 5% 0.50% In School Suspension 40% 3% 22% 32% 0.20% 1% 0.20% Out of School Suspension 36% 3% 23% 33% 0.40% 2% 2% Out of School Suspension Multiple 31% 3% 21% 42% 0.30% 1% 2% Expulsion 36% 3% 22% 34% 0.30% 1% 3% SOURCE: U.S. Department of Education, Office for Civil Rights, Civil Rights Data Collection,
29 National Suspension/Expulsion PreK 60% 50% Out of School Suspension 42% Enrollment 18% Out of School Suspension M 48% 40% 30% 20% 10% 0% White Two or More Hispanic/Latino Races of Black/Aftican any Race Native Hawaiian/Other American Pacific Islander Asian American Indian/Alaska Native Enrollment 43% 4% 29% 18% 1.00% 4% 2.00% Out of School Suspension 28% 3% 25% 42% 0.10% 1% 1% Out of School Suspension Multiple 26% 4% 20% 48% 0.10% 1% 0% SOURCE: U.S. Department of Education, Office for Civil Rights, Civil Rights Data Collection,
30 NAEP Achievement Data Reading

31 NAEP Achievement Data Reading
32 NAEP Achievement Data Mathematics
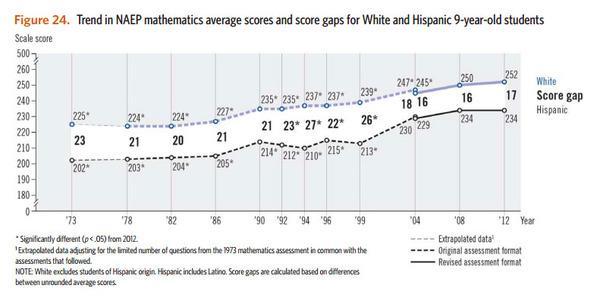
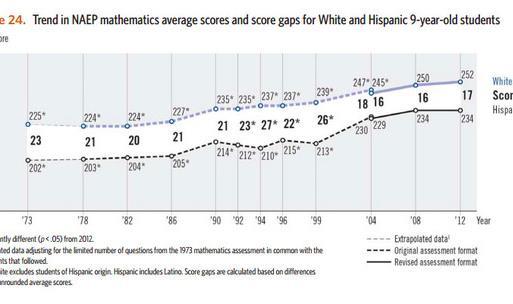
33 NAEP Achievement Data Mathematics
34 National Graduation Rates % 90% 80% 70% 60% 79% 80% GAP 59% 57% 61% 59% 67% 65% 69% 67% 72% 73% 70% 71% 86% 84% 87% 88% 50% 40% 30% 20% 10% 0% All ELL SWD American Indian and Alaskan Native Black Low Income Hispanic White Asian and Pacific Islander

35 National Graduation Gap: Percent SWD Graduating with Standard Diploma 2010/11 50% 45% 46% 45% 45% 40% 40% 35% 35% 35% 34% 32% 30% 25% 20% 15% 10% 5% 0% Asian Native Hawaiian or Other Pacific Islander White American Indian Hispanic or Latino or Alaskan Native Two or More Races Black or African American Total Standard Diploma SOURCE: U.S. Department of Education, Office of Special Education Programs, Data Analysis System (DANS), OMB # : "Children with Disabilities Receiving Special Education Under Part B of the Individuals with Disabilities Education Act,"
36 NEW JERSEY DATA Photo:

37 NJ Special Education Identification and Placement NJDOE OSEP Total 9 16 Am. In/Alaska Two or More Races The National Average 9% Placement Rate Asian Black Hispanic/Latino White White Hispanic/Latino Black Asian Two or More Races Am. In/Alaska Total National Placement Rates NJ Placement Rates
38 Access to General Education White Hispanic Black Asian Two or More Races Am. Indian/Alaska Native Native Hawaiian/Pacific Islander Regular Education 80% Regular Education 79% >40% Regular Class <40% Total Source: New Jersey Department of Education, Office of Special Education, Children Participating in Regular Education, As of October 2014.
39 NJ Suspension/Expulsion Data PreK OSS 10 days OSS > 10 Days ISS 10 Days ISS > 10 Days % SPED Hispanic/Latino American Indian/Alaska Native Asian Black Native Hawaiian/Pacific Islander White Two or More Races Source: New Jersey Department of Education, Office of Special Education, 2014 Discipline Data.
40 NAEP Achievement Grade 8 Reading White Black Source: New Jersey Department of Education, NEAP Results.

41 NAEP Achievement Grade 8 Reading White Hispanic Source: New Jersey Department of Education, NEAP Results.
42 Axis Title NJDOE OSEP NAEP Achievement Grade 8 Math White Black Source: New Jersey Department of Education, NEAP Results.
43 NAEP Achievement Grade 8 Math White Hispanic Source: New Jersey Department of Education, NEAP Result.s

44 NJ Graduation Rates 2013/ GAP Asian White Native Hawaiian/Other Pacific Islander Source:Ed.Gov., Ed Data Express, New Jersey Snapshot. Hispanic Black LEP All Students 2013/ /2013
45 NJ Graduation Gap: Percent SWD Graduating with Standard Diploma 2013/ White Hispanic Black Asian Two or More Races American Indian/Alaska Native Source: New Jersey Department of Education, Office of Special Education Exiting Data as of June Native Hawaiian/Other Pacific Islander
46 DATA ANALYSIS Digging Deep for the Root Cause Photo:
47 New Jersey Optional Data Collection Tool NJ Office of Special Education Programs developed the Optional Data Collection tool to help you analyze your data to identify patterns of referrals by race/ethnicity. Used by district, school or grade level Useful for I&RS data gathering Data can be used to generate questions regarding identification and placement. Who is being classified? (grade, gender, race) Why are certain students being classified? (reason for referral) Which teachers are classifying students the most? What interventions can be used to reduce these referrals?
48 New Jersey Optional Data Collection Tool Collection of Data on Students with Educational Difficulties Directions: For each student who had educational difficulties enter the following information. *If available, pre-i&rs information should be collected and analyzed in the same manner as I&RS information. Name Grade Racial- Ethnic Group Gender Num. of Interventions Frequency (per week) Duration (num. of weeks) Free/Re Pre d. school Lunch Referred by (parent, teacher, etc) Name of Referrer Placement CST Eligible Reason Eligible? (A, B, C, Eval? Category D) District School School Year District School School Year

49 Root Cause Analysis LOW STUDENT ACHIEVEMENT EXCESSIVE SUSPENSIONS / EXPULSIONS MULTIPLE REFERRALS LOW GRADUATION RATES OVER IDENTIFICATION PLACEMENT IN SEGRETATED SETTINGS ROOT CAUSE: The deepest underlying cause, or causes or positive or negative symptoms within any process that, if dissolved, would result in elimination or reduction, or the symptom.
50 ROOT CAUSE ANALYSIS: REFLECTING ON JALEN At your tables, reflect on the factors that placed Jalen at risk. Identify a priority concern for the school and then dig deep to begin analyzing the potential root cause that the school needs to address to make sure other students like Jalen are not misidentified. NASP (2003). Portraits of the Children: Culturally Competent Assessment

51 Diagnostic Tree Template Priority Concern Location Location Location Location Curriculum Behavior Instruction System Processes Outside Influences
52 SUCCESS GAP RUBRIC Photo:

53 Success Gap Rubric Created by the IDC IDEA Data Center for use by State Departments of Education, Districts and schools concerned about equity issues in schools. It is a self assessment to help districts and schools look closely at equity, inclusion, and opportunity for children. The rubric helps districts and schools investigate the root cause of the success gaps through the implementation of: 1. Data based decision making 2. Cultural responsiveness 3. High quality core instructional program 4. Universal screening and progress monitoring 5. Evidence based interventions and supports

54 Indicator 1: Data Based Decision Making Use disaggregated data by gender, race/ethnicity, socio economic factors, disability and home languages for decisions about Curriculum and instructional programs Academic and behavioral supports Make decisions about student interventions using multiple data sources including Screening Progress monitoring Formative and summative evaluation data Data are reviewed regularly to determine progress or change.
55 Indicator 2: Culturally Responsiveness Recognize diversity across student ethnicity, language and socioeconomic status. Provide teachers the training they need to meet the linguistic needs of all students. Use screening, referral, and assessment practices, procedures and tools unbiased and nondiscriminatory. Staff understands values and respects cultural differences of each child and informs the designing of instruction. Include parents in discussion/meetings about the school, and their children s academic and behavioral program.

56 Indicator 3: Core Instructional Program Develop rigorous, consistent and well articulated K-12 instructional program, aligned with standards, and delivered with fidelity. Provide all students access to high quality instruction based on principles of Universal Design for Learning. Prepare all teachers to meet the diverse needs of students in a classroom that is culturally, linguistically and instructionally diverse. Inform parents of the core curriculum program, differentiation and accommodations made for their child.
57 Indicator 4: Assessment Universal Screening and Progress Monitoring Develop a screening system that routinely screens all students for risk factors that might require early intervention. Provide teachers training on assessment for monitoring student performance for the purpose of adjusting instruction to meet students needs. Parents are informed of their student s academic and behavioral progress in language they can understand.
58 Indicator 5: Interventions and Supports Develop system of intervention for students who have difficulty with academic and behavioral progress. Implement interventions with fidelity. Use a multi-tiered system of support to provide tiers of support based on severity of student need for both academic and behavior deficits. Positive Behavioral Interventions and Supports Parents are informed in their native or home language about the interventions implemented and their student s responses.
 Assessment-based Resource Intensive Secondary Interventions (for some students: at-risk) Some individualizing Small Group")
59 Increases Levels of Support NJDOE OSEP Designing Schoolwide Systems for Student Success Academic Instruction (with fidelity measures) Behavioral Instruction (with fidelity measures) Reduces Numbers of Students Tertiary Interventions (for individual students) Assessment-based Resource Intensive Secondary Interventions (for some students: at-risk) Some individualizing Small Group Interventions High Efficiency Rapid Response Universal Interventions (for all students) Preventive, Proactive Differentiated Instruction Research Validated Curriculum Monitoring Student Progress Monitoring Student Progress Tertiary Interventions (for individual students) Wraparound Intervention Complex Multiple Life Domain FBA/BIPs Secondary Interventions (for some students: at-risk) Simple FBA/BIPs Group Intervention with Individual Features Group Intervention Universal Interventions (for all students) Direct Instruction of Behavioral Expectation Positive Acknowledgement Screen All Students RtI conceptual system with general and special education integrated at all three levels

60 Success Gap Rubric Example
61 Success Gap Activity Review the indicators in the Success Gap Rubric and apply the rubric to what you know about Jalen and the school that identified him as cognitively impaired. In the discussion section identify what evidence do you have and what further evidence would need to support your determination. Share with group.

62 Case Study - Jalen Watch the video on Jalen: What did the new school notice about Jalen? What process did they use to address it? What different educational options are now available to Jalen that was not available at the previous school? Will this make a difference in his achievement?
63 Factors that Contribute to the Appropriate Identification and Placement in SPED Referral Referrals are supported by scientific, research or evidence based academic and/or behavioral interventions. Functional and developmental information for referred students is collected to inform the referral process (health history, school history, language proficiency). Evaluation A comprehensive evaluation process examines all suspected areas of disability including. (health, vision, hearing, social and emotional status, general intelligence, academic performance, prior instruction, communicative status, and motor abilities). Placement teams avoid biased decision making. Multiple non-discriminatory evaluation instruments are used unbiased by culture and linguistic background.


64 Form a team of all stakeholder groups willing to make a commitment to the self assessment process. Include those who have knowledge of data analysis. Study the data both aggregated and disaggregated and relevant to the identified self assessment components. Conduct the self assessment. Provide evidence to support your claim. Place student at the center of all decisions. Ensure equitable participation. Develop a plan of action that includes activities, persons responsible, resources needed and timeline. Integrate with school improvement process.

65 65 QUESTIONS OR COMMENTS Not everything that is faced can be changed. But nothing can be changed until it is faced. - James Baldwin. Photo:
66 66 References Fiedler, C. et. al. (2008) Culturally Responsive Practices in School: A Checklist to Address Disproportionality in Special Education. Teaching Exceptional Children. Vol. 40 (5). pp Harry, B. & Klingner, J. (2006). Why are so many minority students in special education: Understanding race and disability in schools. Teacher College Press: New York, NY. Harry, B. & Klingner, J. (2006). Case studies of Why minority student placement in special education. Teacher College Press: New York, NY. Hosp, J. & Reschly, D. (2004). Disporportionate Representation of Minority Students in Special Education: Academic, Demographic and Economic Predictors. Council for Exceptional Children. Vol. 70 (2), pp ILIAD Project (2002). Addressing Over Representation of African American Students in Special Education: Prereferral Intervention Process. Council for Exceptional Children: Washington, DC. Kozleski, E. & Zion S. (2006). Preventing Disproportionality by Strengthening district policies and Procedures An assessment and strategic planning process. National Center for Culturally Responsive Education.
67 67 References Kramarczuk, C & Zwerger, N (2015). Identifying the Root Cause of Disproportionality. NYU, Metropolitan Center for Research on Equity and the Transformation of Schools: New York, NY. Kunjufu, J. (2005). Keeping black boys out of special education, African American Images: Chicago, IL. National Education Association (2007). Truth in Labeling: Disproportionality in Special Education. (available online at NASP (2003). Portraits of the Children: Culturally Competent Assessment O Hara N et.al. (2014) Equity, Inclusion, and Opportunity: Addressing Success Gaps White Paper. IDC Idea Data Center. (available online at ). O Hara N et.al. (2014) Equity, Inclusion, and Opportunity: Addressing Success Gaps Rubric. IDC Idea Data Center. (available online at ). Pearson, Jane, (2015). Disproportionality: What is it? What Can We Do About It? US Department of Education. Online Presentation.
68 68 References Presentation by Pearson, Jane; Disproportionality: What is it? What Can We Do About It? US Department of Education. (Available online at Preuss, P. (2003). School leader s guide to root cause analysis: Using data to dissolve problems. Eye on Education: Larchmount, NY.
Instructional Intervention/Progress Monitoring (IIPM) Model Pre/Referral Process. and. Special Education Comprehensive Evaluation.
 Model Pre/Referral Process. and. Special Education Comprehensive Evaluation.") Instructional Intervention/Progress Monitoring (IIPM) Model Pre/Referral Process and Special Education Comprehensive Evaluation for Culturally and Linguistically Diverse (CLD) Students Guidelines and Resources
Instructional Intervention/Progress Monitoring (IIPM) Model Pre/Referral Process and Special Education Comprehensive Evaluation for Culturally and Linguistically Diverse (CLD) Students Guidelines and Resources
Shelters Elementary School
 Shelters Elementary School August 2, 24 Dear Parents and Community Members: We are pleased to present you with the (AER) which provides key information on the 23-24 educational progress for the Shelters
Kansas Adequate Yearly Progress (AYP) Revised Guidance
 Revised Guidance") Kansas State Department of Education Kansas Adequate Yearly Progress (AYP) Revised Guidance Based on Elementary & Secondary Education Act, No Child Left Behind (P.L. 107-110) Revised May 2010 Revised May
Kansas State Department of Education Kansas Adequate Yearly Progress (AYP) Revised Guidance Based on Elementary & Secondary Education Act, No Child Left Behind (P.L. 107-110) Revised May 2010 Revised May
5 Programmatic. The second component area of the equity audit is programmatic. Equity
 5 Programmatic Equity It is one thing to take as a given that approximately 70 percent of an entering high school freshman class will not attend college, but to assign a particular child to a curriculum
Cooper Upper Elementary School
 LIVONIA PUBLIC SCHOOLS http://cooper.livoniapublicschools.org 215-216 Annual Education Report BOARD OF EDUCATION 215-16 Colleen Burton, President Dianne Laura, Vice President Tammy Bonifield, Secretary
A Guide to Adequate Yearly Progress Analyses in Nevada 2007 Nevada Department of Education
 A Guide to Adequate Yearly Progress Analyses in Nevada 2007 Nevada Department of Education Note: Additional information regarding AYP Results from 2003 through 2007 including a listing of each individual
NDPC-SD Data Probes Worksheet
 NDPC-SD Data Probes Worksheet This worksheet from the National Dropout Prevention Center for Students with Disabilities (NDPC- SD) is an optional tool to help schools organize multiple years of student
School Performance Plan Middle Schools
 SY 2012-2013 School Performance Plan Middle Schools 734 Middle ALternative Program @ Lombard, Principal Roger Shaw (Interim), Executive Director, Network Facilitator PLEASE REFER TO THE SCHOOL PERFORMANCE
Student Support Services Evaluation Readiness Report. By Mandalyn R. Swanson, Ph.D., Program Evaluation Specialist. and Evaluation
 Student Support Services Evaluation Readiness Report By Mandalyn R. Swanson, Ph.D., Program Evaluation Specialist and Bethany L. McCaffrey, Ph.D., Interim Director of Research and Evaluation Evaluation
Gifted & Talented. Dyslexia. Special Education. Updates. March 2015!
 Gifted & Talented Dyslexia Special Education Updates Gifted & Talented Where Are We Now? Program of Services! Identification! Professional Development! Communication! GT Update Percent of Students in RISD
Aligning and Improving Systems for Special Education Services in St Paul Public Schools. Dr. Elizabeth Keenan Assistant Superintendent
 Aligning and Improving Systems for Special Education Services in St Paul Public Schools Dr. Elizabeth Keenan Assistant Superintendent 1 Aligning and Improving Systems for Special Education Student Purpose:
Cooper Upper Elementary School
 LIVONIA PUBLIC SCHOOLS www.livoniapublicschools.org/cooper 213-214 BOARD OF EDUCATION 213-14 Mark Johnson, President Colleen Burton, Vice President Dianne Laura, Secretary Tammy Bonifield, Trustee Dan
Transportation Equity Analysis
 2015-16 Transportation Equity Analysis Each year the Seattle Public Schools updates the Transportation Service Standards and bus walk zone boundaries for use in the upcoming school year. For the 2014-15
Iowa School District Profiles. Le Mars
 Iowa School District Profiles Overview This profile describes enrollment trends, student performance, income levels, population, and other characteristics of the public school district. The report utilizes
Denver Public Schools
 2017 Candidate Surveys Denver Public Schools Denver School Board District 4: Northeast DPS District 4 - Introduction School board elections offer community members the opportunity to reflect on the state
Data Diskette & CD ROM
 Data File Format Data Diskette & CD ROM Texas Assessment of Academic Skills Fall 2002 through Summer 2003 Exit Level Test Administrations Attention Macintosh Users To accommodate Macintosh systems a delimiter
Status of Women of Color in Science, Engineering, and Medicine
 Status of Women of Color in Science, Engineering, and Medicine The figures and tables below are based upon the latest publicly available data from AAMC, NSF, Department of Education and the US Census Bureau.
The State and District RtI Plans
 The State and District RtI Plans April 11, 2008 Presented by: MARICA CULLEN and ELIZABETH HANSELMAN As of January 1, 2009, all school districts will be required to have a district RtI plan. This presentation
Student Mobility Rates in Massachusetts Public Schools
 Student Mobility Rates in Massachusetts Public Schools Introduction The Massachusetts Department of Elementary and Secondary Education (ESE) calculates and reports mobility rates as part of its overall
Systemic Improvement in the State Education Agency
 Systemic Improvement in the State Education Agency A Rubric-Based Tool to Develop Implement the State Systemic Improvement Plan (SSIP) Achieve an Integrated Approach to Serving All Students Continuously
Race, Class, and the Selective College Experience
 Race, Class, and the Selective College Experience Thomas J. Espenshade Alexandria Walton Radford Chang Young Chung Office of Population Research Princeton University December 15, 2009 1 Overview of NSCE
The Demographic Wave: Rethinking Hispanic AP Trends
 The Demographic Wave: Rethinking Hispanic AP Trends Kelcey Edwards & Ellen Sawtell AP Annual Conference, Las Vegas, NV July 19, 2013 Exploring the Data Hispanic/Latino US public school graduates The Demographic
John F. Kennedy Middle School
 John F. Kennedy Middle School CUPERTINO UNION SCHOOL DISTRICT Steven Hamm, Principal hamm_steven@cusdk8.org School Address: 821 Bubb Rd. Cupertino, CA 95014-4938 (408) 253-1525 CDS Code: 43-69419-6046890
Pyramid. of Interventions
 Pyramid of Interventions Introduction to the Pyramid of Interventions Quick Guide A system of academic and behavioral support for ALL learners Cincinnati Public Schools is pleased to provide you with our
Why Should We Care About 616 and 618 Compliance Data in the Era of RDA?
 Why Should We Care About 616 and 618 Compliance Data in the Era of RDA? Kansas City, MO May 10-11, 2016 Gregg Corr, Director, Monitoring and State Improvement Planning (MSIP) Division, Office of Special
RAISING ACHIEVEMENT BY RAISING STANDARDS. Presenter: Erin Jones Assistant Superintendent for Student Achievement, OSPI
 RAISING ACHIEVEMENT BY RAISING STANDARDS Presenter: Erin Jones Assistant Superintendent for Student Achievement, OSPI Agenda Introductions Definitions History of the work Strategies Next steps Debrief
Early Warning System Implementation Guide
 Linking Research and Resources for Better High Schools betterhighschools.org September 2010 Early Warning System Implementation Guide For use with the National High School Center s Early Warning System
Miami-Dade County Public Schools
 ENGLISH LANGUAGE LEARNERS AND THEIR ACADEMIC PROGRESS: 2010-2011 Author: Aleksandr Shneyderman, Ed.D. January 2012 Research Services Office of Assessment, Research, and Data Analysis 1450 NE Second Avenue,
Basic Skills Initiative Project Proposal Date Submitted: March 14, Budget Control Number: (if project is continuing)
") Basic Skills Initiative Project Proposal 2016-2017 Date Submitted: March 14, 2016 Check One: New Proposal: Continuing Project: X Budget Control Number: (if project is continuing) Control # 87-413 - EOPS
Basic Skills Initiative Project Proposal 2016-2017 Date Submitted: March 14, 2016 Check One: New Proposal: Continuing Project: X Budget Control Number: (if project is continuing) Control # 87-413 - EOPS
12-month Enrollment
 12-month Enrollment 2016-17 Institution: Potomac State College of West Virginia University (237701) Overview 12-month Enrollment Overview The 12-Month Enrollment component collects unduplicated student
Exceptional Student Education Monitoring and Assistance On-Site Visit Report. Sarasota County School District April 25-27, 2016
 2015-16 Exceptional Student Education Monitoring and Assistance On-Site Visit Report Sarasota County School District April 25-27, 2016 This publication is produced through the Bureau of Exceptional Education
Best Colleges Main Survey
 Best Colleges Main Survey Date submitted 5/12/216 18::56 Introduction page 1 / 146 BEST COLLEGES Data Collection U.S. News has begun collecting data for the 217 edition of Best Colleges. The U.S. News
RtI: Changing the Role of the IAT
 RtI: Changing the Role of the IAT Aimee A. Kirsch Akron Public Schools Akron, Ohio akirsch@akron.k12.oh.us Urban Special Education Leadership Collaborative November 3, 2006 1 Introductions Akron Public
Port Graham El/High. Report Card for
 School: District: Kenai Peninsula Grades: K - 12 School Enrollment: 20 Title I School? No Title 1 Program: Accreditation: Report Card for 2008-2009 A Title 1 school receives federal money in support low-achieving
PSYC 620, Section 001: Traineeship in School Psychology Fall 2016
 PSYC 620, Section 001: Traineeship in School Psychology Fall 2016 Instructor: Gary Alderman Office Location: Kinard 110B Office Hours: Mon: 11:45-3:30; Tues: 10:30-12:30 Email: aldermang@winthrop.edu Phone:
An Empirical Analysis of the Effects of Mexican American Studies Participation on Student Achievement within Tucson Unified School District
 An Empirical Analysis of the Effects of Mexican American Studies Participation on Student Achievement within Tucson Unified School District Report Submitted June 20, 2012, to Willis D. Hawley, Ph.D., Special
TRANSFER APPLICATION: Sophomore Junior Senior
 : Sophomore Junior Senior 2714 W Augusta Phone: 773.534.9718 Fax: 773.534.4022 Email: admissions@chiarts.org Web: www.chiarts.org CPS Mail Run: G.S.R. #35 FRESHMAN APPLICATION STEPS Thank you for your
Getting Results Continuous Improvement Plan
 Page of 9 9/9/0 Department of Education Market Street Harrisburg, PA 76-0 Getting Results Continuous Improvement Plan 0-0 Principal Name: Ms. Sharon Williams School Name: AGORA CYBER CS District Name:
READY OR NOT? CALIFORNIA'S EARLY ASSESSMENT PROGRAM AND THE TRANSITION TO COLLEGE
 READY OR NOT? CALIFORNIA'S EARLY ASSESSMENT PROGRAM AND THE TRANSITION TO COLLEGE Michal Kurlaender University of California, Davis Policy Analysis for California Education March 16, 2012 This research
Bureau of Teaching and Learning Support Division of School District Planning and Continuous Improvement GETTING RESULTS
 PENNSYLVANIA DEPARTMENT OF EDUCATION A Framework for Continuous School Improvement Planning (Summer 2009) GETTING RESULTS Continuous School Improvement Plan Gen 6-2 Year Plan Required for Schools in School
NATIONAL CENTER FOR EDUCATION STATISTICS RESPONSE TO RECOMMENDATIONS OF THE NATIONAL ASSESSMENT GOVERNING BOARD AD HOC COMMITTEE ON.
 NATIONAL CENTER FOR EDUCATION STATISTICS RESPONSE TO RECOMMENDATIONS OF THE NATIONAL ASSESSMENT GOVERNING BOARD AD HOC COMMITTEE ON NAEP TESTING AND REPORTING OF STUDENTS WITH DISABILITIES (SD) AND ENGLISH
Glenn County Special Education Local Plan Area. SELPA Agreement
 Page 1 of 10 Educational Mental Health Related Services, A Tiered Approach Draft Final March 21, 2012 Introduction Until 6-30-10, special education students with severe socio-emotional problems who did
Colorado s Unified Improvement Plan for Schools for Online UIP Report
 Colorado s Unified Improvement Plan for Schools for 2015-16 Online UIP Report Organization Code: 2690 District Name: PUEBLO CITY 60 Official 2014 SPF: 1-Year Executive Summary How are students performing?
46 Children s Defense Fund
 Nationally, about 1 in 15 teens ages 16 to 19 is a dropout. Fewer than two-thirds of 9 th graders in Florida, Georgia, Louisiana and Nevada graduate from high school within four years with a regular diploma.
California Professional Standards for Education Leaders (CPSELs)
") Standard 1 STANDARD 1: DEVELOPMENT AND IMPLEMENTATION OF A SHARED VISION Education leaders facilitate the development and implementation of a shared vision of learning and growth of all students. Element
Standard 1 STANDARD 1: DEVELOPMENT AND IMPLEMENTATION OF A SHARED VISION Education leaders facilitate the development and implementation of a shared vision of learning and growth of all students. Element
University of Utah. 1. Graduation-Rates Data a. All Students. b. Student-Athletes
 University of Utah FRESHMAN-COHORT GRADUATION RATES All Students Student-Athletes # 2009-10 Graduation Rate 64% 64% Four-Class Average 61% 64% Student-Athlete Graduation Success Rate 87% 1. Graduation-Rates
Annual Report to the Public. Dr. Greg Murry, Superintendent
 Annual Report to the Public Dr. Greg Murry, Superintendent 1 Conway Board of Education Ms. Susan McNabb Mr. Bill Clements Mr. Chuck Shipp Mr. Carl Barger Dr. Adam Lamey Dr. Quentin Washispack Mr. Andre
Psychometric Research Brief Office of Shared Accountability
 August 2012 Psychometric Research Brief Office of Shared Accountability Linking Measures of Academic Progress in Mathematics and Maryland School Assessment in Mathematics Huafang Zhao, Ph.D. This brief
Short Term Action Plan (STAP)
") Short Term Action Plan (STAP) 10/14/2017 1 Managing Complex Change Vision Skills Incentives Resources Action Plan Assessment Meaningful Change Skills Incentives Resources Action Plan Assessment Confusion
Short Term Action Plan (STAP) 10/14/2017 1 Managing Complex Change Vision Skills Incentives Resources Action Plan Assessment Meaningful Change Skills Incentives Resources Action Plan Assessment Confusion
Kahului Elementary School
 Kahului Elementary Code: 405 Status and Improvement Report Year 2014-15 Focus On Standards Grades K-5 Focus on Standards Description Contents Setting Student Profile Community Profile Improvement Summary
File Print Created 11/17/2017 6:16 PM 1 of 10
 Success - Key Measures Graduation Rate: 4-, 5-, and 6-Year 9. First-time, full-time entering, degree-seeking, students enrolled in a minimum of 12 SCH their first fall semester who have graduated from
Hokulani Elementary School
 Hokulani Elementary Code: 109 Status and Improvement Report Year -11 Contents Focus On Standards Grades K-5 This Status and Improvement Report has been prepared as part of the Department's education accountability
Identifying Students with Specific Learning Disabilities Part 3: Referral & Evaluation Process; Documentation Requirements
 Identifying Students with Specific Learning Disabilities Part 3: Referral & Evaluation Process; Documentation Requirements Section 3 & Section 4: 62-66 # Reminder: Watch for a blue box in top right corner
MIDDLE SCHOOL. Academic Success through Prevention, Intervention, Remediation, and Enrichment Plan (ASPIRE)
") MIDDLE SCHOOL Academic Success through Prevention, Intervention, Remediation, and Enrichment Plan (ASPIRE) Board Approved July 28, 2010 Manual and Guidelines ASPIRE MISSION The mission of the ASPIRE program
MIDDLE SCHOOL Academic Success through Prevention, Intervention, Remediation, and Enrichment Plan (ASPIRE) Board Approved July 28, 2010 Manual and Guidelines ASPIRE MISSION The mission of the ASPIRE program
Implementing an Early Warning Intervention and Monitoring System to Keep Students On Track in the Middle Grades and High School
 Implementing an Early Warning Intervention and Monitoring System to Keep Students On Track in the Middle Grades and High School National High School Center Facilitator: Joseph Harris, Ph.D. Presenters:
Coming in. Coming in. Coming in
 212-213 Report Card for Glenville High School SCHOOL DISTRICT District results under review by the Ohio Department of Education based upon 211 findings by the Auditor of State. Achievement This grade combines
Essentials of Ability Testing. Joni Lakin Assistant Professor Educational Foundations, Leadership, and Technology
 Essentials of Ability Testing Joni Lakin Assistant Professor Educational Foundations, Leadership, and Technology Basic Topics Why do we administer ability tests? What do ability tests measure? How are
ILLINOIS DISTRICT REPORT CARD
 -6-525-2- Hazel Crest SD 52-5 Hazel Crest SD 52-5 Hazel Crest, ILLINOIS 2 8 ILLINOIS DISTRICT REPORT CARD and federal laws require public school districts to release report cards to the public each year.
ILLINOIS DISTRICT REPORT CARD
 -6-525-2- HAZEL CREST SD 52-5 HAZEL CREST SD 52-5 HAZEL CREST, ILLINOIS and federal laws require public school districts to release report cards to the public each year. 2 7 ILLINOIS DISTRICT REPORT CARD
State of New Jersey
 OVERVIEW 1213 GRADE SPAN KG6 116946 GALLOWAY, NEW JERSEY 85 This school's academic performance is about average when compared to schools across the state. Additionally, its academic performance is very
World s Best Workforce Plan
 2017-18 World s Best Workforce Plan District or Charter Name: PiM Arts High School, 4110-07 Contact Person Name and Position Matt McFarlane, Executive Director In accordance with Minnesota Statutes, section
INTER-DISTRICT OPEN ENROLLMENT
 Effective 2015-2016 school year only INTER-DISTRICT OPEN ENROLLMENT The Kenston Board of Education shall permit the enrollment of students from any Ohio district in a school or program in this district,
Sunnyvale Middle School School Accountability Report Card Reported Using Data from the School Year Published During
 Sunnyvale Middle School School Accountability Report Card Reported Using Data from the 2014-15 School Year Published During 2015-16 By February 1 of each year, every school in California is required by
Frank Phillips College. Accountability Report
 Frank Phillips College Accountability Report January 2016 Accountability System, January 2016 1 of 22 Participation - Key Measures Enrollment 1. Fall Headcount (Unduplicated) Fall 2000 Fall 2014 Fall 2015
DLM NYSED Enrollment File Layout for NYSAA
 Enrollment Field Definitions AYP_School_ Identifier Alphanumeric; 30 No The BEDSCODE of the DISTRICT that has Committee on Special Education (CSE) responsibility for the student. Must include any leading
DISCIPLINE PROCEDURES FOR STUDENTS IN CHARTER SCHOOLS Frequently Asked Questions. (June 2014)
") www.calcharters.org DISCIPLINE PROCEDURES FOR STUDENTS IN CHARTER SCHOOLS Frequently Asked Questions (June 2014) This document is intended to provide guidance to schools in developing student discipline
www.calcharters.org DISCIPLINE PROCEDURES FOR STUDENTS IN CHARTER SCHOOLS Frequently Asked Questions (June 2014) This document is intended to provide guidance to schools in developing student discipline
UW-Waukesha Pre-College Program. College Bound Take Charge of Your Future!
 UW-Waukesha Pre-College Program College Bound 2017 Take Charge of Your Future! This is a great program to increase your knowledge on various subjects. Students will be engaged in workshops and hands-on
Campus Improvement Plan Elementary/Intermediate Campus: Deretchin Elementary Rating: Met Standard
 Campus Improvement Plan 2015-2016 Elementary/Intermediate Campus: Deretchin Elementary Rating: Met Standard Goal 1: Student Achievement and Post-Secondary Success Deretchin Elementary School will maintain
Standards-Based Bulletin Boards. Tuesday, January 17, 2012 Principals Meeting
 Standards-Based Bulletin Boards Tuesday, January 17, 2012 Principals Meeting Questions: How do your teachers demonstrate the rigor of the standards-based assignments? How do your teachers demonstrate that
Minnesota s Consolidated State Plan Under the Every Student Succeeds Act (ESSA)
") Minnesota s Consolidated State Plan Under the Every Student Succeeds Act (ESSA) To be submitted to the U.S. Department of Education in September 2017 IMPORTANT NOTE: This is an early draft prepared for
Minnesota s Consolidated State Plan Under the Every Student Succeeds Act (ESSA) To be submitted to the U.S. Department of Education in September 2017 IMPORTANT NOTE: This is an early draft prepared for
SPECIALIST PERFORMANCE AND EVALUATION SYSTEM
 SPECIALIST PERFORMANCE AND EVALUATION SYSTEM (Revised 11/2014) 1 Fern Ridge Schools Specialist Performance Review and Evaluation System TABLE OF CONTENTS Timeline of Teacher Evaluation and Observations
No Parent Left Behind
 No Parent Left Behind Navigating the Special Education Universe SUSAN M. BREFACH, Ed.D. Page i Introduction How To Know If This Book Is For You Parents have become so convinced that educators know what
Governors and State Legislatures Plan to Reauthorize the Elementary and Secondary Education Act
 Governors and State Legislatures Plan to Reauthorize the Elementary and Secondary Education Act Summary In today s competitive global economy, our education system must prepare every student to be successful
2013 TRIAL URBAN DISTRICT ASSESSMENT (TUDA) RESULTS
 RESULTS") 3 TRIAL URBAN DISTRICT ASSESSMENT (TUDA) RESULTS Achievement and Accountability Office December 3 NAEP: The Gold Standard The National Assessment of Educational Progress (NAEP) is administered in reading
3 TRIAL URBAN DISTRICT ASSESSMENT (TUDA) RESULTS Achievement and Accountability Office December 3 NAEP: The Gold Standard The National Assessment of Educational Progress (NAEP) is administered in reading
Strategic Plan Update Year 3 November 1, 2013
 Georgia Network for Educational and Therapeutic Support (GNETS) Strategic Plan Update Year 3 November 1, 2013 Introduction The Georgia Network for Educational and Therapeutic Support (GNETS) is comprised
Serving Country and Community: A Study of Service in AmeriCorps. A Profile of AmeriCorps Members at Baseline. June 2001
 Serving Country and Community: A Study of Service in AmeriCorps Cambridge, MA Lexington, MA Hadley, MA Bethesda, MD Washington, DC Chicago, IL Cairo, Egypt Johannesburg, South Africa A Profile of AmeriCorps
Clarkstown Central School District. Response to Intervention & Academic Intervention Services District Plan
 Clarkstown Central School District Response to Intervention & Academic Intervention Services District Plan 2014-2017 Clarkstown Central School District Board of Education 2013-2014 Michael Aglialoro -
George Mason University Graduate School of Education Program: Special Education
 George Mason University Graduate School of Education Program: Special Education 1 EDSE 590: Research Methods in Special Education Instructor: Margo A. Mastropieri, Ph.D. Assistant: Judy Ericksen Section
Katy Independent School District Davidson Elementary Campus Improvement Plan
 Katy Independent School District 2017-2018 Campus Improvement Plan Accountability Rating: Met Standard Generated by Plan4Learningcom 1 of 26 Mission Statement Together with our community, the Davidson
Los Angeles City College Student Equity Plan. Signature Page
 Los Angeles City College Student Equity Plan Signature Page Los Angeles Community College Los Angeles City College President, Board of Trustees Date District Chancellor: College President: Academic Senate
DATE ISSUED: 11/2/ of 12 UPDATE 103 EHBE(LEGAL)-P
-P") TITLE III REQUIREMENTS STATE POLICY DEFINITIONS DISTRICT RESPONSIBILITY IDENTIFICATION OF LEP STUDENTS A district that receives funds under Title III of the No Child Left Behind Act shall comply with the
TITLE III REQUIREMENTS STATE POLICY DEFINITIONS DISTRICT RESPONSIBILITY IDENTIFICATION OF LEP STUDENTS A district that receives funds under Title III of the No Child Left Behind Act shall comply with the
Disciplinary action: special education and autism IDEA laws, zero tolerance in schools, and disciplinary action
 National Autism Data Center Fact Sheet Series March 2016; Issue 7 Disciplinary action: special education and autism IDEA laws, zero tolerance in schools, and disciplinary action The Individuals with Disabilities
CORRELATION FLORIDA DEPARTMENT OF EDUCATION INSTRUCTIONAL MATERIALS CORRELATION COURSE STANDARDS / BENCHMARKS. 1 of 16
 SUBJECT: Career and Technical Education GRADE LEVEL: 9, 10, 11, 12 COURSE TITLE: COURSE CODE: 8909010 Introduction to the Teaching Profession CORRELATION FLORIDA DEPARTMENT OF EDUCATION INSTRUCTIONAL MATERIALS
Continuous Improvement Monitoring Process: Self Review Report
 Continuous Improvement Monitoring Process: Self Review Report Date of Report: June 29, 2006 District Name: Winona Area Public Schools District Number: 861 Cooperative/Education District Name: Director
Exceptional Student Education Monitoring and Assistance On-Site Visit Report Sarasota County School District February 12-14, 2014
 2013-14 Exceptional Student Education Monitoring and Assistance On-Site Visit Report Sarasota County School District February 12-14, 2014 Florida Department of Education Bureau of Exceptional Education
National Survey of Student Engagement The College Student Report
 The College Student Report This is a facsimile of the NSSE survey (available at nsse.iub.edu/links/surveys). The survey itself is administered online. 1. During the current school year, about how often
Raw Data Files Instructions
 Raw Data Files Instructions Colleges will report the above information for students in the Main Cohort for each of the reporting timeframes and the system will calculate the sub cohorts and metrics based
Effective Recruitment and Retention Strategies for Underrepresented Minority Students: Perspectives from Dental Students
 Critical Issues in Dental Education Effective Recruitment and Retention Strategies for Underrepresented Minority Students: Perspectives from Dental Students Naty Lopez, Ph.D.; Rose Wadenya, D.M.D., M.S.;
Trends & Issues Report
 Trends & Issues Report prepared by David Piercy & Marilyn Clotz Key Enrollment & Demographic Trends Options Identified by the Eight Focus Groups General Themes 4J Eugene School District 4J Eugene, Oregon
Newburgh Enlarged City School District Academic. Academic Intervention Services Plan
 Newburgh Enlarged City School District Academic Academic Intervention Services Plan Revised September 2016 October 2015 Newburgh Enlarged City School District Elementary Academic Intervention Services
Running Head GAPSS PART A 1
 Running Head GAPSS PART A 1 Current Reality and GAPSS Assignment Carole Bevis PL & Technology Innovation (ITEC 7460) Kennesaw State University Ed.S. Instructional Technology, Spring 2014 GAPSS PART A 2
NATIONAL CENTER FOR EDUCATION STATISTICS
 NATIONAL CENTER FOR EDUCATION STATISTICS Palm Desert, CA The Integrated Postsecondary Education Data System (IPEDS) is the nation s core postsecondary education data collection program. It is a single,
Educational Attainment
 A Demographic and Socio-Economic Profile of Allen County, Indiana based on the 2010 Census and the American Community Survey Educational Attainment A Review of Census Data Related to the Educational Attainment
Progress Monitoring & Response to Intervention in an Outcome Driven Model
 Progress Monitoring & Response to Intervention in an Outcome Driven Model Oregon RTI Summit Eugene, Oregon November 17, 2006 Ruth Kaminski Dynamic Measurement Group rkamin@dibels.org Roland H. Good III
Legacy of NAACP Salary equalization suits.
 Why tests, anyway? Legacy of NAACP Salary equalization suits. If you can t beat em, test em. Boom! Legacy of teacher tests NTE PRAXIS-II Pearson Content Examinations GRE ACT SAT All are statistically significantly
TSI Operational Plan for Serving Lower Skilled Learners
 TSI Operational Plan for Serving Lower Skilled Learners VERSION 2.0* *This document represents a work in progress that is informed by and revised based on stakeholder comments and feedback. Each revised
EFFECTS OF MATHEMATICS ACCELERATION ON ACHIEVEMENT, PERCEPTION, AND BEHAVIOR IN LOW- PERFORMING SECONDARY STUDENTS
 EFFECTS OF MATHEMATICS ACCELERATION ON ACHIEVEMENT, PERCEPTION, AND BEHAVIOR IN LOW- PERFORMING SECONDARY STUDENTS Jennifer Head, Ed.S Math and Least Restrictive Environment Instructional Coach Department
Clark Lane Middle School
 152-51 STRATEGIC SCHOOL PROFILE 2010-11 Middle and Junior High School Edition Clark Lane Middle School Waterford School District MICHAEL LOVETERE, Principal LYNN M. LYNCH, Asst. Principal Telephone: (860)
Data-Based Decision Making: Academic and Behavioral Applications
 Data-Based Decision Making: Academic and Behavioral Applications Just Read RtI Institute July, 008 Stephanie Martinez Florida Positive Behavior Support Project George Batsche Florida Problem-Solving/RtI
ACIP. Matthews Elementary School
 Tuscaloosa County Schools Dr. Tripp Marshall, Principal 1225 Rice Mine Road Northport, AL 35476 Document Generated On October 19, 2016 TABLE OF CONTENTS Executive Summary Introduction 2 Description of