im tat Zimbabwe National Statistics Agency
|
|
|
- Patricia Hunt
- 6 years ago
- Views:
Transcription

1 im tat Zimbabwe National Statistics Agency
2

 im tat Zimbabwe")
3 Ministry of Health & Child Welfare Department of Epidemiology and Disease Control National Health Information & Surveillance Unit in conjunction with the Zimbabwe National Statistics Agency (ZIMSTAT) im tat Zimbabwe National Statistics Agency
4 ACKNOWLEDGEMENTS The Zimbabwe National Health Profile report of 211 was produced with funding support from the United States President's Emergency Plan for AIDS Relief (PEPFAR) through the U.S. Department of Health and Human services Centers for Disease Control and Prevention (CDC) Grant No. 1U2GPS3118-1being implemented by the Strengthening Health Data Dissemination and Information Use Systems Project (ZimHISP), implemented by RTI International in collaboration with the Biomedical Research and Training Institute (BRTI) and the Health Information Support Programme South Africa (HISP-SA). This report was developed by the Directorate of Epidemiology and Disease Control in the Zimbabwe Ministry of Health and Child Welfare (MOHCW), National Health Information and Surveillance Unit in collaboration with Zimbabwe National Statistics Agency (ZimStat), the Strengthening Health Data Dissemination and Information Use Systems Project (ZimHISP). The authors especially thank the following individuals for their contributions to this report: The MoHCW - Dr Portia. Manangazira (Director Epidemiology and Disease Control), Dr Ponesai. Nyika, Mr Joshua. Katiyo; ZimSTAT - Ms Evelyn Marima; RTI International Mr Henry Chidawanyika, Mr Tongai Chokuda, Ms Fortunate Machingura, Ms Eileen Reynolds; CDC Zimbabwe Ms Elizabeth Gonese, Dr Celia Woodfill; HISP-SA Ms Norah Stoops and BRTI - Ms Shungu Munyati. I N T E R N A T I O N A L
5 FOREWORD TO THE 211 NATIONAL HEALTH PROFILE Zimbabwe was among the first countries in the region to respond to emerging calls for increased availability of data for improved and effective implementation, monitoring and evaluation of health programs. Information does not only need to be available, but it should be the right information, in the right place and at the right time. The Ministry of Health and Child Welfare has produced annual health profiles at district, provincial and national levels since The National Health Profile, (NHP) is a bound document that shows collated and aggregate health data for the year, collected through the surveillance and routine reporting systems of the NHIS system. It also gives the demographic characteristics of the population, as well as climatic patterns by region, because the occurrence and distribution of certain diseases and other health-related events are influenced by these. The data is presented in tables and graphs, with comments, disaggregated by province and/or district, showing the occurrence and distribution of diseases, conditions and health-related events that commonly occur in the country and are monitored by the Ministry, for the year 211. In some cases we also provide data from previous years for comparison. As the country went through a difficult economic period in the past decade, the National Health Information and Surveillance (NHIS) system was not spared the challenges affecting the health delivery system. This resulted in the health information unit struggling to ensure timely production of complete and reliable information for planning, policy development and improved targeting of health services. As a result, there have been no profiles for 29 and 21, the last profile having been produced in 28. The situation has however gradually changed for better as from end of 29, when deliberate attempts were made for initiating improvements in the accuracy, timeliness and completeness of health data. The development of the National Health Information Strategic Plan (29 214) by the National Health Information Steering Committee with the support of the United Nations Population Fund, (UNFPA) gave way to broader multi-sectoral involvement of all players in shaping the course of health information in Zimbabwe. The Ministry s senior management closely guided the Steering Committee and these two structures continue to oversee improvements in the data collection, processing and use. There has also been increasing interest and funding towards improvements to the NHIS, with the Global Fund s Health Systems strengthening, the PEPFAR s funding through CDC, the National Health Care Trust of Zimbabwe and recently, UNICEF under the Health Transition Fund. All these initiatives should contribute greatly to the success of implementing the National Health Information Strategy, and fulfilling the health information demands of all our stakeholders. We encourage you to make use of this profile, reading it with scrutiny for its user friendliness and any errors; in order that we continue to improve and better serve your data needs in this information age and we prepare to report on the Millennium Development Goals in 215. Brigadier General (Dr) Gwinji Permanent Secretary, Ministry of Health and Child Welfare i
6 TABLE OF CONTENTS 1. GENERAL INFORMATION 1.1. PHYSICAL AND ADMINISTRATIVE BORDERS Administrative Borders Map by District CLIMATE AND RAINFALL Rainfall Recorded at Main Meteorological Station by Province/City and Month 2 2. DEMOGRAPHIC PATTERN a. Population Projection Figures by Province and Main Demographic Group b. 211 National Population Projections by Sex and Age Group c. Population Projections by Sex and Age Group, 211 projections Population Projections Trend by Province/City, Population Projections by Province and District 7 3. SOCIO-ECONOMIC PATTERN Economically Active and Inactive Population, 28 ICDS a. Primary School Enrolment by Level and Sex, b. Secondary School Enrolment by Level and Sex, Sources of Drinking Water Sanitation Facilities HEALTH STATUS 4.1. NUTRITIONAL STATUS Weight for Age by Age Group, Province and City, a. Low Weight for Age by Age Group (Under 5) b. Underweight Percentage by Province and District/City, b. Underweight for Under 5s, Top 2 Districts c. Underweight for Under 5s,Top 1 Districts Under 5 years Total Weighed and Below Line by Month Percentage Below the Line,Weight for Age Trend by Age Group Low Birth Weight Trend by Year, 24/ Total Clinical Nutritional Deficiencies Trend by Year MORBIDITY STATUS: COMMON DISEASES Notifiable Diseases & Reported Outbreaks Notifiable Diseases by Province, All Ages Notifiable Diseases Trend by Year, Out-patient Diseases and Conditions a. OPD General Diseases/Conditions by Age Group b. OPD General Diseases/Conditions by Age Group c. OPD General Diseases/Conditions by Province/City a. Selected Out-Patient General Diseases Breakdown by Age Group b. Selected Out-Patient General Diseases Breakdown by Age Group c. Selected Out-Patient General Diseases Breakdown by Province/City OPD Chronic Diseases/Conditions by Age Group, Province and City OPD Chronic Diseases/Conditions by Age Group, Province and City In-patient Diseases and Conditions In-Patient Diseases/Conditions by Age Group, Excluding Central Hospitals Total In-Patient Diseases/Conditions and Average Length of Stay, Excluding Central Hospitals Top Ten Diseases/Conditions by Age Group Top Ten Causes of Mortality by Age Group, Excluding Central Hospitals a. Top Ten Causes of Hospital Bed Stay, Excluding Central Hospitals b. National Out-Patient and In-Patient Cases and Deaths, Excluding Central Hospitals, i i
7 National Hospital Diagnoses, Including Central Hospitals Top Ten Inpatient Diseases and Conditions, Including Central Hospitals EPI Target diseases EPI Target Diseases: Inpatient Cases and Deaths by Province/City Measles Cases Trend by Age Group, Measles Inpatient Cases and Deaths by Age Group and Province/City Weekly Disease Surveillance, MORBIDITY STATUS: OTHER IMPORTANT DISEASES HIV and related diseases New AIDS Cases by Sex and Age Group New Cases of AIDS and Related Diseases by Province/City HIV and Related Conditions by Year HIV Sentinel Surveillance Data in Ante Natal Care Women by Year TB New Cases by Province/City, Age Group and Sex ARI diseases ARI Outpatients Cases by Age Group, Province/City OPD New ARI Breakdown by Province/City OPD New Cases of Acute Respiratory Infection by Age Group ARI Inpatient Cases, Deaths and Case Fatality Ratio (CFR) by Age and Province/Hospital Malaria All Malaria Cases, Tested, positive and Positivity Rate by Province Confirmed Malaria New Cases by Province/City and Age Group a. Confirmed Malaria Cases and Rainfall by Year b. Monthly Trends of Confirmed Malaria Cases Malaria Inpatient Cases and Deaths by Province Malaria Top 2 Districts Diarrhoea and Dysentery National Diarrhoea and Dysentery Cases and Incidence Rates Monthly Trends of Diarrhoea and dysentery National Diarrhoea and Dysentery Cases, Diarrhoea and Dysentery Incidence Rates by District, All Ages Leprosy Leprosy Cases by Province National Leprosy New Cases, Schistosomiasis Schistosomiasis Cases by Age Group and Province/City Schistosomiasis Outpatient Cases by Age Group and Year Schistosomiasis Incidence Rates and Rainfall Trends Schistosomiasis New Cases by Month Injuries Injuries by Age Group and Province/City Common Causes of Injury Cases and Deaths Among Inpatients by Age and Province/City/Hospital MORTALITY STATUS Life Expectancy at Birth by Year and Sex Infant Mortality Rates by Year Hospital Based Institutional Perinatal Deaths Institutional Mortality by Age Group and Year 77 iii
8 5. HEALTH RESOURCES 5.1. HEALTH FACILITIES Health Facilities in Zimbabwe Rural Hospitals and Clinics/Rural Health Centres by Ownership and Province Provincial Health Institution Distribution by Referral Level Government and Mission Hospitals by District Hospital Bed Distribution by Function Waiting Mother Shelters by Province Facilities in Health Institutions by Province/City X-Ray Perfomance by Level and Main Hospitals Distribution of Pharmacies by Province/City Summary of Staff Return FINANCIAL RESOURCES Government Budget Allocation Breakdown Vote 15 for Ministry of Health and Child Welfare Ministry of Health and Child Welfare Expenditure by Sector Vote 15. Ministry of Health and Child Welfare HEALTH SERVICES 6.1 PREVENTIVE AND PROMOTING ACTIVITIES Antenatal and Postnatal Care by Province/City Antenatal and Postnatal care by Year Maternity Care by Province/City Maternity Care by Year a. Maternal Mortality Rates by Province/City b. Major Causes of Maternal Mortality c. Comparison of Reported Maternal Deaths by Notification Forms vs T5 forms a. Family Planning Visits by Province and Contraceptive Methods b. Family Planning (new and repeat) Visits by Province/City Methods of Contraception by Number issued and Province/City Methods of Contraception by Year Vaccination Type by Age Group and Province/City Vaccination Type by Year and Age Group CURATIVE ACTIVITIES OPD Utilisation Rates by Province/City NHIS Completeness of the Data Submission by Province/City National Workload (OPD and Inpatient) by Level of Institution National Workload (OPD Curative and Preventive, Inpatient) by Year 113 i v
9 Figure Zimbabwe Administrative Boarders Zambia UMP Kariba Shamva Mudzi Mazowe Gokwe North Bindura Mutoko Zvimba Harare Binga Murehwa Victoria Falls Nyanga Kadoma Chegutu Gokwe South Seke Marondera Makoni Hwedza Lupane Mutasa Hwange Nkayi Chikomba Kwekwe Chirumanzu Buhera Mutare Tsholotsho Gweru Bubi Gutu Shurugwi Chimanimani Umguza Bulawayo Insiza Masvingo Bikita Bulililama Umzingwane Zvishavane Chivi Zaka Chipinge Botswana Hurungwe Guruve Centenary Mt Darwin Rushinga Mangwe Mberengwa Matobo Gwanda Chiredzi Mwenezi Beitbridge Makonde Mozambique Mozambique N South Africa 1
10 Table Rainfall (millimeters) Recorded at Main Meteorological Stations by Province/City and by Month, 211 Manicaland Mash Central Mash East Mash West Mat North Mat South Midlands Masvingo Harare City Bulawayo City National Year Month m m mm mm mm mm mm mm mm mm mm mm 211 Jan Feb Mar Apr May Jun Jul Aug Sep Oct Nov Dec TOTAL Source: Department of Meteorology Bulawayo City received the least rainfall and the surrounding Mat North and South province also received low rains and this will affect water supply to Bulawayo city and perpetuate the ongoing diarrhea and other hygiene related diseases. 2
11 Figure Rainfall (millimeters) Recorded at Main Meteorological Stations by Province/City and by Month, Rainfall in mm Manicaland Mashonaland Central Mashonaland East Matebeleland West Matebeleland North Matebeleland South Midlands Masvingo Harare City Bulawayo City Province 3
12 Table a. Population Projection by Province and Age Group, 211 Province / City Manicaland Mash Central Mash East Mash West Mat North Mat South Midlands Masvingo Harare Population Under 1 yr Under 5 yrs yrs Above 15 yrs Women of Child Bearing age Expected Pregnant Women Expected births Chitungwiza Bulawayo National % Percentages by Age Group Under 1 yr Under 5yrs yrs Above 15 yrs Women yrs Pregnant Women Expected births Source: Zimbabwe National Statistics Agency The general Fertility rate is 1.28 per 1. 4
13 Table 2.1.1b. National Population Projections by Sex and Age Group, 211 Age group Males Females Total In years Total Source: Zimbabwe National Statistics Agency Figure 2.1.1c. Population Projections by Age Group and Sex, Population Thousands Age Group Males Females Because of a high birth rate, low under 5years mortality and low life expectancy our pyramid is wide at the base. 5
14 Table Population Projection Trends by Province/City and Year Province/City Manicaland Mashonaland Central Mashonaland East Mashonaland West Matabeleland North Matabeleland South Midlands Masvingo Harare Bulawayo National Source: Zimbabwe National Statistics Agency 6
15 Table Population Projections by Province and District, 211 NATIONAL POPULATION ALL AGES : MANICALAND : District Name Population All Ages Under 1Yr Buhera Chimanimani Chipinge Makoni Mutare Mutasa Nyanga Total % 1-4 Yrs % Under 5Yrs % Yrs % Yrs+ % MASHONALAND CENTRAL District Name Population All Ages Under 1Yr Bindura Centenary Guruve Mazowe Mt. Darwin Rushinga Shamva Total % 1-4 Yrs % Under 5Yrs % Yrs % Yrs+ % MASHONALAND EAST District Name Population All Ages Under 1Yr % Chikomba Goromonzi Ump Wedza Marondera Mudzi Murewa Mutoko Seke Total Yrs % Under 5Yrs % Yrs % Yrs+ % MASHONALAND WEST District Name Population All Ages Under 1Yr % 1-4 Yrs Chegutu Hurungwe Kadoma Kariba Makonde Zvimba Total % Under 5Yrs % Yrs % Yrs+ %
16 MATABELELAND NORTH District Name Population All Ages Binga Bubi Hwange Lupane Nkayi Tsholotsho Umguza Total Under 1Yr % Yrs % Under 5Yrs % Yrs % 15Yrs+ % MATABELELAND SOUTH District Name Population All Ages Beit Bridge Bulilima Mangwe Gwanda Insiza Matobo Umzingwane Total Under 1Yr % Yrs % Under 5Yrs % Yrs % 15Yrs+ % MIDLANDS District Name Population All Ages Chirumhanzu Gokwe North Gokwe South Gweru Kwekwe Mberengwa Shurugwi Zvishavane Total Under 1Yr % Yrs % Under 5Yrs % Yrs % 15Yrs+ % MASVINGO District Name Population All Ages Bikita Chiredzi Chivi Gutu Masvingo Mwenezi Zaka Total Under 1Yr % Yrs % Under 5Yrs % Yrs % 15Yrs+ %
17 HARARE District Name Population All Ages Harare Under 1Yr % Yrs % 12 Under 5Yrs % Yrs % 15Yrs+ % CHITUNGWIZA District Name Population All Ages Chitungwiza Under 1Yr % Yrs % 11 Under 5Yrs % Yrs % 15Yrs+ % BULAWAYO 7442 District Name Population All Ages Bulawayo Under 1Yr % Yrs % 11 Under 5Yrs % Yrs % 15Yrs+ % The proportion of 15 years plus in Harare, Chitungwiza and Bulawayo provinces are higher than the national average of 51% which could be due to sustained rural to urban migration in search of a better life. 9
18 Students 68.8% Table Economically Active and Inactive Population, 28 Total Population 1% Children Under % Adult 15 Years and Above 58.6% Economically Inactive 23.1% Activity Not Stated 1.6% Economically Active 75.2% Home Makers 21.6% Retired, Sick/ Too Old/ Other 9.7% Unemployed 5.7% Employed 94.3% 1
19 Table 3.1.3a. Primary School Enrolments by Level and Sex, 21 Grade Male Female Total Special Total Source: Ministry of Education, 21 Note: Data for 211 is not available Special - this is a class of children with handicaps The difference between males and females in enrolment in each grade is less than 1.2% and from grade 4 upwards there are more females than males. Figure 3.1.3a. Primary School Enrolments by Level and Sex, Enrolment in Thousands Special Grade/Class Male Female Table 3.1.3b. Secondary School Enrolments by Level and Sex, 21 Form I II III IV V VI Special Total Male Female Total Source: Ministry of Education, 21 Note: Data for 211 is not available Special - this is a class of children with disability check your spellings and correct terminology for the disabilities The difference between males and females in enrolment in each level is less than 1.5% in all levels. 11
20 Figure 3.1.3b. Secondary School Enrolments by Level and Sex, Thousands I II III IV V VI Special Class/Form Male Female The graphs show a decline in enrolment from form II to IV.A small proportion of students manage to proceed to 'A' level and there is a gender bias towards males, but this is more pronounced in the rural secondary schools. Table: Percent Distribution of Households by Source of Drinking Water, 211 Characteristic Households Population Urban Rural Total Urban Rural Total Source of Drinking Water Improved Source Piped water into dwelling/yard/plot Public tap/standpipe Tubewell/borehole Protected dug well Protected spring Rainwater Bottled water Non-Improved Source Unprotected dug well Unprotected spring Tanker truck/cart with drum Surface water Other Source Total Percentage Using any improved source of drinking water Source: Zimbabwe Demographic and Health Survey, 21/11 12
21 Table Percent Distribution of Households by Type of Toilet/Latrine Facilities, 211 Type of toilet/latrine facility Households Population Urban Rural Total Urban Rural Total Improved, not shared facility Flush/pour flush to piped sewer system Flush/pour flush to septic tank Flush/pour flush to pit latrine Ventilated improved pit (VIP) latrine/blair toilet Pit latrine with slab Shared facility Flush/pour flush to piped sewer system Flush/pour flush to septic tank Flush/pour flush to pit latrine Ventilated improved pit (VIP) latrine/blair toilet Pit latrine with slab Non-improved facility Flush/pour flush not to sewer/septic tank/pit latrine Pit latrine without slab/open pit Bucket No facility/bush/field Other Total Number Source: Zimbabwe Demographic and Health Survey, 21/11 13
22 Table Weight for Age by Age Group, Province and City, 211 AGE GROUP Manicaland Mashonaland Central Mashonaland East Mashonaland West Matabeleland North Matabeleland South (Months) Total Below Line Total Below Line Total Below Line Total Below Line Total Below Line Total Below Line Weighed N % Weighed n % Weighed N % Weighed N % Weighed n % Weighed n % TOTAL AGE GROUP Midlands Masvingo Chitungwiza Bulawayo Harare National (Months) Total Below Line Total Below Line Total Below Line Total Below Line Total Below Line Total Below Line Weighed N % Weighed n % Weighed n % Weighed N % Weighed n % Weighed n % TOTAL , Source: T5 returns. Note: Cut off point for low weight is a line representing the third percentile, i.e. 8% of the Harvard Standard The Agro regions of Mashonaland and Manicaland provinces wich have good rains have low weight for age proportions greater than 5%. Matabeleland provinces have the highest percentages and the towns have the lowest proportions of less than 3.5%. 14
23 Figure 4.1.1a. Low Weight for Age by Age Group (Under 5), % below line TOTAL Age Group (months) Figure 4.1.1b. Low Weight For Age by Province (Under 5), % below line MAN MAC MAE MAW MAT N MAT S MID MASV CHIT BYO HRE TOTAL Province/City Weight for age is a composite indicator of stunting and wasting. Prevalence increases from 23 months with children between the months age being the most affected group with rates of underweight being 9.1%. Low weight for age can be associated with poor infant feeding practices especially quality and quantity of complementary foods introduced at 6 months. Other causes could be poor hygienic and sanitation practices which could lead to disease which compromise growth and development at a stage where they are most vulnerable. The prevalence decreases as a child grows older than two years as they become less vulnerable to disease and independent in terms of food choices. Matabeleland South has the highest prevalence of underweight at 9.7% and followed closely by Matabeleland South at 9.% and Mashonaland East at 8.6%. 15
24 Table 4.1.2a. Under Weight Percentage by District/City and Province (Under 5 yrs), 211 Manicaland Province % Below Line Mashonaland East % Below Line Matabeleland North % Below Line Midlands % Below Line Buhera 6.6 Chikomba 7.2 Binga 11.9 Chirumhanzu 7.6 Chimanimani 6.5 Goromonzi 7.7 Bubi 9.9 Gokwe North 6.3 Chipinge 6. Hwedza 9.7 Hwange 7.1 Gokwe South 9.7 Makoni 6.3 Marondera 5.8 Lupane 9.6 Gweru 4.9 Mutare 4.1 Mudzi 8.7 Nkayi 8.4 Kwekwe 4.4 Mutasa 8.4 Murewa 9. Tsholotsho 11.2 Mberengwa 7.4 Nyanga 8.3 Mutoko 9.7 Umguza 7.3 Shurugwi 4.1 Province 6.2 Seke 9.7 Province 9. Zvishavane 8. UMP 12.4 Province 6.7 Province 8.6 Mashonaland Central % Below Line Mashonaland West % Below Line Matebeleland South % Below Line Masvingo % Below Line Bindura 6.4 Chegutu 6.8 Beitbridge 3.9 Bikita 3.4 Centenary 7.9 Hurungwe 6.4 Bulilima 12.1 Chiredzi 2.8 Guruve 5. Kariba 4.6 Gwanda 6.1 Chivi 3.8 Mazowe 8.1 Makonde 3. Insiza 8. Gutu 1.9 Mbire 6.1 Mhondoro 5.7 Mangwe 12. Masvingo 2.4 Mount Darwin 6.4 Sanyati 4.2 Matobo 13.4 Mwenezi 4.3 Rushinga 8.1 Zvimba 7. Umzingwane 8.4 Zaka 3.3 Shamva 7. Province 5.9 Province 9.7 Province 2.9 Province 7. Bulawayo City 3.4 Harare City 2.6 Chitungwiza City 2.8 Districts with high rates of underweight like Chikomba, Nyanga, Murewa, Mutoko, Seke, Ump, Binga, Gokwe South, Mazowe,Shamva,Hurungwe had high prevalence rates of STH as per the National Prevalence Survey for soil transmitted helminthiasis and schistosomiasis of 21 16
25 Table 4.1.2b. Underweight in the Under 5 Years; Top 2 Districts, 211 Ranking District % Underweight 1 Matobo UMP Bulilima Mangwe Binga Tsholotsho Bubi Hwedza Mutoko Gokwe South Seke Lupane Murewa Mudzi Nkayi Umzingwane Mutasa Nyanga Rushinga Mazowe
26 Table 4.1.2c. Underweight for the Under 5 Years by Year, Top Ten Districts, Rank Name % Below Line Name % Below Line Name % Below Line Name % Below Line 1 Mutoko 11.1 Binga 12.5 Binga 13. Matobo Seke 11. Tsholotsho 11.4 Matobo 11.4 UMP Tsholotsho 1.6 Mangwe 1.8 Mangwe 11.2 Bulilima Murewa 9.9 Murewa 1.5 Tsholotsho 1.9 Mangwe Wedza 9.9 UMP 1.3 Bulilima 1.8 Binga Motobo 9.8 Matobo 1.3 Gokwe South 1.7 Tsholotsho Mazowe 9.6 Gokwe North 1.3 UMP 1.3 Bubi U.M.P 9.3 Seke 9.8 Lupane 9.6 Hwedza Mangwe 9.2 Bubi 9.7 Bubi 9.4 Mutoko Binga 9.1 Mazowe 9.7 Mutoko 9.3 Gokwe South 9.7 National Average 5.5 National Average 6.1 National Average 5.5 National Average 5.3 Source :- T5 Forms Districts such as Tsholotsho, Binga, Mangwe and UMP have constantly featured in the top ten districts to report high rates of underweight. The National Nutrition Survey 21 revealed that exclusive breastfeeding rates in these districts are at %. 18
27 Table Under 5 Years Total Weighted and Below Line by Month, MONTH Total Below % Total Below % Total Below % Total Below % Weighed Line Weighed Line Weighed Line Weighed Line Jan Feb Mar Apr May Jun Jul Aug Sep Oct Nov Dec Monthly average Pop. <5yrs % Of Children Weighed Source: T5 returns. The percentages of underweight children increased from 28 and peaked in 29 and 21 and declined in 211. There is no significant monthly variation in all the years. Figure Total Children (Under 5 Years) Weighed by Month, % of Low Weight for Age Jan Feb Mar Apr May Jun Jul Aug Sep Oct Nov Dec Months
28 Table Percentage below the Line, Weight for Age Trend by Year, by Age Group, 211 Age m m m m m Total Children Weighed Source: T5 returns. Figure Weight for Age Trends Weight-for-Age (%) Year - 5 m 6-11 m m m - 59 m The prevalence of underweight remains between 5.3% - 6.1% for children under 5 years of age in the period 26 to 211. Peak rates were recorded in 29, but thereafter the higher rates but prevalence has slightly declined. Children within the year age group remain the most affected as they are the most vulnerable as explained in Fig 4.1.1b with regards to care and feeding practices. The number of children weighed has also decreased from 25 up to 21 but has picked up in 211. There is need to continue encouraging mothers to come for regular growth monitoring so as to capture more children. 2
29 Table Low Birth Weight Trends by Year, LBW % Total Babies Under 2.5kg Source: T5 returns Figure Low Birth Weight (National Percentages), Percent Years LBW % Percentage of underweight children peaked in 25 and showed a downward trend with its lowest in 21 at 6.9% and rose again slightly to 9.1% in
30 TABLE Total Clinical Nutritional Deficiencies Trends, OUT-PATIENT 25 Disease/Condition n % Inc. /1 26 n % Inc. /1 27 n % Inc. /1 28 N % Inc. /1 29 n % Kwashiorkor Marasmus Pellagra Total Nutritional Deficiencies Total All New Cases Under 5 y population Annual Population Inc. /1 21 Inc. 211 Inc. n % /1 n % / Percentage represents the proportion of individual nutritional conditions out of all new cases of diseases/conditions Incidence/1 population Year 22
31 Table Notifiable Diseases by Province, All Ages, 211 PROVINCE Cholera Plague Yellow Fever Typhus Fever S C D S C D S C D S C Manicaland Mashonaland 2 Central Mashonaland East Mashonaland West Matabeleland North Matabeleland South Midlands Masvingo Harare City Chitungwiza Bulawayo City TOTAL D Viral Rabies Anthrax Hepatitis Meningococcal Typhoid Haemorragic Meningitis Fever S C D S C D S C D S C D S C D S C D The CFR for cholera of 6.4% is above the WHO recommended standard of less than 1%. For rabies there are deaths in Midlands and Mashonaland West without a record of cases. There is need to appreciate the human rabies cases in relation to dog bites by unvaccinated dogs and other animal bites whose vaccination status in unknown. Table Notifiable Diseases Trends by Year, Cholera Plague Year S C D S C Source : T2 Monthly Returns D Yellow Typhus Viral Haemorragic Rabies Anthrax Hepatitis Meningococcal Typhoid Fever Fever Fever Meningitis S C D S C D S C D S C D S C D S C D S C D S C D Key : S = Suspected Cases C =Confirmed Cases D=Deaths - = not reported This table captures notifiable disease cases for which notification forms were completed. In huge outbreaks, like the 28-9 outbreak which recorded over 98 5 cases, notification forms were not completed for every case, hence the low figures displayed in the table. However, all the cholera cases were reported through the weekly disease surveillance system. 23
32 Table a. Out-Patient General New Disease/ Conditions by Age Groups, 211 Out-Patient Cases Cases Cases Disease/Condition -4 yrs % 5+ yrs % ALL AGES % Diarrhoea Nutritional Deficiencies Malaria ARI Bilharzia Acute mental disorder Diseases of the eye Skin diseases Dental conditions Burns + Other Injuries Poisoning & Toxic Eff Dysentery All other TOTAL NEW CASES TOTAL REPEAT VISITS REFERRAL OUTS Source: T5 returns. Table b. Out-Patient General New Disease/ Conditions by Age Groups, 211 Out-Patient Cases Cases Cases Cases Cases Disease/Condition -9yrs % 1-24yrs % 25-49yrs % >5yrs % ALL AGES % STD STD REPEAT VISITS NOTES: T5 forms All Other = Diseases not listed on the T5 Form STIs, a proxy of HIV infection, is highest in the year age group, our health education and promotion efforts should thus focus on this sexually active age group. 24
33 Figure a. Top Ten Out-Patient General New Disease/ Conditions, 211 Dysentery.5 Diagnosis Bilharzia Dental conditions Diseases of the eye Burns + Other Injuries Diarrhoea Skin diseases Malaria ARI All other % of total New Cases 25
34 Table c. Out-Patient General Diseases/Conditions by Province/City, 211 Manicaland Mashonaland Central Mashonaland East Mashonaland West Matabeleland North Matabeleland South Disease/ Condition All ages % All ages % All ages % All ages % All ages % All ages % Diarrhoea Nutritional Deficiencies Malaria ARI STD Bilharzia Ac.Mental Disorders Diseases of the Eye Skin Diseases Dental Conditions Burns/Other Injuries Poisoning & Toxic Effects Dysentery All Other Total New Cases Total Repeat Visits Referral Out Diarrhoea Midlands Masvingo Harare Chitungwiza Bulawayo National Disease/ Condition All ages % All ages % All ages % All ages % All ages % All ages % Diarrhoea Nutritional Deficiencies Malaria ARI STD Bilharzia Acute.Mental Disorders Diseases of the Eye Skin Diseases Dental Conditions Burns/Other Injuries Poisoning & Toxic Effects Dysentery All Other Total New Cases Total Repeat Visits Referral Out Diarrhoea
35 Figure c: Top Ten OPD Diseases/conditions by Age Group, 211 Top 1 Out-Patient Under 5 Years, 211 Diagnosis Dental conditions Bilharzia Dysentery Nutritional Deficiencies Burns + Other Injuries Diseases of the eye Malaria Skin Diseases Diarrhoea All other ARI Top 1 Out-Patient Under 5 Years and Above, 211 Dysentery.5 Diagnosis Bilharzia Dental conditions Diseases of the eye Diarrhoea Burns + Other Injuries Skin Diseases Malaria 1.3 ARI 25.8 All other Percentage of Total New Cases 27
36 Table a. Selected Out-Patient General New Disease Breakdown, by Age Group, 211 OUT-PATIENT DISEASES/CONDITIONS -5 yrs n % Above 5 yrs n All Ages % n % No Dehydration Diarrhoea With Dehydration TOTAL Kwashiorkor Marasmus Pellagra Nutritional Deficiencies TOTAL Ear, Nose & Throat Mild ARI Moderate Severe TOTAL Chicken Pox Herpes Zoster Skin Diseases Scabies Other Forms TOTAL Burns & Scalds Road Traffic Accidents Injuries All Other Injuries Table b. Selected Out-Patient General New Disease Breakdown, by Age Group, 211 DISEASES/ CONDITIONS -9yrs 1-24yrs 25-49yrs >5yrs Urethral Discharge 457 n % n % n % N Genital Ulcers Ophthalmia Neonatarum PID Other forms of STD % n ALL AGES STD TOTAL There were cases of STs in the -9years age group and only 5338 cases of Ophthalmia Neonatarum. There is need to explore the reason for the differences 28
37 Table c. Selected Out-Patient General New Disease Breakdown by Province/City, 211 DISEASES/ CONDITIONS Manicaland Mashonaland Central Mashonaland East Mashonaland West Matabeleland North Matabeleland South Midlands Masvi ngo Harare Chitungwiza Bulawayo Total No Dehydration Diarrhoea With Dehydration TOTAL Kwashiorkor Nutritional Marasmus Deficiencies Pellagra TOTAL Ear, Nose, Throat Mild ARI Moderate Severe TOTAL Urethral Discharge Genital Ulcers PID STD Ophthalmia Neonatarum Other forms of STD TOTAL Chicken Pox Herpes Zoster Skin Scabies Diseases Other Forms TOTAL Injuries Burns & Scalds Road Taffic Accidents All Other Injuries TOTAL Source : T5 Forms 29
38 Table Out-Patient Chronic Disease/ Conditions by Age Group, Province and City, 211 Out-Patient Manicaland Mashonaland Central Diagnosis -24 yrs 25 yrs and above -24 yrs 25 yrs and above New Follow-up New Follow-up New Follow-up New Follow-up Diabetes Asthma Leprosy Epilepsy Metal Illness Disabled/Handicapped Hypertension R.H.D CCF CRF Breast Cancer Cervical cancer Prostate Cancer Other Cancers Total Out-Patient Mashonaland East Mashonaland West Diagnosis -24 yrs 25 yrs and above -24 yrs 25 yrs and above New Follow-up New Follow-up New Follow-up New Follow-up Diabetes Asthma Leprosy Epilepsy Metal Illness Disabled/Handicapped Hypertension R.H.D CCF CRF Breast Cancer Cervical cancer Prostate Cancer Other Cancers Total
39 Table Out-Patient Chronic Disease Conditions by Age Group, Province, City and National (Continued) Out-Patient Matabeleland North Matabeleland South Diagnosis -24 yrs 25 yrs and above -24 yrs 25 yrs and above New Follow-up New Follow-up New Follow-up New Follow-up Diabetes Asthma Leprosy Epilepsy Metal Illness Disabled/Handicapped Hypertension R.H.D CCF CRF Breast Cancer Cervical cancer Prostate Cancer Other Cancers Total Out-Patient Midlands Masvingo Diagnosis -24 yrs 25 yrs and above -24 yrs 25 yrs and above Followup New New Follow-up New Follow-up New Follow-up Diabetes Asthma Leprosy Epilepsy Metal Illness Disabled/Handicapped Hypertension R.H.D CCF CRF Breast Cancer Cervical cancer Prostate Cancer Other Cancers Total
40 Table Out-Patient Chronic Disease Conditions by Age Group, Province, City and National (Continued) Out-Patient Harare Chitungwiza Diagnosis -24 yrs 25 yrs and above -24 yrs 25 yrs and above Followup New New Follow-up New Follow-up New Follow-up Diabetes Asthma Leprosy Epilepsy Metal Illness Disabled/Handicapped Hypertension R.H.D CCF CRF Breast Cancer Cervical cancer Prostate Cancer Other Cancers Total OUT-PATIENT BULAWAYO NATIONAL TOTALS DIAGNOSIS -24 yrs 25 yrs and above -24 yrs 25 yrs and above Followup Follow- New New Follow-up New up New Follow-up Diabetes Asthma Leprosy Epilepsy Metal Illness Disabled/Handicapped Hypertension R.H.D CCF CRF Breast Cancer Cervical cancer Prostate Cancer Other Cancers Total The high incidence rate of asthma in outpatients in the age group 25years and above needs a revisit of the case definition of this condition. Prostate cancer is the second highest recorded cancer, and awareness must be raised to the same level as that of breast and cervical cancer. 32
41 Table Out-Patient Chronic Disease/Conditions by Age Group, Province and City, 211 OUT-PATIENT MANICALAND MASHONALAND CENTRAL DIAGNOSIS -9 yrs 1-24 yrs 25-49yrs 5yrs and above -9 yrs 1-24 yrs 25-49yrs 5yrs and above New Follow-up New Follow-up New Follow-up New Follow-up New Follow-up New Follow-up New Follow-up New Follow-up Tuberculosis AIDS Kaposi s Sarcoma Total OUT-PATIENT MASHONALAND EAST MASHONALAND WEST DIAGNOSIS -9 yrs 1-24 yrs 25-49yrs 5yrs and above -9 yrs 1-24 yrs 25-49yrs 5yrs and above New Follow-up New Follow-up New Follow-up New Follow-up New Follow-up New Follow-up New Follow-up New Follow-up Tuberculosis AIDS Kaposis Sarcoma Total OUT-PATIENT MATABELELAND NORTH MATABELELAND SOUTH DIAGNOSIS -9 yrs 1-24 yrs 25-49yrs New Follow-up New Follow-up Tuberculosis AIDS New Follow-up 5yrs and above New Follow-up New -9 yrs New Kaposis Sarcoma Total yrs Followup Followup New yrs yrs and above Follow-up New Follow-up
42 Table Out-Patient Chronic Disease/Conditions by Age Group, Province and City, 211 (continued) OUT-PATIENT MIDLANDS MASVINGO DIAGNOSIS -9 yrs 1-24 yrs 25-49yrs 5yrs and above -9 yrs 1-24 yrs New Follow-up New Followup New Followup New New Tuberculosis AIDS New New yrs 5yrs and above New Kaposis Sarcoma Total UT-PATIENT HARARE CHITUNGWIZA DIAGNOSIS -9 yrs 1-24 yrs 25-49yrs 5yrs and above -9 yrs 1-24 yrs 25-49yrs Tuberculosis 1 AIDS 1 New Follow-up New Followup Followup New Kaposis Sarcoma Total Followup New New New New Follow-up Followup Followup Followup Followup 5yrs and above New OUT-PATIENT BULAWAYO NATIONAL TOTALS DIAGNOSIS -9 yrs 1-24 yrs 25-49yrs 5yrs and above -9 yrs 1-24 yrs 25-49yrs New Follow-up New Follow-up Tuberculosis AIDS New Followup Followup New New New Kaposis Sarcoma Total New Follow-up Followup Followup Followup 5yrs and above New Followup Followup Followup Followup 34
43 Table Inpatient Diseases /Conditions by Age Group, Excluding Central Hospital, 211 Disease/Conditions Under 1 Year 1-4 years 5 years and Over Total/ All Ages Patient Days Cases Deaths Cases Deaths Cases Deaths Cases Deaths 1. Intestinal Infections Pulmonary TB Extra-pulmonary TB Meningococcal & other Meningitis Other bacterial Measles HIV related / AIDS Other viral Diseases Malaria Other Anthropod-borne Venereal Other Infectious & Parasitic Malignant Neoplasm of Oesophagus Kaposi's Sarcoma Malignant Neoplasm of Female Breast Malignant Neoplasm of Cervix Uteri Lymphomas & OtherLymphatic, Haematopoietic Tissue All Other Malignant Neoplasms Benign Neoplasms Diabetes Mellitus OtherEndocrine & Metabolic & Immunity Disorders Nutritional Deficiencies Anaemias & Blood-forming Organ Diseases Mental Disorders Nervous System Eye and Adnexae Ear and Mastoid Process Acute Rheumatic Fever & Rheumatic Heart Dis Hypertensive Disease Ischaemic Heart Disease Cerebo-vascular Accidents Pulmonary Circulation & other Circulatory System Disease ARI (Upper Tract) ARI (Lower Tract) Chronic Brochitis & other Obstructive Pulmonary Other Respiratory Diseases Oral Cavity & Digestive System Urinary System Male Genital Organs Salpingitis & Pelvic Tissue Inflammatory Meningococcal is epidemic prone and rare though reported in Zimbabwe, this kind of implies we see more of that than the bacterial, AIDs related crypto and the viral. Meningoccocal is reported through RDNS. 35
44 Table (Cont'd) Inpatient Diseases /Conditions by Age Group, Excluding Central Hospital, 211 Disease/Conditions Under 1 Year 1-4 years 5 years and Over Cases Deaths Cases Deaths Cases Deaths Total/ All Ages Cases Deaths Patient Days 41. Other Female Genital Organs Abortion 43. Direct & Indirect Obstetric Causes 44. Normal Delivery 45. Skin and Subcutaneous Musculoskeletal Syst. & Connective Tissue Congenital Anomalies Certain Conditions orig. in the Peri-natal period Signs, Symptoms and ill-defined conditions Fractures Intracranial & Internal Injuries, including nerves Open Wounds & all Other Injuries Burns Poisoning & Toxic Effects Complications & Late Effects of Injuries, Poisoning Other reasons for Contact with Health Services TOTAL EXTERNAL CAUSES External Causes of Injury and Poisoning DISEASES / CONDITIONS Under 1 year 1-4 years Cases Deaths 1. Motor Vehicle & Road Traffic Accidents 54 6 Cases Deaths 2. Other Transport Accidents 2 3. Accidental Poisoning Accidental Falls 5. Accidents by Fires and Flames Other Accidents, incl. during Medical Care Drugs, Medicaments Adverse Effects 8. Suicide and Self-inflicted injury 9. Homicide & Injury purposely inflicted by other Persons Other Violence years and over Cases Deaths Total all Ages Cases Deaths Patient Stay days TOTAL Source: Inpatient Quarterly Returns - T
45 Table Total Inpatient Diseases/Conditions and Average Length of Stay, Excluding Central Hospitals, 211 DISEASE / CONDITIONS Cases Deaths Patient Stay Days Average Length of Stay (Days) Number % Number % Number % 1. Intestinal Infections Pulmonary TB Extra-pulmonary TB Meningococcal & other Meningitis Other bacterial Measles HIV related / AIDS Other viral Diseases Malaria Other Anthropod-borne Venereal Other Infectious & Parasitic Malignant Neoplasm of Oesophagus Kaposi's Sarcoma Malignant Neoplasm of Female Breast Malignant Neoplasm of Cervix Uterine Lymphomas & Other Lymphatic, Haematopoietic Tissue All Other Malignant Neoplasms Benign Neoplasms Diabetes Mellitus Other Endocrine & Metabolic Diseases & Imm.Disorders Nutritional Deficiencies Anaemias & Bloodforming Organ Diseases Mental Disorders Nervous System Eye and Adnexae Ear and Mastoid Process Acute Rheumatic Fever & Rheum. Heart Dis Hypertensive Disease Ischaemic Heart Disease Cerebo-vascular Accidents Pulmonary Circulation & other Circulatory. System Dis ARI (Upper Tract) ARI (Lower Tract) Chronic Bronchitis & other Obstructive Pulmonary Other Respiratory Diseases Oral Cavity & Digestive System Urinary System Male Genital Organs Salpingitis & Pelvic Tissue Inflammatory
46 DISEASE / CONDITIONS Cases Patient Stay days Average Number % Deaths Number % Number % Patient Stay (days) 41. Other Female Genital Organs Abortion Direct & Indirect Obstetric Causes Normal Delivery Skin and Subcutaneous Musculoskeletal Syst. & Connective Tissue Congenital Anomalies Certain Conditions orig. in the Perinatal period Signs, Symptoms and ill-defined conditions Fractures Intracranial & Internal Injuries, including nerves Open Wounds & all Other Injuries Burns Poisoning & Toxic Effects Complications & Late Effects of Injuries, Poisoning Other reasons for Contact with Health Services TOTAL EXTERNAL CAUSES External Causes of Injury and Poisoning DISEASE / CONDITIONS Cases Deaths Patient Stay days Number % Number % Number % Average Patient Stay (days) 1. Motor Vehicle & Road Traffic Accidents Other Transport Accidents Accidental Poisoning Accidental Falls Accidents by Fires and Flames Other Accidents, incl. during Medical Care Drugs, Medicaments Adverse Effects Suicide and Self-inflicted injury Homicide & Injury purposely inflicted by other Persons Other Violence TOTAL Source :Inpatient Quarterly Return s - T9 38
47 Table Top 1 OPD Attendances Age Group, 211 Figure a: Under 1 HIV related / AIDS Rank Disease / Conditions Cases 1 ARI Peri-natal conditions Intestinal Infections Malaria 57 5 Nutritional Deficiencies 48 6 Signs, Symptoms and ill-defined conditions (ill-defined cond.) Skin and Subcutaneous Other Respiratory Diseases Oral Cavity & Digestive System HIV related / AIDS 134 Diagnosis Oral Cavity & Digestive System Other Respiratory Diseases Skin and Subcutaneous Signs, Symptoms and ill-defined conditions (ill-defined cond.) Nutritional Deficiencies Malaria Intestinal Infections Certain Conditions orig. in the Perinatal period (Perinatal... Cases ARI Figure b: 1-4 years Number Rank Disease / Conditions Cases 1 ARI Malaria Intestinal Infections Nutritional Deficiencies Signs, Symptoms and ill-defined conditions (ill-defined cond.) Skin and Subcutaneous Burns Other Respiratory Diseases Fractures 33 1 Open Wounds & all Other Injuries (All other inj) 268 Diagnosis Open Wounds & all Other.. Fractures Other Respiratory Diseases Burns Skin and Subcutaneous Signs, Symptoms and ill-.. Nutritional Deficiencies Intestinal Infections Malaria Cases ARI Figure c : 5 Years and Over Number Rank Disease / Conditions Cases 1 Normal Delivery Direct & Indirect Obstetric Causes (Obstetric causes) Malaria ARI Abortion Pulmonary TB HIV related / AIDS Signs, Symptoms and ill-defined conditions (ill-defined cond.) Intestinal Infections Fractures Diagnosis Fractures Intestinal Infections Signs, Symptoms and ill-.. HIV related / AIDS Pulmonary TB Abortion ARI Malaria Direct & Indirect.. Normal Delivery Cases Figure d : All Age Groups Number Rank Disease / Conditions Cases 1 Normal Delivery ARI Direct & Indirect Obstetric Causes (Obstetric causes) Malaria Intestinal Infections Abortion Pulmonary TB Signs, Symptoms and ill-defined conditions (ill-defined cond.) HIV related / AIDS Fractures 3 38 Diagnosis Fractures HIV related / AIDS Signs, Symptoms and ill-.. Pulmonary TB Abortion Intestinal Infections Malaria Direct & Indirect Obstetric.. ARI Normal Delivery Number Cases 39
48 Table Top Ten Causes of Mortality by Age Group, Excluding Central Hospitals, 211 Figure a : Under 1 Rank Disease / Conditions Deaths 1 Peri-natal conditions ARI Intestinal Infections Ill-defined conditions 99 5 Nutritional Deficiencies 96 6 Malaria 36 7 HIV related / AIDS 35 8 Other viral Diseases 32 9 Other Endocrine & Metabolic Diseases & Immunity Disorders 32 1 Meningococcal & other Meningitis 21 Diagnosis Meningococcal & other Meningitis Other Endocrine & Metabolic Diseases & Immunity Disorders Other Viral Diseases HIV related / AIDS Malaria Nutritional Deficiencies Signs, Symptoms and ill-defined conditions (ill-defined cond.) Intestinal Infections ARI Number Figure b: 1-4 years Rank Disease / Conditions Deaths 1 Nutritional Deficiencies ARI Intestinal Infections Malaria 36 5 HIV related / AIDS 32 6 Signs, Symptoms and ill-defined conditions (ill-defined 32 7 Other viral Diseases 27 8 Pulmonary TB 24 9 Other Respiratory Diseases 19 1 Oral Cavity & Digestive System 18 Diagnosis Oral Cavity & Digestive System Other Respiratory Diseases Pulmonary TB Other Viral Diseases Signs, Symptoms and ill-defined conditions (ill-defined cond.) HIV related / AIDS Malaria Intestinal Infections ARI Nutritional Deficiencies Number Figure c: 5 Years and Over Rank Disease / Conditions Deaths 1 Pulmonary TB ARI Other viral Diseases HIV related / AIDS Meningococcal & other Meningitis Intestinal Infections Malaria Pulmonary Circulation Heart, other Circul. System Dis Hypertensive Disease Ill-defined conditions 213 Diagnosis Signs, Symptoms and ill-defined conditions (ill-defined cond) Hypertensive Disease Pulmonary Circulation & other Heart, other Circul. System Dis. Malaria Intestinal Infections Meningococcal & other Meningitis HIV related / AIDS Other Viral Diseases ARI Pulmonary TB Number Figure d: All Age Groups Nutritional Deficiencies Rank Disease / Conditions Deaths 1 ARI Pulmonary TB Other viral Diseases HIV related / AIDS Intestinal Infections Peri-natal conditions Meningococcal & other Meningitis Malaria Signs, Symptoms and ill-defined conditions (ill-defined cond.) Nutritional Deficiencies 337 Diagnosis Signs, Symptoms and ill-defined conditions (ill-defined cond.) Malaria Meningococcal & other Meningitis Certain Conditions orig. in the Perinatal period (Perinatal cond.) Intestinal Infections HIV related / AIDS Other Viral Diseases Pulmonary TB ARI Number Source :Inpatient Quarterly Returns - T9 4
49 Table a Top 1 Causes of Hospital Bed Stay (All Ages Excluding Central Hospital), 211 Number of : Rank Disease/ Condition Cases Patient Stay Days Average Stay Days % Stay Days 1 Normal Delivery ARI Direct & Indirect Obstetric Causes (Obstetric causes) Pulmonary TB Malaria HIV related / AIDS Fractures Intestinal Infections Other viral Diseases Signs, Symptoms and ill-defined conditions (ill-defined cond.) Total All Diseases Source: Inpatient Quarterly Returns- T9 Table b. National Outpatient and Inpatient Cases and Deaths, Excluding Central Hospitals, Year OPD INPATIENT (T9) Total New Cases Cases Deaths CFR % Source: T9 Quarterly Returns & T5(OPD) Monthly forms - Data not available for what reason? 41
50 Table National Hospital Diagnoses, Including Central Hospitals. Causes of Hospital Admissions and Deaths for all Age Groups, 211 Diseases/Conditons Provincial Totals Central Hospitals National Totals Cases % Deaths % Cases % Deaths % Cases % Deaths % 1. Intestinal Infections Pulmonary TB Extra-pulmonary TB Meningococcal & other Meningitis Other bacterial Measles HIV related / AIDS Other viral Diseases Malaria Other Anthropod-borne Venereal Other Infectious & Parasitic Malignant Neoplasm of Oesophagus Kaposi's Sarcoma Malignant Neoplasm of Female Breast Malignant Neoplasm of Cervix Uterine Lymphomas & All Other Lymphatic, Haematopoietic Tissue All Other Malignant Neoplasms Benign Neoplasms Diabetes Mellitus Endocrine & Metabolic Diseases & Immunity Disorders Nutritional Deficiencies Anaemias & Bloodforming Organ Diseases Mental Disorders Nervous System (except meningitis) Eye and Adnexae Ear and Mastoid Process Acute Rheumatic Fever & Rheum. Heart Dis Hypertensive Disease Ishaemic Heart Disease Cerebo-vasculars Pulmonary Circulation &other Circul. System Dis ARI (Upper Tract ) ARI (Lower Tract) Chronic Bronchitis & other Obstructive Pulmonary Other Respiratory Diseases Oral Cavity & Digestive System Urinary System Male Genital Organs Salpingitis & Pelvic Tissue Inflammatory Other Female Genital Organs Abortion Direct & Indirect Obstetric Causes Normal Delivery Skin and Subcutaneous Musculoskeletal Syst. & Connective Tissue Congenital Anomalies Perinatal conditions Ill-defined conditions Fractures Intracranial & Internal Injuries, including nerves Open Wounds & all Other Injuries Burns Poisoning & Toxic Effects Complications & Late Effects of Injuries, Poisoning Other reasons for Contact with Health Services TOTAL Source :Inpatient Quarterly Returns - T9 42
51 Table Top 1 In-patient Diseases and Conditions, Including Central Hospitals, 211 Cases, All Ages Rank Disease / Conditions Cases 1 Normal delivery ARI Obstetric causes (direct & indirect) Hypertensive disease Intestinal Obstruction Malaria Perinatal Conditions Abortion HIV related AIDS Ill-defined conditions Fig b Top Ten Causes of Hospitalisation ( Including Central Hospitals) Deaths, All Ages RankDisease / Conditions Deaths 1 ARI HIV related AIDS Perinatal Conditions Pulmonary TB Intestinal Obstruction Other Viral Pulmonary/heart/other circ.system diseases Ill-defined conditions 75 9 Oral cavity & digestive system Meningococcal Meningitis (+other meningitis) 665 Source :Inpatient Quarterly Returns - T9 Fig a Top Ten Causes of Hospitalisation (Including Central Hospitals) Signs, symptoms & ill-defined conditions HIV related AIDS Abortion Conditions originating in perinatal period Malaria Intestinal Obstruction Hpertensive Disease Obstetric causes (direct & indirect) ARI Normal delivery Diagnosis Cases Meningococcal Meningitis (+other.. Oral cavity & digestive system Signs, symptoms & ill-defined conditions Pulmonary/heart/other circ. system.. Other Viral Intestinal Obstruction Pulmonary TB Diagnosis Conditions originating in perinatal period HIV related AIDS ARI Deaths 43
52 Table EPI Target Diseases: Inpatient Cases and Deaths by Province/City, 211 Province Cases Deaths Measles Diphtheria Manicaland Tetanus AFP Pertussis Mashonaland. Central Measles 23 1 Diphtheria Tetanus 2 AFP 3 Pertussis Mashonaland. East Measles 89 2 Diphtheria Tetanus AFP 1 Pertussis Mashonaland. West Measles 19 Diphtheria Tetanus AFP Pertussis Matabeleland. North Measles 81 2 Diphtheria Tetanus AFP Pertussis Matabeleland. South Measles Diphtheria Tetanus AFP Pertussis Midlands Measles 17 Diphtheria Tetanus AFP Pertussis Masvingo Measles Diphtheria Tetanus AFP 4 Pertussis Harare City Measles 13 1 Diphtheria Tetanus AFP Pertussis Bulawayo City Measles Diphtheria Tetanus AFP Pertussis National Measles Diphtheria Tetanus 2 AFP 8 Pertussis Source : T9 forms 44
53 Table Measles Cases Trend by Age Group, Year Under 5 5 Yrs+ Total New Cases Rate per 1, population Source: T9 returns. Table Measles Inpatient Cases and Deaths by Age Group and Province/City, 211 Prov/City New Cases Deaths National Under yrs + Total Under yrs + Total Manicaland Mashonaland Central Mashonaland East Mashonaland West Matabeleland North Matabeleland South Midlands Masvingo Harare City Chitungwiza Bulawayo City Total Source -T9 Returns 45
54 Table Weekly Disease Surveillance Report, Diarrhoea Cases Dysentery Cases Week Number Week Number Malaria Cases Measles Cases Week Number Week Number Cases Cases Cases Cases
55 Table New AIDS Cases by Sex and Age Group, 211 Age Group Male Female Total Total Source :T5 Figure New AIDS Cases by Age Group and Sex, New Cases Age Group Male Female 47
56 Table New Cases of AIDS and Related Diseases by Province/City, 211 Province AIDS Kaposi' Sarcoma TB STI Manicaland Mashonaland Central Mashonaland East Mashonaland West Matabeleland North Matabeleland South Midlands Masvingo Harare Bulawayo National Source: T5 returns Note: - Data not available Figure New cases of AIDS and Related Diseases by Province/City, 211 New Cases Manicaland Mash Central Mash East Mash West Manicaland Mat South Midlands Manicaland Harare Bulawayo Province AIDS Kaposi Sacoma TB STI 48
57 Table HIV and Related Conditions by Year, AIDS new cases Kaposi's Sarcoma STI episodes TB new cases Source: T5 returns 49
58 Table HIV Sentinel Surveillance Data In Ante Natal Care Women by Year, PROVINCE SITE n % HIV+ n % HIV+ n % HIV+ Manicaland Murambinda Hospital Sakubva Clinic Mashonaland Central Karanda Hospital Chipadze Clinic Mashonaland East Mutoko Hospital Sadza Hospital Mash Cebtral Kadoma Hospital Matabeleland North Binga Hospital Chinotimba Hospital Matabeleland South Gwanda Hospital Beitbridge Hospital Midlands Mkoba Clinic Masvingo Chiredzi Hospital Gutu Mission Hospital Harare City Kuwadzana Clinic Chitungwiza St Mary's Clinic Bulawayo Nkulumane Clinic SOURCE :- Antenatal Care Survey Report KEY :- n = Sample Size The rate is greater than 5% in pregnant mothers and thus we still have a generalised HIV epidemic. 5
59 Table Tuberculosis New Cases by Province, Age Group and Sex, 211 Age Group Manicaland Mash. Central Mash. East Mash. West Mat. North Mat. South (Years) Male Female Total Male Female Total Male Female Total Male Female Total Male Female Total Male Female Total TOTAL Year Pop TB INCIDENCE (/1) MALE RATIO Age Group Midlands Masvingo Bulawayo City Harare City(Incl. Chitungwiza City) National (Years) Male Female Total Male Female Total Male Female Total Male Female Total Male % Female % Total % % % % % % % % TOTAL % % Year Pop TB INCIDENCE (/1) MALE RATIO Data not available 51
60 Figure Tuberculosis New Cases by Province, Age Group and Sex, Incidence Rate Age Group Male Female 52
61 Table ARI Outpatient Cases by Age Group, Province/City, 211 Province/City Under Under 5 Population 5 yrs Under 5 yrs Cases All 5 yrs & Over Population 5 yrs & Over Cases Total Population Total Cases Manicaland Mashonaland Central Mashonaland East Mashonaland West Matabeleland North Matabeleland South Midlands Masvingo Harare City Chitungwiza City Bulawayo City Total Source:- T5 Forms Figure ARI Outpatient Cases by Age Group, Province/City, 211 Number of New Classes in Thousands Man Mash Cent Mash East Mash West Mat North Mat South Midlands Masvingo Harare Chit Byo Under 5 yrs 5 yrs & Over 53
62 Table OPD New ARI Breakdown by Province/City, 211 Manicaland Mashonaland Central Mashonaland East Mashonaland West Matabeleland North Matabeleland South ARI All Ages All Ages All Ages All Ages All Ages All Ages no. % no. % no. % no. % no. % no. % Ear, Nose, Throat Mild Moderate Severe TOTAL Total New Gen Dis/Con ARI % out total New Diseases/Conditions % % % % % % Incidence Rate/1 population? Midlands Masvingo Harare Chitungwiza Bulawayo NATIONAL ARI All Ages All Ages All Ages All Ages All Ages All Ages no. % no. % no. % no. % no. % no. % Ear, Nose, Throat Mild Moderate Severe TOTAL Total New Gen Dis/Con ARI % out total New Diseases/Conditions % % % % % % Incidence Rate
63 Table OPD New Cases of Acute Respiratory Infection by Age Group, 211 Years OPD New Ari Cases ARI Incidence Rate /1 Total New Disease/Condition Population Under 5 yrs Five yrs + All Ages Under 5 yrs Five yrs + All Ages ARI % Out of Total All Ages Under 5 yrs Five yrs + All Ages Source: T5 returns. Figure a. ARI Outpatients cases Figure b. ARI Incidence Rate, Year Number of New Cases ARI Incidence Rate per 1 population Year Under 5 yrs Five yrs+ Under 5 yrs Five yrs + All Ages 55
64 Table ARI Inpatient Cases, Deaths and Case Fatality Rate (CFR) by Age and Province/Hospital, 211 Province ARI (Upper Tract) ARI (Lower Tract) Deaths CFR Cases CFR Cases Deaths < 5 yrs 5 yrs + All Ages < 5 yrs 5 yrs + All Ages % < 5 yrs 5 yrs + All Ages < 5 yrs 5 yrs + All Ages % Manicaland Mashonaland Central Mashonaland East Mashonaland West Matabeleland North Matabeleland South - - Midlands Masvingo Harare - - Bulawayo - - Total Source : T9 Forms 56
65 Table Malaria Cases: Suspected, Tested, Positive and Positivity Rate by Province, 211 Province / City Suspected/Clinical Cases Tested Cases Positive Cases Positivity Rate Manicaland Mashonaland Central Mashonaland East Mashonaland West Matabeleland North Matabeleland South Midlands Masvingo Harare City Chitungwiza Bulawayo City National Less than 5% of all suspected malaria cases were tested due to the non/irregular availability of test kits and slide microscopy 57
66 Table Confirmed Malaria New Cases by Province and Age Group, 211 PROVINCE / CITY New Cases Incidence New Cases Incidence New Cases Incidence Under 5 yrs Rate/1 5yrs and Above Rate/1 All Ages Rate/1 Manicaland Mash Central Mash East Mash West Mat North Mat South Midlands Masvingo Harare City Chitungwiza Byo. City National source - OPD returns excluding the Central Hospitals Figure a. Confirmed Malaria Incidence Rate, All Ages Incidence Rate Per Manicaland Mashonaland Central Mashonaland East Mashonaland West Matebeleland North Matebeleland South Midlands Masvingo Harare Totals Chitungwiza Totals Bulawayo Totals Figure b. Confirmed Malaria Incidence Rate by Age Group Incidence Rate Per Under 5 years 5 years and Above Age Group 58
67 Table a. Confirmed Malaria Cases and Rainfall by Year Year Malaria Cases Rainfall Cases (Thousands) Malaria 26 Year Rainfall 211 Rainfall NB-Data from 29 and onwards include confirmed cases only while for 28 and backwards included suspected and confirmed cases Malaria incidence peaks in March, the themed-rainy season when tall grasses, puddles of water, high temperatures and other environmental conditions promote mosquito breeding; then it falls to its lowest in the dry months of August and September. Table b. Monthly Trends of Confirmed Malaria Cases, 211 Month All Cases Positive Cases January February March April May June July August September October November December National Cases (Thousands) JAN FEB MAR APR MAY JUN Months JUL AUG SEP OCT NOV DEC 59
68 Table Malaria Inpatient Cases and Deaths by Province, 211 A B C D E PROV/CITY MALARIA MALARIA MALARIA HOSPITAL MALARIA Hospitalisation AS % OF ALL IP CASES IP DEATHS HCFR HGCFR DEATHS Rate/1 pop MANICALAND MASH CTRAL MASH EAST MASH WEST MAT NORTH MAT SOUTH.... MIDLANDS MASVINGO HRE CITY NATIONAL HCFR - Hospital Crude Fatality Ratio expressed as deaths per 1 patients discharged with the condition HGCFR -Hospital General Crude Fatality Ratio for all conditions The very high CFR for malaria for Masvingo and Mashonaland West will need further investigation to look at the factors influencing it. Figure a. Hospital Crude Fatality Ratio 25 H.C.F.R as a percentage MAN MAC MAE MAW MATN MAN MID MASV MAN NAT Province / National Figure b. Provincial Hospitalization Rate Percent MAN MAC MAE MAW MATN MATS MID MASV HRE NAT Province / National 6
69 Table Malaria Top 2 Districts, 211 Ranking District Incidence/1 1 Nyanga Mudzi Mutasa Mutoko Chimanimani Chiredzi Mt Darwin Chipinge UMP Mutare Guruve Rushinga Hurungwe Shamva Bikita Kariba Bindura Makoni Centenary Binga Figure a. Malaria Incidence Rate/1 Population, Top 2 Districts, Cases Nyanga Mudzi Mutasa Mutoko Chimanimani Chiredzi Mount Darwin Chipinge UMP Mutare Guruve Rushinga Hurungwe Shamva Bikita Kariba Bindura Makoni Centenary Binga District 61


70 Figure b. Malaria Incidence Rates/1 Population, Top 2 Districts, 211 Hurungwe Guruve Centenary Mt Darwin Rushinga Kariba Mudzi Uzumba Maramba Pfungwe Bindura Mutoko Binga Nyanga Makoni Mutasa Mutare Rural Chimanimani Bikita Chipinge Chiredzi Malaria Incidence 211 Less than and more 62
71 Table National Diarrhoea and Dysentery Cases and Incidence Rates by Province, 211 Diarrhoea Dysentery Province/City Cases Incidence Incidence Cases Incidence Incidence per 1 District Range per 1 District Range Manicaland Mashonaland Central Mashonaland East Mashonaland West Matebeleland North Matebeleland South Midlands Masvingo Harare Chitungwiza Bulawayo Total Figure National Diarrhoea and Dysentery Cases and Incidence Rates by Province, Manicaland Mash. Central Mash. East Mash. West Mat. North Mat. South Midlands Masvingo Harare Chitungwiza Bulawayo Diarrhoea Incidence Rate Dysentery Incidence Rate Source: T5 Returns 63
72 Table Monthly Trends of Diarrhoea and Dysentery, 211 Jan Feb Mar Apr May Jun Jul Aug Sep Oct Nov Dec Diarrhoea Dysentery Figure Monthly Trends of Diarrhoea and Dysentery, Thousands Diarrhoea Dysentery Jan Feb Mar Apr May Jun Jul Aug Sep Oct Nov Dec Source: T5 Returns Table National Diarrhoea and Dysentery Cases, Diarrhoea Dysentery Figure National Diarrhoea and Dysentery Cases, Diarrhoea Dysentery Source: T5 Returns 64
73 Table Diarrhoea and Dysentery Incidence Rates by District, All Ages, 211 Province District Diarrhoea Cases Diarrhoea Incidence Dysentery Cases Dysentery Incidence Rate Per 1 Rate Per 1 Buhera Chimanimani Chipinge Manicaland Makoni Mutare Mutasa Nyanga Bindura Centenary Guruve Mashonaland Central Mazowe Mt. Darwin Rushinga Shamva Chikomba Goromonzi Marondera Mudzi Mashonaland East Murewa Mutoko Seke U.M.P Wedza Chegutu Hurungwe Mashonaland West Kadoma Kariba Makonde Zvimba Binga Bubi Matabeleland North Hwange Lupane Nkayi Tsholotsho Umguza Beitbridge Bulilima Gwanda Matabeleland South Insiza Mangwe Matobo Umzingwane Chirumanzu Gokwe North Gokwe South Midlands Gweru Kwekwe Mberengwa Shurugwi Zvishavane Bikita Chiredzi Masvingo Chivi Gutu Masvingo Mwenezi Harare City Chitungwiza City Bulawayo City National
74 Figure a. Top Ten Diarrhoea Incidence Rate (per 1) by District, All Ages, Incidence Rate/ 1 Population U.M.P Wedza Bikita Mutoko Kariba District Guruve Mudzi Chiredzi Rushinga Hwange Figure b. Top Ten Dysentery Incidence Rate (per 1) by District, All Ages, 211 Incidence Rate per 1 Population Kariba Binga Bikita 12.1 Wedza Guruve Rushinga Shamva Chimanimani Zaka Centenary District 66
75 Table Leprosy Cases by Province, 211 Province/ City Cases Manicaland 8 Mashonaland Central 16 Mashonaland East Mashonaland West 2 Matebelwland North 2 Matebeleland South 1 Midlands Masvingo Harare 3 Bulawayo 98 Total 13 Table National Leprosy New Cases, Year Cases Source:T5Returns Figure Leprosy New Cases, Cases Year 67
76 Table Schistosomiasis Cases by Age Group and Province/City, 211 Under 5 Years Population 5 Years and Above Population 5 Years and Above Cases All Ages Under 5 Total Incidence Province Years Population per 1 Manicaland Mashonaland Central Mashonaland East Mashonaland West Matabeleland North Matebeleland South Midlands Masvingo Harare Chitungwiza Bulawayo National National Incidence per Figure a.Schistosomiasis Incidence Rates by Province/City, 211 Incidence rate per Manicaland Mash Central Mash East Mash West Mat North Mat South Midlands Masvingo Harare Chitungwiza Bulawayo Province/City Figure b. Schistosomiasis Incidence Rates by Age Group 12 Incidence rate per Under 5 Years 5 Years and Above All Ages Age Group 68
77 Table Schistosomiasis (Bilharziasis) Outpatient Cases by Year and Age Group OPD New Cases 5 Years and Above All ages Under 5yrs Incidence Rate/1 5 Years and Above All ages Rainfall Oct- Apr/mm Years Under 5yrs Figure Schistosomiasis (Bilharziasis) Outpatient Incidence Rates by Year, Incidence Rate / Under 5 yrs 5 yrs and Above All ages The incidence is high in the active group of 5yrs and above as they get more contact with water when swimming in rivers and fetching water for household and gardening activities. 69
78 Table Schistosomiasis Incidence Rates and Rainfall Trends, Year OPD New cases Incidence Rate/1 Rainfall(mm) (Oct-Apr) Figure National Schistosomiasis Cases and Rainfall Figures, Schistosomiasis Cases - All Ages in Thousands Years OPD New Cases (All Ages) Rainfall (mm), (Oct-Apr) 7
79 Table Schistosomiasis New Cases by Month, 211 Month January February March April May June July August September October November December Total Out Patient Figure Schistosomiasis New Cases by Month, Number of new cases in Thousands 2 Jan Feb Mar Apr May Jun Jul Aug Sep Oct Nov Dec Months 71
80 Table Injuries by Age Group and Province/ City, 211 Manicaland Mashonaland Central Mashonaland East -4 Yrs 5+ Yrs -4 Yrs 5+ Yrs -4 Yrs 5+ Yrs N % n % n % n % n % n % Burns & Scalds All Other Injuries Road Traffic Accidents Total Mashonaland West Matabeleland North Matabeleland South -4 Yrs 5+ Yrs -4 Yrs 5+ Yrs -4 Yrs 5+ Yrs N % n % n % n % n % n % Burns & Scalds All Other Injuries Road Traffic Accidents Total Midlands Masvingo Harare Under 5Yrs 5Yrs+ Under 5Yrs 5Yrs+ Under 5Yrs 5Yr+ N % n % n % n % n % n % Burns & Scalds All Other Injuries Road Traffic Accidents Total Province National Chitungwiza Bulawayo Under 5Yrs 5Yrs+ Under 5Yrs 5Yrs+ Under 5Yrs 5Yr+ N % N % n % Burns & Scalds All Other Injuries Road Traffic Accidents Total
81 Figure Injuries by Age Group Thousands <5 Yrs 5 Yrs Burns and Scalds Road Traffic Accidents All other Injuries 73
82 Table Common Causes of Injury Cases and Deaths Among Inpatients by Age and Province/City/Hospital, 211 Province Manicaland Mashonaland Central Mashonaland East INJURY TYPE < Yrs 5 Yrs + All Ages Deaths < Yrs 5 Yrs+ All Ages Deaths < Yrs 5 Yrs+ All Ages Deaths Fractures Intracranial/internal injuries Open wounds & other injuries Burns Poisoning & Toxic Effects Complications of injuries.& poisoning Total injuries Province Mashonaland West Matabeleland North Matabeleland South INJURY TYPE < Yrs 5 Yrs+ All Ages Deaths < Yrs 5 Yrs+ All Ages Deaths < Yrs 5 Yrs+ All Ages Deaths Fractures intracranial/internal injuries Open wounds & other inj Burns Poisoning & Toxic Effects Complications of injuries.& poisoning Total injuries Province Midlands Masvingo City Of Harare INJURY TYPE < Yrs 5 Yrs+ All Ages Deaths < Yrs 5 Yrs+ All Ages Deaths < Yrs 5 Yrs+ All Ages Deaths Fractures intracranial/internal injuries Open wounds & other inj Burns Poisoning & Toxic Effects Complications of injuries.& poisoning Total injuries Province Harare Bulawayo National INJURY TYPE < Yrs 5 Yrs+ All Ages Deaths < Yrs 5 Yrs+ All Ages Deaths < Yrs 5 Yrs+ All Ages Deaths CFR CFractures intracranial/internal injuries Open wounds & other inj Burns Poisoning & Toxic Effects Complications of injuries.& poisoning Total injuries CFR = Number of deaths due to a specific cause X 1/Total number of cases of that specific cause 2.CFR Represents Hospital based Case Fatality Rate Only. 3.T9 By Age not available. 4.##:-Data Not Submitted in Breakdown 5. - No Submission
83 Table Life Expectancy at Birth by Year and Sex Year Male Female Average Source: CSO Zimbabwe 1992 National Census Report CSO; Zimbabwe 1992 National Census Report CSO; 28 Inter-Censal Demographic Survey(ICDS); The decrease in life expectancy is largely attributed to the HIV pandemic. Figure Life Expectancy at Birth by Year and Sex Life Expectancy at Birth Male Female 75
84 Table Infant Mortality Rates by Year Year *1999 *25/ /11 Infant Mortality Rate ( IMR) Source: Zimbabwe National Statistics Agency * Zimbabwe Demographic and Health Survey /6, 21/11 Multiple Indicator Monitoring Survey Figure Infant Mortality Rates by Year Cases Year 76
85 Table Hospital Based Institutional Perinatal Deaths, 211 SOURCE: T5 T9 routine forms ENM Rate Perinatal PM Rate T9 Perinatal Year Live Births SB SB Rate END T9 Perinatal In as % of Institution Deaths x 1 Deaths HIMR Table Institutional Mortality by Age Group and Year, 211 Source:T9 HS3/5 and Central Hospitals Annual Reports Key: H-IMR = Hospital Based Infant Mortality Rate Under 5 y MR = Under five Mortality Rate H-CrudeMR = Hospital based Crude Mortality Rate Under 5 y MR x 1 T9 Deaths All Ages HS3/HS5 Deaths All Ages Year Deaths Under 1 y Live Births H-IMR x 1 Deaths 1-4 y Table Health Facilities in Zimbabwe, 211 Provinces Primary Level First Referral Level Second Referral Level KEY 1. Primary Level = Clinics and rural health centres 2. First Referral Level = District mission and rural hospitals 3. Second Referral Level = Provincial hospitals = Central hospitals and infectious diseases 4. Third Referral Level H-CrudeMR x 1 Third Referral Level Harare Manicaland Mashonaland Central Mashonaland East Mashonaland West Matabeleland North Matabeleland South Midlands Masvingo Bulawayo TOTAL Total 77
86 Rural Hospitals and Clinics/Rural Health Centres by Ownership and Provinces / Major Cities, RURAL HOSPITALS Province Total Govt/Public Sector Rural Councils Municipality ZRP/Army Mission Private Manicaland Mashonaland Central 2 2 Mashonaland East 5 5 Mashonaland West 7 7 Matabeleland North 2 2 Matabeleland South 5 5 Midlands 4 4 Masvingo 5 5 Harare City Chitungwiza City Bulawayo City Total CLINICS/RURAL HEALTH CENTRES Province Govt/Public Sector Rural Councils Municipality ZRP/Army Mission Private Total Manicaland Mashonaland Central Mashonaland East Mashonaland West Matabeleland North Matabeleland South Midlands Masvingo Harare City Chitungwiza City Bulawayo City Total SOURCE: Provincial Health Profiles and City Health Department data 78
87 Provincial Health Institution Distribution by Referral Level, 211 Manicaland Mash Central Mash East Mash West Cities Facilities Beds Facilities Beds Facilities Beds Facilities Beds Facilities Primary Level Clinic/RHC Rural Hospitals TOTAL Secondary Level District Hospitals Other Referral hospitals (District and other) TOTAL Tertiary Level (Provincial and General) Provincial Hospitals General Hospitals TOTAL Specialised Hospitals Quartenary Hospitals Central Hospitals 5 GRANT TOTAL Mid Year Population Area/sqkm DENSITY/CLINIC POP/CLINIC POP/SECONDARY LEVEL FACILITIES POP/SECONDARY LEVEL BEDS POP/TOTAL BEDS Beds Mat North Mat South Midlands Masvingo Total Facilities Beds Facilities Beds Facilities Beds Facilities Beds Facilities Beds Primary Level Clinic/RHc Rural Hospitals TOTAL Secondary Level District Hospitals Other Referral hospitals (District and other) TOTAL Tertiary Level (Provincial and General) Provincial Hospitals General Hospitals TOTAL Specialised Hospitals Quartenary Level Central Hospitals GRANT TOTAL Mid Year Population Area/sqkm DENSITY/CLINIC POP/CLINIC POP/SECONDARY LEVEL FACILITIES POP/SECONDARY LEVEL BEDS POP/TOTAL BEDS SOURCE: Provincial Health Profiles 79
88 Table Government and Mission Hospitals by District, 211 Province District Government Hospital Mission Manicaland Buhera 1 Chimanimani 1 1 Chipinge 1 3 Makoni 1 2 Mutare 1 2 Mutasa 1 4 Nyanga 1 4 Mashonaland Central Bindura Centenary 1 Guruve 1 Mazowe 1 Mt Darwin 1 Rushinga 1 1 Shamva 1 Mashonaland East Chikomba 1 Goromonzi 1 UMP 1 Hwedza 1 Marondera Mudzi 1 Murewa 1 2 Mutoko 1 Seke 1 Mashonaland West Chegutu 1 Hurungwe 1 Kariba Makonde 1 Mhondoro Sanyathi 1 Zvimba 1 Matabeleland North Binga 1 Bubi 1 Hwange 1 Lupane Nkayi 1 Tsholotsho 1 Umguza 8
89 Table Government and Mission Hospitals by District, 211 Province District Government Hospital Mission Matabeleland South Beit Bridge 1 Bulilimamangwe 1 2 Gwanda Insiza 1 Matobo 1 2 Umzingwane 1 Midlands Chirumhanzi 1 3 Gokwe North 1 2 Gokwe South 1 1 Gweru 1 1 Zvishavane 1 Kwekwe 1 1 Mberengwa 1 2 Shurugwi 1 Masvingo Bikita 2 Chiredzi 1 Chivi 1 Gutu 1 Masvingo 1 Mwenezi 1 Zaka 1 SOURCE: Provincial Health Profiles 81
90 Table Hospital Beds Distribution by Function, 211 Function Of Manicaland HOSPITAL BED Mashonaland Central Mashonaland East Mashonaland West Matabeleland North Matabeleland TOTAL South Midlands Masvingo Bulawayo Harare General(G) Maternity(M) Paediatric TOTAL Population Expected Pregnant women yrs population yrs Population Popilation/G+S BED PREGANTS/MAT.BEDS POP/ Paeds. Beds SOURCE: HS3/5 The rate for adult hospital beds of 14 per 1 is below the world average of 3 per 1. 82
91 Waiting Mother Shelters (WMS) by Province, 211 Satistics Manicaland Mashonaland Central Mashonaland East Mashonaland West Matabeleland North Matabeleland South Midlands Masvingo Waiting Mother's Shelter Buildings Total Expected Pregnant Women Area(sp km) PREGNANTS /WMS SqKm/WMS SOURCE: Provincial Health Profiles and City Health Department data SqKM/WMS refers to Waiting Mother Shelters per Square Killometer 83
92 Table Facilities in Health Institutions by Province/City, 211 PROVINCE No. Built BEFORE 198 Manicaland Mashonaland Central Mashonaland East Mashonaland West Matabeleland North Matabeleland South Midlands Masvingo Sub Total CITY Chitungwiza Harare Bulawayo Sub Total Grant Total No. OF WMS No WITH SOLAR or ELECTRICTY COVERAGE WITH SOLAR/ ELECTRICITY (%) No WITH PIPED WATER COVERAGE WITH PIPED WATER (%) No WITH RADIO OR TELEPHONE COVERAGE WITH COMMUNICATION (%) NUMBER FENCED GRANT TOTAL The national coverages for safe water, piped water, electricity, communication and fencing are still low 84
93 Table Total X-Ray Performance by Level; District, Provincial and Main Hospitals, 211 STATISTICS DISTRICTS MISSIONS GENERALS PROVINCIALS CENTRALS NATIONAL Number Number Number Number Number Number Attendencies Routine X-Rays No. of Films Ultrasound Scan C.T. Scans TOTAL
94 Table Distribution of Pharmacies by Province/City, 211 Government Private Manicaland 38 2 Mash Central 15 1 Mash East Mash West Mat North 22 5 Mat South 2 5 Midlands Masvingo Harare Chitungwiza 2 32 Bulawayo 4 5 Total Figure Distribution of Pharmacies by Province/City, MANICALAND MASH CENTRAL MASH EAST MASH WEST MAT NORTH MAT SOUTH MIDLANDS MASVINGO Harare Chitungwiza Bulawayo Government Private Government facilities exclude primary health care facilities and show all hospitals in the country (mission hospitals inclusive), where there is a pharmacy professional. The City Health Departments are included as one entity for each urban authority. Private Pharmacy distribution is concentrated in the metropolitan provinces with the highest numbers in Harare. In all provinces urban settlements and resort areas have private pharmacies. The dataset includes dispensing medical doctors. 86
95 5.2.6 Summary of Staff Return Category Establishment In post Dec 29 Vacant as of Dec 29 % vacant Dec 29 In post Dec 21 Vacant as of Dec 21 % Vacant Dec 21 In post Dec 211 Vacant as of Dec 211 % Vacant Dec 211 Top Management Team Doctors Nurses Grades Environmental Health Department Pharmacy Radiography Physiotherapy Nutrition Orthopaedic Oral Health Laboratory Research Officers Health Information % Health Promotion Hospital Equipment Administration General Program Managers Total Comment: There is a notable improvement in the staffing levels in all departments and across all disciplines from 29 to
96
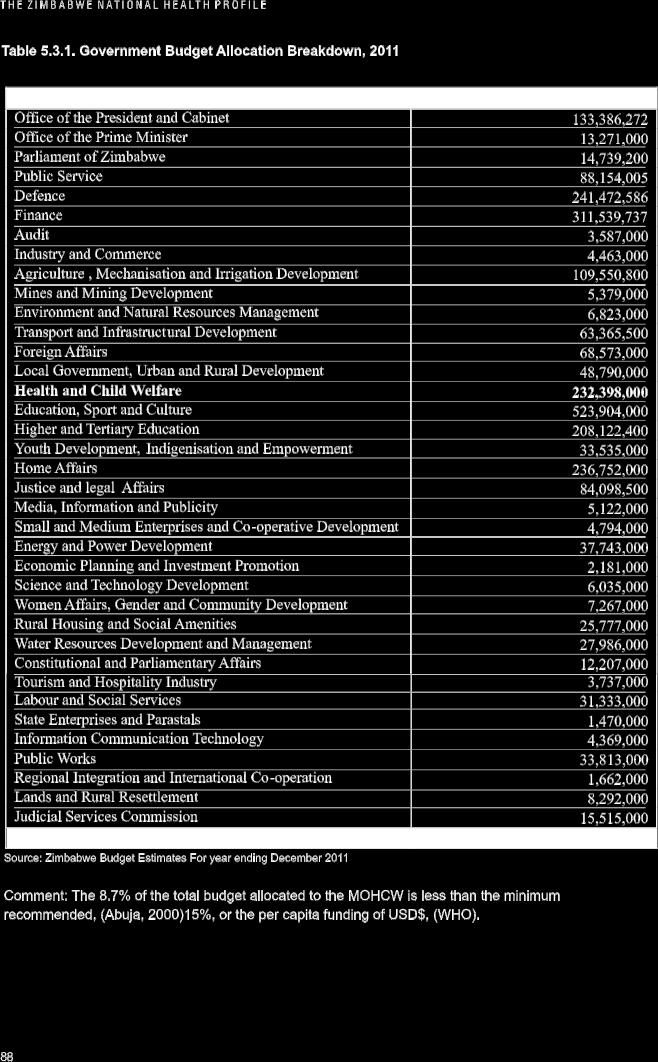
97 Vote 15. Ministry of Health and Child Welfare Budget, 211 ADMINISTRATION AND GENER AL 211 $ A Employment costs 1,94, B Goods and services 4,298, C Maintenance 161, D Current transfers 1,92, E Acquisition of fixed capital assets 19,155, F Capital transfers 3, 27,54, MEDICAL CARE SERVICES A Employment costs 91,671, B Medical supplies and services 79,4 C Maintenance 5, D Current transfers 52,967, E Programme 16,6 F Hospital and health centres 21,66, G Acquisition of fixed capital assets 3,26, H Capital transfers 8,1, Sub Total 178,884, PREVENTIVE SERVICES A Employment costs 9,98, B Goods and services 1,7, C Medical supplies and services 2, D Maintenance 65, E Current transfers 4,436, F Programmes 2,486, G Acquisition of fixed capital assets 8, H Capital transfers 11, Sub Total 19,642, RESEARCH A Employment costs 5,454, B Goods and services 447, C Maintenance 41, D Current transfers 39, E Programmes 367, F Acquisition of fixed capital assets 2, Sub Total 6,368, GRAND TOTAL 232,398, 89
98 Table Ministry of Health and Child Welfare Expenditure by Sector, 211 SECTOR EXPENDITURE Administration and General 16,411,378 Medical Care Services 12,172,452 Preventive Services 1,182,794 Research 3,217,327 Total 149,983,951 Source: Health Expenditure Section (MoHCW) Figure Ministry of Health and Child Welfare Expenditure by Sector, 211 Preventive Services 7% Research 2% Administration and General 11% Medical Care Services 8% 9
99 Table Vote 15. Ministry of Health And Child Welfare, 211 ORIGINAL REVISED UNAUDITED BUDGET BUDGET EXPENDITURE BUDGET ESTIMATE ESTIMATE TO OCTOBER ESTIMATE Amount Amount Amount Amount US$ US$ US$ US$ I. ADMINSTRATION CURRENT EXPENDITURE Employment costs 1,23, 1,23, 1,585,923 1,94, Goods and services 1,755, 1,755, 5,845,12 4,298, Maintenance 1, 1, 198,23 161, Current transfers 952,72 977,72 1,732,982 1,92, CAPITAL EXPENDITURE Acquisition of fixed capital assets 15,829, 15,829, 6,545,15 19,155, Capital transfers 3, 54, 3, 19,866,72 2,191,72 16,411,378 27,54, II. MEDICAL CARE SERVICES CURRENT EXPENDITURE Employment costs 42,32, 57,11, 52,813,55 91,671, Medical supplies and services 2,, 2,, 2,687,572 79,4 Maintenance 1,2, 1,2, 21,18 5, Current transfers 38,13, 38,13, 28,99,818 52,967, Programme 25, 25, 6,82 16,6 Hospital and health centres 28,2, 3,2, 27,342,166 21,66, CAPITAL EXPENDITURE Acquisition of fixed capital assets 5,632, 5,632, 2,566,88 3,26, Capital transfers 4,575, 4,325, 5,771,996 8,1, 122,19, 138,748, 12,172, ,884, III. PREVENTIVE SERVICES CURRENT EXPENDITURE Employment costs 4,87, 4,87, 6,319,996 9,98, Goods and services 242, 242, 164,31 1,7, Medical supplies and services 4, 4, 84,19 2, Maintenance 7, 7, 72,68 65, Current transfers 1,641, 1,641, 2,195,813 4,436, Programmes 5,, 5,, 1,346,498 2,486, CAPITAL EXPINDUTIRE Acquisition of fixed capital assets 12, 12, 8, Capital transfer 11, 12,28, 12,28, 1,182,794 19,642, IV. RESEARCH CURRENT EXPINDITURE Employment costs 2,59, 2,59, 3,2,147 5,454, Goods and services 178, 178, 55, , Maintenance 4, 4, 1,562 41, Current transfers 2, 2, 6, 39, Programmes 2, 2, 125,3 367, CAPITAL EXPINDUTIRE 15, 15, Acquisition of fixed capital assets 2,962, 2,962, 3,217,327 6,368, TOTAL 157,127,72 174,181,72 149,983, ,398, Source: BUDGETS ESTIMATES for the year ending December
100 Table Ante-natal and Post-natal Care by Province/City, 211 ANC & PNC STATISTICS Manicaland Mash. Cent Mash. East Mash. West Mat. North Mat. South Midlands Masvingo Harare Chitungwiza Byo National First ANC visits - Under 16 wks wks wks & over Total Repeat ANC visits ANC referrals PNC visits - 1 days PNC visits - 6 Weeks T.T. 1st Dose T.T. 2nd - 5th Doses HIV test done ANC total HIV test positive ANC total Vital Drugs Essential Drugs Necessary Drugs RPR test done Total RPR test positive total Institutional live births Live births at home Total reported live births Expected live births Expected pregnant women Expected women of child bearing age st ANC COVERAGE (general) vs Exp Preg. Woman (%) HIV Prevalence Rate (%) TT 1st dose Cov vs exp. Preg women (%) st PNC COVERAGE vs Expect Live Births (%) nd PNC COVERAGE vs Live Births (%) st ANC vs 1st PNC DROP OUT (%) Only 9.5% of pregnant women had their first ANC visit before 16 weeks this figure is too low and PNC visits are also low the barriers need to be identified. 92
101 Figure Antenatal and Postnatal Care by Province, MANICALAND MASH CENT MASH EAST MASH WEST MAT NORTH MAT SOUTH MIDLANDS MASVINGO HARARE CHITUNGWIZA BYO NATIONAL Province / City 1st ANC Coverage 1st PNC Coverage TTI Coverage Percentage 93
102 Table Post-natal Care by Year; ANC & PNC STATISTICS First ANC visits - Under 16 wks wks wks & over Total Repeat ANC visits ANC referrals PNC visits T.T. 1st Dose T.T. 2nd - 5th Doses HIV test done ANC total HIV test positive ANC total Vital Drugs Essential Drugs Necessary Drugs PAP Smear Tests Done Institutional live births Live births at home Total reported live births Expected births Expected pregnant women Expected women of child bearing age INDIVIDUAL AVERAGE ANC VISITS st ANC COVERAGE (%) FIRST ANC EARLY BOOKING <16 WKS (%) ANC REFERRALS (%) TT1 Vaccination cover vs exp preg women (%) TT2+ Vaccination cover vs CBA women (%) PNC COVERAGE vs Expect. Births % PNC COVERAGE vs Live Births % ANC-PNC DROP OUT (%) Source: T5 returns Figure Post-natal Care by Year; Percentage Year ANC PNC TT2 94
103 Table Maternity Care by Province/City, 211 DELIVERY CARE Manicaland STATISTICS Mash Cent Institutional Live births < 25g Total Institutional Live births by trained Live births at home TM by others Mash East Mash West Mat North Mat South Midlands Masvingo Harare Chitungwiza Bulawayo National Total Total live births Still births - - Fresh Macerated Total Total institutional (live & still) births Total (live & still) births Early neonatal deaths Maternal deaths Maternal referrals out Expected births Women of child bearing age yrs GENERAL FERTILITY RATE (x 1) INST.LOW BIRTH WEIGHT RATE (x 1) INST.DELIVERY COVERAGE (x 1) TRAINED TM DELIVERY RATE (%) INST. STILL BIRTH RATE (x 1) INST. PERINATAL MORT. RATE (x1) MATERNAL REFERRAL OUT RATE (x 1) MATERNAL MORTALITY RATE (x 1) % of live births were delivered at home. There is need to identify the barriers to institutional deliveries. 95
104 Figure 6.1.3a. Low Birth Weight Rate (1) by Province/City, Low Birth Weight Rate (x 1) Manicaland Mash Central Mash East Mash West Mat North Mat South Midlands Masvingo Harare Chitungwiza Bulawayo National Province / City Figure 6.1.3b. Maternity Care by Province/City, Inst. Delivery Coverage % Perinatal Mortality Rate (x 1) Manicaland Mash Central Mash East Mash West Mat North Mat South Midlands Masvingo Harare Chitungwiza Bulawayo National Province / City Inst. Delivery Coverage Perinatal Mortality Rate Still Birth Rate 96
105 Table Maternity Care by Year, DELIVERY CARE STATISTICS Institutional Live births < 25g Total Institutional Live births Live births at home -by trained TM by others Total Total live births Institutional Still births -Fresh Macerated Total Total institutional (live & still) births Total (live & still) births Institutional Early neonatal deaths Maternal deaths Maternal referrals out Expected births Women of child bearing age yrs GENERAL FERTILITY RATE ( x 1) INST. LOW BIRTH WEIGHT RATE (x 1) INST. DELIVERY COVERAGE (x 1) TRAINED TM DELIVERY RATE (%) INST. STILL BIRTH RATE (x 1) INST. PERINATAL MORT. RATE (x 1) MATERNAL REFERRAL OUT RATE (x 1) MATERNAL MORTALITY RATE (x 1) Source: T5 returns. Figure Maternity Care by Year Year Inst. Delivery Coverage (x 1) Inst. Perinatal Mortality Rate (x1) Maternal Mortality Rate (x1) 97
106 Table 6.1.5a. Maternal Mortality Ratio/1 by Province/City, Province/City/Hospital No. Of Ratio / No. of Ratio / No. Of Ratio / No. of Ratio / No. of Ratio / Deaths Deliveries 1 Deaths Deliveries 1 Deaths Deliveries 1 Deaths Deliveries 1 Deaths Deliveries 1 Manicaland Mash Cent Mash East Mash West Masvingo Mat North Mat South Midlands Chitungwiza Hosp Harare Hosp Parirenyatwa Hosp Harare Urban UBH Mpilo Bulawayo Urban TOTAL Province/City/Hospital No. Of Ratio / No. of Ratio No. Of Ratio No. of Ratio / No. of Ratio / Deaths Deliveries 1 Deaths Deliveries 1 Deaths Deliveries 1 Deaths Deliveries 1 Deaths Deliveries 1 Manicaland Mash Cent Mash East Mash West Mat North Mat South Midlands Masvingo Chitungwiza Hosp Harare Hosp Parirenyatwa Hosp Harare Urban UBH Mpilo Bulawayo Urban TOTAL The maternal mortality rate remains high and is increasing instead of decreasing as per MDG targets. 98
107 Table 6.1.5b. Major Causes of Maternal Mortality, 211 RANK CONDITION NUMBER PERCENT (%) 1 Eclampsia Post Partum Haemorrhage Septicaemia Hypovolaemic shock Puerperal Sepsis Malaria Severe Anaemia 8 3. Haemorrhagerepeated see 2? 8 APH Aspiration pneumonia Disseminated Intravascular 1 Coagulation Other Figure 6.1.5b. Major Causes of Maternal Mortality, 211 Major Causes of Maternal Mortality, 211 Haemorrhage 7% Aspiration pneumonia 6% D.I.C 6% Eclampisia 22% Severe Anaemia 8% Malaria 8% Post Partum Haemorhage 14% Pueperal Sepsis 9% Septicaemia 11% Hpovolaemic shock 1% 99
108 Table 6.1.5c. Comparison of Reported Maternal Deaths by Notification Forms vs T5 Forms by Year Year Maternal Notification Forms T5 Form % of Notified Deaths Figure 6.1.5c. Maternal Deaths Reports by Notification Forms and T5 Forms, Number of Forms / Deaths Year Notification Forms T5 Form The discrepancy in the maternal deaths reporting by mortality forms and the T5 forms could be due to the non availability of the maternal mortality forms, lack of training on their use and hence laxity in conducting maternal deaths audits; and needs to be addressed at all levels. 1
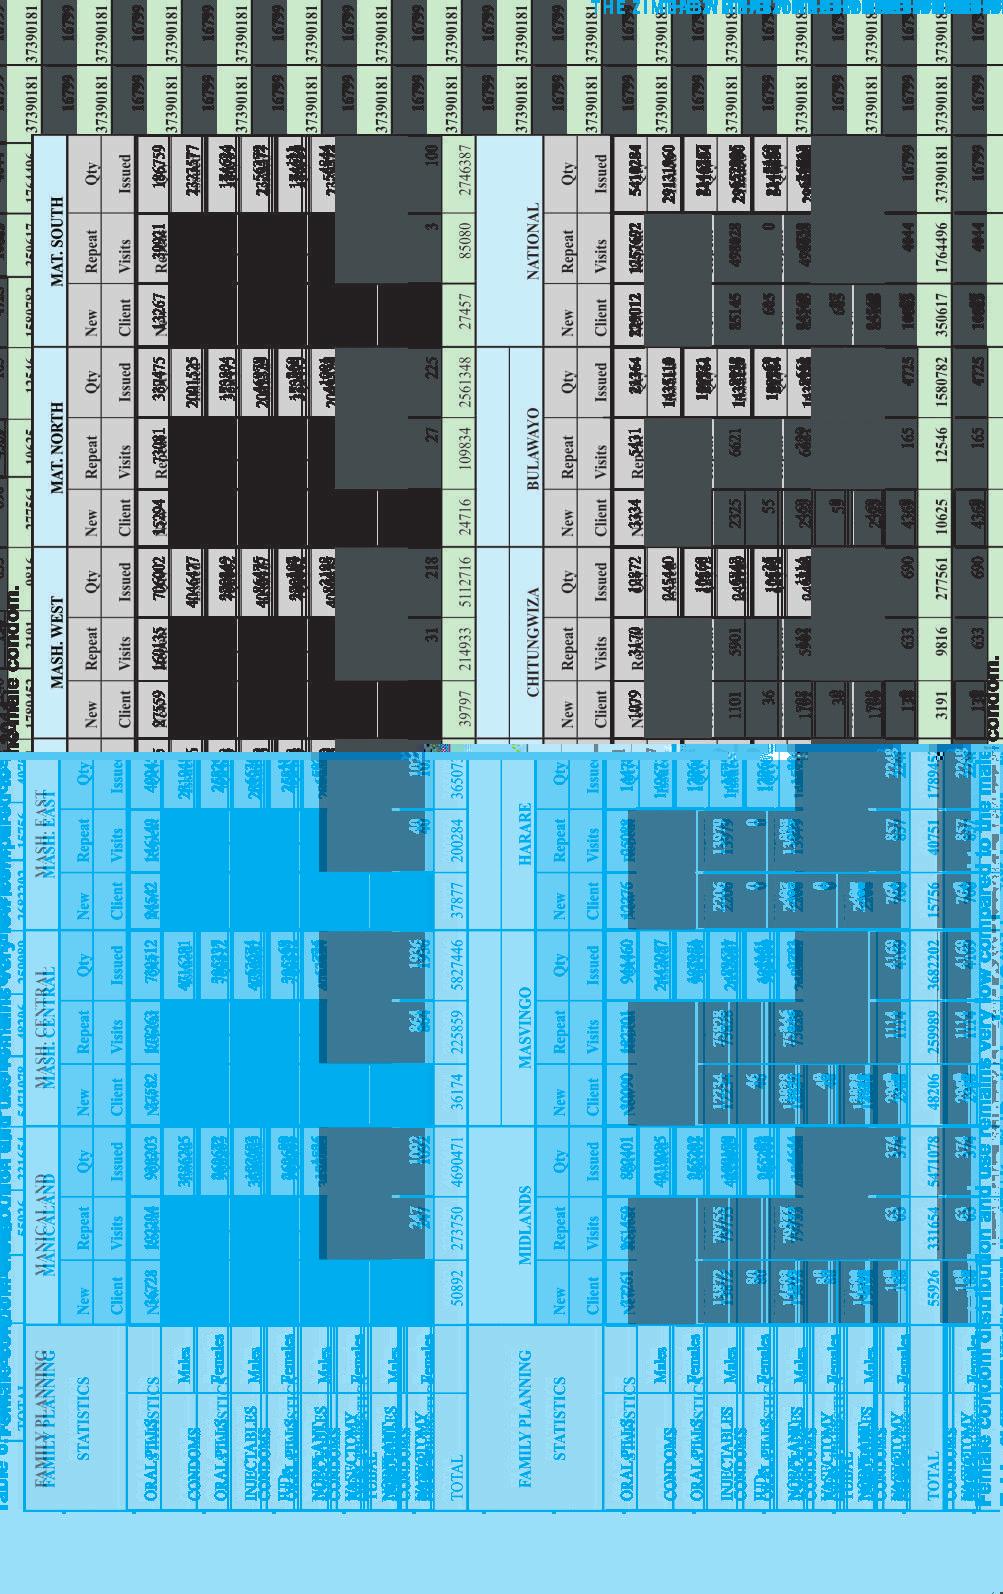
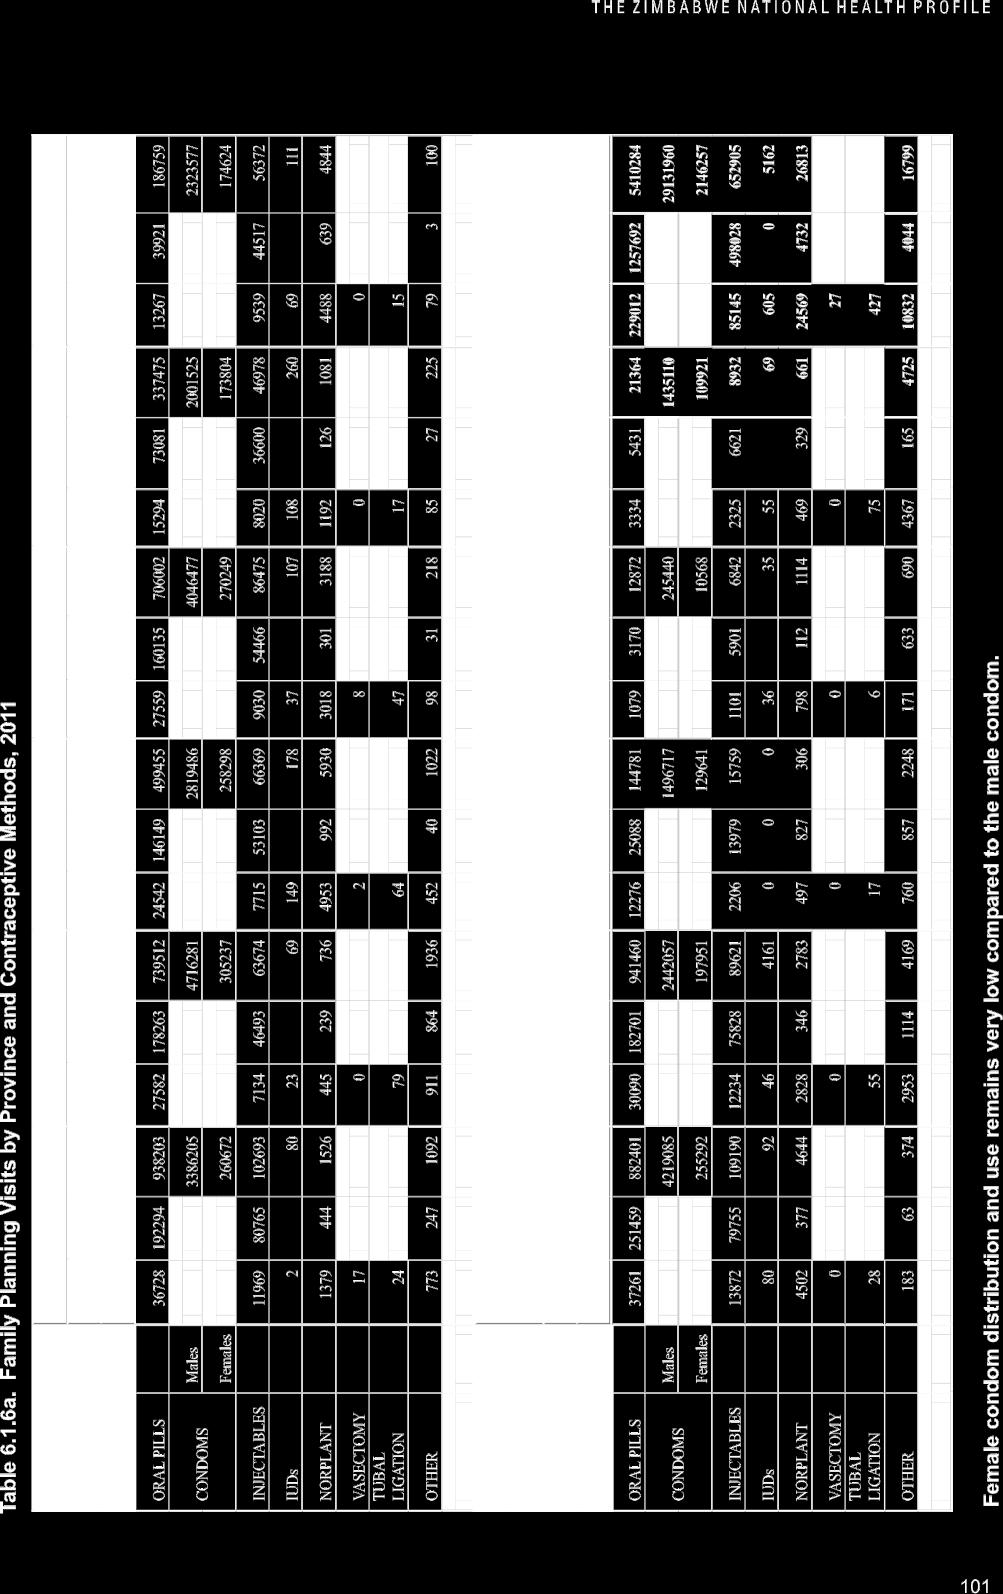
109
110 Table 6.1.6b. Family Planning (New and Repeat) Visits by Province/City, 211 FAMILY PLANNING MANICALAND MASH. MASH. MASH. MAT. MAT. MIDLANDS MASVINGO HARARE CHITUNGWZA BULAWAYO NATIONAL STATISTICS CENTRAL EAST WEST NORTH SOUTH TOTAL New Clients Repeat Visits TOTAL % NEW CLIENTS
111 Table Methods of Contraception by Number Issued and Province/City, 211 Conversion MANICALAND MASH. CENTRAL MASH. EAST MASH. WEST MAT NORTH MAT SOUTH METHOD factor Number Equivalent CYP Number Equivalent CYP Number Equivalent CYP Number Equivalent CYP Number Equivalent CYP Number Equivalent CYP Issued Number % Issued Number % Issued Number % Issued Number % Issued Number % Issued Number % ORAL PILLS CONDOMS INJECTABLES IUDs NORPLANT OTHERS TOTAL TOTAL TOTAL TOTAL TOTAL TOTAL Conversion MIDLANDS MASVINGO HARARE CHITUNGWIZA BULAWAYO NATIONAL METHOD factor Number Equivalent CYP Number Equivalent CYP Number Equivalent CYP Number Equivalent CYP Number Equivalent CYP Number Equivalent CYP ORAL PILLS CONDOMS INJECTABLES IUDs NORPLANT OTHERS Issued Number % Issued Number % Issued Number % Issued Number % Issued Number % Issued Number % TOTAL TOTAL TOTAL TOTAL TOTAL TOTAL Note that Unit considered is "cycle" for ORAL PILLS "pieces of " for CONDOMS "vial" for INJECTABLES "device" for IUDs "operation" for STERILIZATIONS; methods of contraception are compared by the total of Couple Years of Protection (CYP) offered by each method 13
112 Figure Methods of Contraception by Province/City, 211 NATIONAL BYO CHIT HRE MAS MID MAT. S MAT. N Province / City MASH. W MASH. E MASH. C MAN Percentage of CYP Supplied ORAL PILLS CONDOMS INJECTABLES IUDs OTHERS NORPLANT 14
113 Table Methods of Contraception by Year Conversion METHOD factor Number Equivalent CYP Number Equivalent CYP Number Equivalent CYP Number Equivalent CYP Issued Number % Issued Number % Issued Number % Issued Number % Oral Pills Condoms Injectables Iuds Norplant Others TOTAL TOTAL TOTAL TOTAL Notes: unit considered is "cycle" for ORAL PILLS "vial" for INJECTABLES "device" for IUDs "operation" for STERILIZATIONS; methods of contraception are compared by the total of Couple Years of Protection (CYP) offered by each method and mention what the conversion factor is for? 15
114 Figure Contraception by Year Percentage of CYP Supplied. ORAL PILLS CONDOMS INJECTABLES IUDs NORPLANT OTHERS YEARS
115 Table Vaccination Type by Age Group and Province/City, 211 IMMUNIZATION MANICALAND STATISTICS BCG 68 Polio 1 63 Polio 2 59 Polio 3 56 month year MASH. CENTRAL -11 month year MASH. EAST -11 month year Polio booster Pentavalent Pentavalent Pentavalent DT DT DT booster Measles MASH. WEST -11 month year MAT. NORTH -11 month year MAT. SOUTH -11 month year MIDLANDS -11 month year MASVINGO -11 month year HARARE CHITUNGWIZA BULAWAYO TOTAL -11 month Year month year month year month year Adverse Effects Expected children < 1 yr BCG COVERAGE < 1 yr POLIO 3 COVERAGE < 1 yr Pentavalent 3 COVERAGE < 1 yr MEASLES COVERAGE POLIO 1-POLIO 3 DROP OUT (%) Penta 1-Penta 3 DROP OUT (%) POLIO 3- MEASLES DROP OUT (%)
116 Figure Vaccination Type by Age Group and Province/City, 211 BCG bars not provided, review legend Percentage 4 2 MANICALAND MASH CENTRAL MASH EAST MASH WEST MAT. NORTH MAT. SOUTH Province / City MIDLANDS MASVINGO HARARE CITY BCG Coverage POLIO 3 Coverage Pentavalent 3 Coverage MEASLES Coverage CHITUNGWIZA CITY BULAWAYO CITY 18
117 Table Vaccination Type by Year and Age Group, 211 BCG STATISTICS Polio 1 Polio 2 Polio month years month years month years month years month years Polio booster 173 Pentavalent Pentavalent Pentavalent DPT DPT DPT DPT booster DT DT DT booster Measles Adverse Effects Expected children < 1 yr BCG COVERAGE < 1 yr POLIO 3 COVERAGE < 1 yr Pentavalent 3 COVERAGE < 1 yr MEASLES COVERAGE POLIO 1-POLIO 3 DROP OUT (%) Penta 1-Penta 3 DROP OUT (%) POLIO 3- MEASLES DROP OUT (%)
118 Table OPD Utilisation Rates by Province/City, 211 OPD STATISTICS Manicala nd Mashonal and Central Mashonal and East Mashonal and West Matabelel and North Matabele land South General Midlan ds Masvin go Harare Chitungwi za Bulawa yo Annual Average New EPI Diseas es Chronic Total New Diseases Repea t Visit General Follo w Ups Chronic Total Repeats Referrals Out Total New Diseases Total Patients 1 32 (All Ages) Total Attendences (All Ages) Period Considered (Days) Provincial population Visits Daily Average Average Visit per Patient % Repeats Visits OPD Attendences Rate (x 1) Total Source: T5 and HS3/5 Returns 11
119 Table NHIS Completeness of the Data Submission by Province/City, 211 OPD STATISTICS New Diseases General ,87, ,271,783 EPI ,445 Chronic , ,795 Total New Disease Conditions ,119, Repeat Visits/Follow ups General ,837, ,82 Chronic , ,183,386 Total Repeat Visits/Follow -up ,561, ,154,188 Referrals Out , , Total New Diseases ,743, ,92,24 Total Patients (All Ages) ,933, ,882,8 Total Attendances (All Ages) ,715, ,938,895 Period Considered (Days) National Population ,21, Visits Daily Average , ,11 Average Visits Per Patients % Repeats Visits OPD Attendences Rate (x 1) Source: T5 and HS3/5 Returns 111
120 Table National Workload (OPD Attendances-all services; Inpatient Referrals Discharge and Deaths) by Level of Institution, 211 Rural Hospitals, Government All Total for All Provincial Whole All National Rural Clinics & District Mission Districts Hospitals Provincial Central Totals Health Centres Hospitals Hospitals (excl. Prov. Hosps.) Only Totals Hospitals New Diseases/conditions (Prov & City) Patients (Central Hospitals) Total New Diseases Population all ages Attendance rate Referrals Out Patients OPD Register (Prov. & City) Number of Patients (Centrals & Chit.G.H.) Total Patients All Ages Total Attendances (Prov. & City) Total Attendances (Centrals + Chit. G H.) Total Attendances A ll Ages OPD Preventative Services (Attendances) Preventative Services as % of OPD Grand Total OPD GRAND Total (All Services) In-Patient Deaths In-Patient Referrals Out In-Patient Discharges In-Patient Total Discharges (inc. Deaths)
121 Table National Workload (OPD Attendances-All Services; Inpatient Referrals Discharge and Deaths) by Year, New Diseases/conditions (Prov & City) Patients (Central Hospitals) Total New Diseases Population all ages Attendance rate Referrals Out Patients OPD Register (Prov. & City) Number of Patients (Centrals & Chit.G.H.) Total Patients All Ages Total Attendances (Prov. & City) Total Attendances (Centrals + Chit. G H.) Total Attendances All Ages OPD Preventative Services (Attendances) Preventative Services as % of OPD Grand Total OPD Grand Total (All Services) In-Patient Deaths In-Patient Referrals Out In-Patient Discharges In-Patient Total Discharges (inc. Deaths) SOURCE:T5 and HS3/5 Returns 113
122 114
123


124
San Ignacio-Santa Elena Municipal Profile
 San Ignacio-Santa Elena Municipal Profile General San Ignacio-Santa Elena is an inland municipality, comprising of the twin towns of San Ignacio and Santa Elena. The twin towns are linked by the historic
Annex 1: Millennium Development Goals Indicators
 Annex 1: Millennium Development Goals Indicators Millennium Development Goals (MDGs) Goals and Targets(Millennium Declaration) Indicators for monitoring progress GOAL 1: ERADICATE EXTREME POVERTY AND HUNGER
Addressing TB in the Mines: A Multi- Sector Approach in Practice
 Addressing TB in the Mines: A Multi- Sector Approach in Practice Regional Dialogue: Portability of Social Benefits for Mineworkers in Southern Africa Tom Mogeni, World Bank, 27 March 2015 What do we know
Global School-based Student Health Survey. UNRWA Global School based Student Health Survey (GSHS)
") UNRWA Global School based Student Health Survey (GSHS) 21 UNRWA school Health services ü New entrant's medical examination ü Screening: for vision and hearing impairment, for thyroid enlargement and for
UNRWA Global School based Student Health Survey (GSHS) 21 UNRWA school Health services ü New entrant's medical examination ü Screening: for vision and hearing impairment, for thyroid enlargement and for
Post-intervention multi-informant survey on knowledge, attitudes and practices (KAP) on disability and inclusive education
 on disability and inclusive education") Leonard Cheshire Disability and Inclusive Development Centre University College London Promoting the provision of inclusive primary education for children with disabilities in Mashonaland, West Province,
Leonard Cheshire Disability and Inclusive Development Centre University College London Promoting the provision of inclusive primary education for children with disabilities in Mashonaland, West Province,
Global School-based Student Health Survey (GSHS) and Global School Health Policy and Practices Survey (SHPPS): GSHS
 and Global School Health Policy and Practices Survey (SHPPS): GSHS") Global School-based Student Health Survey () and Global School Health Policy and Practices Survey (SHPPS): 08/2012 Overview of Agenda Overview of the Manual Roles and Responsibilities Personnel Survey
Global School-based Student Health Survey () and Global School Health Policy and Practices Survey (SHPPS): 08/2012 Overview of Agenda Overview of the Manual Roles and Responsibilities Personnel Survey
Global Health Kitwe, Zambia Elective Curriculum
 Global Health Kitwe, Zambia Elective Curriculum Title of Clerkship: Global Health Zambia Elective Clerkship Elective Type: Department(s): Clerkship Site: Course Number: Fourth-Year Elective Clerkship Psychiatry,
others have examples for how feedback mechanisms at the CBO level have been established?
 Dear Data Use Net members, Thanks for the many contributions for Day 3 we appreciate the time you took to submit your comments and examples. As a reminder for other readers, while we ask for your name
DEVELOPMENT PROJECT - LESOTHO
 DEVELOPMENT PROJECT - LESOTHO 10582.0 Strategic focus of the WFP Development Project: Support Access to Primary Education Number of beneficiaries: 80,000 (51 percent girls) Duration: 36 months (1 January
Department: Basic Education REPUBLIC OF SOUTH AFRICA MACRO INDICATOR TRENDS IN SCHOOLING: SUMMARY REPORT 2011
 Department: Basic Education REPUBLIC OF SOUTH AFRICA MACRO INDICATOR TRENDS IN SCHOOLING: SUMMARY REPORT 2011 Published by the Department of Basic Education Sol Plaatje House 222 Struben Street Pretoria
Rwanda. Out of School Children of the Population Ages Percent Out of School 10% Number Out of School 217,000
 Rwanda Out of School Children of the Population Ages 7-14 Number Out of School 217, Percent Out of School % Source: Demographic and Health Survey (DHS) 2 Comparison of Rates of Out of School Children Ages
BASIC EDUCATION IN GHANA IN THE POST-REFORM PERIOD
 BASIC EDUCATION IN GHANA IN THE POST-REFORM PERIOD By Abena D. Oduro Centre for Policy Analysis Accra November, 2000 Please do not Quote, Comments Welcome. ABSTRACT This paper reviews the first stage of
RCPCH MMC Cohort Study (Part 4) March 2016
 March 2016") RCPCH MMC Cohort Study (Part 4) March 2016 Acknowledgements Dr Simon Clark, Officer for Workforce Planning, RCPCH Dr Carol Ewing, Vice President Health Services, RCPCH Dr Daniel Lumsden, Former Chair,
RCPCH MMC Cohort Study (Part 4) March 2016 Acknowledgements Dr Simon Clark, Officer for Workforce Planning, RCPCH Dr Carol Ewing, Vice President Health Services, RCPCH Dr Daniel Lumsden, Former Chair,
Guinea. Out of School Children of the Population Ages Percent Out of School 46% Number Out of School 842,000
 Guinea Out of School Children of the Population Ages 7-14 Number Out of School 842, Percent Out of School 46% Source: Demographic and Health Survey (DHS) 25 Comparison of Rates of Out of School Children
Principal vacancies and appointments
 Principal vacancies and appointments 2009 10 Sally Robertson New Zealand Council for Educational Research NEW ZEALAND COUNCIL FOR EDUCATIONAL RESEARCH TE RŪNANGA O AOTEAROA MŌ TE RANGAHAU I TE MĀTAURANGA
Iep Data Collection Templates
 Iep Templates Free PDF ebook Download: Iep Templates Download or Read Online ebook iep data collection templates in PDF Format From The Best User Guide Database Data analysis process. Data collection and
UIC HEALTH SCIENCE COLLEGES
 Academic Mission Report: Board of Trustees March 10, 2010 Joseph A. Flaherty, MD Dean, College of Medicine INNOVATION EXCELLENCE SERVICE Brief History 1858 Illinois Eye and Ear Infirmary opens 1859 College
Risk factors in an ageing population: Evidence from SAGE
 Risk factors in an ageing population: Evidence from SAGE Ruy López Ridaura, Rosalba Rojas: National Institute of Public Health, Mexico Center of Research in Population Health. Nirmala Naidoo: Department
Educational Attainment
 A Demographic and Socio-Economic Profile of Allen County, Indiana based on the 2010 Census and the American Community Survey Educational Attainment A Review of Census Data Related to the Educational Attainment
Western Australia s General Practice Workforce Analysis Update
 Western Australia s General Practice Workforce Analysis Update NOVEMBER 2015 PUBLISHED MAY 2016 Rural Health West This work is copyright. Apart from any use as permitted under the Copyright Act 1968, no
Basic Standards for Residency Training in Internal Medicine. American Osteopathic Association and American College of Osteopathic Internists
 Basic Standards for Residency Training in Internal Medicine American Osteopathic Association and American College of Osteopathic Internists BOT Rev. 2/2011 TABLE OF CONTENTS I. Introduction... 3 II Mission...
360 Huntington Ave R218 TF (617)
") Curriculum Vitae BRANDON DIONNE, PHARMD, BCPS, AAHIVP 360 Huntington Ave R218 TF (617) 373-7460 Boston, MA 02115 b.dionne@northeastern.edu EDUCATION AND TRAINING PGY2 Pharmacy Residency in Infectious Diseases
Curriculum Vitae BRANDON DIONNE, PHARMD, BCPS, AAHIVP 360 Huntington Ave R218 TF (617) 373-7460 Boston, MA 02115 b.dionne@northeastern.edu EDUCATION AND TRAINING PGY2 Pharmacy Residency in Infectious Diseases
ANNUAL CURRICULUM REVIEW PROCESS for the 2016/2017 Academic Year
 ANNUAL CURRICULUM REVIEW PROCESS for the 2016/2017 Academic Year Annual Curriculum review is a process undertaken in advance of each new academic year to renew, revise and update curriculum. Faculty members,
The One Minute Preceptor: 5 Microskills for One-On-One Teaching
 The One Minute Preceptor: 5 Microskills for One-On-One Teaching Acknowledgements This monograph was developed by the MAHEC Office of Regional Primary Care Education, Asheville, North Carolina. It was developed
Making Health Happen on Campus: A Review of a Required General Education Health Course
 { Making Health Happen on Campus: A Review of a Required General Education Health Course Craig M. Becker, Hans Johnson, Karen Vail-Smith, Cathy Maahs-Fladung, Debra Tavasso, Barry Elmore, and Charla Blumell
jpr / report Learning Disabilities: Understanding their prevalence in the British Jewish community L. Daniel Staetsky
 jpr / report Institute for Jewish Policy Research February 2017 Learning Disabilities: Understanding their prevalence in the British Jewish community L. Daniel Staetsky The Institute for Jewish Policy
Iowa School District Profiles. Le Mars
 Iowa School District Profiles Overview This profile describes enrollment trends, student performance, income levels, population, and other characteristics of the public school district. The report utilizes
Leprosy case detection using schoolchildren
 Lepr Rev (2004) 75, 34±39 Leprosy case detection using schoolchildren G. NORMAN, G. A. JOSEPH, P. UDAYASURIYAN, P. SAMUEL & M. VENUGOPAL Schieffelin Leprosy Research and Training Center, Karigiri, Vellore
Navodaya Vidyalaya Samiti Noida
 Navodaya Vidyalaya Samiti Noida NOTICE Select list of students for admission to Class VI through JNVST-2017 has been released. The following activities may be taken up by the parents/guardians after selection
ZIMBABWE JOUBNAL OF EDUCATIONAL RESEARCH
 ZIMBABWE JOUBNAL OF EDUCATIONAL RESEARCH VOLUME 22 UNIV, Number 2 July 2010 ISBN: 1013-3445 THE FORGOTTEN WOMEN': A CASE STUDY OF REPRODUCTIVE HEALTH ISSUES AMONG WOMEN LIVING WITH DISABILITIES AND EDUCATIONAL
Management and monitoring of SSHE in Tamil Nadu, India P. Amudha, UNICEF-India
 Management and monitoring of SSHE in Tamil Nadu, India P. Amudha, UNICEF-India Photo: UNICEF India UNICEF and the Government of Tamil Nadu collaborated on scaling up the SSHE program in Tamil Nadu, a state
16-17 NOVEMBER 2017, MOSCOW, RUSSIAN FEDERATION OVERVIEW PRESENTATION
 16-17 NOVEMBER 2017, MOSCOW, RUSSIAN FEDERATION OVERVIEW PRESENTATION Tuberculosis is the leading infectious killer Current actions and investments are falling far short ENDING TB IN THE SUSTAINABLE DEVELOPMENT
Australia s tertiary education sector
 Australia s tertiary education sector TOM KARMEL NHI NGUYEN NATIONAL CENTRE FOR VOCATIONAL EDUCATION RESEARCH Paper presented to the Centre for the Economics of Education and Training 7 th National Conference
EDEXCEL FUNCTIONAL SKILLS PILOT TEACHER S NOTES. Maths Level 2. Chapter 4. Working with measures
 EDEXCEL FUNCTIONAL SKILLS PILOT TEACHER S NOTES Maths Level 2 Chapter 4 Working with measures SECTION G 1 Time 2 Temperature 3 Length 4 Weight 5 Capacity 6 Conversion between metric units 7 Conversion
JAWAHAR NAVODAYA VIDYALAYA BHILLOWAL, POST OFFICE PREET NAGAR DISTT. AMRITSAR (PUNJAB)
") Email: jnvlopoke_asr2spl@yahoo.com JAWAHAR NAVODAYA VIDYALAYA BHILLOWAL, POST OFFICE PREET NAGAR DISTT. AMRITSAR (PUNJAB) (TO BE FILLED IN CAPITAL LETTERS) NAME OF CANDIDATE: FATHER S NAME: MOTHER S NAME:
Email: jnvlopoke_asr2spl@yahoo.com JAWAHAR NAVODAYA VIDYALAYA BHILLOWAL, POST OFFICE PREET NAGAR DISTT. AMRITSAR (PUNJAB) (TO BE FILLED IN CAPITAL LETTERS) NAME OF CANDIDATE: FATHER S NAME: MOTHER S NAME:
PROGRAM REQUIREMENTS FOR RESIDENCY EDUCATION IN DEVELOPMENTAL-BEHAVIORAL PEDIATRICS
 In addition to complying with the Program Requirements for Residency Education in the Subspecialties of Pediatrics, programs in developmental-behavioral pediatrics also must comply with the following requirements,
TENNESSEE S ECONOMY: Implications for Economic Development
 TENNESSEE S ECONOMY: Implications for Economic Development William F. Fox, Director Center for Business and Economic Research The University of Tennessee, Knoxville August 2005 U.S. ECONOMY W.F. Fox, CBER,
Executive Programmes 2013
 Executive Programmes 2013 INTRODUCTION In order to overcome the many contemporary challenges facing public service delivery, a high degree of management sophistication is required. The executive programmes
Monitoring & Evaluation Tools for Community and Stakeholder Engagement
 Monitoring & Evaluation Tools for Community and Stakeholder Engagement Stephanie Seidel and Stacey Hannah Critical Path to TB Drug Regimens 2016 Workshop April 4, 2016 Washington, DC Community and Stakeholder
Data-Based Decision Making: Academic and Behavioral Applications
 Data-Based Decision Making: Academic and Behavioral Applications Just Read RtI Institute July, 008 Stephanie Martinez Florida Positive Behavior Support Project George Batsche Florida Problem-Solving/RtI
The Tutor Shop Homework Club Family Handbook. The Tutor Shop Mission, Vision, Payment and Program Policies Agreement
 The Tutor Shop Homework Club Family Handbook The Tutor Shop Mission, Vision, Payment and Program Policies Agreement Our Goals: The Tutor Shop Homework Club seeks to provide after school academic support
INSTRUCTION MANUAL. Survey of Formal Education
 INSTRUCTION MANUAL Survey of Formal Education Montreal, January 2016 1 CONTENT Page Introduction... 4 Section 1. Coverage of the survey... 5 A. Formal initial education... 6 B. Formal adult education...
The patient-centered medical
 Primary Care Residents Want to Learn About the Patient- Centered Medical Home Gerardo Moreno, MD, MSHS; Julia Gold, MD; Maureen Mavrinac, MD BACKGROUND AND OBJECTIVES: The patient-centered medical home
MOESAC MEDIUM TERM PLAN
 MOESAC MEDIUM TERM PLAN 2011-15 Introduction Medium Term Plan is a key output of a strategic planning process that was initiated in 2010. The process began with a broad-based stakeholder consultation exercise
Gridlocked: The impact of adapting survey grids for smartphones. Ashley Richards 1, Rebecca Powell 1, Joe Murphy 1, Shengchao Yu 2, Mai Nguyen 1
 Gridlocked: The impact of adapting survey grids for smartphones Ashley Richards 1, Rebecca Powell 1, Joe Murphy 1, Shengchao Yu 2, Mai Nguyen 1 1 RTI International 2 New York City Department of Health
University of Toronto
 University of Toronto OFFICE OF THE VICE PRESIDENT AND PROVOST 1. Introduction A Framework for Graduate Expansion 2004-05 to 2009-10 In May, 2000, Governing Council Approved a document entitled Framework
Status of Women of Color in Science, Engineering, and Medicine
 Status of Women of Color in Science, Engineering, and Medicine The figures and tables below are based upon the latest publicly available data from AAMC, NSF, Department of Education and the US Census Bureau.
You said we did. Report on improvements being made to Children s and Adolescent Mental Health Services. December 2014
 You said we did Report on improvements being made to Children s and Adolescent Mental Health Services December 2014 Bracknell and Ascot Clinical Commissioning Group Newbury and Community Clinical Commissioning
Local authority National Indicator Map 2009
 November 2009 1 The Home Access programme Local authority National Map 2009 Delivered by 2 Contents: Section 1 About the National Map Section 2 National Map tables Section 3 National supporting evidence
Improving Result Adaptation through 2-step Retrieval
 Improving Result Adaptation through 2-step Retrieval Meike Reichle and Kerstin Bach Intelligent Information Systems Lab University of Hildesheim Marienburger Platz 22, 31141 Hildesheim, Germany {reichle
AUTHORITATIVE SOURCES ADULT AND COMMUNITY LEARNING LEARNING PROGRAMMES
 AUTHORITATIVE SOURCES ADULT AND COMMUNITY LEARNING LEARNING PROGRAMMES AUGUST 2001 Contents Sources 2 The White Paper Learning to Succeed 3 The Learning and Skills Council Prospectus 5 Post-16 Funding
Second Annual FedEx Award for Innovations in Disaster Preparedness Submission Form I. Contact Information
 Second Annual FedEx Award for Innovations in Disaster Preparedness Submission Form I. Contact Information Name: Heather Bennett Title: Director, Foundation and Corporate Development Organization: Direct
(ALMOST?) BREAKING THE GLASS CEILING: OPEN MERIT ADMISSIONS IN MEDICAL EDUCATION IN PAKISTAN
 BREAKING THE GLASS CEILING: OPEN MERIT ADMISSIONS IN MEDICAL EDUCATION IN PAKISTAN") (ALMOST?) BREAKING THE GLASS CEILING: OPEN MERIT ADMISSIONS IN MEDICAL EDUCATION IN PAKISTAN Tahir Andrabi and Niharika Singh Oct 30, 2015 AALIMS, Princeton University 2 Motivation In Pakistan (and other
(ALMOST?) BREAKING THE GLASS CEILING: OPEN MERIT ADMISSIONS IN MEDICAL EDUCATION IN PAKISTAN Tahir Andrabi and Niharika Singh Oct 30, 2015 AALIMS, Princeton University 2 Motivation In Pakistan (and other
Executive Guide to Simulation for Health
 Executive Guide to Simulation for Health Simulation is used by Healthcare and Human Service organizations across the World to improve their systems of care and reduce costs. Simulation offers evidence
Kenya: Age distribution and school attendance of girls aged 9-13 years. UNESCO Institute for Statistics. 20 December 2012
 1. Introduction Kenya: Age distribution and school attendance of girls aged 9-13 years UNESCO Institute for Statistics 2 December 212 This document provides an overview of the pattern of school attendance
SASKATCHEWAN MINISTRY OF ADVANCED EDUCATION
 SASKATCHEWAN MINISTRY OF ADVANCED EDUCATION Report March 2017 Report compiled by Insightrix Research Inc. 1 3223 Millar Ave. Saskatoon, Saskatchewan T: 1-866-888-5640 F: 1-306-384-5655 Table of Contents
Regional Bureau for Education in Africa (BREDA)
") United Nations Education, Scientific and Cultural Organization Regional Bureau for Education in Africa (BREDA) Regional Conference on Higher Education in Africa (CRESA) 10-13 November 2008 Preparatory
United Nations Education, Scientific and Cultural Organization Regional Bureau for Education in Africa (BREDA) Regional Conference on Higher Education in Africa (CRESA) 10-13 November 2008 Preparatory
Mayo Clinic 1 st Annual Update on Infectious Diseases for Primary Care
 Mayo School of Continuous Professional Development Mayo Clinic 1 st Annual Update on Infectious Diseases for Primary Care Juanita Kious Waugh Auditorium Mayo Clinic Education Center Phoenix, Arizona Saturday
Upon completion of the Integrated Core Curriculum students will demonstrate competence in:
 PUH 600-601: The Public Health Integrated Core Curriculum PUH 600, Fall Semester, 2004-2005 9 credit hours Lectures: days 9:05 -, nesdays 9:05-12:05, and days 9:05 - Help Sessions day - 12:05 Lab Session:
How can climate change be considered in Vulnerability and Capacity Assessments? - A summary for practitioners April 2011
 How can climate change be considered in Vulnerability and Capacity Assessments? - A summary for practitioners April 2011 Why this document? The aim of this document is to provide inspiration for practitioners
THE UNITED REPUBLIC OF TANZANIA MINISTRY OF EDUCATION, SCIENCE, TECHNOLOGY AND VOCATIONAL TRAINING CURRICULUM FOR BASIC EDUCATION STANDARD I AND II
 THE UNITED REPUBLIC OF TANZANIA MINISTRY OF EDUCATION, SCIENCE, TECHNOLOGY AND VOCATIONAL TRAINING CURRICULUM FOR BASIC EDUCATION STANDARD I AND II 2016 Ministry of Education, Science,Technology and Vocational
OFFICE OF ENROLLMENT MANAGEMENT. Annual Report
 2014-2015 OFFICE OF ENROLLMENT MANAGEMENT Annual Report Table of Contents 2014 2015 MESSAGE FROM THE VICE PROVOST A YEAR OF RECORDS 3 Undergraduate Enrollment 6 First-Year Students MOVING FORWARD THROUGH
Study on the implementation and development of an ECVET system for apprenticeship
 Study on the implementation and development of an ECVET system for apprenticeship Thomas Reglin Gabriele Fietz Forschungsinstitut Betriebliche Bildung (f-bb) ggmbh Nuremberg Isabelle Le Mouillour BIBB,
Aalya School. Parent Survey Results
 Aalya School Parent Survey Results 2016-2017 Parent Survey Results Academic Year 2016/2017 September 2017 Research Office The Research Office conducts surveys to gather qualitative and quantitative data
Monitoring & Evaluation of Community and Stakeholder Engagement. Nombuyiselo Tshandu Wits Clinical HIV/TB Research Unit South Africa
 Monitoring & Evaluation of Community and Stakeholder Engagement Nombuyiselo Tshandu Wits Clinical HIV/TB Research Unit South Africa Clinical HIV Research Unit (CHRU) Based primarily at Helen Joseph Hospital
FRESNO COUNTY INTELLIGENT TRANSPORTATION SYSTEMS (ITS) PLAN UPDATE
 PLAN UPDATE") FRESNO COUNTY INTELLIGENT TRANSPORTATION SYSTEMS (ITS) PLAN UPDATE DELIVERABLE NO. 1 PROJECT PLAN FRESNO COUNTY, CALIFORNIA Prepared for Fresno Council of Governments 2035 Tulare Street, Suite 201 Fresno,
FRESNO COUNTY INTELLIGENT TRANSPORTATION SYSTEMS (ITS) PLAN UPDATE DELIVERABLE NO. 1 PROJECT PLAN FRESNO COUNTY, CALIFORNIA Prepared for Fresno Council of Governments 2035 Tulare Street, Suite 201 Fresno,
Paramedic Science Program
 Paramedic Science Program Paramedic Science Program Faculty Chair Michael Mikitish Chair, Emergency Services Department Emergency Medical Services (EMS) An Associate of Science degree in Paramedic Science
Probability estimates in a scenario tree
 101 Chapter 11 Probability estimates in a scenario tree An expert is a person who has made all the mistakes that can be made in a very narrow field. Niels Bohr (1885 1962) Scenario trees require many numbers.
. Town of birth. Nationality. address)
") ACTING BA (HONS) IN ACTING / FOUNDATION COURSE IN ACTING APPLICATION FOR ENTRY IN SEPTEMBER 2018 PLEASE COMPLETE ALL SECTIONS OF THIS APPLICATION FORM AND RETURN IT WITH THE REGISTRATION FEE Please tick
ACTING BA (HONS) IN ACTING / FOUNDATION COURSE IN ACTING APPLICATION FOR ENTRY IN SEPTEMBER 2018 PLEASE COMPLETE ALL SECTIONS OF THIS APPLICATION FORM AND RETURN IT WITH THE REGISTRATION FEE Please tick
Update on the Next Accreditation System Drs. Culley, Ling, and Wood. Anesthesiology April 30, 2014
 Accreditation Council for Graduate Medical Education Update on the Next Accreditation System Drs. Culley, Ling, and Wood Anesthesiology April 30, 2014 Background of the Next Accreditation System Louis
ZIMBABWE ARTICLE 5 DEADLINE: 1 JANUARY 2018 (NOT ON TRACK TO MEET DEADLINE) PROGRAMME PERFORMANCE For 2015 For 2014
 PROGRAMME PERFORMANCE For 2015 For 2014") ZIMBABWE ARTICLE 5 DEADLINE: 1 JANUARY 2018 (NOT ON TRACK TO MEET DEADLINE) PROGRAMME PERFORMANCE For 2015 For 2014 Problem understood 8 8 Target date for completion of mine clearance 5 5 Targeted clearance
ZIMBABWE ARTICLE 5 DEADLINE: 1 JANUARY 2018 (NOT ON TRACK TO MEET DEADLINE) PROGRAMME PERFORMANCE For 2015 For 2014 Problem understood 8 8 Target date for completion of mine clearance 5 5 Targeted clearance
GRANT WOOD ELEMENTARY School Improvement Plan
 GRANT WOOD ELEMENTARY 2014-15 School Improvement Plan Building Leadership Team Cindy Stock and Nicole Shaw, BLT Co-Chairs Lisa Johnson, Kindergarten Liz Altemeier, First Grade Megan Goldensoph, Third Grade
Abu Dhabi Indian. Parent Survey Results
 Abu Dhabi Indian Parent Survey Results 2016-2017 Parent Survey Results Academic Year 2016/2017 September 2017 Research Office The Research Office conducts surveys to gather qualitative and quantitative
MASTER OF EDUCATION (M.ED), MAJOR IN PHYSICAL EDUCATION
, MAJOR IN PHYSICAL EDUCATION") Master of Education (M.Ed), Major in Physical Education 1 MASTER OF EDUCATION (M.ED), MAJOR IN PHYSICAL EDUCATION Major Program The sports education concentration (master s only or master's and teacher
Master of Education (M.Ed), Major in Physical Education 1 MASTER OF EDUCATION (M.ED), MAJOR IN PHYSICAL EDUCATION Major Program The sports education concentration (master s only or master's and teacher
Student Transportation
 The district has not developed systems to evaluate transportation activities and improve operations. In addition, the district needs to systematically replace its aging buses. Conclusion The Manatee County
Abu Dhabi Grammar School - Canada
 Abu Dhabi Grammar School - Canada Parent Survey Results 2016-2017 Parent Survey Results Academic Year 2016/2017 September 2017 Research Office The Research Office conducts surveys to gather qualitative
Annex 4 University of Dar es Salaam, Tanzania
 Inception Report for Growth and Employment Platform First phase (August 2011- July 2013) 15 November 2011 Annex 4 University of Dar es Salaam, Tanzania Content: 1. Action plan 2. PhD Courses 3. PhD Scholarships
COURSE LISTING. Courses Listed. Training for Cloud with SAP SuccessFactors in Integration. 23 November 2017 (08:13 GMT) Beginner.
 Beginner.") Training for Cloud with SAP SuccessFactors in Integration Courses Listed Beginner SAPHR - SAP ERP Human Capital Management Overview SAPHRE - SAP ERP HCM Overview Advanced HRH00E - SAP HCM/SAP SuccessFactors
Training for Cloud with SAP SuccessFactors in Integration Courses Listed Beginner SAPHR - SAP ERP Human Capital Management Overview SAPHRE - SAP ERP HCM Overview Advanced HRH00E - SAP HCM/SAP SuccessFactors
Redirected Inbound Call Sampling An Example of Fit for Purpose Non-probability Sample Design
 Redirected Inbound Call Sampling An Example of Fit for Purpose Non-probability Sample Design Burton Levine Karol Krotki NISS/WSS Workshop on Inference from Nonprobability Samples September 25, 2017 RTI
Accessing Higher Education in Developing Countries: panel data analysis from India, Peru and Vietnam
 Accessing Higher Education in Developing Countries: panel data analysis from India, Peru and Vietnam Alan Sanchez (GRADE) y Abhijeet Singh (UCL) 12 de Agosto, 2017 Introduction Higher education in developing
Education in Armenia. Mher Melik-Baxshian I. INTRODUCTION
 Education in Armenia Mher Melik-Baxshian I. INTRODUCTION Education has always received priority in Armenia a country that has a history of literacy going back 1,600 years. From the very beginning the school
Empowering Women to Choose Breastfeeding. Breastfeeding. the gift that lasts a lifetime. Exam the negative feelings behind a woman s decision to
 Empowering Women to Choose Breastfeeding Rose Marie Straeter, MA, IBCLC, RLC Breastfeeding the gift that lasts a lifetime. While breastfeeding may not seem the right choice for every parent, it is the
Self-archived version. Citation:
 Self-archived version Citation: Kautola, H., Hyttinen, T., Kakko, L., Väisänen, K., Alarinta, J. (2016). Building a national education export network for the food chain (FLEN). In Vanhanen, R. (ed.) Export
Service-Learning Projects in a Public Health in Pharmacy Course 1
 Service-Learning Projects in a Public Health in Pharmacy Course 1 Jean T. Carter and Gayle A. Cochran School of Pharmacy and Allied Health Sciences, The University of Montana, Skaggs Building, Missoula
QUEEN S UNIVERSITY BELFAST SCHOOL OF MEDICINE, DENTISTRY AND BIOMEDICAL SCIENCES ADMISSION POLICY STATEMENT FOR DENTISTRY FOR 2016 ENTRY
 FINAL QUEEN S UNIVERSITY BELFAST SCHOOL OF MEDICINE, DENTISTRY AND BIOMEDICAL SCIENCES ADMISSION POLICY STATEMENT FOR DENTISTRY FOR 2016 ENTRY 1. Introduction It is the policy of the University that all
Implementation Status & Results Honduras Honduras Education Quality, Governance, & Institutional Strengthening (P101218)
") Public Disclosure Authorized Public Disclosure Authorized The World Bank Implementation Status & Results Honduras Honduras Education Quality, Governance, & Institutional Strengthening (P101218) Operation
Public Disclosure Authorized Public Disclosure Authorized The World Bank Implementation Status & Results Honduras Honduras Education Quality, Governance, & Institutional Strengthening (P101218) Operation
Great Teachers, Great Leaders: Developing a New Teaching Framework for CCSD. Updated January 9, 2013
 Great Teachers, Great Leaders: Developing a New Teaching Framework for CCSD Updated January 9, 2013 Agenda Why Great Teaching Matters What Nevada s Evaluation Law Means for CCSD Developing a Teaching Framework
Research Update. Educational Migration and Non-return in Northern Ireland May 2008
 Research Update Educational Migration and Non-return in Northern Ireland May 2008 The Equality Commission for Northern Ireland (hereafter the Commission ) in 2007 contracted the Employment Research Institute
Report on Keo Kou Community Learning Centre
 Lao People s Democratic Republic Peace Independence Democratic Unity Prosperity Report on Keo Kou Community Learning Centre By: Mr. Bounkhong THOUMMAVONG Mr. Chaleun SOUVONG Contents I. Conception. 1 II.
Q1: Why Is Data Analysis Important? Frequently Asked Questions and Answers on BRFSS Data Analysis and Methods. Q2: How Reliable Are BRFSS Data?
 Frequently Asked Questions and Answers on BRFSS Data Analysis and Methods BRFSS Epidemiologists and Staff Division of Behavioral Surveillance PHSIPO, OSELS, CDC Q1: Why Is Data Analysis Important? A1.
Where has all the education gone in Sub-Saharan Africa? Employment and other outcomes among secondary school and university leavers
 MPRA Munich Personal RePEc Archive Where has all the education gone in Sub-Saharan Africa? Employment and other outcomes among secondary school and university leavers Samer Al-Samarrai and Paul Bennell
Writing Functional Dysphagia Goals
 Writing Functional Dysphagia Goals Free PDF ebook Download: Writing Functional Dysphagia Goals Download or Read Online ebook writing functional dysphagia goals in PDF Format From The Best User Guide Database
900 Point Breakthrough Leading Hen TOEIC TEST Level Different Matter Collection (level Different Matter Collection Series) (2011) ISBN:
 (2011) ISBN:") 900 Point Breakthrough Leading Hen TOEIC TEST Level Different Matter Collection (level Different Matter Collection Series) (2011) ISBN: 4890855262 [Japanese Import] If you are searching for the ebook 900
900 Point Breakthrough Leading Hen TOEIC TEST Level Different Matter Collection (level Different Matter Collection Series) (2011) ISBN: 4890855262 [Japanese Import] If you are searching for the ebook 900
New Education Division Documents No. 13. Post-basic Education in Partner Countries
 M AY 2 0 0 3 D E S O E D U C AT I O N D I V I S I O N New Education Division Documents No. 13 Post-basic Education in Partner Countries NEW EDUCATION DIVISION DOCUMENTS NO. 13 Christine McNab Post-basic
SCORING KEY AND RATING GUIDE
 FOR TEACHERS ONLY The University of the State of New York Le REGENTS HIGH SCHOOL EXAMINATION LIVING ENVIRONMENT Wednesday, June 19, 2002 9:15 a.m. to 12:15 p.m., only SCORING KEY AND RATING GUIDE Directions
5.7 Country case study: Vietnam
 5.7 Country case study: Vietnam Author Nguyen Xuan Hung, Secretary, Vietnam Pharmaceutical Association, xuanhung29@vnn.vn Summary Pharmacy workforce development has only taken place over the last two decades
A Global Imperative for 2015: Secondary Education. Ana Florez CIES, New Orleans March 11th, 2013
 A Global Imperative for 2015: Secondary Education Ana Florez CIES, New Orleans March 11th, 2013 Panel Presentation Map 1. Why secondary education? 2. Definitions and Approaches 3. Early Marriage and Parenthood
Physicians Medical Center (Texas Health Center for Diagnostics & Surgery Plano) Community Health Needs Assessment
 Community Health Needs Assessment") Physicians Medical Center (Texas Health Center for Diagnostics & Surgery Plano) Community Health Needs Assessment 2013 Table of Contents Executive Summary Why a Community Health Needs Assessment Community
Physicians Medical Center (Texas Health Center for Diagnostics & Surgery Plano) Community Health Needs Assessment 2013 Table of Contents Executive Summary Why a Community Health Needs Assessment Community
Universal Design for Learning Lesson Plan
 Universal Design for Learning Lesson Plan Teacher(s): Alexandra Romano Date: April 9 th, 2014 Subject: English Language Arts NYS Common Core Standard: RL.5 Reading Standards for Literature Cluster Key
SACMEQ's main mission was set down by the SACMEQ Assembly of Ministers as follows:
 THE SOUTH AND EASTERN AFRICA CONSORTIUM FOR MONITORING EDUCATION QUALITY (SACMEQ) 1.0 Background The South African Consortium for Monitoring Education Quality (SACMEQ) is a collaboration between the International