With just three years to go until
|
|
|
- Daisy Lewis
- 6 years ago
- Views:
Transcription
1 0 1 2 Education for All Global Monitoring Report 2 Part 1 With just three years to go until the deadline for the Education for All goals that were set in Dakar, Senegal, it is vitally urgent to ensure that the collective commitments made by 164 countries in 2000 are met. Lessons also need to be drawn to inform the definition of future international education goals and the design of mechanisms to make sure that all partners live up to their promises. Unfortunately, this year s EFA Global Monitoring Report shows that progress towards many of the targets is slowing down, and that most EFA goals are unlikely to be met. After remarkable progress in the initial years after Dakar, the global number of children out of school stagnated at 61 million in 2010, the latest year for which data are available. In 28 countries, fewer than 85 out of 100 children were in school in 2010, excluding a number of conflict-affected countries for which data are not available. It is clear that the target of universal primary education will be missed by a considerable margin. Of particular concern is that the number of out-of-school children in sub-saharan Africa the region already furthest from achieving EFA increased by 1.6 million between 2008 and Governments and their partners urgently need to increase their support to education in countries with large numbers of out-of-school children, paying particular attention to marginalized groups. Despite the gloomy outlook overall, progress in some of the world s poorest countries shows what can be achieved with the commitment of national governments and aid donors, including greater numbers of children attending preschool, completing primary school and making the transition to secondary education. The goal closest to being achieved is gender parity. A more detailed assessment of each of the EFA goals helps identify where efforts should be concentrated to make up for lost ground in the short time remaining until 2015: Monitoring progress Progress on early childhood care and education has been too slow. The early years are critical for child development. As this Report shows, pre-primary education is the key to improving learning in subsequent years. Yet in many countries with low preprimary enrolment, a large proportion of places are at private pre-schools that cost too much for those who need them most. Even in countries with higher enrolment, children in poorer areas are more likely to lack access or to have access only to preschools that are less well resourced. Policymakers must act urgently to improve access to pre-school. Moreover, while progress on child health and nutrition appears to be speeding up, it is coming too late to achieve the Millennium Development Goals on child mortality and malnutrition. Many children do not complete primary school. To improve universal primary enrolment, governments must renew efforts to prevent dropout. Of 100 children out of school, 47 are never expected to enter school at all. While this is shocking, within a period of six years the share has come down from 61. However, the share of out-of-school children who have dropped out has increased from 9 out of 100 to 26 out of 100. Whether they live in low income or middle income countries, children from marginalized households are more likely to enter late and to drop out early. Despite the abolition of school fees in many countries, costs associated with schooling still prevent many children from attending school. Adult literacy remains an elusive goal. The world will miss the target of halving adult illiteracy between 1990 and Over 400 million of the global total of 775 million illiterate adults live in South and West Asia. The number of illiterate adults has risen over the period by 27% in sub-saharan Africa. And around two-thirds of the world s illiterate adults are women. Direct measurements of literacy skills reveal large percentages of illiterate adults even among those who have 34
2 Education for All Global Monitoring Report towards the EFA goals completed primary education, and show that being literate is not a clear-cut matter of yes or no. In richer countries, this more nuanced picture has revealed that as many as one in five are likely to have very poor literacy skills. Gender disparities take a variety of forms. Global averages suggesting that gender parity in access to school has almost been attained can be deceptive. Many countries continue to struggle with ensuring that gender is not an obstacle to education. Despite progress in reducing severe disparity in access to primary school, there are still seventeen countries with fewer than nine girls for every ten boys in primary school. In secondary education, a majority of upper middle and high income countries experience disparity at the expense of boys. Regional and international assessments of learning outcomes show that across the world there is a large and increasing gender gap in reading, with boys, especially from poorer backgrounds, falling behind. Global inequality in learning outcomes remains stark. While inequality in access to school is of great concern, there is a greater gulf in learning between rich and poor. As many as 250 million children could be failing to read or write by the time they should reach grade 4. It is time to focus on improving data availability to have a better look at this estimate, and on ensuring that learning is more central to efforts to improve educational development. Many middle and high income countries have benefited from using the results of learning assessments as a basis to improve outcomes and reduce inequality. The world as a whole needs to do the same. on the horizon. Many of the countries furthest behind on the EFA goals have benefited from aid. Even if the economic downturn has not yet hit the education budgets of low and middle income countries as much as had been feared, it has hit the aid budgets of richer countries. Some have reacted by reducing the emphasis on education in their aid portfolio. How will the widening financing gaps be filled? Aid from Brazil, China and India is expected to increase but is unlikely to be a strong complement to what is already available in the short term. Contributions from private foundations and corporations appear too small to make a significant difference and are not focused on the countries that most need support. The role of the Global Partnership for Education, as a coordinating mechanism channelling resources where they are likely to have the biggest impact, needs to be strengthened. Governments need to continue prioritizing education and improving revenue collection. One option in countries endowed with natural resources is to use this revenue to invest in education as a way to overcome the resource curse. Not only must resource-rich countries ensure that they are getting a fair share of the profits generated, but they and their partners must also adhere to revenue transparency standards. The EFA community should get involved in national debates on the use of natural resource revenue to make the case for investment in education. The Dakar Framework for Action included a commitment that no country should be left behind due to lack of resources. Increased spending on education has been a common ingredient of positive educational outcomes over the past ten years, with expanding education budgets in low income countries contributing to remarkable success. However, there are clouds 35


3 Credit: Giacomo Pirozzi/Panos Education for All Global Monitoring Report


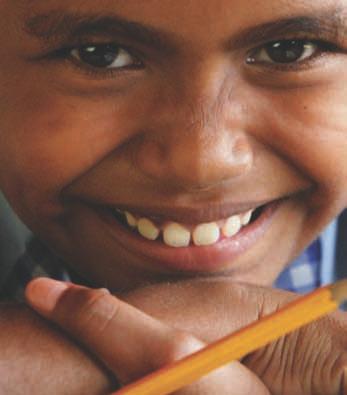
4 Education for All Global Monitoring Report Chapter 1 The six EFA goals A girl in grade 2 at St John Primary School in Honiara, Solomon Islands. Progress in reducing the number of children who are not enrolled in primary school has stalled since

5 PART I: MONITORING PROGRESS TOWARDS THE EFA GOALS 2 Education for All Global Monitoring Report Goal 1: Early childhood care and education...39 Policy focus: Preparing children for school by expanding pre-primary education...48 Goal 2: Universal primary education...58 Policy focus: Reducing costs of primary school for the poorest...69 Goal 3: Youth and adult learning needs...80 Policy focus: Life skills education can help tackle HIV and AIDS...84 Goal 4: Improving levels of adult literacy...90 Policy focus: Strengthening adult literacy in rich countries...98 Goal 5: Assessing gender parity and equality in education Policy focus: Challenging disadvantage and disengagement among boys in secondary school Goal 6: The quality of education Policy focus: Addressing the crisis in early grade teaching It is ten years since the EFA Global Monitoring Report began following progress towards the international education goals. Over this time, many more children have had the opportunity to go to school. On current trends, however, the promise made in Dakar will be broken for millions of children, young people and adults unless governments act with greater urgency. 38
6 THE SIX EFA GOALS Goal 1: Early childhood care and education Goal 1 Early childhood care and education Expanding and improving comprehensive early childhood care and education, especially for the most vulnerable and disadvantaged children. Highlights Early childhood care and education (ECCE) is improving, but from a low base in some regions. The child mortality rate fell from 88 per 1,000 live births in 1990 to 60 in 2010, but current rates of decline are insufficient to achieve the target of 29 by In 2010, there were still 28 countries where the child mortality rate exceeded 100 per 1,000 live births. It is projected that around one in four children globally will suffer from moderate or extreme stunting by In half of low income countries with data, the stunting rate was 40% or higher in Despite a 46% increase in the number of children enrolled in pre-school between 1999 and 2010, less than half the world s children receive pre-primary education. Progress has been slowest in low income countries, where only 15% of children received pre-primary education in Table 1.1: Key indicators for goal 1 Care Pre-primary education Under-5 mortality rate ( ) ( ) Moderate and severe stunting (children under age 5) Total enrolment Gross enrolment ratio (GER) Gender parity index of GER (%) 2010 (000) Change since 1999 (%) World Low income countries Lower middle income countries Upper middle income countries High income countries (%) 2010 (%) 1999 (F/M) 2010 (F/M) Sub-Saharan Africa Arab States Central Asia East Asia and the Pacific South and West Asia Latin America and the Caribbean North America and Western Europe Central and Eastern Europe Sources: Annex, Statistical Tables 3A and 3B (print) and Statistical Table 3A (website); UIS database. 39
7 0 1 2 PART I: MONITORING PROGRESS TOWARDS THE EFA GOALS CHAPTER 1 Education for All Global Monitoring Report 2 Early childhood is widely recognized as the critical period in which to lay the foundations for success in education and beyond. Thus early childhood care and education should be at the centre of both the Education for All (EFA) and broader development agendas. National and international policy-makers are more convinced than ever that early childhood well-being is not only a right but also a cost-effective investment. The health of young children continues to improve, a fact demonstrated by substantial progress in the reduction of child mortality. The global number of deaths of children under 5 declined from 12 million in 1990 to 9.6 million in 2000 and 7.6 million in 2010 (IGME, 2011). This translates to a drop in the child mortality rate from 88 deaths per 1,000 live births in 1990 to 73 in 2000 and 60 in The annual rate of decline of the child mortality rate accelerated from 1.9% in to 2.5% in (UNICEF, 2012). But progress is insufficient to meet the fourth Millennium Development Goal (MDG) of reducing child mortality by two-thirds by The advance towards reducing child mortality rates has been slowest in South and West Asia and sub-saharan Africa, the regions with the highest mortality rates. Recent estimates suggest that just over half the decline in child deaths can be attributed to increased education attainment in women of reproductive age (Gakidou et al., 2010). Of the 28 countries where child mortality rates were above 100 per 1,000 live births in 2010, 25 were in sub-saharan Africa (the other three being Afghanistan, Djibouti and Mauritania). Chad is the country with the highest child mortality rate, 195 deaths per 1,000 live births. Of the 65 countries with more than 40 child deaths per 1,000 live births, only 11 are expected to reach the MDG target (IGME, 2011). Children marginalized by poverty, rural location and other factors have benefited least from progress (UNICEF, 2010b). Good nutrition in utero and in early childhood is crucial for children s health, well-being, growth and survival. It is also required for cognitive development. Progress is being made on nutrition, but not fast enough, especially in the poorest countries and for the most marginalized children. While global rates of moderate and severe stunting were 29% in 2010, they remained high in low income countries and were over 50% in four of the countries with data: Burundi, Ethiopia, the Niger and Timor-Leste. In many countries, there is large inequality between urban and rural areas. In Peru, for example, the stunting rate in rural areas in 2007/08 was almost triple that in urban areas. When there is a clear political commitment to increasing investment in a country s youngest citizens, however, meeting young children s right to adequate nutrition is possible [Panel 1.1]. Health and nutrition are of paramount importance for child development. In addition, equitable access to good quality pre-schools prepares young children for primary education, improves their prospects for learning and builds the foundations for positive social and economic outcomes in adulthood [goal 1, policy focus]. There has been significant progress across the world in extending access to pre-primary education since 1999, with the gross enrolment ratio increasing from 32% in 1999 to 48% in However, progress was larger in middle income countries than in low income countries, where only 15% of children attend pre-school. Globally more than half of young children remain excluded from pre-primary education. Gender parity in pre-primary education has been met everywhere but the Arab States region, which has nonetheless made significant progress since But enrolment rates differ widely by location and wealth. Children in remote, underserved areas and children of poorer households have fewer opportunities to attend even though they are the ones who stand to benefit most from pre-school. In Nigeria, for example, the attendance rate among children of the richest quintile was seven times as high as that for children from the poorest quintile in Greater levels of investment and better coordination among stakeholders are required if goal 1 is to be met. This edition of the EFA Global Monitoring Report introduces a new ECCE index that aims to capture the three main dimensions of child well-being encompassed by the early childhood care and education goal [Panel 1.2]. 40
8 THE SIX EFA GOALS Goal 1: Early childhood care and education Panel 1.1: Early childhood nutrition is improving globally, but progress is too slow and uneven Early childhood nutrition is crucial for children s health, well-being, growth and survival. Child malnutrition underlies more than half of all deaths among young children (Blössner and de Onis, 2005; Fishman et al., 2004). Insufficient food and poor quality food, with too few micronutrients, weaken children s immune systems, making them more vulnerable to disease. Malnutrition also hinders cognitive development and the capacity to learn, limiting progress towards the Education for All goals. According to the World Health Organization, stunting (low height for age) is the most appropriate measure of chronic child malnutrition (de Onis and Blössner, 1997). Globally, 171 million children under 5 were affected by moderate or severe stunting in On current trends, the number of children suffering from stunting will still be as high as 157 million in 2015, or around one in four children under the age of 5 (de Onis et al., 2012). Progress in reducing stunting has not been even across the world. Improvements over the past two decades are apparent in all regions except sub-saharan Africa, where, in the context of slow progress and rapid population growth, the number of stunted children increased from 38 million in 1990 to 55 million in The share of sub-saharan Africa in the global population of stunted children therefore increased dramatically in this period, from 15% to 32%, and is projected to reach 42% by 2020 (de Onis et al., 2012). As of 2010, sixteen of the twenty-four countries where the stunting rate is 40% or higher were in sub-saharan Africa. Moreover, looking at twenty-two countries with data from around 1990, progress has not been the same even within regions over the course of these two decades (Figure 1.1). For example, in the Arab States, the stunting rate in Mauritania fell from 55% to 23%, while it increased in Djibouti from 28% to 33%. In sub-saharan Africa, the stunting rate in Nigeria fell from 51% to 41%, while it remained stagnant in Cameroon at 36%. Figure 1.1: There has been considerable progress in reducing stunting, but it has been uneven Moderate or severe stunting rate, selected countries, from about 1990 to Circa Stunting rate (%) Large decrease Small decrease or increase Bangladesh India Mauritania Nigeria U. R. Tanzania Honduras Mexico Haiti Peru China Oman Dominican Rep. Jordan Brazil Jamaica Sierra Leone Cameroon Egypt Solomon Is. Djibouti Venezuela B. R. Paraguay Note: A child is moderately or severely stunted if its height for age is less than two standard deviations from the median of the reference population. Source: WHO (2012). 41
9 0 1 2 PART I: MONITORING PROGRESS TOWARDS THE EFA GOALS CHAPTER 1 Education for All Global Monitoring Report 2 Good nutrition is not just about whether a country produces enough food. It is also about whether children are healthy enough to benefit from the food they receive. This status depends on good water and sanitation, access to clinics, and good health and nutrition practices at home. As a result, rural areas have higher stunting rates even though they are food producing. An analysis of thirty-six countries found that rural areas had lower access to public services and, crucially, lower levels of maternal education, which is correlated with health-seeking and care-giving practices (Smith et al., 2005). In more than two-fifths of the eighty-eight countries with data available for , the difference in stunting rates between rural and urban children was more than ten percentage points (Figure 1.2). In several countries, such as the Democratic People s Republic of Korea, Honduras and Papua New Guinea, the rural-urban gap in stunting rates exceeds twenty percentage points. Figure 1.2: Malnutrition is a greater problem in rural areas Moderate or severe stunting rate by location, selected countries, Malnutrition is deeply rooted in poverty and deprivation. The poor cannot purchase food even when it is available in local markets. In most countries, malnutrition differences between the richest and the poorest exceed those between urban and rural inhabitants (Figure 1.3). For example, in Nepal, the stunting rate was 26% among the richest children and 56% among the poorest compared with corresponding rates of 27% in urban and 42% in rural areas. The poor are also vulnerable to price hikes, whether temporary or permanent, seasonal or unexpected. The substantial increase in staple food prices between 2007 and 2008 was correlated with an 8% increase in undernutrition in sub-saharan Africa (FAO, 2011). In the Horn of Africa, as of December 2011, it was estimated that about 850,000 children under 5 and 120,000 pregnant and lactating women were suffering from acute malnutrition in Kenya and Somalia alone because of the combined impact of drought-induced crop failure, conflict and displacement, 70 Rural Total Urban Stunting rate (%) Mexico Senegal El Salvador Belize Nicaragua Gambia Ghana Haiti Honduras DPR Korea Kenya Cameroon Mali Côte d Ivoire Liberia Guinea Nigeria Somalia U. R. Tanzania Mozambique Papua N. Guinea Benin Chad Lao PDR Rwanda Timor-Leste Source: WHO (2012). 42
10 THE SIX EFA GOALS Goal 1: Early childhood care and education Figure 1.3: In most countries, the gap in nutrition between the richest and the poorest exceeds the gap between urban and rural areas Moderate or severe stunting rate by location and wealth, selected countries Stunting rate (%) In Nepal, among children under age 5, the stunting rate was 26% in the richest 20% and 56% in the poorest 20% of households; it was 27% in urban areas and 42% in rural areas. 0 Location Wealth Location Wealth Location Wealth Location Wealth Location Wealth Location Wealth Location Wealth Location Wealth Location Wealth Egypt 2008 Viet Nam 2006 Uganda 2006 Nepal 2011 Bangladesh 2011 D. R. Congo 2010 Ethiopia 2011 India 2005/2006 Niger 2006 Rural Urban Poorest 20% Richest 20% Sources: Bangladesh NIPORT et al. (2012); D. R. Congo National Institute of Statistics and UNICEF (2011); El-Zanaty and Way (2009); Ethiopia Central Statistical Agency and ICF International (2012); International Institute for Population Sciences and Macro International Inc. (2007); Nepal Ministry of Health and Population et al. (2012); Niger National Institute of Statistics and Macro International Inc. (2007); Uganda Bureau of Statistics and Macro International Inc. (2007); Viet Nam General Statistics Office (2007). and the earlier food price rise (OCHA, 2011a, 2011b). The governments of Burkina Faso, Mauritania and the Niger have declared 2012 a crisis year. In the Niger, acute malnutrition affects 12% of children aged 6 to 59 months (IASC, 2012). Success in tackling child malnutrition varies widely among regions and countries. There are notable differences in progress between three of the five most populous countries, Brazil, India and China, which have all achieved impressive levels of economic growth in the past decade. Stunting rates in India have remained persistently high because of poor maternal nutrition, low birth weight, high levels of poverty and low levels of maternal education (Svedberg, 2009). Many Indians still struggle to meet their most basic needs, including access to sufficient food and health care. The fact that almost half of children under 5 are malnourished is a national shame, Prime Minister Manmohan Singh has said. Yet the main policy tool for tackling malnutrition, the network of Anganwadi centres, which cater for children under 6, pregnant women and lactating mothers, is not fulfilling its potential. A survey of more than 74,000 mothers found that only 19% of them reported receiving nutrition counselling (Naandi Foundation, 2011). By contrast, in Brazil and China, child malnutrition began declining dramatically around the mid-1990s, which led to the elimination of the urban-rural gap in Brazil and its reduction by more than two-thirds in China (Figure 1.4A). In Brazil, the expansion of primary schooling (leading to improved maternal education), maternal and child health services, and to a lesser extent the improvement of water supply and sanitation systems are considered the main determinants of 43
11 0 1 2 PART I: MONITORING PROGRESS TOWARDS THE EFA GOALS CHAPTER 1 Education for All Global Monitoring Report 2 this impressive outcome, alongside equitable growth (Monteiro et al., 2009; Victora et al., 2011). Mexico has emulated Brazil s success. The gap between urban and rural areas halved between 1998/99 and 2006, at least in part because of the Progresa programme and its successor, Oportunidades. As well as a cash transfer, the programmes provided food fortified with micronutrients to children aged 6 months to 23 months, to underweight children aged 2 to 4 and to pregnant and lactating women (Rivera et al., 2009). In some other Latin American countries, however, rates of malnutrition are higher than expected for their income level, and inequality rates in malnutrition are among the world s highest. The very limited progress in the last two decades in the Plurinational State of Bolivia, Figure 1.4: Country experiences in tackling malnutrition in rural areas vary enormously Moderate or severe stunting rate by location, selected countries, from about 1990 to Guatemala and Peru has mainly benefited children in urban areas (Figure 1.4B). In Peru, early evaluations of the national conditional cash transfer programme, Juntos, did not show any effect on malnutrition (Perova and Vakis, 2009). More recently, the government aligned Juntos with Crecer, the national nutrition strategy, by making the cash transfer conditional on regular monitoring of children s growth (Acosta, 2011). Fighting childhood malnutrition requires tackling poverty and building equitable access to health care, both of which require a clear political commitment to increase expenditure. Attention should be focused on interventions for pregnant women and children under 3, as it is difficult to reverse stunting after that age (Bhutta et al., 2008). A. India, China and Brazil B. Guatemala, Peru, the Plurinational State of Bolivia and Mexico Rural Urban Stunting rate (%) Stunting rate (%) / / / / / / / / / India China Brazil Guatemala Peru Bolivia, P. S. Mexico Note: In India, the rate is calculated for the 0 4 age group in the 1992/93 survey and the 0 3 age group in the 1998/99 survey. As a result, the stunting rate is underestimated in those years. Source: WHO (2012). 44
12 THE SIX EFA GOALS Goal 1: Early childhood care and education Panel 1.2: The ECCE index, a new instrument for monitoring goal 1 Each of the three key dimensions of early childhood development child health, nutrition and education is often considered as a separate goal. They are interrelated in many ways, however, so to understand progress towards goal 1 it is vital to pay attention to all of them simultaneously. This panel proposes a simple index that provides benchmarks to enable countries performance to be measured. 1 The ECCE index summarizes the results of early childhood development policies on: health, measured by the percentage of children who will survive beyond their fifth birthday; this ranges, among countries with a full set of data, from a low of 82% in Guinea-Bissau to a high of 99% in Chile; nutrition, measured by the percentage of children under 5 who do not suffer from moderate or severe stunting, which ranges from 45% in the Niger to 98% in Chile; education, measured by the percentage of children aged 3 to 7 who are enrolled either in pre-primary or in primary school, which ranges from 20% in Ethiopia to 95% in Belarus. 2 The value of the ECCE index is the mean of these three indicators. 3 Since each indicator is expressed in percentages, the value ranges from 0 to 1. Only 68 out of 205 countries had a full set of information on all these indicators in 2010 (or the most recent year for which data are available). The lack of data on stunting for most high income countries accounts largely for the gaps (Table 1.2). While this prevents a broader assessment of progress, it nevertheless provides useful insights into the global state of early childhood development. It is clear that most countries are far from assuring the minimum conditions for the youngest children. Of the sixty-eight countries, only Belarus achieved a 1. Among attempts to develop indices of early childhood development, a notable example is the Child Development Index (Save the Children, 2008) and the child component of the Mothers Index (Save the Children, 2012). UNESCO is developing a Holistic Early Childhood Development Index, which was proposed at the World Conference on ECCE in September This process has been informed by the publication of five background papers, which reviewed the relevance and availability of indicators in the fields of care, education and child development; policy and planning; social protection; legal protection; and health and nutrition (UNESCO, 2012a). 2. The age-specific enrolment ratio is used instead of the pre-primary or primary net enrolment ratio to be consistent with the common definition of early childhood as the period from birth until at least the age of primary school entry. 3. Using different weighting for the three indicators does not significantly change the ranking of countries. Additional information on the ECCE index is available on this Report s website. score over The twenty-five countries with an index score between 0.80 and 0.95, viewed as achieving a middle ranking, are mostly middle income countries in Central Asia, Central and Eastern Europe, and Latin America and the Caribbean. Many have good health and nutrition indicators but have made limited progress in early childhood education. Among countries in this group, enrolment ratios are below 60% in Brazil, the Dominican Republic and The former Yugoslav Republic of Macedonia. The remaining forty-two countries, with an index score below 0.80, are mostly low and lower middle income countries, and a majority are in sub-saharan Africa. There is also uneven development across the three dimensions, as a comparison of the country rank for each of the three component indicators shows (Figure 1.5). Some countries score almost equally well (such as Belarus and Chile) or equally poorly (such as the Niger) on all three. Others have a very high or very low score Figure 1.5: Progress towards early childhood goals varies widely across key dimensions Country rank, ECCE index and its three components, selected countries, 2010 Belarus, 1 Jamaica, 2 Chile, 3 Country rank, ECCE index and component indicators High Low Niger, 68 Health Nutrition Education ECCE Index Note: The ECCE index country rank is indicated next to the country name. Source: EFA Global Monitoring Report team calculations (2012). Bosnia and Herzegovina, 32 Cameroon, 44 Philippines, 51 45
13 0 1 2 PART I: MONITORING PROGRESS TOWARDS THE EFA GOALS CHAPTER 1 Education for All Global Monitoring Report 2 for one dimension relative to their overall standing in the index scale, which reveals specific challenges. For example, Jamaica and the Philippines both have a child mortality rate of 3% but are ranked at opposite ends of the overall ECCE index because of their nutrition and education records. Almost one in three children in the Philippines suffer from moderate or extreme stunting, compared with only one in twenty-seven in Jamaica. Only 38% of children aged 3 to 7 were enrolled in a pre-primary or primary school programme in the Philippines, compared with 89% in Jamaica. Despite great differences in child health and nutrition indicators between Bosnia and Herzegovina and Cameroon, related to the large difference in living standards, only 45% of 3- to 7-year-olds were enrolled Table 1.2: The ECCE index and its components, 2010 Rank Countries ECCE index Under 5 survival rate High ECCE index ( ) in some form of education in Bosnia and Herzegovina, compared with 60% in Cameroon. Although the poorest countries are also the ones with the lowest values on the ECCE index, the relationship between income and early childhood development outcomes weakens among middle income countries. For example, Botswana had an annual per capita income of US$13,700 (in purchasing power parity terms) in 2010, yet was ranked just above two countries with less than a fifth of its per capita income the Lao People s Democratic Republic (which had a higher enrolment ratio) and Senegal (which had a lower stunting rate). The ECCE index highlights the need for all countries, regardless of income, to invest in integrated approaches that give equal importance to all aspects of early childhood development. Children under 5 not suffering from moderate or severe stunting Age-specific enrolment ratio of children aged 3 to 7 1 Belarus Medium ECCE index ( ) 2 Jamaica Chile Kuwait Thailand Mexico Maldives Republic of Moldova Venezuela, B. R Belize Suriname Peru Montenegro Serbia Oman Colombia Brazil Viet Nam Dominican Republic Guyana Nicaragua TFYR Macedonia Mongolia Kazakhstan Panama Albania
14 THE SIX EFA GOALS Goal 1: Early childhood care and education Table 1.2: The ECCE index and its components, 2010 (continued) Rank Countries ECCE index Under 5 survival rate Low ECCE index (<0.80) Children under 5 not suffering from moderate or severe stunting Age-specific enrolment ratio of children aged 3 to 7 27 Jordan Palestine Algeria Turkey Paraguay Bosnia and Herzegovina El Salvador Sao Tome and Principe Ghana Honduras Syrian Arab Republic Bolivia, P. S Azerbaijan Kyrgyzstan Egypt Uzbekistan Indonesia Cameroon Kenya Swaziland Angola Gambia Congo Iraq Philippines Botswana Senegal Lao PDR Guatemala Cambodia Uganda Tajikistan Rwanda Djibouti Côte d Ivoire Guinea-Bissau Mali Guinea Burkina Faso Central African Republic Ethiopia Niger Note: The age-specific enrolment ratio of children aged 3 to 7 years measures the proportion of children in the corresponding age group who are enrolled in either pre-primary or primary school. Sources: EFA Global Monitoring Report team calculations (2012); Annex, Statistical Table 3A; UIS database. 47
15 0 1 2 PART I: MONITORING PROGRESS TOWARDS THE EFA GOALS CHAPTER 1 Education for All Global Monitoring Report 2 Policy focus: Preparing children for school by expanding pre-primary education Good quality pre-school programmes are vital to prepare young children for primary school. As the goal of universal primary education moves closer, concern has been rising over whether schoolchildren are actually acquiring the basic knowledge and skills that primary schools are meant to impart. This has focused attention not only on the quality of primary education but also on whether young children are being adequately prepared to benefit from primary school. This section shows that, as part of a comprehensive package of early childhood care and education interventions, equitable access to good quality pre-school programmes markedly improves young children s readiness to succeed in school. This can have particular advantages for those who are marginalized due to poverty or other factors. Yet participation in pre-school remains low in many countries, especially among children who need it most, and quality remains a concern. Action is needed to expand access to good quality pre-school programmes, particularly for the disadvantaged, and to better coordinate pre-school education with early childhood care and with primary school. Pre-primary education plays a key role in preparing children for school and beyond Young children are ready to learn, but their early experiences are crucial in facilitating their learning. Attending a good quality pre-school can lay the foundations for learning and help children make a smooth transition to primary school. Extending access to the poorest and most vulnerable children can boost their education and livelihood opportunities later in life. Figure 1.6: Pre-primary education has a positive impact on learning outcomes in school Score point difference between 15-year-old students who attended pre-primary school for more than one year and those who had not, after accounting for socio-economic background, selected countries, PISA 2009 Rep. of Korea Netherlands Turkey Russian Fed. Jordan Tunisia Romania Poland Canada Thailand Brazil Australia Germany Argentina Greece Denmark Italy Singapore 39 points are equivalent to one year of schooling In Australia, the net effect of attending pre-primary education is equivalent to one year of schooling The more time children spend in pre-school, the better their performance in school. Recent evidence based on the 2009 survey in the Programme for International Student Assessment (PISA) shows that in fifty-eight of sixty-five countries, 15-year-old students who had attended at least a year of pre-primary school outperformed students who had not, even after accounting for socio-economic background. In countries including Australia, Brazil and Germany, the average benefit after controlling for socio-economic background was equivalent to one year of schooling (Figure 1.6). Overall, PISA results suggest that the school systems that combine high performance and equitable learning opportunities for all students are also those that offer pre-primary education to a larger proportion of pupils, have smaller pupil/teacher ratios in pre-primary school, invest more per child at the pre-primary level and, especially, provide longer periods of pre-primary education (OECD, 2011b). Source: OECD (2010b). Score point difference Long-term studies from high income countries show that pre-school contributes to school readiness and later academic achievement 48
16 THE SIX EFA GOALS Goal 1: Early childhood care and education through the development of non-cognitive skills, such as attention, effort, initiative and behaviour, as well as cognitive skills in reading and mathematics (Duncan et al., 2007; Reynolds et al., 2010; Romano et al., 2010). An evaluation of Head Start, the publicly funded national early childhood programme in the United States that focuses on poor children, has shown that it had significant positive long-term effects. For example, those who had participated in the programme were 9% more likely to have graduated from secondary school and 7% less likely not to be in school and to be reporting zero wages in their early twenties (Deming, 2009). There is now a growing body of evaluations from developing countries highlighting the benefits of pre-schooling (Box 1.1). The short- to medium-term effects of pre-school attendance on cognitive and non-cognitive skills and school performance provide the foundation for the basic skills that young people require to do well in schooling. It also leads to higher earnings and better employment outcomes in adulthood. The Early Enrichment Project in Turkey in the 1980s which included a preschooling intervention targeted children of low income families whose mothers had little education. Two decades later, participants were found to have better educational attainment and occupational status than those who had not participated (Kagitcibasi et al., 2009). Higher pre-primary enrolment is expected to increase primary school enrolment in poor countries. A recent simulation of potential Box 1.1: Pre-schooling has striking benefits for school performance Studies in developing countries on the benefits of pre-school vary in scope, but paint a similar picture overall, demonstrating positive effects on subsequent school performance. Participation is found to be particularly beneficial for those from poor and disadvantaged backgrounds. The benefits of pre-school for non-cognitive skills are demonstrated by a study in Argentina. As well as having higher test scores, third graders who had one year of public pre-primary school in an urban area showed improved attention, effort, class participation and discipline. In rural Gansu, Shaanxi and Henan, China, 4- and 5-year-olds who had attended pre-primary education scored 20% higher on a school readiness scale, which included non-cognitive skills such as independence and motor skills, than those who had not. Studies from many countries, including Chile, India and Madagascar, show the contribution of pre-school to cognitive abilities. In Chile, children entering primary school who had enrolled in public pre-schools or child care centres had higher cognitive skill scores. In rural Maharashtra, India, a project that improved the pre-school component of the Integrated Child Development Services had significant positive effects on the developmental and cognitive outcomes of 4- to 6-year-olds. In Madagascar, primary school children who had attended pre-school showed a 2.7 month benefit in terms of cognitive development and a 1.6 month benefit in terms of language. Pre-school attendance can be particularly beneficial in addressing disadvantage. In a study in Argentina, the effect of having attended pre-school on third grade test scores was twice as large for students from poor backgrounds as for students from non-poor backgrounds. A rare evaluation in a low income country found that children who had attended pre-school in rural Mozambique scored, on average, 12.1 percentage points above the other students on a cognitive development test in the first grade of primary school, including classifying objects and counting to twenty. Fourth grade primary school children in Brazil who had attended day care and/or kindergarten scored higher in mathematics. In rural Bangladesh, a project run by local non-governmental organizations (NGOs) set up 1,800 pre-schools and provided them with better materials. Participating children performed better in speaking, reading, writing and mathematics by the second grade of primary school than those who did not attend pre-school. In rural Guizhou, China, first-grade children who had attended kindergarten had literacy and mathematics scores significantly better than other children. Attending pre-school also tends to increase the years of education that children eventually attain. In Uruguay, 15-year-olds who had attended a public or private preschool accumulated 0.8 years more education, were 27% more likely to still be in school and were less likely to repeat a grade than siblings who had not attended. In Mozambique, attending pre-school increased the probability of enrolling in primary school by 24%. Sources: Aboud and Hossain (2011); Ade et al. (2010); Berlinski et al. (2008); Berlinski et al. (2009); Luo et al. (2011); Martinez et al. (2012); Mingat and Seurat (2011); Rao et al. (2012); Rodrigues et al. (2011); Urzúa and Veramandi (2011). 49
17 0 1 2 PART I: MONITORING PROGRESS TOWARDS THE EFA GOALS CHAPTER 1 Education for All Global Monitoring Report 2 long-term economic effects in seventy-three low and middle income countries showed potentially high benefits. For example, it was estimated that raising the pre-primary gross enrolment ratio to 25% in countries such as Ethiopia and Yemen would lead to increased school attendance. Those who increase their school attendance can later be expected to increase their income by an amount around six times as high as the per capita cost of providing access to pre-school (Engle et al., 2011). Participation in pre-primary education is low and inequitable The number of children enrolled in pre-school has increased substantially over the past decade. Despite this increase, participation in pre-school remains extremely low in many countries, with children from poor households least likely to attend. Between 1999 and 2010, the number of children enrolled in pre-school worldwide rose by 46% to a total of 164 million. The pre-primary gross enrolment ratio increased from 32% in 1999 to a still-low 48% in In low income countries, however, the pre-primary gross enrolment ratio increased from 11% in 1999 to only 15% in On average, national education systems allow for 2.9 years of pre-primary education. But in practice, children can expect to attend preschool for less than half that long. 41 The gap between intentions and outcomes is widest in low income countries, particularly in the Arab States, Central Asia and sub-saharan Africa (Figure 1.7). Pre-primary gross enrolment ratios vary widely between and within regions. The lowest levels are in sub-saharan Africa (17%) and the Arab States (22%). The gap between these regions Figure 1.7: Participation in pre-primary education is lower than the system allows Duration of pre-primary education ( official ) and pre-primary school life expectancy ( actual ), number of years, weighted average, Official Actual 3 Number of years World Low income Lower middle income Upper middle income High income Arab States Sub- Saharan Africa Central Asia South/ West Asia East Asia/ Pacific Latin America/ Caribbean North America/ Western Europe Central/ Eastern Europe Source: Annex, Statistical Table 3B (website). 4. Comparisons among countries and over time are hindered by differences in pre-school and primary school start age; differences in the way that pre-school relates to day care and primary school, including whether kindergarten is considered part of primary; and the large numbers of private providers, often under-reported, in many countries. 50
18 THE SIX EFA GOALS Goal 1: Early childhood care and education and the rest of the world widened during the last decade as these two regions also recorded the slowest progress of all regions except North America and Western Europe, where enrolment is already high. Some countries with low enrolment have made very slow progress or even worsened. In the Niger and the Syrian Arab Republic, enrolment has stagnated at a very low level, below the regional average. Of the 150 countries that reported data for both the beginning of the period ( ) and the end ( ), seventeen countries recorded a lower gross enrolment ratio in the more recent year, including Bangladesh, where enrolment was already very low (Figure 1.8). All regions except the Arab States have achieved gender parity in pre-primary enrolment, and even this region has made large improvements since Even so, of the 162 countries with data, 69 had not reached gender parity in In about 60% of these countries, girls were more likely to be enrolled. Patterns of disadvantage vary among countries. A child in Bangladesh has very little chance of attending pre-school: whether urban or rural, rich or poor, male or female, only around one in six attend. By contrast, 61% of 3- to 4-year-olds attend pre-school in Thailand, although there is a distinct wealth bias, with 74% of children from rich households enrolled compared with 54% of poor children. In Nigeria, disparities 17 countries had fewer children enrolling in pre-school in 2011 than a decade ago Figure 1.8: Enrolment in pre-primary education varies widely between and within regions Pre-primary gross enrolment ratio, selected countries, 1999 and 2010 or nearest year Niger Sub-Saharan Africa Ghana Syrian A.R. Arab States Lebanon Kyrgyzstan Central Asia Mongolia Bangladesh South and West Asia India Lao PDR East Asia and the Pacific Malaysia Turkey Central and Eastern Europe Russian Fed. Colombia Latin America and the Caribbean Uruguay United States Pre-primary gross enrolment ratio (%) North America and Western Europe Switzerland Source: Annex, Statistical Table 3B. 51
19 0 1 2 PART I: MONITORING PROGRESS TOWARDS THE EFA GOALS CHAPTER 1 Education for All Global Monitoring Report 2 Where children live, and their family s wealth, affect pre-school attendance are particularly wide. Girls and boys from rich households, whether living in urban or rural areas of Nigeria, have a similar chance of going to school as a child in Thailand. By contrast, girls and boys from poor Nigerian households are on a par with children in Bangladesh. In all three countries, there is very little gender difference amongst those in rich and poor households living in either rural or urban areas (Figure 1.9). Where children live can determine their chances of attending pre-school, as well as the quality of the service. In China, urban children are more likely than rural children to attend two or three years of kindergarten before entering primary school. If rural children have access at all, they are more likely to attend for just one year. Moreover, the pre-school pupil/teacher ratio is 10:1 in cities and 19:1 in towns, but 34:1 in rural areas (World Bank, 2011). Other factors that lead to disadvantage can also make it less likely that a child enters preschool, including belonging to a minority ethnic group, speaking a language other than that used in school and having a less educated mother (Nonoyama-Tarumi and Ota, 2010; Woodhead, 2009). Yet such marginalized children may be the ones who would benefit most from early education opportunities, as they are least likely to receive adequate support at home. One reason children from urban areas and wealthier households are more likely to participate in pre-primary education is that they have greater access to private pre-schools some of which charge fees. In many countries and regions a large proportion of pre-schools are private. Globally, the average share of enrolment in private pre-school is 33% and this may well be an underestimate, as data from private providers are not collected systematically in many countries. In the Arab States it is 76%. A large share of pre-school enrolment in many low and lower middle income countries is in private institutions. For example, in Ethiopia, where the gross enrolment ratio was only 5% in 2010, the share of private provision was 95%. In the Syrian Arab Republic, with a gross Figure 1.9: Participation in pre-primary education varies significantly within countries Pre-school attendance rate of children aged 36 to 59 months, by wealth, location and gender Male Female 100 Bangladesh, 2006 Nigeria, 2007 Thailand, Richest 20% Urban Rural Attendance rate (%) Richest 20% Urban Rural Thailand Poorest 20% Urban Urban Urban Rural Rural Rural Nigeria 20 Bangladesh Richest 20% Poorest 20% Rural Urban Rural Urban Poorest 20% Urban Rural 0 Notes: The official age for pre-primary education is 3 to 5 in the three countries. In Nigeria, the poorest 40% are shown for urban areas. Source: EFA Global Monitoring Report team calculations (2012) based on Multiple Indicators Cluster Survey data. 52
MEASURING GENDER EQUALITY IN EDUCATION: LESSONS FROM 43 COUNTRIES
 GIRL Center Research Brief No. 2 October 2017 MEASURING GENDER EQUALITY IN EDUCATION: LESSONS FROM 43 COUNTRIES STEPHANIE PSAKI, KATHARINE MCCARTHY, AND BARBARA S. MENSCH The Girl Innovation, Research,
16-17 NOVEMBER 2017, MOSCOW, RUSSIAN FEDERATION OVERVIEW PRESENTATION
 16-17 NOVEMBER 2017, MOSCOW, RUSSIAN FEDERATION OVERVIEW PRESENTATION Tuberculosis is the leading infectious killer Current actions and investments are falling far short ENDING TB IN THE SUSTAINABLE DEVELOPMENT
DEVELOPMENT AID AT A GLANCE
 DEVELOPMENT AID AT A GLANCE STATISTICS BY REGION 2. AFRICA 217 edition 2.1. ODA TO AFRICA - SUMMARY 2.1.1. Top 1 ODA receipts by recipient USD million, net disbursements in 21 2.1.3. Trends in ODA 1 Ethiopia
In reviewing progress since 2000, this regional
 United Nations Educational, Scientific and Cultural Organization EFA Global Monitoring Report 2 0 1 5 Regional overview: East Asia and the Pacific United Nations Educational, Scientific and Cultural Organization
Overall student visa trends June 2017
 Overall student visa trends June 2017 Acronyms Acronyms FSV First-time student visas The number of visas issued to students for the first time. Visas for dependants and Section 61 applicants are excluded
Berkeley International Office Survey
 Berkeley International Office Survey 1. What is your gender? Male 64.8% 308 Female 35.2% 167 2. What is your age? 17-20 0.0% 0 21-24 17.9% 85 25-30 56.6% 269 31-35 19.2% 91 36+ 6.3% 30 1 of 40 3. What
GHSA Global Activities Update. Presentation by Indonesia
 GHSA Global Activities Update Presentation by Indonesia as the GHSA chair in 2016 2016 Global Activities JEE Process Action Packages Coordination Jakarta Call for Action A Systemic Network Model : Coordination
JICA s Operation in Education Sector. - Present and Future -
 JICA s Operation in Education Sector - Present and Future - September 2010 Preface Only five more years remain for the world to work towards achieving the Millennium Development Goals (MDGs) by 2015. Developing
RECOGNITION OF THE PREVIOUS UNIVERSITY DEGREE
 RECOGNITION OF THE PREVIOUS UNIVERSITY DEGREE You must request for the recognition of your bachelor diploma at the Czech University which provides similar study modules. If you studied in economic field,
ITEC / SCAAP PROGRAMMES ITEC/SCAAP Programmes Sponsored by : Ministry of External Affairs, Government of India
 ITEC / SCAAP PROGRAMMES 2017-18 ITEC/SCAAP Programmes Sponsored by : Ministry of External Affairs, Government of India ITEC/ SCAAP Programme The Indian Technical and Economic Cooperation (ITEC) is the
Dakar Framework for Action. Education for All: Meeting our Collective Commitments. World Education Forum Dakar, Senegal, April 2000
 Dakar Framework for Action Education for All: Meeting our Collective Commitments Text adopted by the World Education Forum Dakar, Senegal, 26-28 April 2000 Dakar Framework for Action Education for All:
Introduction Research Teaching Cooperation Faculties. University of Oulu
 University of Oulu Founded in 1958 faculties 1 000 students 2900 employees Total funding EUR 22 million Among the largest universities in Finland with an exceptionally wide scientific base Three universities
The Assistant Director-General for External Relations and Public lnfonnation
 JAPAN ca. :~-. United Nations Supported by Educational, Scientific and Japanese Funds-in-Trust Cultural Organization to UNESCO The Assistant Director-General for External Relations and Public lnfonnation
The Rise of Populism. December 8-10, 2017
 The Rise of Populism December 8-10, 2017 The Rise of Populism LIST OF PARTICIPATING SCHOOL Byron College B Arsakeio Tositseio Lykeio Ekalis A Tositseio Arsakeio Lykeio Ekalis QSI Tbilisi Ionios School
Setting the Scene and Getting Inspired
 Setting the Scene and Getting Inspired Inclusive Education and Schools Sheldon Shaeffer Save the Children Learning Event Inclusive Education: From Theoretical Concept to Effective Practice Bangkok, Thailand
Kenya: Age distribution and school attendance of girls aged 9-13 years. UNESCO Institute for Statistics. 20 December 2012
 1. Introduction Kenya: Age distribution and school attendance of girls aged 9-13 years UNESCO Institute for Statistics 2 December 212 This document provides an overview of the pattern of school attendance
Annex 1: Millennium Development Goals Indicators
 Annex 1: Millennium Development Goals Indicators Millennium Development Goals (MDGs) Goals and Targets(Millennium Declaration) Indicators for monitoring progress GOAL 1: ERADICATE EXTREME POVERTY AND HUNGER
Twenty years of TIMSS in England. NFER Education Briefings. What is TIMSS?
 NFER Education Briefings Twenty years of TIMSS in England What is TIMSS? The Trends in International Mathematics and Science Study (TIMSS) is a worldwide research project run by the IEA 1. It takes place
11. Education: Gender Disparities [205]
![11. Education: Gender Disparities [205]](/thumbs/71/66189941.jpg "11. Education: Gender Disparities [205]") 11. Education: Gender Disparities [205] Commitment We regret that interim targets related to eliminating gender disparities in primary and secondary education have not been achieved. Greater concerted
11. Education: Gender Disparities [205] Commitment We regret that interim targets related to eliminating gender disparities in primary and secondary education have not been achieved. Greater concerted
Rwanda. Out of School Children of the Population Ages Percent Out of School 10% Number Out of School 217,000
 Rwanda Out of School Children of the Population Ages 7-14 Number Out of School 217, Percent Out of School % Source: Demographic and Health Survey (DHS) 2 Comparison of Rates of Out of School Children Ages
The Rise of Results-Based Financing in Education 2015
 World Bank Group Education Global Practice Smarter Education Systems for Brighter Futures SNAPSHOT The Rise of Results-Based Financing in Education 2015 Education is one of the surest means we have to
Department of Education and Skills. Memorandum
 Department of Education and Skills Memorandum Irish Students Performance in PISA 2012 1. Background 1.1. What is PISA? The Programme for International Student Assessment (PISA) is a project of the Organisation
Regional Capacity-Building on ICT for Development Item 7 Third Session of Committee on ICT 21 November, 2012 Bangkok
 Regional Capacity-Building on ICT for Development Item 7 Third Session of Committee on ICT 21 November, 2012 Bangkok Hyeun-Suk Rhee, Ph.D. Director United Nations APCICT-ESCAP Brief on APCICT APCICT :
Bosnia and Herzegovina
 Country Profile Education in Bosnia and Herzegovina Context Impact of the economic crisis Despite several years of economic growth and stability, the economy in Bosnia and Herzegovina (BiH) slowed considerably
National Academies STEM Workforce Summit
 National Academies STEM Workforce Summit September 21-22, 2015 Irwin Kirsch Director, Center for Global Assessment PIAAC and Policy Research ETS Policy Research using PIAAC data America s Skills Challenge:
Accessing Higher Education in Developing Countries: panel data analysis from India, Peru and Vietnam
 Accessing Higher Education in Developing Countries: panel data analysis from India, Peru and Vietnam Alan Sanchez (GRADE) y Abhijeet Singh (UCL) 12 de Agosto, 2017 Introduction Higher education in developing
BASIC EDUCATION IN GHANA IN THE POST-REFORM PERIOD
 BASIC EDUCATION IN GHANA IN THE POST-REFORM PERIOD By Abena D. Oduro Centre for Policy Analysis Accra November, 2000 Please do not Quote, Comments Welcome. ABSTRACT This paper reviews the first stage of
REPORT ON THE ACTIVITIES OF THE INSTITUTE IN 2011
 UIS/GB/XIII/3REV. Montreal, November 2011 Issued in English only UNESCO INSTITUTE FOR STATISTICS (UIS) GOVERNING BOARD Thirteenth Ordinary Session (Montreal, 17-18 November 2011) Item 7 of the provisional
Michuki Mwangi Regional Development Manager - Africa ISOC. AFTLD AGM 7 th March 2010 Nairobi, Kenya
 ISOC Update: - 2010 Programs and Activities Michuki Mwangi Regional Development Manager - Africa ISOC AFTLD AGM 7 th March 2010 Nairobi, Kenya About ISOC Founded in 1992 by Internet Pioneers Dedication
Department: Basic Education REPUBLIC OF SOUTH AFRICA MACRO INDICATOR TRENDS IN SCHOOLING: SUMMARY REPORT 2011
 Department: Basic Education REPUBLIC OF SOUTH AFRICA MACRO INDICATOR TRENDS IN SCHOOLING: SUMMARY REPORT 2011 Published by the Department of Basic Education Sol Plaatje House 222 Struben Street Pretoria
REGIONAL CAPACITY BUILDING ON ICT FOR DEVELOPMENT
 REGIONAL CAPACITY BUILDING ON ICT FOR DEVELOPMENT Item 5 Fourth Session of the Committee on ICT 15 October 2014 Bangkok, Thailand Hyeun-Suk Rhee, Ph.D. Director United Nations APCICT-ESCAP REGIONAL CAPACITY
James H. Williams, Ed.D. CICE, Hiroshima University George Washington University August 2, 2012
 James H. Williams, Ed.D. jhw@gwu.edu CICE, Hiroshima University George Washington University August 2, 2012 Very poor country, but rapidly growing economy Access has improved, especially at primary Lower
OHRA Annual Report FY16
 Contents Director s Statement... 3 Our Organization... 4 Institutional Review Board Operations... 5 Quality Improvement Program... 6 Program Metrics... 7 Highlights... 133 What's Ahead......16 2 P a g
A Global Imperative for 2015: Secondary Education. Ana Florez CIES, New Orleans March 11th, 2013
 A Global Imperative for 2015: Secondary Education Ana Florez CIES, New Orleans March 11th, 2013 Panel Presentation Map 1. Why secondary education? 2. Definitions and Approaches 3. Early Marriage and Parenthood
Asia-Pacific Regional Education for All Report. A Synthesis of the National EFA Reports
 Asia-Pacific Regional Education for All Report A Synthesis of the National EA Reports 2015 Asia-Pacific Regional Education for All Report A Synthesis of the National EA Reports 2015 Published in 2015 by
In September 2000, heads of all 191 member states of the United Nations committed
 vaishnav_birdsall.qxp 3/28/2005 9:04 PM Page 257 EDUCATION AND THE MDGS: REALIZING THE MILLENNIUM COMPACT Nancy Birdsall and Milan Vaishnav In September 2000, heads of all 191 member states of the United
Management and monitoring of SSHE in Tamil Nadu, India P. Amudha, UNICEF-India
 Management and monitoring of SSHE in Tamil Nadu, India P. Amudha, UNICEF-India Photo: UNICEF India UNICEF and the Government of Tamil Nadu collaborated on scaling up the SSHE program in Tamil Nadu, a state
IS THE WORLD ON TRACK?
 Monitoring Report 2 0 0 2 Education for All Education for All IS THE WORLD ON TRACK? 1 1 Education for All: Is the world on track? Education for All IS THE WORLD ON TRACK? UNESCO Publishing The designations
Santa Barbara Peace Corps Association Members ALPHABETICAL ORDER by last name (as of 4/8/13)
") First Name Last Name E-mail Country of Years of County of Years of Project Assignment 1 2 Miguel Barrera Zimbabue 2012 Haiti 2012 Youth Linda Beers linbeers@gmail.com Honduras 2009-10 /Teacher Training
First Name Last Name E-mail Country of Years of County of Years of Project Assignment 1 2 Miguel Barrera Zimbabue 2012 Haiti 2012 Youth Linda Beers linbeers@gmail.com Honduras 2009-10 /Teacher Training
PROJECT INFORMATION DOCUMENT (PID) APPRAISAL STAGE
 APPRAISAL STAGE") PROJECT INFORMATION DOCUMENT (PID) APPRAISAL STAGE Report No.: PIDA59105 Project Name Providing an Education of Quality in Haiti (PEQH) (P155191) Region LATIN AMERICA AND CARIBBEAN Country Haiti Sector(s)
PROJECT INFORMATION DOCUMENT (PID) APPRAISAL STAGE Report No.: PIDA59105 Project Name Providing an Education of Quality in Haiti (PEQH) (P155191) Region LATIN AMERICA AND CARIBBEAN Country Haiti Sector(s)
Guinea. Out of School Children of the Population Ages Percent Out of School 46% Number Out of School 842,000
 Guinea Out of School Children of the Population Ages 7-14 Number Out of School 842, Percent Out of School 46% Source: Demographic and Health Survey (DHS) 25 Comparison of Rates of Out of School Children
OHRA Annual Report FY15
 Contents Director s Statement... 3 Our Organization... 4 Institutional Review Board Operations... 5 Quality Improvement Program... 6 Program Metrics... 7 Highlights... 14 2 P a g e Director s Statement
Educational system gaps in Romania. Roberta Mihaela Stanef *, Alina Magdalena Manole
 Available online at www.sciencedirect.com ScienceDirect Procedia - Social and Behavioral Scien ce s 93 ( 2013 ) 794 798 3rd World Conference on Learning, Teaching and Educational Leadership (WCLTA-2012)
Regional Bureau for Education in Africa (BREDA)
") United Nations Education, Scientific and Cultural Organization Regional Bureau for Education in Africa (BREDA) Regional Conference on Higher Education in Africa (CRESA) 10-13 November 2008 Preparatory
United Nations Education, Scientific and Cultural Organization Regional Bureau for Education in Africa (BREDA) Regional Conference on Higher Education in Africa (CRESA) 10-13 November 2008 Preparatory
Education in Armenia. Mher Melik-Baxshian I. INTRODUCTION
 Education in Armenia Mher Melik-Baxshian I. INTRODUCTION Education has always received priority in Armenia a country that has a history of literacy going back 1,600 years. From the very beginning the school
Master of Statistics - Master Thesis
 PRACTICAL GUIDELINES This document outlines the rules and procedures with respect to the master thesis project within the Master of Statistics program. The document covers the following aspects: Who can
Over-Age, Under-Age, and On-Time Students in Primary School, Congo, Dem. Rep.
 Primary School Net and Gross Attendance Rates, Congo, Dem. Rep. Less than two thirds of school age children in the Democratic Republic of the Congo attend primary school. Boys are not much more likely
New Education Division Documents No. 13. Post-basic Education in Partner Countries
 M AY 2 0 0 3 D E S O E D U C AT I O N D I V I S I O N New Education Division Documents No. 13 Post-basic Education in Partner Countries NEW EDUCATION DIVISION DOCUMENTS NO. 13 Christine McNab Post-basic
FACTORS AFFECTING TRANSITION RATES FROM PRIMARY TO SECONDARY SCHOOLS: THE CASE OF KENYA
 FACTORS AFFECTING TRANSITION RATES FROM PRIMARY TO SECONDARY SCHOOLS: THE CASE OF KENYA 129 Kikechi R. Werunga, Geoffrey Musera Masinde Muliro University of Science and Technology (MMUST), Kenya E-mail:
RECOMMENDED CITATION: Pew Research Center, October, 2014, People in Emerging Markets Catch Up to Advanced Economies in Life Satisfaction
 NUMBERS, FACTS AND TRENDS SHAPING THE WORLD FOR RELEASE OCTOBER 30, 2014 FOR FURTHER INFORMATION ON THIS REPORT: Katie Simmons, Senior Researcher Richard Wike, Director, Global Attitudes Research Russ
The Conference Center. of the Americas. at the Biltmore Hotel. Miami, Florida
 The Conference Center of the Americas at the Biltmore Hotel Miami, Florida March 7-8, 2001 B R I E F I N G B O O K Acknowledgments This Briefing Book was prepared by the Partnership for Educational Revitalization
Alternative education: Filling the gap in emergency and post-conflict situations
 2009 Alternative education: Filling the gap in emergency and post-conflict situations Overview Children and youth have a wide range of educational needs in emergency situations, especially when affected
REFLECTIONS ON THE PERFORMANCE OF THE MEXICAN EDUCATION SYSTEM
 DIRECTORATE FOR EDUCATION REFLECTIONS ON THE PERFORMANCE OF THE MEXICAN EDUCATION SYSTEM DAVID HOPKINS 1, ELPIDA AHTARIDOU, PETER MATTHEWS, CHARLES POSNER AND DIANA TOLEDO FIGUEROA 2 LONDON CENTRE FOR
Annual Report
 Annual Report 2015-2016 La Salle International Foundation, Inc. La Salle International Foundation is working collaboratively with PROYDE, a Spanish Lasallian nonprofit, towards the establishment of a new
The number of involuntary part-time workers,
 University of New Hampshire Carsey School of Public Policy CARSEY RESEARCH National Issue Brief #116 Spring 2017 Involuntary Part-Time Employment A Slow and Uneven Economic Recovery Rebecca Glauber The
RELATIONS. I. Facts and Trends INTERNATIONAL. II. Profile of Graduates. Placement Report. IV. Recruiting Companies
 I. Facts and Trends II. Profile of Graduates III. International Placement Statistics IV. Recruiting Companies mir.ie.edu After the graduation of our 4th intake of the Master in International Relations
Target 2: Connect universities, colleges, secondary schools and primary schools
 Target 2: Connect universities, colleges, secondary schools and primary schools with ICTs Target 2: Connect universities, colleges, secondary schools and primary schools with ICTs 1 Introduction Governments
CONSULTATION ON THE ENGLISH LANGUAGE COMPETENCY STANDARD FOR LICENSED IMMIGRATION ADVISERS
 CONSULTATION ON THE ENGLISH LANGUAGE COMPETENCY STANDARD FOR LICENSED IMMIGRATION ADVISERS Introduction Background 1. The Immigration Advisers Licensing Act 2007 (the Act) requires anyone giving advice
A 90 Year Quest for Excellence in Education!
 UNESCO/BIE/C.65/Proceedings and Decisions. Geneva, 9 February 2016 Original: English A 90 Year Quest for Excellence in Education! SIXTY-FIFTH SESSION OF THE COUNCIL OF THE INTERNATIONAL BUREAU OF EDUCATION
Trends in Tuition at Idaho s Public Colleges and Universities: Critical Context for the State s Education Goals
 1 Trends in Tuition at Idaho s Public Colleges and Universities: Critical Context for the State s Education Goals June 2017 Idahoans have long valued public higher education, recognizing its importance
UNESCO Bangkok Asia-Pacific Programme of Education for All. Embracing Diversity: Toolkit for Creating Inclusive Learning-Friendly Environments
 UNESCO Bangkok Asia-Pacific Programme of Education for All Embracing Diversity: Toolkit for Creating Inclusive Learning-Friendly Environments UNESCO / O. Saltbones Introduction... Education systems must
EXECUTIVE SUMMARY. TIMSS 1999 International Mathematics Report
 EXECUTIVE SUMMARY TIMSS 1999 International Mathematics Report S S Executive Summary In 1999, the Third International Mathematics and Science Study (timss) was replicated at the eighth grade. Involving
Educational Attainment
 A Demographic and Socio-Economic Profile of Allen County, Indiana based on the 2010 Census and the American Community Survey Educational Attainment A Review of Census Data Related to the Educational Attainment
Improving education in the Gulf
 Improving education in the Gulf 39 Improving education in the Gulf Educational reform should focus on outcomes, not inputs. Michael Barber, Mona Mourshed, and Fenton Whelan Having largely achieved the
Asian Development Bank - International Initiative for Impact Evaluation. Video Lecture Series
 Asian Development Bank - International Initiative for Impact Evaluation Video Lecture Series Impact evaluations of social protection- Project and Programmes: considering cash transfers and educational
U VA THE CHANGING FACE OF UVA STUDENTS: SSESSMENT. About The Study
 About The Study U VA SSESSMENT In 6, the University of Virginia Office of Institutional Assessment and Studies undertook a study to describe how first-year students have changed over the past four decades.
LANGUAGE DIVERSITY AND ECONOMIC DEVELOPMENT. Paul De Grauwe. University of Leuven
 Preliminary draft LANGUAGE DIVERSITY AND ECONOMIC DEVELOPMENT Paul De Grauwe University of Leuven January 2006 I am grateful to Michel Beine, Hans Dewachter, Geert Dhaene, Marco Lyrio, Pablo Rovira Kaltwasser,
EUROPEAN UNIVERSITIES LOOKING FORWARD WITH CONFIDENCE PRAGUE DECLARATION 2009
 EUROPEAN UNIVERSITIES LOOKING FORWARD WITH CONFIDENCE PRAGUE DECLARATION 2009 Copyright 2009 by the European University Association All rights reserved. This information may be freely used and copied for
DEVELOPMENT PROJECT - LESOTHO
 DEVELOPMENT PROJECT - LESOTHO 10582.0 Strategic focus of the WFP Development Project: Support Access to Primary Education Number of beneficiaries: 80,000 (51 percent girls) Duration: 36 months (1 January
Invest in CUNY Community Colleges
 Invest in Opportunity Invest in CUNY Community Colleges Pat Arnow Professional Staff Congress Invest in Opportunity Household Income of CUNY Community College Students
International activities of the American Society for Microbiology (ASM)
") Int Microbiol (2002) 5: 231 236 DOI 10.1007/s10123-002-0090-z PERSPECTIVES Daniel O. Sordelli Æ Lily Schuermann International activities of the American Society for Microbiology (ASM) Published online:
Int Microbiol (2002) 5: 231 236 DOI 10.1007/s10123-002-0090-z PERSPECTIVES Daniel O. Sordelli Æ Lily Schuermann International activities of the American Society for Microbiology (ASM) Published online:
ESTABLISHING NEW ASSESSMENT STANDARDS IN THE CONTEXT OF CURRICULUM CHANGE
 ESTABLISHING NEW ASSESSMENT STANDARDS IN THE CONTEXT OF CURRICULUM CHANGE Paper Presented at the 32 nd Annual Conference of the International Association for Educational Assessment (IAEA) held at the Grand
EXECUTIVE SUMMARY. TIMSS 1999 International Science Report
 EXECUTIVE SUMMARY TIMSS 1999 International Science Report S S Executive Summary In 1999, the Third International Mathematics and Science Study (timss) was replicated at the eighth grade. Involving 41 countries
Trends & Issues Report
 Trends & Issues Report prepared by David Piercy & Marilyn Clotz Key Enrollment & Demographic Trends Options Identified by the Eight Focus Groups General Themes 4J Eugene School District 4J Eugene, Oregon
Organised by
 www.africanbrains.net/edusa Organised by A rare opportunity to engage with ministers and senior officials for education and higher education from the 15 member countries of the Southern African Development
Effective Pre-school and Primary Education 3-11 Project (EPPE 3-11)
") Effective Pre-school and Primary Education 3-11 Project (EPPE 3-11) A longitudinal study funded by the DfES (2003 2008) Exploring pupils views of primary school in Year 5 Address for correspondence: EPPSE
Effective Pre-school and Primary Education 3-11 Project (EPPE 3-11) A longitudinal study funded by the DfES (2003 2008) Exploring pupils views of primary school in Year 5 Address for correspondence: EPPSE
EFA and the Institute of Education, University of London : implicit and explicit engagements
 EFA and the Institute of Education, University of London : implicit and explicit engagements By Angela W. Little Profesor of education (with reference to developing Countries) Institute of Education, University
Testimony to the U.S. Senate Committee on Health, Education, Labor and Pensions. John White, Louisiana State Superintendent of Education
 Testimony to the U.S. Senate Committee on Health, Education, Labor and Pensions John White, Louisiana State Superintendent of Education October 3, 2017 Chairman Alexander, Senator Murray, members of the
The European Higher Education Area in 2012:
 PRESS BRIEFING The European Higher Education Area in 2012: Bologna Process Implementation Report EURYDI CE CONTEXT The Bologna Process Implementation Report is the result of a joint effort by Eurostat,
No. 11. Table of Contents
 No. 11 Educational Assessments in Latin America: Current Progress and Future Challenges by Laurence Wolff* June 1998 Laurence Wolff is an education consultant at the Inter- American Development Bank in
Financing Education In Minnesota
 Financing Education In Minnesota 2016-2017 Created with Tagul.com A Publication of the Minnesota House of Representatives Fiscal Analysis Department August 2016 Financing Education in Minnesota 2016-17
The Survey of Adult Skills (PIAAC) provides a picture of adults proficiency in three key information-processing skills:
 provides a picture of adults proficiency in three key information-processing skills:") SPAIN Key issues The gap between the skills proficiency of the youngest and oldest adults in Spain is the second largest in the survey. About one in four adults in Spain scores at the lowest levels in
SPAIN Key issues The gap between the skills proficiency of the youngest and oldest adults in Spain is the second largest in the survey. About one in four adults in Spain scores at the lowest levels in
INSTRUCTION MANUAL. Survey of Formal Education
 INSTRUCTION MANUAL Survey of Formal Education Montreal, January 2016 1 CONTENT Page Introduction... 4 Section 1. Coverage of the survey... 5 A. Formal initial education... 6 B. Formal adult education...
Trends in College Pricing
 Trends in College Pricing 2009 T R E N D S I N H I G H E R E D U C A T I O N S E R I E S T R E N D S I N H I G H E R E D U C A T I O N S E R I E S Highlights Published Tuition and Fee and Room and Board
PIRLS. International Achievement in the Processes of Reading Comprehension Results from PIRLS 2001 in 35 Countries
 Ina V.S. Mullis Michael O. Martin Eugenio J. Gonzalez PIRLS International Achievement in the Processes of Reading Comprehension Results from PIRLS 2001 in 35 Countries International Study Center International
The Talent Development High School Model Context, Components, and Initial Impacts on Ninth-Grade Students Engagement and Performance
 The Talent Development High School Model Context, Components, and Initial Impacts on Ninth-Grade Students Engagement and Performance James J. Kemple, Corinne M. Herlihy Executive Summary June 2004 In many
EDUCATIONAL ATTAINMENT
 EDUCATIONAL ATTAINMENT By 2030, at least 60 percent of Texans ages 25 to 34 will have a postsecondary credential or degree. Target: Increase the percent of Texans ages 25 to 34 with a postsecondary credential.
Department of Geography Geography 403: The Geography of Sub-Sahara Africa
 Department of Geography Geography 403: The Geography of Sub-Sahara Africa Instructor: Dr. James C. Saku Office Phone: 301-687-4724, Administrative Assistant: 301-687-4369 Office Location: GU 229 Office
Harnessing the power and potential of adult learning and education for a viable future
 CONFINTEA VI Belém, 4 December 2009 Original: English Harnessing the power and potential of adult learning and education for a viable future Belém Framework for Action - 1 - Preamble 1. We, the 156 Member
TRENDS IN. College Pricing
 2008 TRENDS IN College Pricing T R E N D S I N H I G H E R E D U C A T I O N S E R I E S T R E N D S I N H I G H E R E D U C A T I O N S E R I E S Highlights 2 Published Tuition and Fee and Room and Board
A Decade of Higher Education in the Arab States: Achievements & Challenges
 UNESCO Regional Bureau for Education in the Arab States - Beirut A Decade of Higher Education in the Arab States: Achievements & Challenges Regional Report July, 2009 1 Contributors to this report: Adnan
Addressing TB in the Mines: A Multi- Sector Approach in Practice
 Addressing TB in the Mines: A Multi- Sector Approach in Practice Regional Dialogue: Portability of Social Benefits for Mineworkers in Southern Africa Tom Mogeni, World Bank, 27 March 2015 What do we know
TESL/TESOL Certification
 TESL/TESOL Certification Teaching English as a Second Language Certificate inlingua Victoria TESL/TESOL Courses are recognized by TESL Canada inlingua Victoria College of Languages 101-910 Government Street
Improving the impact of development projects in Sub-Saharan Africa through increased UK/Brazil cooperation and partnerships Held in Brasilia
 Image: Brett Jordan Report Improving the impact of development projects in Sub-Saharan Africa through increased UK/Brazil cooperation and partnerships Thursday 17 Friday 18 November 2016 WP1492 Held in
APPLICATION GUIDE EURECOM IMT MASTER s DEGREES
 APPLICATION GUIDE EURECOM IMT MASTER s DEGREES 2018-2019 OUTLINE DURATION... 3 APPLICATION DEADLINES... 5 APPLICATION PROCESS... 6 DETAILED APPLICATION PROCESS... 7 REQUIRED DOCUMENTS... 9 FINANCIAL MATTERS...
Brazil. understanding individual rights and responsibilities, as well as those of citizens, the State and other community groups;
 Brazil Updated version, August 2006. Principles and general objectives of education The Constitution enacted in October 1988 is based on the principles of civil rights and dignity of the individual. Article
EXECUTIVE SUMMARY. Online courses for credit recovery in high schools: Effectiveness and promising practices. April 2017
 EXECUTIVE SUMMARY Online courses for credit recovery in high schools: Effectiveness and promising practices April 2017 Prepared for the Nellie Mae Education Foundation by the UMass Donahue Institute 1
Shelters Elementary School
 Shelters Elementary School August 2, 24 Dear Parents and Community Members: We are pleased to present you with the (AER) which provides key information on the 23-24 educational progress for the Shelters
Ex-Post Evaluation of Japanese Technical Cooperation Project
 Bangladesh Ex-Post Evaluation of Japanese Technical Cooperation Project Project for Strengthening Primary Teacher Training on Science and Mathematics External Evaluator: Yuko Aoki, Kokusai Kogyo 0. Summary
Greek Teachers Attitudes toward the Inclusion of Students with Special Educational Needs
 American Journal of Educational Research, 2014, Vol. 2, No. 4, 208-218 Available online at http://pubs.sciepub.com/education/2/4/6 Science and Education Publishing DOI:10.12691/education-2-4-6 Greek Teachers