Tulsa Health Department It s All About Kids Program
|
|
|
- Emerald Holland
- 5 years ago
- Views:
Transcription
1 Tulsa Health Department It s All About Kids Program Preliminary Report Prepared by: Evie M. Muilenburg-Trevino, PhD, and Jeanne Gillert, MHR June 2013 Technical Report No.: ARC
2 Table of Contents Executive Summary... 6 Program Overview... 6 CATCH Nutrition Program... 6 BMI and BP Study... 6 Oral Health Program... 7 Nutrition Detectives... 7 Study Overview... 9 Purpose of Study... 9 Methodology... 9 CATCH Nutrition Program Purpose of Study Methodology Results Graph 1: CATCH Participants by School Graph 2: CATCH Pre- and Post-Test Results Discussion Body Mass Index and Blood Pressure Study Purpose of Study Methodology Table 1: BMI Category and Percentile Ranking Table 2: Systolic and Diastolic BP Category and Percentile Ranking Results BMI Results Graph 3: BMI Participants by School for Spring Graph 4: BMI Participants by Grade for Spring Graph 5: BMI Participants by Gender for Spring Graph 6: BMI Changes Overall Spring Table 3: BMI Rates of Change Overall
3 Graph 7: BMI Changes Clinton Spring Table 4: BMI Rates of Change at Clinton Elementary Graph 8: BMI Changes Hawthorne Spring Table 5: BMI Rates of Change at Hawthorne Elementary Graph 9: BMI Changes Penn Spring Table 6: BMI Rates of Change at Penn Elementary Graph 10: BMI Changes for First Graders Spring Table 7: BMI Rates of Change for First Graders Graph 11: BMI Changes for Second Graders Spring Table 8: BMI Rates of Change for Second Graders Graph 12: BMI Changes for Third Graders Spring Table 9: BMI Rates of Change for Third Graders Graph 13: BMI Changes for Fourth Graders Spring Table 10: BMI Rates of Change for Fourth Graders Graph 14: BMI Changes for Fifth Graders Table 11: BMI Rates of Change for Spring Blood Pressure Results Graph 15: Overall Systolic Changes for Spring Table 12: Systolic Percentages Overall Graph 16: Overall Diastolic Changes for Spring Table 13: Diastolic Percentages Overall Graph 17: Clinton Systolic Changes for Spring Table 14: Systolic Percentages for Clinton Elementary Graph 18: Clinton Diastolic Changes for Spring Table 15: Diastolic Percentages for Clinton Elementary Graph 19: Hawthorne Systolic Changes for Spring Table 16: Systolic Percentages for Hawthorne Elementary Graph 20: Hawthorne Diastolic Changes for Spring Table 17: Diastolic Percentages for Hawthorne Elementary Graph 21: Penn Systolic Changes for Spring
4 Table 18: Systolic Percentages for Penn Elementary Graph 22: Penn Diastolic Changes for Spring Table 19: Diastolic Percentages for Penn Elementary Graph 23: Systolic Changes for First Graders Spring Table 20: Systolic Percentages for First Graders Graph 24: Diastolic Changes for First Graders Spring Table 21: Diastolic Percentages for First Graders Graph 25: Systolic Changes for Second Graders Spring Table 22: Systolic Percentages for Second Graders Graph 26: Diastolic Changes for Second Graders Spring Table 23: Diastolic Percentages for Second Graders Graph 27: Systolic Changes for Third Graders Spring Table 24: Systolic Percentages for Third Graders Graph 28: Diastolic Changes for Third Graders Spring Table 25: Diastolic Percentages for Third Graders Graph 29: Systolic Changes for Fourth Graders Spring Table 26: Systolic Percentages for Fourth Graders Graph 30: Diastolic Changes for Fourth Graders Spring Table 27: Diastolic Percentages for Fourth Graders Graph 31: Systolic Changes for Fifth Graders Spring Table 28: Systolic Percentages for Fifth Graders Graph 32: Diastolic Changes for Fifth Graders Spring Table 29: Diastolic Percentages for Fifth Graders BMI and BP Comparisons Graph 33: Overall Spring 2012 BMI and Systolic Blood Pressure Data Graph 34: Overall Spring 2012 BMI and Diastolic Blood Pressure Data Graph 35: Overall Spring 2013 BMI and Systolic Blood Pressure Data Graph 36: Overall 2013 BMI and Diastolic Blood Pressure Data References Oral Health Program
5 Purpose of Study Methodology Results Graph 37: Oral Health Program Participants by School Graph 38: Oral Health Program Pre- and Post-Test Results Discussion Nutrition Detectives Purpose of Study Methodology Results Graph 39: Nutrition Detective Program Participants by Grade Graph 40: Nutrition Detective Program Pre- and Post-Test Results Graph 41: Nutrition Detective Program Pre- and Post-Test Results by School Graph 42: Nutrition Detective Program Pre- and Post-Test Results by Grade Discussion Appendix A List of Schools Appendix B Center for Disease Control BMI Charts Appendix C Blood Pressure Levels by Age and Height Percentile Appendix D Guide to Blood Pressure Measurement in Children Appendix E CATCH Nutrition Test Appendix F Oral Health Program Test Appendix G Nutrition Detectives Test
6 Program Overview It s All About Kids Executive Summary Tulsa City-County Health Department (TCCHD) implemented the It s All About Kids program in order to improve health outcomes for first through fifth grade students. It s All About Kids is a prevention program that encourages kids to make healthy choices and habits for a brighter future. The program has four goals: 1) improve healthy lifestyles, 2) reduce obesity, 3) improve school performance, and 4) build decision making. TCCHD implemented a health and nutrition program including the CATCH nutrition program including pre- and post-test analysis, body mass index (BMI) measurements, and blood pressure (BP) measurement. Data was collected in the spring and fall of 2012 and the spring of 2013, and then analyzed to determine the effects of the programs on student knowledge retention of the nutrition program, BMI score changes, BP scores changes, fitness measurements, and a summary of community events and presentations. The purpose of this report is to provide the results for the It s All About Kids program for school year. CATCH Nutrition Program The CATCH Nutrition program is a coordinated school health program that unites parents, teachers, children, and community partners in teaching children and their families about healthy practices. As a classroom health program, it teaches children healthy eating and physical activity habits. The CATCH Nutrition program was pre and post-tested in 7 schools with 146 participants. Results indicate significant differences between Section A, C and I scores examined. These findings suggest improvement in regards to student choices and perceptions. There were no statistically significant findings for Checklist scores. BMI and BP Study Body mass index (BMI) scores were collected in spring 2012 (451) and spring 2013 (198) from three schools. Scores were then characterized as underweight, normal, overweight, or obese based on percentiles defined by the Center for Disease Control (Center for Disease Control and Prevention, 2007 b). Matched BMI data were collected in the spring from 72 students attending three elementary schools. Blood pressure (BP) scores were collected in spring 2012 (451) and spring 2013 (198) semesters. Scores were then characterized as normal, prehypertension ( Pre-HTN ), Stage 1: hypertension ( Stage 1: HTN ), or Stage 2: hypertension ( Stage 2: HTN ) based on percentiles defined by the US Department of Health and Human Services (US Department of Health and Human Services, 2007). 6
7 Anonymous student identifiers, which are used to protect the privacy of students, were used to track individual changes over time. Thus, comparisons can be made from spring 2013 to spring 2013 on an individual level basis with regards to BMI and BP scores. Because of the small sample size in the spring, mean scores were reported by grade and overall school results presented in graphs for the spring data. Chi-square analyses were computed to examine BMI rates of change by grade; these analyses are presented in table format. On the whole, findings are mixed with some improvements observed and some negative changes observed. Overall, there was statistically significant change for BMI scores with both positive change and negative change (see Graph 6). Overall, there was statistically significant change for systolic or diastolic blood pressure (see Graphs 15-16). Oral Health Program According to TCCHD, the Oral Health program provides instruction about caring for teeth to fourth grade students. The goals are to provide an understanding of the causes and prevention of tooth decay and gum disease, and instruct on proper tooth brushing and dental flossing. The two-session course was implemented in 11 schools. The Oral Health program was designed to track differences in pre- and post-test scores. T-test results indicate a significant difference between the pre- and post-test. These findings suggest an increase in students knowledge of oral health. Nutrition Detectives According to TCCHD, Nutrition Detectives was developed by David Katz, MD, MPH, FACPM, FACP, Director of the Yale Prevention Research Center and Catherine Katz, PhD. The program teaches students 5 clues to healthy eating and making healthy choices. Students learn how to read food labels and how to choose foods that are more nutritious. By the end of the program students have become Nutrition Detectives and earn their badge. The objectives of the program are to: 1) teach students to make healthful choices and detect marketing deceptions 2) give students the opportunity to practice what they have learned 3) empower students to share their detective skills with other family members. The two-session course was implemented in 4 schools with 307 students. A t-test analysis was used to examine differences in pre- and post-tests. The findings suggest that students knowledge of nutrition increased from the pre- to the post-test. 7

8 It s All About Kids Study Overview 8
9 It s All About Kids Study Overview Purpose of Study The It s All About Kids (IAK) program is a school health program provided by Tulsa City County Health Department (TCCHD). Based upon the Center for Disease Control s Coordinated School Health Program model, the program is comprised of eight areas of focus including physical education, nutrition and healthy eating, community health services, social services, health education, parent/community involvement, health promotion for school personnel, and ancillary services such as dental education and outreach. The goal of the program is to provide a prevention model for elementary school-aged youth to improve healthy lifestyles, reduce obesity, improve school performance and enhance decision making and negotiation skills. The program is offered to low-performing schools in Northeast Oklahoma, including schools with poor attendance rates, schools lacking a physical education instructor, schools with poor parental involvement, and schools with limited access to healthcare services. A list of participating schools is available in Appendix A. The purpose of the current report is to provide TCCHD with the fall 2012, spring 2012 and spring 2013 final results of the program evaluation for the It s All About Kids program. Methodology The purpose of this study was to analyze data collected from TCCHD to determine the effectiveness of the It s All About Kids program. The University of Oklahoma, Center of Applied Research for Nonprofit Organizations, analyzed data collected by TCCHD. Data includes nutrition scores from the CATCH nutrition test, BMI and BP data, Oral Health, and Nutrition Detectives. Because the study involves analysis of multiple program components, methodology, results and discussion sections are presented under individual headings. 9

10 It s All About Kids CATCH Nutrition Program 10
11 It s All About Kids CATCH Nutrition Program Purpose of Study The CATCH Nutrition program is a coordinated school health program that unites parents, teachers, children and community partners in teaching children and their families about healthy lifestyle practices. As a classroom health program, children learn healthy eating and physical activity habits. Methodology The CATCH Nutrition program pre- and post-test was administered to 146 fourth grade students in 7 schools. TCCHD used a pre- and post-test model to measure knowledge retention. The test consisted of four sections: Pre and Post Section A, Pre and Post Section C, Pre and Post Section I, and Pre and Post Checklist. In the Section A portion, students are asked 13 questions in regard to food choices; for each item, two food choices are provided. Higher scores indicate healthier food choices. The Section C is comprised of 14 items and questions students knowledge of healthy food in a 2-point multiple choice format (example: Which of these foods is better for your health? ). Higher scores indicate more knowledge of healthy foods. The Section I is comprised of 15 items which deal with students belief in their ability to make healthy choices (examples: I can eat fruit every day. I can play hard during most of recess. ). Questions are presented in a 3-point Likert type response format (1 Not Sure; 2 A Little Sure; 3 Very Sure). Higher scores indicate a decrease in negative self-perceptions in regard to the ability to make healthy choices. The Checklist section is a food checklist comprised of 34 items with a yes or no response format. Students are asked, Yesterday, did you eat or drink any of these foods? Higher scores indicate healthier food choices. A series of t-tests were computed to examine differences in mean scores on the pre- and post-test measures. Results The following graphs depict the results of the CATCH Nutrition program scores. 11
12 Graph 1: CATCH Participants by School CATCH Nutrition Program Number of Participants by School Briarglen 24 Clinton 27 McAuliffe 20 Marshall 11 Rosa Parks Roy Clark Penn n=146, TCCHD It s All About Kids Program Report The graph above depicts the number of participating students in each school for the CATCH nutrition program. A total of 146 fourth grade students, representing 7 schools, participated in the program. 12
13 Graph 2: CATCH Pre- and Post-Test Results CATCH Nutrition Program Mean Scores for CATCH Tests Post-Test Pre-Test Section A*** Section C*** Section I** Checklist Level of Significance: *** p <.001, ** P <.05 n=146, TCCHD It's All About Kids Program Report T-tests were used to assess differences in mean scores for all 7 school sites (N = 146). As the preceding graph illustrates, there are statistically significant differences between the Section A, Section C and Section I pre- and post-tests indicating improvement. Section A scores [t (146) = ; p <.001] significantly increased indicating students chose healthier foods. Section C [t (146) = ; p <.001] scores show significantly increased knowledge of healthy foods. Section I scores [t (146) = ; p <.05] were also significantly different suggesting a decrease in negative self-perceptions in regards to their ability to make healthy choices. Checklist scores [t (146) = 1.696; p >.001] were NOT statistically significant. 13
14 Discussion The CATCH Nutrition program was designed to track differences in pre- and post-test scores which consisted of four segments. Results indicate statistically significant differences between Section A, Section C and Section I scores examined in 7 schools with 146 participants. These findings suggest improvement in regards to student choices and perceptions. The CATCH Nutrition test is available in Appendix E. 14

15 It s All About Kids Body Mass Index and Blood Pressure Study 15
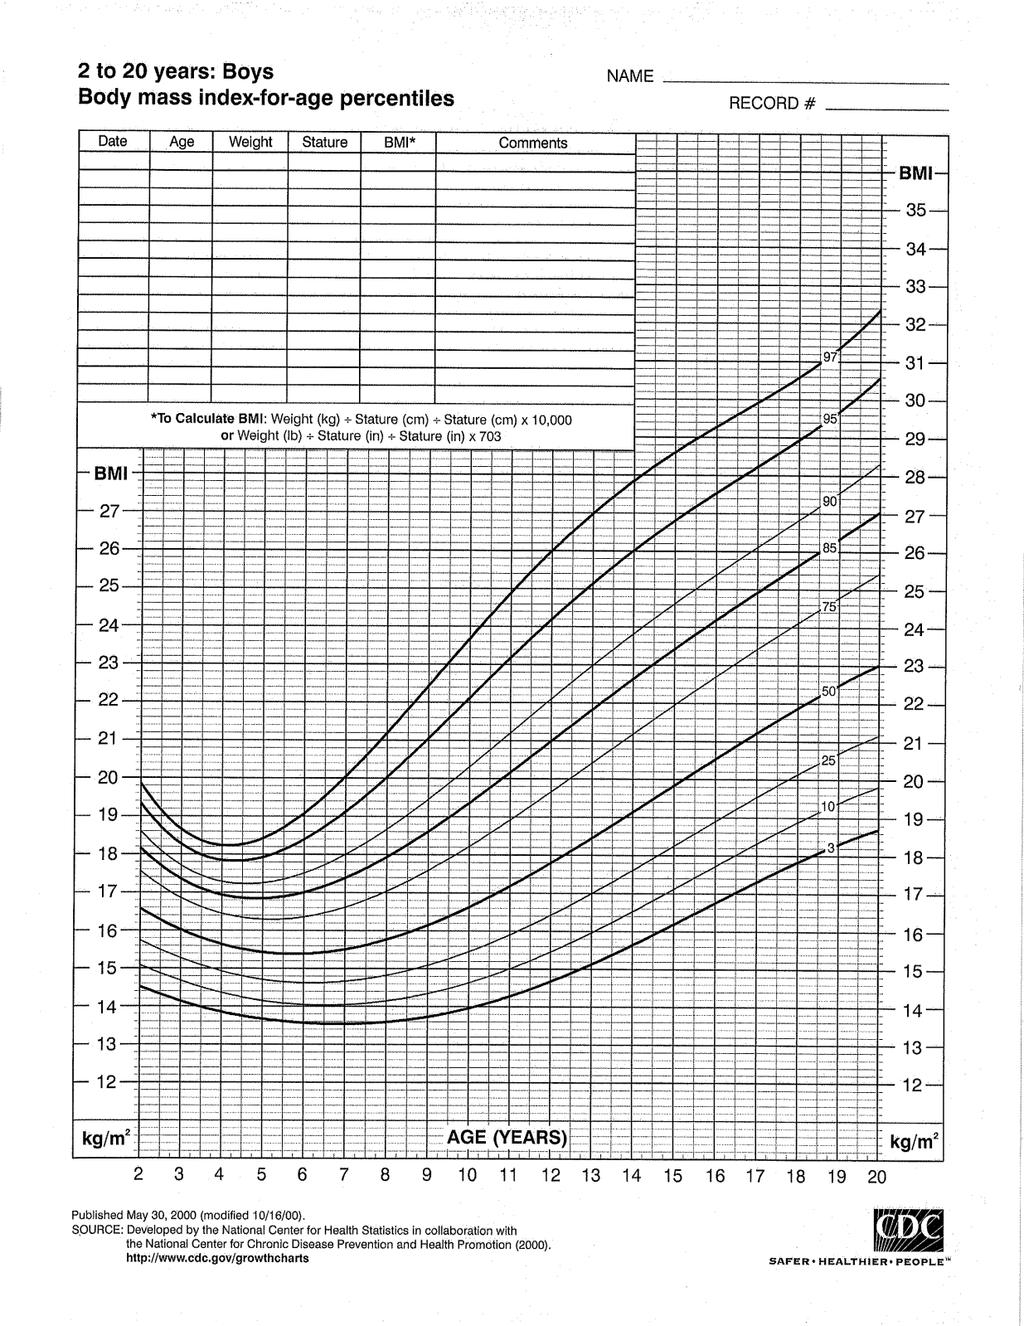
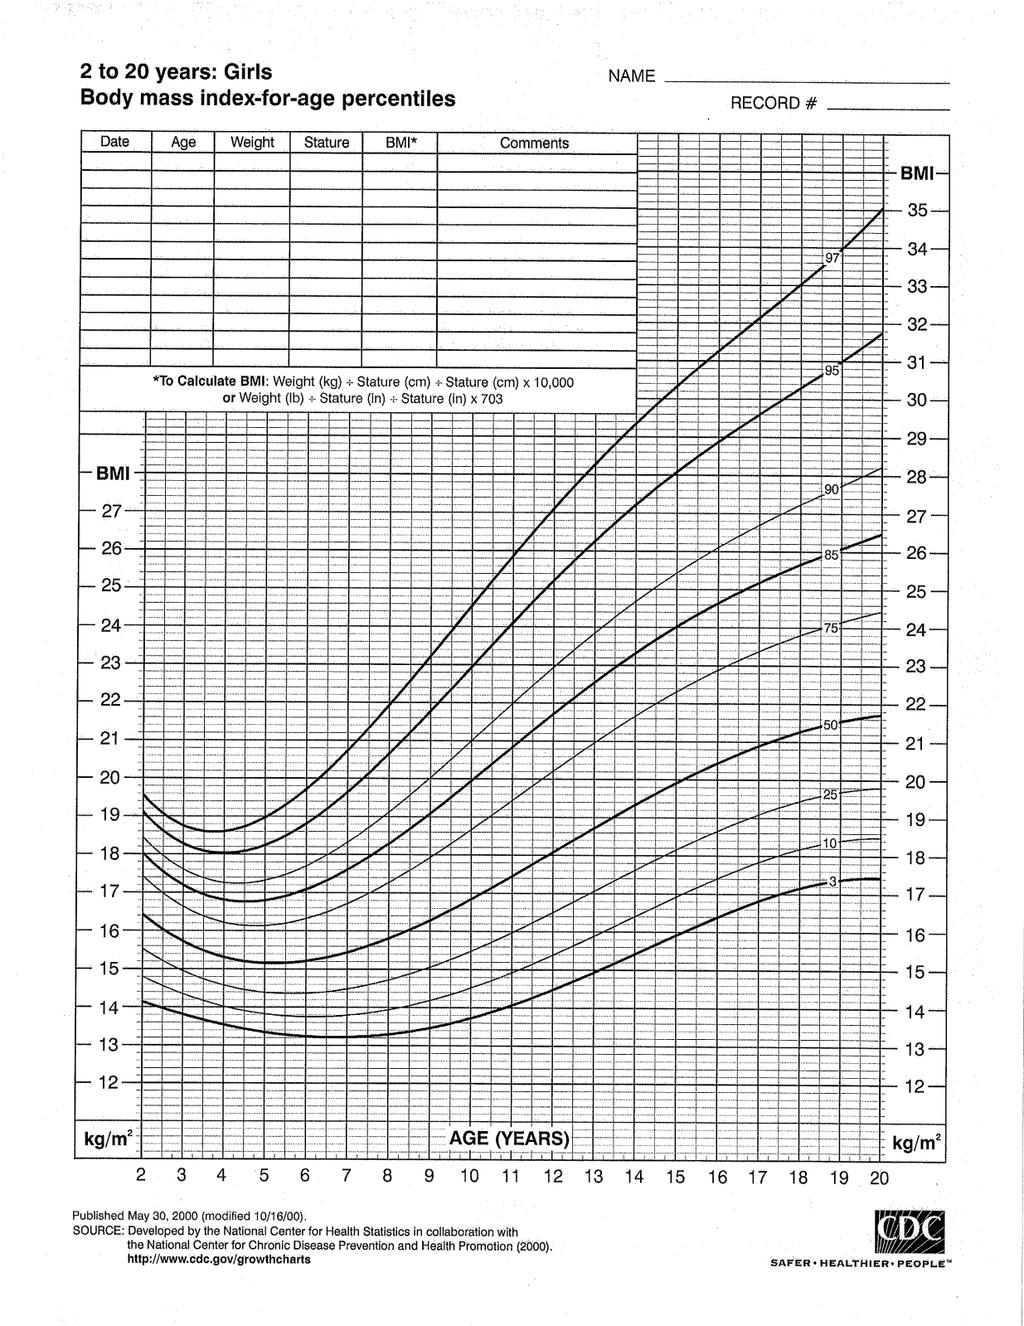
16 It s All About Kids Body Mass Index and Blood Pressure Study Purpose of Study TCCHD collected student body mass index (BMI) scores and blood pressure (BP) from elementary school students who participated in the It s All About Kids program. The following analyses and results are from spring 2012 and Methodology TCCHD collected BMI and BP scores from 451 students during spring 2012 and 198 students during spring Participating students were enrolled in grades first through sixth. Each time BMI and BP scores were collected, a TCCHD official recorded participants school, teachers name, student code, age, grade level, height, weight, systolic BP, and diastolic BP. TCCHD officials then calculated and recorded BMI scores based on the Center for Disease Control s (CDC) BMI calculation formula (Center for Disease Control and Prevention, 2007a): BMI = (weight in pounds x 703) (kg/m 2 ) height in inches 2 TCCHD provided the BMI information to the Center of Applied Research For Non-Profit Organizations for analysis. Student names were not identified with student scores; instead, TCCHD officials used codes in place of names for student tracking. OU researchers were given only codes to track student BMI scores. These procedures are followed to protect the privacy of participants. Because children s height and weight change as they mature, childhood BMI scores can be plotted onto the CDC s gender specific BMI-for-age Growth Charts (Center for Disease Control and Prevention, 2007c) to determine a percentile ranking. BMI raw scores were transformed into percentiles using the CDC s BMI percentile formula, which corresponds to the BMI-for-age Growth Charts; the formula is based on BMI, date of birth, gender, height, and age in months at time of assessment. Formulas are used rather than the growth charts to ensure greater accuracy. CDC s gender specific Growth Charts (Center for Disease Control and Prevention, 2007c) are located in Appendix B. The percentile ranking represents the child s BMI score among other children of the same age and gender. The BMI categories and the corresponding percentile are presented in Table 1 (Center for Disease Control and Prevention, 2007 b): 16
17 Table 1: BMI Category and Percentile Ranking BMI Category Underweight Healthy Weight Overweight Obese Percentile Ranking <5th percentile 5th percentile to < 85th percentile 85th percentile to < 95th percentile 95th percentile In addition, TCCHD provided BP scores to researchers at the Center of Applied Research For Non-Profit Organizations for analysis. Student codes rather than names were used to track students. BP raw scores were transformed into percentiles based on systolic BP, diastolic BP, date of birth, gender, height, and age in months at time of assessment. The charts for blood pressure levels by age and height percentile are presented in Appendix C (National Heart Lung and Blood Institute, 2008). BP scores were then characterized as normal, prehypertension ( Pre-HTN ), Stage 1: hypertension ( Stage 1: HTN ), or Stage 2: hypertension ( Stage 2: HTN ) based on percentiles defined by the US Department of Health and Human Services (2007; See Appendix D). Table 2: Systolic and Diastolic BP Category and Percentile Ranking BP Category Percentile Ranking Normal < 90th percentile Prehypertension 90th percentile to < 95th percentile Stage 1: Hypertension 95th percentile to 99th percentile Stage 2: Hypertension 99th percentile Note: The purpose of the present data is not to diagnose students with a given BP category. Further, doing so would be inaccurate since multiple measures of BP are required before a diagnosis can be made. Rather the purpose of this study is to obtain a general understanding of student BP categories. Participant demographics and BMI/BP categories from spring 2012 to spring 2013 semesters were analyzed to determine individual level changes of BMI categories between semesters. Results For the spring 2013 and 2013 semesters, 72 matched records were obtained from three schools. Frequency analyses were used to determine participant demographic characteristics. Graphs 3-5 depict demographic characteristics for the entire sample of unmatched participants (N = 450, spring 2012; N = 198, spring 2012). Because of small number of matches, BMI category changes were examined by grade level only (Note: 2012 spring grade level was used). Graphs 6-11 illustrate BMI changes and chi-square tests for matched data. Graphs illustrate blood pressure changes and chi-square tests for matched data. Finally, overall BMI categories and BP categories were examined for spring 2012 and 2013 (Graphs 25-28). 17

18 BMI Results Spring 2013 Spring
19 Graph 3: BMI Participants by School for Spring Body Mass Index Study Number of Participants Clinton Hawthorne Marshall Penn n=451, Spring 2012; n=198, Spring 2013 TCCHD It's All About Kids Program Report The graph above depicts the number of participants for each school for spring 2012 and spring Four schools were involved. The percent of students participating by school in spring 2012 is as follows: Penn (12%), Marshall (23%), Hawthorne (37%), and Clinton (22%). The percent of students participating by school in spring 2013 is as follows: Clinton (57%), Hawthorne (12%), and Penn (12%). Matched scores were obtained from three schools. 19
20 Graph 4: BMI Participants by Grade for Spring Body Mass Index Study Number of Participants First Second Third Fourth Fifth n=451, Spring 2012; n=198, Spring 2013 TCCHD It's All About Kids Program Report The above graph illustrates the number of participants by grade for spring 2012 and spring In regard to grade level for spring 2012, 86 (19%) participants were from the first grade, 79 (18%) participants were from the second grade, 122 (27%) participants were from the third grade, 70 (16%) participants were from the fourth grade, 68 (15%) were from the fifth grade, and 25 (6%) were from sixth grade. In regard to grade level for spring 2013, 53 (27%) participants were from the first grade, 33 (17%) participants were from the second grade, 29 (15%) participants were from the third grade, 34 (17%) participants were from the fourth grade, 36 (18%) participants were from fifth grade and 13 (7%) were from sixth grade. 20
21 Graph 5: BMI Participants by Gender for Spring Body Mass Index Study Number of Participants Female Male n=451, Spring 2012; n=198, Spring 2013 TCCHD It's All About Kids Program Report According to TCCHD BMI records, Graph 5 indicates that in spring 2012, 40% (n=179) of the students were male and 60% (n=272) of the students were female. In the spring of 2013, 45% (n = 90) of students were male and 55% (n = 108) of students were female. 21
22 Spring 2012 BMI Graph 6: BMI Changes Overall Spring Body Mass Index Study Overall BMI Changes Obese Overweight Healthy Underweight Spring Spring n=451, Spring 2012; n=198, Spring 2013 TCCHD It's All About Kids Program Report As Graph 6 illustrates, BMI categories were tabulated for spring 2012 and spring 2013 semesters. For the spring 2012 semester, 11 (2.4%) of all students were in the underweight category, 236 (52%) were in the healthy category, 86 (19%) were in the overweight category, and 118 (26%) were in the obese category. For spring 2013, 2(1%) were in the underweight category, 106 (53%) of all students were in the healthy category, 40 (20%) were in the overweight, and 50 (25%) were in the obese category. Table 3: BMI Rates of Change Overall Underweight (n=3) Healthy (n=37) Overweight (n=13) Obese (n=19) Spring 2013 BMI Underweight Healthy Overweight Obese 2 (66.7%) 1 (33.3%) 0 (0.0%) 0 (0.0%) 0 (0.0%) 30 (81.1%) 7 (18.9%) 0 (0.0%) 0 (0.0%) 4(30.8%) 6 (46.2%) 3 (23.1%) 0 (0.0%) 1 (5.3%) 1(5.3%) 17 (89.5%) Table 3 presents the results of the chi-square test used to track individual level BMI rates of change from spring 2012 to spring 2013; findings were statistically significant [ 2 (9) = ; p <.001]. In the spring 2012, of the 3 students in the underweight category, 1 (33.3%) moved to the healthy category. Of the 37 students that were in the healthy category, 7 (18.9%) moved to overweight category in spring In spring 2012 of the 13 students in the overweight category, 4 (30.8%) moved to the healthy category and 3 (23.1%) moved to the obese category in spring of In spring 2012, of the 19 students in the obese category, 1 (5.3%) moved to the healthy category and 1 (5.3%) moved to the overweight category. 22
23 Spring 2012 BMI Graph 7: BMI Changes Clinton Spring Body Mass Index Study Clinton BMI Changes Obese Overweight Healthy Underweight Spring Spring n=131, Spring 2012; n=41, Spring 2013 TCCHD It's All About Kids Program Report As Graph 7 illustrates, BMI categories were tabulated for spring 2012 and spring 2013 semesters for Clinton Elementary. For the spring 2012 semester, 5 (3.8%) of all students were in the underweight category, 69 (52.7%) were in the healthy category, 23 (17.6%) were in the overweight category, and 34 (26%) were in the obese category. For spring 2013, 2(4.9%) were in the underweight category, 17 (41.5%) of all students were in the healthy category, 8 (19.5%) were in the overweight, and 14 (34.1%) were in the obese category. Table 4: BMI Rates of Change at Clinton Elementary Underweight (n=3) Healthy (n=17) Overweight (n=8) Obese (n=13) Spring 2013 BMI Underweight Healthy Overweight Obese 2 (66.7%) 1 (33.3%) 0 (0.0%) 0 (0.0%) 0 (0.0%) 14 (82.4%) 3 (17.6%) 0 (0.0%) 0 (0.0%) 1(12.5%) 4 (50.0%) 3 (37.5%) 0 (0.0%) 1 (7.7%) 1(7.7%) 11 (84.6%) Table 4 presents the results of the chi-square test used to track individual level BMI rates of change from spring 2012 to spring 2013; findings were statistically significant [ 2 (9) = ; p <.001]. In the spring 2012, of the 3 students in the underweight category, 1 (33.3%) moved to the healthy category. Of the 17 students who were in the healthy category, 3 (17.6%) moved to overweight category in spring In spring 2012 of the 8 students in the overweight category, 1 (12.5%) moved to the healthy category and 3 (37.5%) moved to the obese category in spring of In spring 2012, of the 13 students in the obese category, 1 (7.7%) moved to the healthy category and 1 (7.7%) moved to the overweight category. 23
24 Spring 2012 BMI Graph 8: BMI Changes Hawthorne Spring Body Mass Index Study Hawthorne BMI Changes Obese Overweight Healthy Underweight Spring Spring n=165, Spring 2012; n=27, Spring 2013 TCCHD It's All About Kids Program Report As Graph 8 illustrates, BMI categories were tabulated for spring 2012 and spring 2013 semesters for Hawthorne Elementary. For the spring 2012 semester, 1 (.6%) of all students was in the underweight category, 91 (55.2%) were in the healthy category, 38 (23%) were in the overweight category, and 35 (21.2%) were in the obese category. For spring 2013, 0 (0.0%) were in the underweight category, 17 (63%) of all students were in the healthy category, 5 (18.5%) were in the overweight, and 5 (18.5%) were in the obese category. Table 5: BMI Rates of Change at Hawthorne Elementary Spring 2013 BMI Healthy Overweight Obese Healthy (n=18) 15 (83.3%) 3 (16.7%) 0 (0.0%) Overweight (n=4) 2(50.0%) 2 (50.0%) 0 (0.0%) Obese (n=5) 0 (0.0%) 0 (0.0%) 5 (100%) Table 5 presents the results of the chi-square test used to track individual level BMI rates of change from spring 2012 to spring 2013; findings were statistically significant [ 2 (4) = ; p <.001]. In the spring 2012, of the 18 students who were in the healthy category, 3 (16.7%) moved to overweight category in spring In spring 2012 of the 4 students in the overweight category, 2 (50.0%) moved to the healthy category in spring of In spring 2012, of the 5 students in the obese category, all 5 (100%) remained in the obese category. 24
25 Spring 2012 BMI Graph 9: BMI Changes Penn Spring Body Mass Index Study Penn BMI Changes Obese Overweight Healthy Underweight Spring Spring n=53, Spring 2012; n=4, Spring 2013 TCCHD It's All About Kids Program Report As Graph 9 illustrates, BMI categories were tabulated for spring 2012 and spring 2013 semesters for Penn Elementary. For the spring 2012 semester, 4 (7.5%) of all students were in the underweight category, 24 (45.3%) were in the healthy category, 10 (18.9%) were in the overweight category, and 15 (28.3%) were in the obese category. For spring 2013, 0 (0.0%) were in the underweight category, 2 (50%) of all students were in the healthy category, 1 (25%) was in the overweight, and 1 (25%) was in the obese category. Table 6: BMI Rates of Change at Penn Elementary Spring 2013 BMI Healthy Overweight Obese Healthy (n=2) 1 (50.0%) 1 (50.0%) 0 (0%) Overweight (n=1) 1 (100%) 0 (0.0%) 0 (0.0%) Obese (n=1) 0 (0.0%) 0 (0.0%) 1 (100%) Table 6 presents the results of the chi-square test used to track individual level BMI rates of change from spring 2012 to spring 2013; findings were NOT statistically significant [ 2 (4) = 5.000; p >.05]. In the spring 2012, of the 2 students in the healthy category, 1 (50%) moved to overweight category in spring In spring 2012 of the 1 student in the overweight category, 1 (100%) moved to the healthy category in spring of In spring 2012, of the 1 student in the obese category, that student (100%) remained in the obese category. 25
26 Spring 2012 BMI Graph 10: BMI Changes for First Graders Spring Body Mass Index Study First Graders BMI Changes Obese Overweight Healthy Underweight Spring Spring n=86, Spring 2012; n=15, Spring 2013 TCCHD It's All About Kids Program Report As Graph 10 illustrates, BMI categories were tabulated for spring 2012 and spring 2013 semesters. For the spring 2012 semester, 3 (3.5%) of all students were in the underweight category, 42 (48.8%) were in the healthy category, 23 (26.7%) were in the overweight category, and 13 (20.9%) were in the obese category. For spring 2013, 6 (40%) of all students were in the healthy category, 1 (6.7%) was in the overweight, and 8 (53.3%) were in the obese category. Table 7: BMI Rates of Change for First Graders Spring 2013 BMI Healthy Overweight Obese Healthy (n=4) 4 (100%) 0 (0%) 0 (0%) Overweight (n=3) 1 (33.3%) 0 (0.0%) 2 (66.7%) Obese (n=8) 1 (12.5%) 1(12.5%) 6 (75%) Table 7 presents the results of the chi-square test used to track individual level BMI rates of change from spring 2012 to spring 2013; findings were NOT statistically significant [ 2 (4) = 8.958; p >.05]. In the spring 2012, of the 4 students in the healthy category, 100% remained in the healthy category in spring In spring 2012 of the 3 students in the overweight category, 1 (33.3%) moved to the healthy category in spring of 2013 and 2 (66.7%) moved to the obese category. In spring 2012, of the 8 students in the obese category, 1 (12.5%) moved to the healthy category and 1 (12.5%) moved to the overweight category, and 6 (75%) remained in the obese category by spring
27 Spring 2012 BMI Graph 11: BMI Changes for Second Graders Spring Body Mass Index Study Second Graders BMI Changes Obese Overweight Healthy Underweight Spring Spring n=79, Spring 2012; n=12, Spring 2013 TCCHD It's All About Kids Program Report As Graph 11 illustrates, BMI categories were tabulated for spring 2012 and spring 2013 semesters. For the spring 2012 semester, 1 (1.3%) of all students was in the underweight category, 45 (57%) were in the healthy category, 13 (16.5%) were in the overweight category, and 20 (25.3%) were in the obese category. For spring 2013, 9 (75%) of all students were in the healthy category, 3 (25%) were in the overweight, and 0 (0%) were in the obese category. Table 8: BMI Rates of Change for Second Graders Spring 2013 BMI Healthy Overweight Obese Healthy (n=11) 9 (81.8%) 2 (18.2%) 0 (0%) Overweight (n=1) 0 (0.0%) 1 (100%) 0 (0%) Obese (n=0) 0 (0.0%) 0 (0.0%) 0 (0.0%) Table 8 presents the results of the chi-square test used to track individual level BMI rates of change from spring 2012 to spring 2013; findings were NOT statistically significant [ 2 (1) = 3.273; p >.05]. In the spring 2012, of the 11 students in the healthy category, 9 (81.8%) remained in the healthy category and 2 (18.2%) moved to the overweight category in spring In spring 2012, 1 (100%) remained in the overweight category in spring of In spring 2012, there were no students in the obese category. 27
28 Spring 2012 BMI Graph 12: BMI Changes for Third Graders Spring Body Mass Index Study Third Graders BMI Changes Obese Overweight Healthy Underweight Spring Spring n=122, Spring 2012; n=21, Spring 2013 TCCHD It's All About Kids Program Report As the above graphs illustrates, for the spring 2012 semester, 3 (2.5%) of all the students were in the underweight category, 67 (54.9%) were in the healthy category, 21 (17.2%) were in the overweight category, and 31 (25.4%) were in the obese category. For spring 2013, 1 (4.8%) was in the underweight category, 12 (57.1%) were in the healthy category, 5 (23.8%) were in the overweight category, and 3 (14.3%) were in the obese category. Table 9: BMI Rates of Change for Third Graders Spring 2013 BMI Underweight Healthy Overweight Obese Underweight(n=1) 1 (100%) 0 (0.0%) 0 (0.0%) 0 (0.0%) Healthy (n=13) 0 (0.0%) 10 (76.9%) 3 (23.1%) 0 (0.0%) Overweight (n=4) 0 (0.0%) 2 (50%) 2 (50%) 0 (0%) Obese (n=3) 0 (0.0%) 0 (0.0%) 0 (0.0%) 3 (100%) Table 9 presents the results of the chi-square test used to track individual level BMI rates of change from spring 2012 to spring 2013; findings were statistically significant [ 2 (9) = ; p <.001]. In the spring 2012, 1 (100%) student was in the underweight category and remained in the underweight category, of the 13 students in the healthy category, 10 (76.9%) remained in the healthy category, 3 (23.1%) moved to the overweight category in spring of Of the 4 students in the overweight category in the spring 2012, 2 (50%) moved to the healthy category and 2 (50%) remained in the overweight category. 28
29 Spring 2012 BMI Graph 13: BMI Changes for Fourth Graders Spring Body Mass Index Study Fourth Graders BMI Changes Obese Overweight Healthy Underweight Spring Spring n=70, Spring 2012; n=18, Spring 2013 TCCHD It's All About Kids Program Report As graph 13 illustrates, for the spring 2012 semester, 2 (2.9%) of all students were in the underweight category, 31 (44.3%) students were in the healthy category, 15 (21.4%) were in the overweight category and 22 (31.4%) were in the obese category. For spring 2013, 1 (5.6%) of all students was in the underweight category, 5 (27.8%) were in the healthy category, 4 (22.2%) were in the overweight category, and 8 (44.4%) were in the obese category. Table 10: BMI Rates of Change for Fourth Graders Spring 2013 BMI Underweight Healthy Overweight Obese Underweight(n=1) 1 (100%) 0 (0.0%) 0 (0.0%) 0 (0.0%) Healthy (n=6) 0 (0.0%) 4 (66.7%) 2 (33.3%) 0 (0.0%) Overweight (n=4) 0 (0.0%) 1 (25%) 2 (50%) 1 (25%) Obese (n=7) 0 (0.0%) 0 (0.0%) 0 (0.0%) 7(100%) Table 10 presents the results of the chi-square test used to track individual level BMI rates of change from spring 2012 to spring 2013; findings were statistically significant [ 2 (9) = ; p <.001]. In the spring 2012, the 1 underweight student remained underweight in spring of Of 6 healthy students in 2012, 4 (66.7%) remained in the healthy category and 2 (33.3%) moved to the overweight category in spring Of the 4 students in the overweight category in spring 2012, 1 (25%) improved to the healthy category, 2 (50%) remained in the overweight category, and 1 (25%) moved to the obese category in the spring Of the 7 students in the obese category in spring 2012, 7 (100%) saw no improvement in the spring of
30 Spring 2012 BMI Graph 14: BMI Changes for Fifth Graders Body Mass Index Study Fifth Graders BMI Changes Obese Overweight Healthy Underweight Spring Spring n=68, Spring 2012; n=6, Spring 2013 TCCHD It's All About Kids Program Report As graph 14 illustrates, for the spring 2012 semester, 1 (1.5%) student was in the underweight category, 38 (55.9%) were in the healthy category, and 9 (13.2%) were in the overweight category and 20 (29.4%) were in the obese category. For spring 2013, 4 (66.7%) of all students were in the healthy category, 1 (16.7%) was in the overweight category and 1 (16.7%) was in the obese category. Table 11: BMI Rates of Change for Spring Spring 2013 BMI Underweight Healthy Overweight Obese Underweight(n=1) 0 (0.0%) 1 (100%) 0 (0.0%) 0 (0.0%) Healthy (n=3) 0 (0.0%) 3 (100%) 0 (0.0%) 0 (0.0%) Overweight (n=1) 0 (0.0%) 0 (0.0%) 1 (100%) 0 (0.0%) Obese (n=1) 0 (0.0%) 0 (0.0%) 0 (0.0%) 1(100%) Table 11 presents the results of the chi-square test used to track individual level BMI rates of change from spring 2012 to spring 2013; findings were NOT statistically significant [ 2 (6) = ; p >.05]. In the spring 2012, the 1 underweight student moved to the healthy category; of the 3 healthy students, all 3 (100%) maintained a healthy category in spring The 1 (100%) student in the overweight category remained in the overweight category and 1 (100%) student in the obese category remained in the obese category in spring

31 Blood Pressure Results Spring 2012 Spring
32 Spring 2012 Systolic Graph 15: Overall Systolic Changes for Spring Blood Pressure Study Overall Systolic Changes Stage 2:HTN Stage 1:HTN Pre-HTN Normal Spring Spring n=451, Spring 2012; n=198, Spring 2013 TCCHD It's All About Kids Program Report The above graph illustrates the overall systolic percentages. For the spring 2012 semester, 346 (76.7%) students were in the normal category, 47 (10.4%) were in the Pre-HTN category, 58 (12.9%) were in Stage 1 HTN category and 0 (0.0%) were in the Stage 2 HTN category. For spring 2013, 148 (74.7%) of all students were in the normal category, 23 (11.6%) were in the Pre-HTN category, 27 (13.6%) were in the Stage 1 HTN category, and 0 (0.0%) were in the Stage 2 HTN category. Table 12: Systolic Percentages Overall Spring 2013 Systolic Normal Pre-HTN Stage 1 HTN Stage 2 HTN Normal (n=52) 43 (82.7%) 3 (5.8%) 6 (11.5%) 0 (0.0%) Pre-HTN (n=11) 10 (90.9%) 1 (9.1%) 0 (0.0%) 0 (0.0%) Stage 1 HTN (n=9) 2 (22.2%) 3 (33.3%) 4 (44.4%) 0 (0.0%) Stage 2 HTN (n=0) 0 (0.0%) 0 (0.0%) 0 (0.0%) 0 (0.0%) Table 12 presents the results of the chi-square test used to track individual level systolic rates of change from spring 2012 to spring 2013; findings were statistically significant [ 2 (4) = ; p <.001]. In the spring 2012, of the 52 students in the normal category, 3 (5.8%) showed increased systolic pressure to the Pre-HTN category, and 6(11.5%) increased to the Stage 1 HTN category. Of the 11 students in Pre-HTN category in 2012, 10 (90.9%) had improved to the normal category. Of the 9 students in the Stage 1 HTN category, 2 (22.2%) had improved to the normal category and 3 (33.3%) had improved to the Pre-HTN category by spring of
33 Spring 2012 Diastolic Graph 16: Overall Diastolic Changes for Spring Blood Pressure Study Overall Diastolic Changes Stage 2:HTN Stage 1:HTN Pre-HTN Normal Spring Spring n=451, Spring 2012; n=198, Spring 2013 TCCHD It's All About Kids Program Report The above graph illustrates the overall diastolic percentages. For the spring 2012 semester, 338 (74.9%) students were in the normal category, 53 (11.8%) students were in the Pre-HTN category, 60 (13.3%) were in the Stage 1 HTN category, and 0 (0.0%) students were in the Stage 2 HTN category. For spring 2013, 148 (74.7%) of all students were in the normal category, 23 (11.6%) were in the Pre-HTN category, 27 (13.6%) were in the Stage 1 HTN category, and 0 (0.0%) were in the Stage 2 HTN category. Table 13: Diastolic Percentages Overall Spring 2013 Diastolic Normal Pre-HTN Stage 1 HTN Stage 2 HTN Normal (n=56) 46 (82.1%) 4 (7.1%) 6 (10.7%) 0 (0.0%) Pre-HTN (n=6) 6 (100%) 0 (0.0%) 0 (0.0%) 0 (0.0%) Stage 1 HTN (n=10) 4 (40%) 2 (20%) 4 (40%) 0 (0.0%) Stage 2 HTN (n=0) 0 (0.0%) 0 (0.0%) 0 (0.0%) 0 (0.0%) Table 13 presents the results of the chi-square test used to track individual level diastolic rates of change from spring 2012 to spring 2013; findings were statistically significant [ 2 (4) = ; p <.05]. In the spring 2012, of the 56 students in the normal category, 10 showed increased diastolic blood pressure by spring of Four (7.1%) of the ten increased to the Pre-HTN category and 6 (10.7%) increased to the Stage 1 HTN category. Of the 6 students in the Pre-HTN category, 100% improved to the normal category. Of the 10 students in the Stage 1 HTN category, 4 (40%) improved to the normal category and 2 (20%) improved to the Pre-HTN category. 33
34 Spring 2012 Systolic Graph 17: Clinton Systolic Changes for Spring Blood Pressure Study Clinton Systolic Changes Stage 2:HTN Stage 1:HTN Pre-HTN Normal Spring Spring n=131, Spring 2012; n=41, Spring 2013 TCCHD It's All About Kids Program Report The above graph illustrates the systolic percentages for Clinton Elementary. For the spring 2012 semester, 104 (79.4%) students were in the normal category, 8 (6.1%) were in the Pre-HTN category, 19 (14.5%) were in Stage 1 HTN category and 0 (0.0%) were in the Stage 2 HTN category. For spring 2013, 30 (73.2%) of all students were in the normal category, 23 (9.8%) were in the Pre-HTN category, 7 (17.1%) were in the Stage 1 HTN category, and 0 (0.0%) were in the Stage 2 HTN category. Table 14: Systolic Percentages for Clinton Elementary Spring 2013 Systolic Normal Pre-HTN Stage 1 HTN Stage 2 HTN Normal (n=32) 26 (81.3%) 2 (6.3%) 4 (12.5%) 0 (0.0%) Pre-HTN (n=3) 3 (100%) 0 (0.0%) 0 (0.0%) 0 (0.0%) Stage 1 HTN (n=6) 1 (16.7%) 2 (33.3%) 3 (50.0%) 0 (0.0%) Stage 2 HTN (n=0) 0 (0.0%) 0 (0.0%) 0 (0.0%) 0 (0.0%) Table 14 presents the results of the chi-square test used to track individual level systolic rates of change from spring 2012 to spring 2013; findings were statistically significant [ 2 (4) = ; p <.05]. In the spring 2012, of the 32 students in the normal category, 2 (6.3%) increased systolic pressure to the Pre-HTN category, and 4 (12.5%) increased to the Stage 1 HTN category. Of the 3 students in Pre-HTN category in 2012, 3 (100%) had improved to the normal category. Of the 6 students in the Stage 1 HTN category, 1 (16.7%) had improved to the normal category and 2 (33.3%) had improved to the Pre-HTN category by spring of
35 Spring 2012 Diastolic Graph 18: Clinton Diastolic Changes for Spring Blood Pressure Study Clinton Diastolic Changes Stage 2:HTN Stage 1:HTN Pre-HTN Normal Spring Spring n=131, Spring 2012; n=41, Spring 2013 TCCHD It's All About Kids Program Report The above graph illustrates the diastolic percentages for Clinton Elementary. For the spring 2012 semester, 100 (76.3%) students were in the normal category, 16 (12.2%) students were in the Pre-HTN category, 15 (11.5%) were in the Stage 1 HTN category, and 0 (0.0%) students were in the Stage 2 HTN category. For spring 2013, 30 (73.2%) of all students were in the normal category, 3 (7.3%) were in the Pre-HTN category, 8 (19.5%) were in the Stage 1 HTN category, and 0 (0.0%) were in the Stage 2 HTN category. Table 15: Diastolic Percentages for Clinton Elementary Spring 2013 Diastolic Normal Pre-HTN Stage 1 HTN Stage 2 HTN Normal (n=32) 26 (81.3%) 2 (6.3%) 4 (12.5%) 0 (0.0%) Pre-HTN (n=2) 2 (100%) 0 (0.0%) 0 (0.0%) 0 (0.0%) Stage 1 HTN (n=7) 2 (28.6%) 1 (14.3%) 4 (57.1%) 0 (0.0%) Stage 2 HTN (n=0) 0 (0.0%) 0 (0.0%) 0 (0.0%) 0 (0.0%) Table 15 presents the results of the chi-square test used to track individual level diastolic rates of change from spring 2012 to spring 2013; findings were NOT statistically significant [ 2 (4) = 9.323; p >.05]. In the spring 2012, of the 32 students in the normal category, 6 showed increased diastolic blood pressure by spring of Two (6.3%) increased to the Pre-HTN category and 4 (12.5%) increased to the Stage 1 HTN category. Of the 2 students in the Pre-HTN category, 100% improved to the normal category. Of the 7 students in the Stage 1 HTN category, 2 (28.6%) improved to the normal category and 1 (14.3%) improved to the Pre-HTN category. 35
36 Spring 2012 Systolic Graph 19: Hawthorne Systolic Changes for Spring Spring Blood Pressure Study Hawthorne Systolic Changes Stage 2:HTN Stage 1:HTN Pre-HTN Normal Spring n=165, Spring 2012; n=27, Spring 2013 TCCHD It's All About Kids Program Report The above graph illustrates the systolic percentages for Hawthorne Elementary. For the spring 2012 semester, 122 (73.9%) students were in the normal category, 26 (15.8%) were in the Pre-HTN category, 17 (10.3%) were in Stage 1 HTN category and 0 (0.0%) were in the Stage 2 HTN category. For spring 2013, 22 (81.5%) of all students were in the normal category, 3 (11.1%) were in the Pre-HTN category, 7 (7.1%) were in the Stage 1 HTN category, and 0 (0.0%) were in the Stage 2 HTN category. Table 16: Systolic Percentages for Hawthorne Elementary Spring 2013 Systolic Normal Pre-HTN Stage 1 HTN Stage 2 HTN Normal (n=17) 15 (88.2%) 1 (5.9%) 1 (5.9%) 0 (0.0%) Pre-HTN (n=7) 6 (85.7%) 1 (14.3%) 0 (0.0%) 0 (0.0%) Stage 1 HTN (n=3) 1 (33.3%) 1 (33.3%) 1 (33.3%) 0 (0.0%) Stage 2 HTN (n=0) 0 (0.0%) 0 (0.0%) 0 (0.0%) 0 (0.0%) Table 16 presents the results of the chi-square test used to track individual level systolic rates of change from spring 2012 to spring 2013; findings were NOT statistically significant [ 2 (4) = 6.073; p >.05]. In the spring 2012, of the 17 students in the normal category, 1 (5.9%) increased systolic pressure to the Pre-HTN category, and 1 (5.9%) increased to the Stage 1 HTN category. Of the 7 students in Pre-HTN category in 2012, 6 (85.7%) had improved to the normal category. Of the 3 students in the Stage 1 HTN category, 1 (33.3%) had improved to the normal category and 1 (33.3%) had improved to the Pre-HTN category by spring of
37 Spring 2012 Diastolic Graph 20: Hawthorne Diastolic Changes for Spring Spring Blood Pressure Study Hawthorne Diastolic Changes Stage 2:HTN Stage 1:HTN Pre-HTN Normal 75.8 Spring n=165, Spring 2012; n=27, Spring 2013 TCCHD It's All About Kids Program Report The above graph illustrates the diastolic percentages for Hawthorne Elementary. For the spring 2012 semester, 125 (75.8%) students were in the normal category, 17 (10.3%) students were in the Pre-HTN category, 23 (13.9%) were in the Stage 1 HTN category, and 0 (0.0%) students were in the Stage 2 HTN category. For spring 2013, 24 (88.9%) of all students were in the normal category, 2 (7.4%) were in the Pre-HTN category, 1 (3.7%) was in the Stage 1 HTN category, and 0 (0.0%) were in the Stage 2 HTN category. Table 17: Diastolic Percentages for Hawthorne Elementary Spring 2013 Diastolic Normal Pre-HTN Stage 1 HTN Stage 2 HTN Normal (n=21) 18 (85.7%) 2 (9.5%) 1 (4.8%) 0 (0.0%) Pre-HTN (n=4) 4 (100%) 0 (0.0%) 0 (0.0%) 0 (0.0%) Stage 1 HTN (n=2) 2 (100%) 0 (0.0%) 0 (0.0%) 0 (0.0%) Stage 2 HTN (n=0) 0 (0.0%) 0 (0.0%) 0 (0.0%) 0 (0.0%) Table 17 presents the results of the chi-square test used to track individual level diastolic rates of change from spring 2012 to spring 2013; findings were NOT statistically significant [ 2 (4) =.964; p >.05]. In the spring 2012, of the 21 students in the normal category, 3 showed increased diastolic blood pressure by spring of Two (9.5%) increased to the Pre-HTN category and 1 (4.8%) increased to the Stage 1 HTN category. Of the 4 students in the Pre-HTN category, 100% improved to the normal category. Of the 2 students in the Stage 1 HTN category, 2 (100%) improved to the normal category by spring of
38 Spring 2012 Systolic Graph 21: Penn Systolic Changes for Spring Blood Pressure Study Penn Systolic Changes Spring Stage 2:HTN Stage 1:HTN Pre-HTN Normal 86.8 Spring n=53, Spring 2012; n=4, Spring 2013 TCCHD It's All About Kids Program Report The above graph illustrates the systolic percentages for Penn Elementary. For the spring 2012 semester, 46 (86.8%) students were in the normal category, 4 (7.5%) were in the Pre-HTN category, 3 (5.7%) were in Stage 1 HTN category and 0 (0.0%) were in the Stage 2 HTN category. For spring 2013, 3 (75%) of all students were in the normal category, 0 (0.0%) were in the Pre-HTN category, 1 (25%) was in the Stage 1 HTN category, and 0 (0.0%) were in the Stage 2 HTN category. Table 18: Systolic Percentages for Penn Elementary Spring 2013 Systolic Normal Pre-HTN Stage 1 HTN Stage 2 HTN Normal (n=3) 2 (66.7%) 0 (0.0%) 1 (33.3%) 0 (0.0%) Pre-HTN (n=1) 1 (100%) 0 (0.0%) 0 (0.0%) 0 (0.0%) Stage 1 HTN (n=0) 0 (0.0%) 0 (0.0%) 0 (0.0%) 0 (0.0%) Stage 2 HTN (n=0) 0 (0.0%) 0 (0.0%) 0 (0.0%) 0 (0.0%) Table 18 presents the results of the chi-square test used to track individual level systolic rates of change from spring 2012 to spring 2013; findings were NOT statistically significant [ 2 (1) =.444; p >.05]. In the spring 2012, of the 3 students in the normal category, 1 (33.3%) increased systolic pressure to the Stage 1-HTN category by spring of Of the 1 student in Pre-HTN category in 2012, 1 (100%) had improved to the normal category by spring of
39 Spring 2012 Diastolic Graph 22: Penn Diastolic Changes for Spring Blood Pressure Study Penn Diastolic Changes Stage 2:HTN Stage 1:HTN Pre-HTN Normal Spring Spring n=53, Spring 2012; n=4, Spring 2013 TCCHD It's All About Kids Program Report The above graph illustrates the diastolic percentages for Penn Elementary. For the spring 2012 semester, 42 (79.2%) students were in the normal category, 4 (7.5%) students were in the Pre-HTN category, 7 (13.0%) were in the Stage 1 HTN category, and 0 (0.0%) students were in the Stage 2 HTN category. For spring 2013, 2 (50%) of all students were in the normal category, 1 (25%) was in the Pre-HTN category, 1 (25%) was in the Stage 1 HTN category, and 0 (0.0%) were in the Stage 2 HTN category. Table 19: Diastolic Percentages for Penn Elementary Spring 2013 Diastolic Normal Pre-HTN Stage 1 HTN Stage 2 HTN Normal (n=3) 2 (66.7%) 0 (0.0%) 1 (33.3%) 0 (0.0%) Pre-HTN (n=0) 0 (0.0%) 0 (0.0%) 0 (0.0%) 0 (0.0%) Stage 1 HTN (n=1) 0 (0.0%) 1 (100%) 0 (0.0%) 0 (0.0%) Stage 2 HTN (n=0) 0 (0.0%) 0 (0.0%) 0 (0.0%) 0 (0.0%) Table 19 presents the results of the chi-square test used to track individual level diastolic rates of change from spring 2012 to spring 2013; findings were NOT statistically significant [ 2 (2) = 4.000; p >.05]. In the spring 2012, of the 3 students in the normal category, 1 showed increased diastolic blood pressure to the Stage 1 HTN category by spring of Of the 1 student in the Stage 1 HTN category, 1 (100%) improved to the Pre-HTN category by spring of
40 Spring 2012 Systolic Graph 23: Systolic Changes for First Graders Spring Spring Blood Pressure Study First Graders Systolic Changes Stage 2:HTN Stage 1:HTN Pre-HTN Normal 81.4 Spring n=86, Spring 2012; n=15, Spring 2013 TCCHD It's All About Kids Program Report The above graph illustrates the systolic percentages for first graders. For the spring 2012 semester, 70 (81.4%) students were in the normal category, 6 (7%) were in the Pre-HTN category, 10 (11.6%) were in Stage 1 HTN category and 0 (0.0%) were in the Stage 2 HTN category. For spring 2013, 10 (66.7%) of all students were in the normal category, 1 (6.7%) was in the Pre-HTN category, 4 (26.7%) were in the Stage 1 HTN category, and 0 (0.0%) were in the Stage 2 Hypertension category. Table 20: Systolic Percentages for First Graders Spring 2013 Systolic Normal Pre-HTN Stage 1 HTN Stage 2 HTN Normal (n=12) 10(83.3%) 1 (8.3%) 1 (8.3%) 0 (0.0%) Pre-HTN (n=0) 0 (0.0%) 0 (0.0%) 0 (0.0%) 0 (0.0%) Stage 1 HTN (n=3) 0 (0.0%) 0 (0.0%) 3 (100%) 0 (0.0%) Stage 2 HTN (n=0) 0 (0.0%) 0 (0.0%) 0 (0.0%) 0 (0.0%) Table 20 presents the results of the chi-square test used to track individual level systolic rates of change from spring 2012 to spring 2013; findings were statistically significant [ 2 (2) = ; p <.001]. In the spring 2012, of the 12 students in the normal category, 2 showed increased systolic blood pressure, 1 (8.3%) at the Pre-HTN category and 1 (8.3%) at the Stage 1 HTN category. There were no students in the Pre-HTN category in Of the 3 students in the Stage 1 HTN category in spring of 2012, 100% remained at the Stage 1 HTN category. 40
41 Spring 2012 Diastolic Graph 24: Diastolic Changes for First Graders Spring Blood Pressure Study First Graders Diastolic Changes Stage 2:HTN Stage 1:HTN Pre-HTN Normal Spring Spring n=86, Spring 2012; n=15, Spring 2013 TCCHD It's All About Kids Program Report The above graph illustrates the diastolic percentages for first graders. For the spring 2012 semester, 58 (65.1%) students were in the normal category, 11 (12.8%) students were in the Pre-HTN category, 19 (22.1%) were in the Stage 1 HTN category, and 0 (0.0%) students were in the Stage 2 HTN category. For spring 2013, 21(53.3%) of all students were in the normal category, 2(13.3%) were in the Pre-HTN category, 5 (33.3%) were in the Stage 1 HTN category, and 0 (0.0%) were in the Stage 2 HTN category. Table 21: Diastolic Percentages for First Graders Spring 2013 Diastolic Normal Pre-HTN Stage 1 HTN Stage 2 HTN Normal (n=11) 8(72.7%) 1 (9.1%) 2 (18.2%) 0 (0.0%) Pre-HTN (n=0) 0 (0.0%) 0 (0.0%) 0 (0.0%) 0 (0.0%) Stage 1 HTN (n=4) 0 (0.0%) 1 (25%) 3 (75%) 0 (0.0%) Stage 2 HTN (n=0) 0 (0.0%) 0 (0.0%) 0 (0.0%) 0 (0.0%) Table 21 presents the results of the chi-square test used to track individual level diastolic rates of change from spring 2012 to spring 2013; findings were statistically significant [ 2 (2) = 6.307; p <.05]. In the spring 2012, of the 11 students in the normal category, 3 showed increased diastolic blood pressure, 1 (9.1%) at the Pre-HTN category and 2 (18.2%) at the Stage 1 HTN category. There were no students in the Pre-HTN category in Of the 4 students in the Stage 1 HTN category in spring of 2012, 1 (25%) improved to the Pre-HTN category, and 3 (75%) remained at the Stage 1 HTN category. 41
42 Spring 2012 Systolic Graph 25: Systolic Changes for Second Graders Spring Blood Pressure Study Second Graders Systolic Changes Spring Stage 2:HTN Stage 1:HTN Pre-HTN Normal 81 Spring n=79, Spring 2012; n=12, Spring 2013 TCCHD It's All About Kids Program Report The above graph illustrates the systolic percentages for second graders. For the spring 2012 semester, 64 (81%) students were in the normal category, 6 (7.6%) were in the Pre-HTN category, 9 (11.4%) were in Stage 1 HTN category and 0 (0.0%) were in the Stage 2 Hypertension category. For spring 2013, 10 (83.3%) of all students were in the normal category, 1 (8.3%) was in the pre-hypertension category, 1 (8.3%) was in the Stage 1 Hypertension category, and 0 (0.0%) were in the Stage 2 Hypertension category. Table 22: Systolic Percentages for Second Graders Spring 2013 Systolic Normal Pre-HTN Stage 1 HTN Stage 2 HTN Normal (n=9) 7(77.8%) 1 (11.1%) 1 (11.1%) 0 (0.0%) Pre-HTN (n=3) 3 (100%) 0 (0.0%) 0 (0.0%) 0 (0.0%) Stage 1 HTN (n=0) 0 (0.0%) 0 (0.0%) 0 (0.0%) 0 (0.0%) Stage 2 HTN (n=0) 0 (0.0%) 0 (0.0%) 0 (0.0%) 0 (0.0%) Table 22 presents the results of the chi-square test used to track individual level systolic rates of change from spring 2012 to spring 2013; findings were NOT statistically significant [ 2 (2) =.800; p >.05]. In the spring 2012, of the 9 students in the normal category, 2 showed increased systolic blood pressure, 1 (11.1%) at the Pre-HTN category and 1 (11.1%) at the Stage 1 HTN category. Of the 3 students in Pre-HTN category in 2012, 3 (100%) had improved to the normal category. There were no students in the Stage 1 HTN category in spring of
43 Spring 2012 Diastolic Graph 26: Diastolic Changes for Second Graders Spring Blood Pressure Study Second Graders Diastolic Changes Stage 2:HTN Stage 1:HTN Pre-HTN Normal Spring Spring n=79, Spring 2012; n=12, Spring 2013 TCCHD It's All About Kids Program Report The above graph illustrates the diastolic percentages for second graders. For the spring 2012 semester, 53 (67.1%) students were in the normal category, 15 (19%) students were in the Pre-HTN category, 11 (13.9%) were in the Stage 1 HTN category, and 0 (0.0%) students were in the Stage 2 HTN category. For spring 2013, 10 (83.3%) of all students were in the normal category, 1 (8.3%) was in the Pre-HTN category, 1 (8.3%) was in the Stage 1 HTN category, and 0 (0.0%) were in the Stage 2 HTN category. Table 23: Diastolic Percentages for Second Graders Spring 2013 Diastolic Normal Pre-HTN Stage 1 HTN Stage 2 HTN Normal (n=7) 6(85.7%) 0 (0.0%) 1 (14.3%) 0 (0.0%) Pre-HTN (n=4) 4 (100%) 0 (0.0%) 0 (0.0%) 0 (0.0%) Stage 1 HTN (n=1) 1 (100%) 1 (25%) 3 (75%) 0 (0.0%) Stage 2 HTN (n=0) 0 (0.0%) 0 (0.0%) 0 (0.0%) 0 (0.0%) Table 23 presents the results of the chi-square test used to track individual level diastolic rates of change from spring 2012 to spring 2013; findings were NOT statistically significant [ 2 (2) =.779; p >.05]. In the spring 2012, of the 7 students in the normal category, 1 (14.3%) showed increased diastolic blood pressure at the Stage 1 HTN category. Of the 4 students at the Pre-HTN category in 2012, all 4 (100%) improved to the normal category. The 1 (100%) student in the Stage 1 HTN category in spring of 2012 improved to the normal category. 43
44 Spring 2012 Systolic Graph 27: Systolic Changes for Third Graders Spring Spring Blood Pressure Study Third Graders Systolic Changes Stage 2:HTN Stage 1:HTN Pre-HTN Normal 80.3 Spring n=122, Spring 2012; n=21, Spring 2013 TCCHD It's All About Kids Program Report The above graph illustrates the systolic percentages for third graders. For the spring 2012 semester, 98 (80.3%) students were in the normal category, 12 (9.8%) were in the Pre-HTN category, 12 (9.8%) were in Stage 1 HTN category and 0 (0.0%) were in the Stage 2 HTN category. For spring 2013, 17 (81%) of all students were in the normal category, 1 (4.8%) was in the Pre-HTN category, 3 (14.3%) were in the Stage 1 HTN category, and 0 (0.0%) were in the Stage 2 HTN category. Table 24: Systolic Percentages for Third Graders Spring 2013 Systolic Normal Pre-HTN Stage 1 HTN Stage 2 HTN Normal (n=15) 13 (86.7%) 0 (0.0%) 2 (13.3%) 0 (0.0%) Pre-HTN (n=3) 3 (100%) 0 (0.0%) 0 (0.0%) 0 (0.0%) Stage 1 HTN (n=3) 1 (33.3%) 1 (33.3%) 1 (33.3%) 0 (0.0%) Stage 2 HTN (n=0) 0 (0.0%) 0 (0.0%) 0 (0.0%) 0 (0.0%) Table 24 presents the results of the chi-square test used to track individual level systolic rates of change from spring 2012 to spring 2013; findings were NOT statistically significant [ 2 (4) = 8.235; p >.05]. In the spring 2012, of the 15 students in the normal category, 2 (13.3%) showed increased systolic blood pressure, to the Stage 1 HTN category. Of the 3 students in Pre-HTN category in 2012, 3 (100%) had improved to the normal category. Of the 3 students in the Stage 1 HTN category in spring of 2012, 1 (33.3%) improved to the normal category and 1 (33.3%) improved to the Pre-HTN category. 44
45 Spring 2012 Diastolic Graph 28: Diastolic Changes for Third Graders Spring Spring Blood Pressure Study Third Graders Diastolic Changes Stage 2:HTN Stage 1:HTN Pre-HTN Normal 79.5 Spring n=122, Spring 2012; n=21, Spring 2013 TCCHD It's All About Kids Program Report The above graph illustrates the diastolic percentages for third graders. For the spring 2012 semester, 97 (79.5%) students were in the normal category, 8 (6.6%) students were in the Pre-HTN category, 17 (13.9%) were in the Stage 1 HTN category, and 0 (0.0%) students were in the Stage 2 HTN category. For spring 2013, 17 (81%) of all students were in the normal category, 2 (9.5%) were in the Pre-HTN category, 2 (9.5%) were in the Stage 1 HTN category, and 0 (0.0%) were in the Stage 2 HTN category. Table 25: Diastolic Percentages for Third Graders Spring 2013 Diastolic Normal Pre-HTN Stage 1 HTN Stage 2 HTN Normal (n=15) 13(86.7%) 1 (6.7%) 1 (6.7%) 0 (0.0%) Pre-HTN (n=2) 2 (100%) 0 (0.0%) 0 (0.0%) 0 (0.0%) Stage 1 HTN (n=4) 2 (50%) 1 (25%) 1 (25%) 0 (0.0%) Stage 2 HTN (n=0) 0 (0.0%) 0 (0.0%) 0 (0.0%) 0 (0.0%) Table 25 presents the results of the chi-square test used to track individual level diastolic rates of change from spring 2012 to spring 2013; findings were NOT statistically significant [ 2 (4) =3.274; p >.05]. In the spring 2012, of the 15 students in the normal category, 2 showed increased diastolic blood pressure, 1 (6.7%) at the Pre-HTN category and 1 (6.7%) at the Stage 1 HTN category. Of the 2 students at the Pre-HTN category in 2012, both (100%) improved to the normal category. Of the 4 students at the Stage 1 HTN category, 2 (50%) improved to the normal category by spring of 2013 and 1 (25%) improved to the Pre-HTN category. 45
46 Spring 2012 Systolic Graph 29: Systolic Changes for Fourth Graders Spring Blood Pressure Study Fourth Graders Systolic Changes Spring Stage 2:HTN Stage 1:HTN Pre-HTN Normal Spring n=70, Spring 2012; n=18, Spring 2013 TCCHD It's All About Kids Program Report The above graph illustrates the systolic percentages for fourth graders. For the spring 2012 semester, 48 (68.6%) students were in the normal category, 8 (11.4%) were in the Pre-HTN category, 14 (20%) were in Stage 1 HTN category and 0 (0.0%) were in the Stage 2 HTN category. For spring 2013, 12 (66.7%) of all students were in the normal category, 4 (22.2%) were in the Pre-HTN category, 2 (11.1%) were in the Stage 1 HTN category, and 0 (0.0%) were in the Stage 2 HTN category. Table 26: Systolic Percentages for Fourth Graders Spring 2013 Systolic Normal Pre-HTN Stage 1 HTN Stage 2 HTN Normal (n=13) 10 (76.9%) 1 (7.7%) 2 (15.4%) 0 (0.0%) Pre-HTN (n=2) 1 (50.0%) 1 (50.0%) 0 (0.0%) 0 (0.0%) Stage 1 HTN (n=3) 1 (33.3%) 2 (66.7%) 0 (0.0%) 0 (0.0%) Stage 2 HTN (n=0) 0 (0.0%) 0 (0.0%) 0 (0.0%) 0 (0.0%) Table 26 presents the results of the chi-square test used to track individual level systolic rates of change from spring 2012 to spring 2013; findings were NOT statistically significant [ 2 (4) = 6.154; p >.05]. In the spring 2012, of the 13 students in the normal category, 1 (7.7%) showed increased systolic blood pressure to the Pre-HTN category and 2 (15.4%) increased to the Stage 1 HTN category. Of the 2 students in Pre-HTN category in 2012, 1 (50%) had improved to the normal category. Of the 3 students in the Stage 1 HTN category in spring of 2012, 1 (33.3%) improved to the normal category and 2 (66.7%) improved to the Pre-HTN category. 46
47 Spring 2012 Diastolic Graph 30: Diastolic Changes for Fourth Graders Spring Blood Pressure Study Fourth Graders Diastolic Changes Stage 2:HTN Stage 1:HTN Pre-HTN Normal Spring Spring n=70, Spring 2012; n=18, Spring 2013 TCCHD It's All About Kids Program Report The above graph illustrates the diastolic percentages for fourth graders. For the spring 2012 semester, 54 (77.1%) students were in the normal category, 8 (11.4%) student were in the Pre-HTN category, 8 (11.4%) were in the Stage 1 HTN category, and 0 (0.0%) students were in the Stage 2 HTN category. For spring 2013, 14 (77.8%) of all students were in the normal category, 2 (11.1%) were in the Pre-HTN category, 2 (11.1%) were in the Stage 1 HTN category, and 0 (0.0%) were in the Stage 2 HTN category. Table 27: Diastolic Percentages for Fourth Graders Spring 2013 Diastolic Normal Pre-HTN Stage 1 HTN Stage 2 HTN Normal (n=17) 13(76.5%) 2 (11.8%) 2 (11.8%) 0 (0.0%) Pre-HTN (n=0) 0 (0.0%) 0 (0.0%) 0 (0.0%) 0 (0.0%) Stage 1 HTN (n=1) 1 (100%) 0 (0.0%) 0 (0.0%) 0 (0.0%) Stage 2 HTN (n=0) 0 (0.0%) 0 (0.0%) 0 (0.0%) 0 (0.0%) Table 27 presents the results of the chi-square test used to track individual level diastolic rates of change from spring 2012 to spring 2013; findings were NOT statistically significant [ 2 (2) =.303; p >.05]. In the spring 2012, of the 17 students in the normal category, 4 showed increased diastolic blood pressure, 2 (11.8%) at the Pre-HTN category and 2 (11.8%) at the Stage 1 HTN category. There were no students at the Pre-HTN category in The 1 student at the Stage 1 HTN category in 2012, improved to the normal category (100%) by spring of
48 Spring 2012 Systolic Graph 31: Systolic Changes for Fifth Graders Spring Spring Blood Pressure Study Fifth Graders Systolic Changes Stage 2:HTN Stage 1:HTN Pre-HTN Normal 69.1 Spring n=68, Spring 2012; n=6, Spring 2013 TCCHD It's All About Kids Program Report The above graph illustrates the systolic percentages for fifth graders. For the spring 2012 semester, 47 (69.1%) students were in the normal category, 12 (17.6%) were in the Pre-HTN category, 9 (13.2%) were in Stage 1 HTN category and 0 (0.0%) were in the Stage 2 HTN category. For spring 2013, 6 (100%) of all students were in the normal category, 0 (0.0%) were in the Pre-HTN category, 0 (0.0%) were in the Stage 1 HTN category, and 0 (0.0%) were in the Stage 2 HTN category. Table 28: Systolic Percentages for Fifth Graders Spring 2013 Systolic Normal Pre-HTN Stage 1 HTN Stage 2 HTN Normal (n=3) 3(100%) 0 (0.0%) 0 (0.0%) 0 (0.0%) Pre-HTN (n=3) 3(100%) 0 (0.0%) 0 (0.0%) 0 (0.0%) Stage 1 HTN (n=0) 0 (0.0%) 0 (0.0%) 0 (0.0%) 0 (0.0%) Stage 2 HTN (n=0) 0 (0.0%) 0 (0.0%) 0 (0.0%) 0 (0.0%) Table 28 presents the results of the chi-square test used to track individual level systolic rates of change from spring 2012 to spring 2013; findings were NOT able to be computed. In the spring 2012, of the 3 students in the normal category, 100% remained in the normal category. Of the 3 students in Pre-HTN category in 2012, 3 (100%) had improved to the normal category. There were no students in the Stage 1 HTN category or Stage 2 HTN category in spring of
49 Spring 2012 Diastolic Graph 32: Diastolic Changes for Fifth Graders Spring Spring Blood Pressure Study Fifth Graders Diastolic Changes Stage 2:HTN Stage 1:HTN Pre-HTN Normal 80.9 Spring n=68, Spring 2012; n=6, Spring 2013 TCCHD It's All About Kids Program Report The above graph illustrates the diastolic percentages for fifth graders. For the spring 2012 semester, 55 (80.9%) students were in the normal category, 9 (13.2%) students were in the Pre-HTN category, 4 (5.9%) were in the Stage 1 HTN category, and 0 (0.0%) students were in the Stage 2 HTN category. For spring 2013, 6 (100%) of all students were in the normal category, 0 (0.0%) were in the Pre-HTN category, 0 (0.0%) were in the Stage 1 HTN category, and 0 (0.0%) were in the Stage 2 HTN category. Table 29: Diastolic Percentages for Fifth Graders Spring 2013 Diastolic Normal Pre-HTN Stage 1 HTN Stage 2 HTN Normal (n=6) 6 (100%) 2 (11.8%) 2 (11.8%) 0 (0.0%) Pre-HTN (n=0) 0 (0.0%) 0 (0.0%) 0 (0.0%) 0 (0.0%) Stage 1 HTN (n=0) 0 (0.0%) 0 (0.0%) 0 (0.0%) 0 (0.0%) Stage 2 HTN (n=0) 0 (0.0%) 0 (0.0%) 0 (0.0%) 0 (0.0%) Table 29 presents the results of the chi-square test used to track individual level diastolic rates of change from spring 2012 to spring 2013; the chi score was not able to be computed. In the spring 2012, of the 6 students in the normal category, 100% remained in the Normal category. There were no students in the Pre-HTN, Stage 1 HTN or Stage 2 HTN categories for spring of

50 BMI and BP Comparisons Spring 2012 Spring
51 Graph 33: Overall Spring 2012 BMI and Systolic Blood Pressure Data Body Mass Index Study Overall Spring 2012 BMI and Systolic Blood Pressure Normal Pre-HTN Stage 1 HTN Stage 2 HTN Obese Overweight Healthy Underweight n=451, Spring 2012 Data TCCHD It's All About Kids Program Report Graph 25 illustrates the BMI and systolic blood pressure of all students for spring Findings were NOT statistically significant [ 2 (6) = ; p >.05]. Of those who had underweight BMI scores, 10 (90.9%) fell in the normal BP category and 1 (9.1%) fell into the Stage 1 HTN category. Of those who had healthy BMI scores, 192 (81.4%) fell into the normal BP category, 21 (8.9%) fell in the category for Pre-HTN BP, and 23 (9.7%) fell in the Stage 1HTN category. In regard to overweight participants, 64 (74.4%) fell into the normal BP category, 10 (11.6%) fell in the category for Pre-HTN BP, and 12 (14%) fell into the Stage 1 HTN category. Of the obese BMI scores, 80 (67.8%) fell into the normal BP category, 16 (13.6%) fell in the Pre-HTN BP category, and 22 (18.6%) fell into the Stage 1 HTN category. There were no individuals who fell in the Stage 2 HTN category. 51
52 Graph 34: Overall Spring 2012 BMI and Diastolic Blood Pressure Data Body Mass Index Study Overall Spring 2012 BMI and Diastolic Blood Pressure Normal Pre-HTN Stage 1 HTN Stage 2 HTN Obese Overweight Healthy Underweight n=451, Spring 2012 Data TCCHD It's All About Kids Program Report The above graph illustrates the BMI and diastolic blood pressure of all students for Spring Findings were NOT statistically significant [ 2 (6) = 8.339; p >.05]. Of those who had underweight BMI scores, 11 (100%) were in the normal BP category. Of those who had healthy BMI scores, 177 (75%) were in the normal BP category, 30 (12.7%) fell into the Pre-HTN BP category, and 29 (12.3%) fell into the Stage 1 HTN category. In regard to overweight participants, 59 (68.6%) fell into the normal BP category, 14 (16.3%) fell into the Pre-HTN BP category, and 13 (15.1%) fell into the Stage 1 HTN category. Of the obese BMI scores, 91 (77.1%) fell into the normal BP category, 9 (7.6%) fell into the Pre-HTN BP category, and 18 (15.3%) fell into the Stage 1 HTN category. There were no individuals who fell into the category of Stage 2 HTN. 52
53 Graph 35: Overall Spring 2013 BMI and Systolic Blood Pressure Data Body Mass Index Study Overall Spring 2013 BMI and Systolic Blood Pressure Normal Pre-HTN Stage 1 HTN Stage 2 HTN Obese Overweight Healthy Underweight n=198, Spring 2013 Data TCCHD It's All About Kids Program Report The above graph illustrates the BMI and systolic blood pressure of all students in spring Findings were NOT statistically significant [χ2 (6) = 5.209; p >.05]. Of those who had underweight BMI scores, 1 (50%) fell into the normal BP range and 1 (50%) fell into Stage 1 HTN categories. Of the healthy BMI scores, 83 (78.3%) fell in the category of a normal BP, 12 (11.3%) fell in the category of Pre-HTN BP and 11 (10.4%) fell in the category of Stage 1 HTN. In regard to overweight participants, 30 (75%) had a normal BP, 5 (12.5%) fell in the Pre-HTN BP category, and 5 (12.5%) fell in the range for Stage 1 HTN. Of the obese BMI scores, 34 (68%) fell into the range for a normal BP, 6 (12%) fell in the Pre-HTN BP, and 10 (20%) fell in the Stage 1 HTN category. There were no individuals who fell in the Stage 2 HTN category. 53
54 Graph 36: Overall 2013 BMI and Diastolic Blood Pressure Data Body Mass Index Study Overall Spring 2013 BMI and Diastolic Blood Pressure Normal Pre-HTN Stage 1 HTN Stage 2 HTN Obese Overweight Healthy Underweight n=198, Spring 2013 Data TCCHD It's All About Kids Program Report Graph 36 illustrates the BMI and diastolic blood pressure of all students for spring Findings were NOT statistically significant [χ2 (6) = 3.174; p >.05]. Of those who had underweight BMI scores, 2 (100%) fell into the normal BP category. Of the healthy BMI scores, 83 (78.3%) fell into the normal BP category, 11 (10.4%) were in the Pre-HTN category and 12 (11.3%) fell into the Stage 1 HTN category. In regard to overweight participants, 29 (72.5%) fell into the normal BP category, 5 (12.5%) fell in the category for Pre-HTN BP, and 6 (15%) fell into the Stage 1 HTN category. Of the obese BMI scores, 34 (68%) fell into the normal BP category, 6 (12%) fell in the Pre-HTN BP category, and 10 (20%) fell into the Stage 1 HTN category. There were no individuals who fell in the Stage 2 HTN category. 54
55 References Center for Disease Control and Prevention. (2007a). About BMI for children and teens. Retrieved January 16, 2012 from bmi/childrens_bmi/childrens_bmi_formula.htm. Center for Disease Control and Prevention. (2007b). Standard formulas. Retrieved January 16, 2012 from about_childrens_bmi.htm Center for Disease Control and Prevention. (2007c). Clinical growth charts. Retrieved August 26, 2013 from National Heart Lung and Blood Institute. (2008). Blood pressure levels for boys and girls by age and height percentile. US Department of Health and Human Services. (2007). A pocket guide to blood pressure measurement in children. National Institutes of Health. 55

56 It s All About Kids Oral Health Program 56
57 It s All About Kids Oral Health Program Purpose of Study According to TCCHD, the Oral Health program provides instruction about caring for teeth to fourth grade students. The goals are to provide an understanding of the causes and prevention of tooth decay and gum disease, and instruct on proper tooth brushing and dental flossing. The two-session course was implemented in 25 schools. Methodology The Oral Health program measure included a pre- and post-assessment that was developed by TCCHD personnel. The survey consisted of 6 questions in a multiple choice-type response format. Questions dealt with brushing one s teeth, dental plaque, cavities, toothbrushes, fluoride, and dental floss. Measurements were obtained by TCCHD personnel. A total of 702 students participated in the program Descriptive statistics are reported for the number of participants by school. In addition, a t-test analysis was used to examine differences in pre- and post-tests. Results The following graphs depict the results of the Oral Health program scores. 57
58 Graph 37: Oral Health Program Participants by School Oral Health Program Number of Participants by School Wolf Creek William Penn Roy Clark Peace Academy Oakcrest Moore Mills McAuliffe Limestone Liberty Mounds Jefferson Jarman Indian Springs Highland Park Garfield Darnaby Cedar Ridge Bixby North Intermediate Bixby North Bailey Arrowhead Anderson n=702 TCCHD It's All About Kids Program Report The graph above depicts the number of participating students in each school for the Oral Health program. A total of 702 students participated from 25 schools. 58
59 Graph 38: Oral Health Program Pre- and Post-Test Results Oral Health Program Mean Scores for Oral Health Program Test Post-test 5.1 Pre-test n=702, Level of Significance: p <.001 TCCHD It's All About Kids Program Report A t-test analysis was computed to examine differences in mean scores. As the above graph illustrates, there is a statistically significant difference in pre- and post-test scores. Oral health scores increased from 4.0 to 5.1 [t (700) = ; p <.001]. These findings suggest that students knowledge of oral health increased from the pre- to the post-test. 59
60 Discussion The Oral Health program was designed to track differences in pre- and post-test scores. T-test results indicate a significant difference between the pre- and post-test. These findings suggest an increase in students knowledge of oral health. The Oral Health program test is available in Appendix F. 60

61 It s All About Kids Nutrition Detectives 61
62 It s All About Kids Nutrition Detectives Purpose of Study According to TCCHD, Nutrition Detectives was developed by David Katz, MD, MPH, FACPM, FACP, Director of the Yale Prevention Research Center and Catherine Katz, PhD. The program teaches students 5 clues to healthy eating and making healthy choices. Students learn how to read food labels and how to choose foods that are more nutritious. By the end of the program students have become Nutrition Detectives and earn their badge. The objectives of the program are to: 1) teach students to make healthful choices and detect marketing deceptions 2) give students the opportunity to practice what they have learned 3) empower students to share their detective skills with other family members. The two-session course was implemented in four schools. Methodology The Nutrition Detectives program measure included a pre- and post-assessment that was developed by TCCHD personnel. The survey consisted of 10 questions comparing nutrition labels, asking the student to choose the healthier label. Measurements were obtained by TCCHD personnel. A total of 307 students participated in the program from four schools. Descriptive statistics are reported for the number of participants by school. In addition, a t-test analysis was used to examine differences in pre- and post-tests. Results The following graphs depict the results of the Nutrition Detective program scores. 62
63 Graph 39: Nutrition Detective Program Participants by Grade Nutrition Detectives Number of Participants by School Northwoods 79 Limestone 73 Hawthorne 91 Garfield n=306 TCCHD It's All About Kids Program Report The graph above depicts the number of participating students in each school for the Nutrition program. A total of 306 students participated. 63
64 Graph 40: Nutrition Detective Program Pre- and Post-Test Results Nutrition Detectives Mean Scores for Nutrition Detective Test Post-test 7.1 Pre-test n=306, Level of Significance: p <.001 TCCHD It's All About Kids Program Report A t-test analysis was computed to examine differences in mean scores. As the above graph illustrates, there is a statistically significant difference in pre- and post-test scores. Nutrition scores increased from 4.6 to 7.1 [t (305) = ; p <.001]. These findings suggest that students knowledge of nutrition increased from the pre- to the post-test. 64
65 Graph 41: Nutrition Detective Program Pre- and Post-Test Results by School Nutrition Detectives Pre- and Post-Test Results by School Post-Test, 5.38 Northwoods Pre-Test, 3.32 Post-Test, 7.12 Limestone Hawthorne Garfield Pre-Test, 4.86 Pre-Test, 5.09 Pre-Test, 5.19 Post-Test, 7.51 Post-Test, n=302, Level of Significance: p <.001 TCCHD It's All About Kids Program Report A t-test analysis was computed to examine differences in mean scores. As the above graph illustrates, there is a statistically significant difference in pre- and post-test scores. Nutrition scores increased from 5.2 to 7.1 [t (62) = ; p <.001] for Garfield Elementary. The scores also increased for Hawthorne Elementary from 5.1 to 8.3 [t (90) = ; p <.001]. In addition, test scores increased for Limestone and Northwoods. Limestone s results moved from 4.9 to 7.1 [t (72) = ; p <.001] and Northwoods changed from 3.3 to 5.4 [t (78) = ; p <.001]. These findings suggest that students knowledge of nutrition increased from the pre- to the post-test at each of the schools. 65
66 Graph 42: Nutrition Detective Program Pre- and Post-Test Results by Grade Nutrition Detectives Pre- and Post-Test Results by Grade Post-Test, 8.27 Missing Grade Pre-Test, 5.08 Post-Test, 5.8 2nd Grade Pre-Test, 3.69 Post-Test, 7.5 4th Grade Pre-Test, n=302, Level of Significance: p <.001 TCCHD It's All About Kids Program Report A t-test analysis was computed to examine differences in mean scores. As the above graph illustrates, there is a statistically significant difference in pre- and post-test scores. The missing grade Nutrition scores increased from 5.0 to 8.3 [t (90) = ; p <.001]. The 2nd grade Nutrition test scores increased from 3.7 to 5.8 [t (114) = ; p <.001]. The 4th grade Nutrition test scores also increased from 5.2 to 7.5 [t (99) = ; p <.001]. Differences in test scores for all three grades were statistically significant. 66
67 Discussion The Nutrition Detective program was designed to track differences in pre- and post-test scores. T-test results indicate a significant difference between the pre- and post-test. These findings suggest an increase in students knowledge of nutrition. The Nutrition Detective program test is available in Appendix G. 67

68 Appendix A It s All About Kids List of Schools 68
69 It s All About Kids Schools Bixby Broken Arrow Liberty Mounds Owasso Peace Academy Sand Springs Tulsa Comprehensive Sites Bixby Central Intermediate Bixby North Intermediate Arrowhead Country Lane Highland Park Indian Springs Liberty Oak Crest Leisure Park Wolf Creek Liberty Mounds Bailey Mills Northeast Owasso Peace Academy Garfield Limestone Technology Academy Northwoods Fine Arts Academy Celia Clinton Hawthorne Marshall Sequoyah William Penn Andersen Boevers Briarglen Darnaby Jarman Jefferson Christa McAuliffe Moore Roy Clark Rosa Parks 69

70 Appendix B It s All About Kids Center for Disease Control BMI Charts 70
71 71
72 72

73 Appendix C It s All About Kids Blood Pressure Levels by Age and Height Percentile 73
74 74
75 75
76 76
77 77

78 Appendix D It s All About Kids Guide to Blood Pressure Measurement in Children 78
79 79
80 80
81 81
82 82

83 Appendix E It s All About Kids CATCH Nutrition Test 83
84 84
85 85
86 86
87 87
88 88
89 89
90 90
91 91
92 92
93 93
94 94
95 95
96 96
97 97
98 98


99 Appendix F It s All About Kids Oral Health Program Test 99
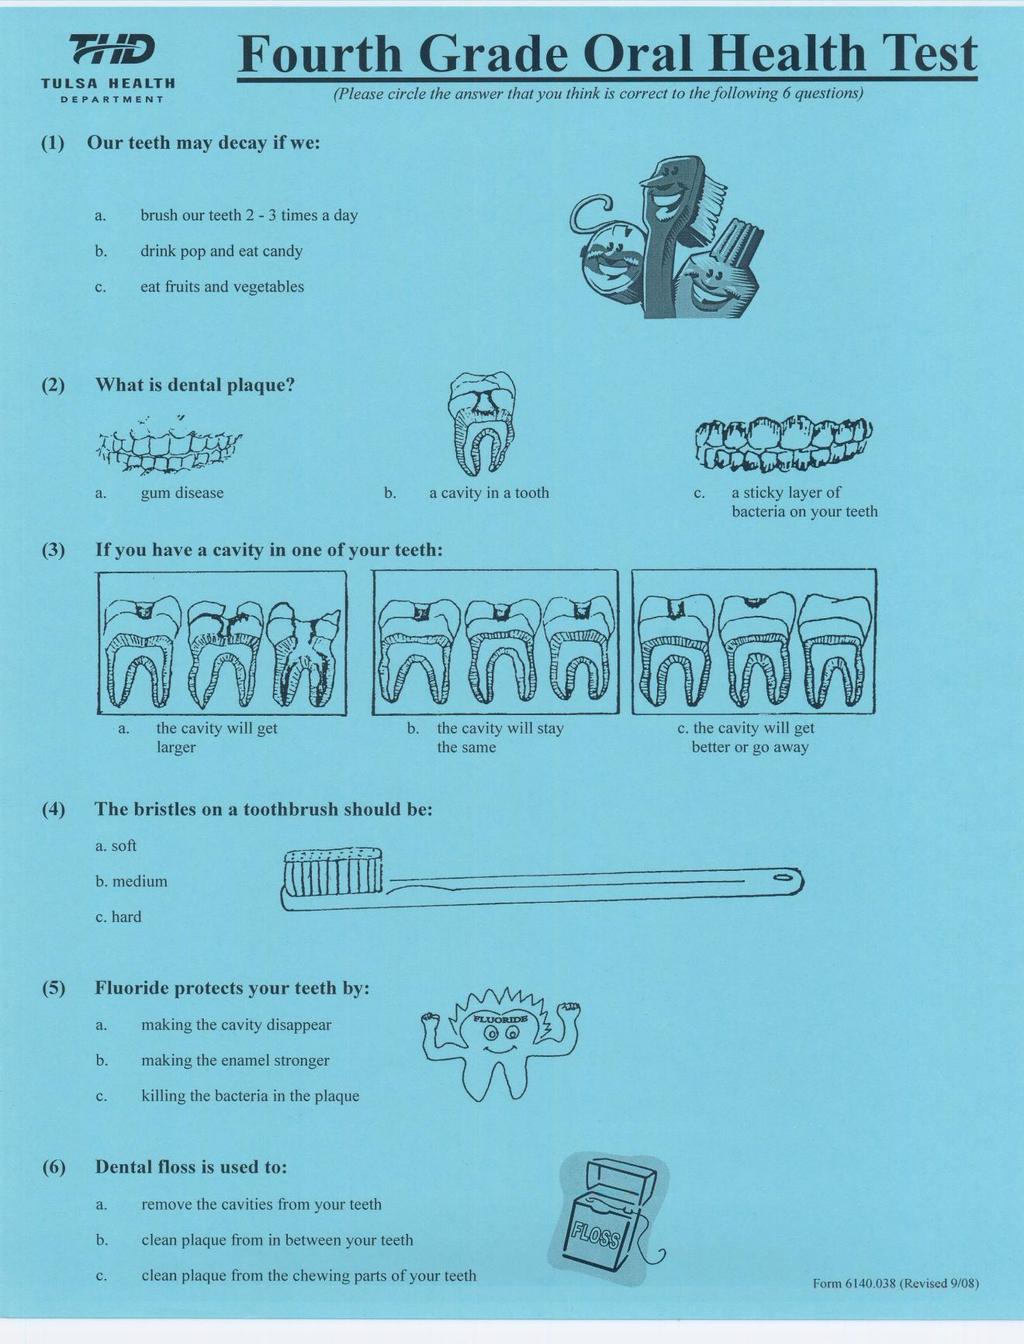
100 100

101 Appendix G It s All About Kids Nutrition Detectives Test 101
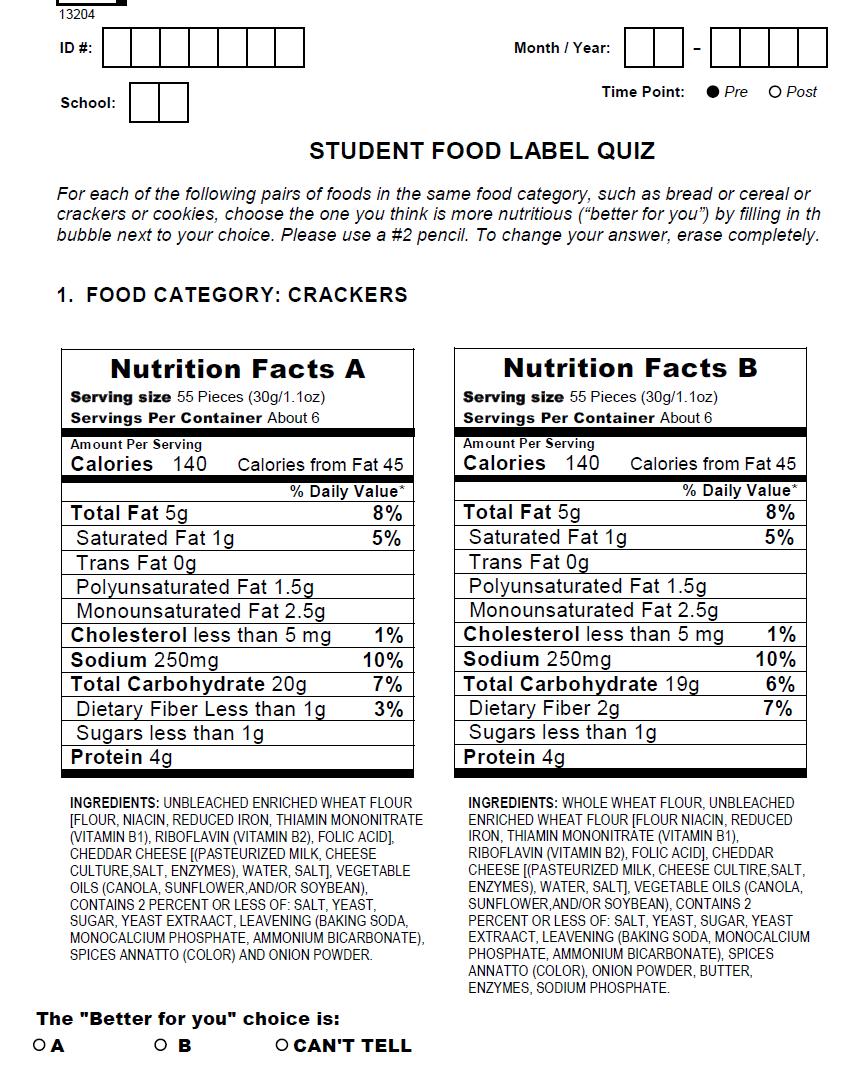
102 102
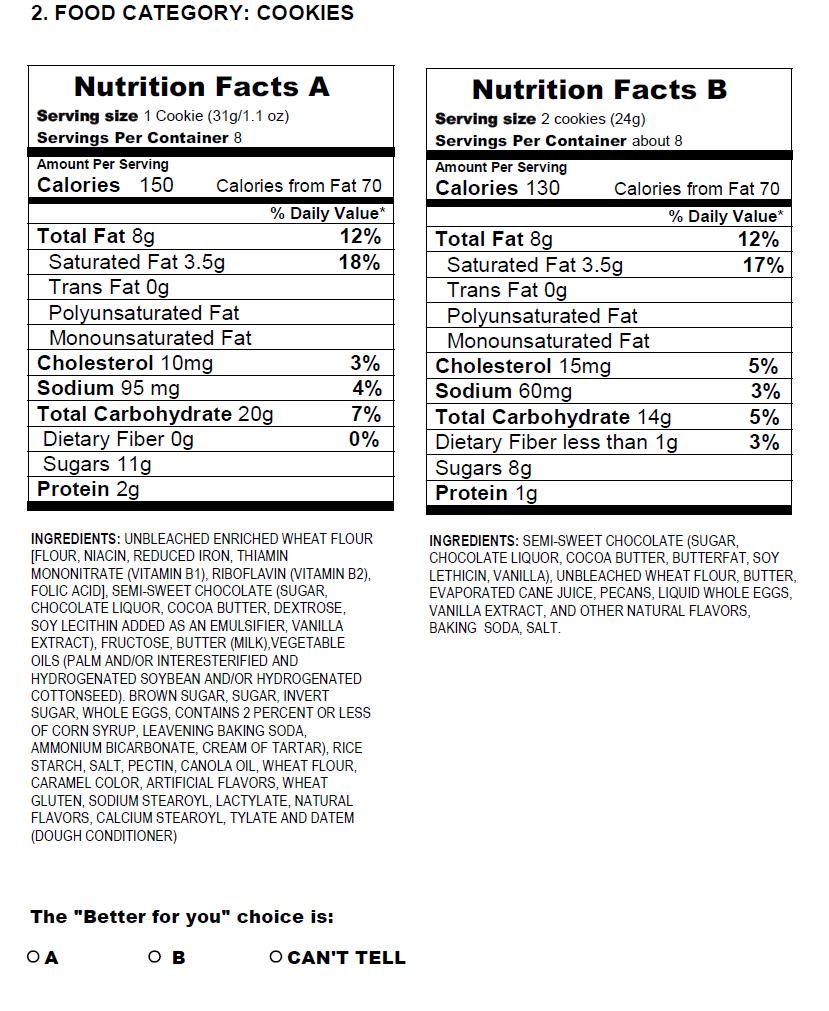
103 103
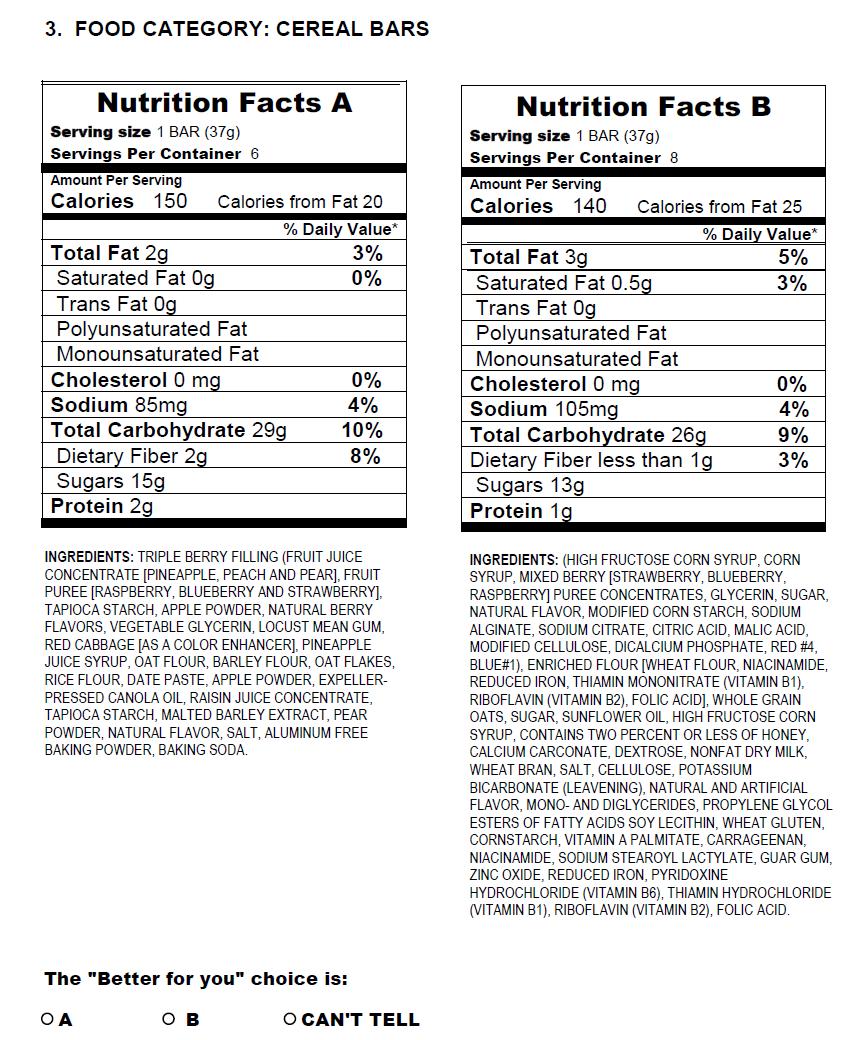
104 104
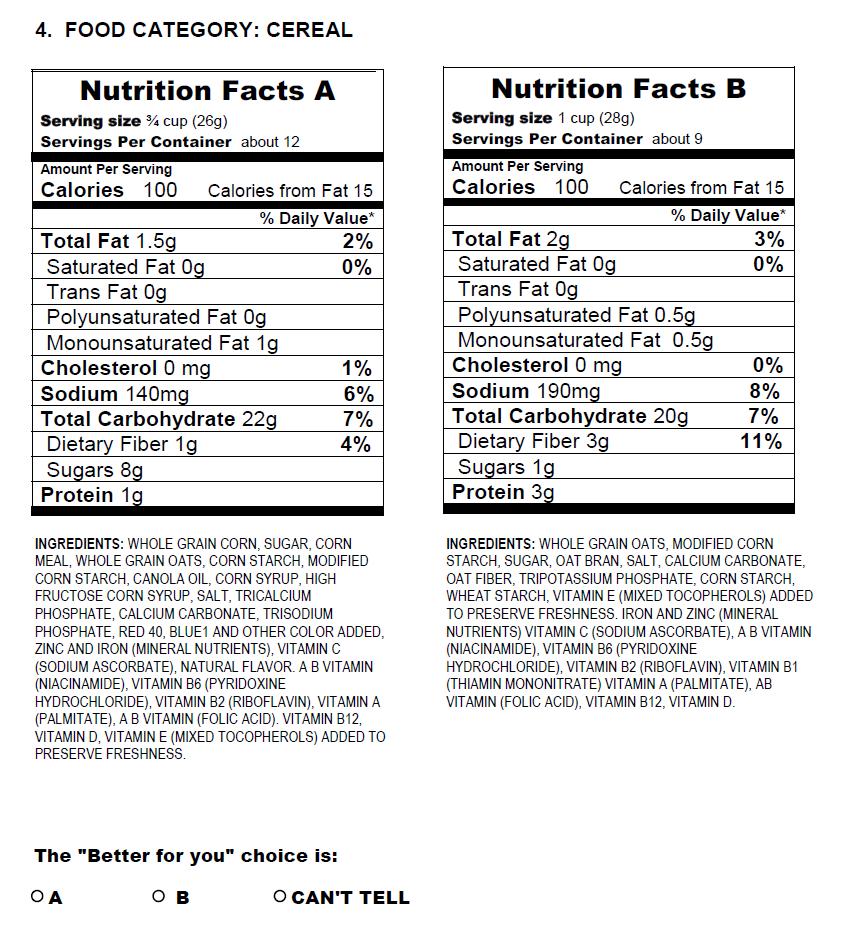
105 105
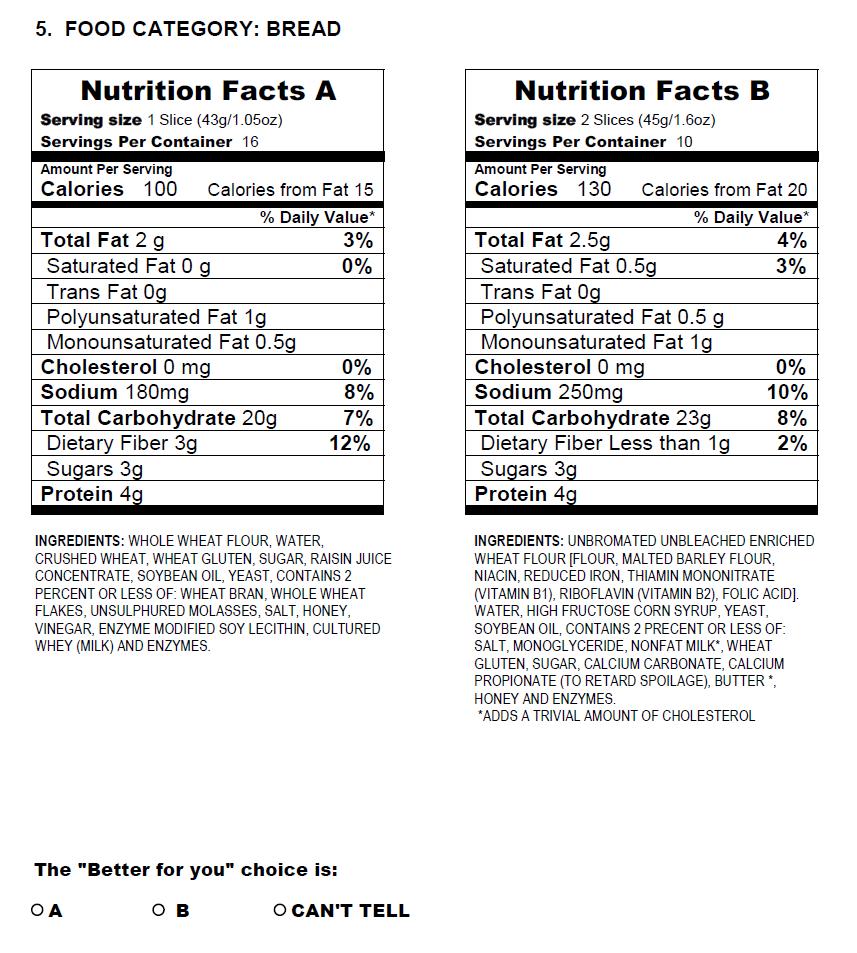
106 106
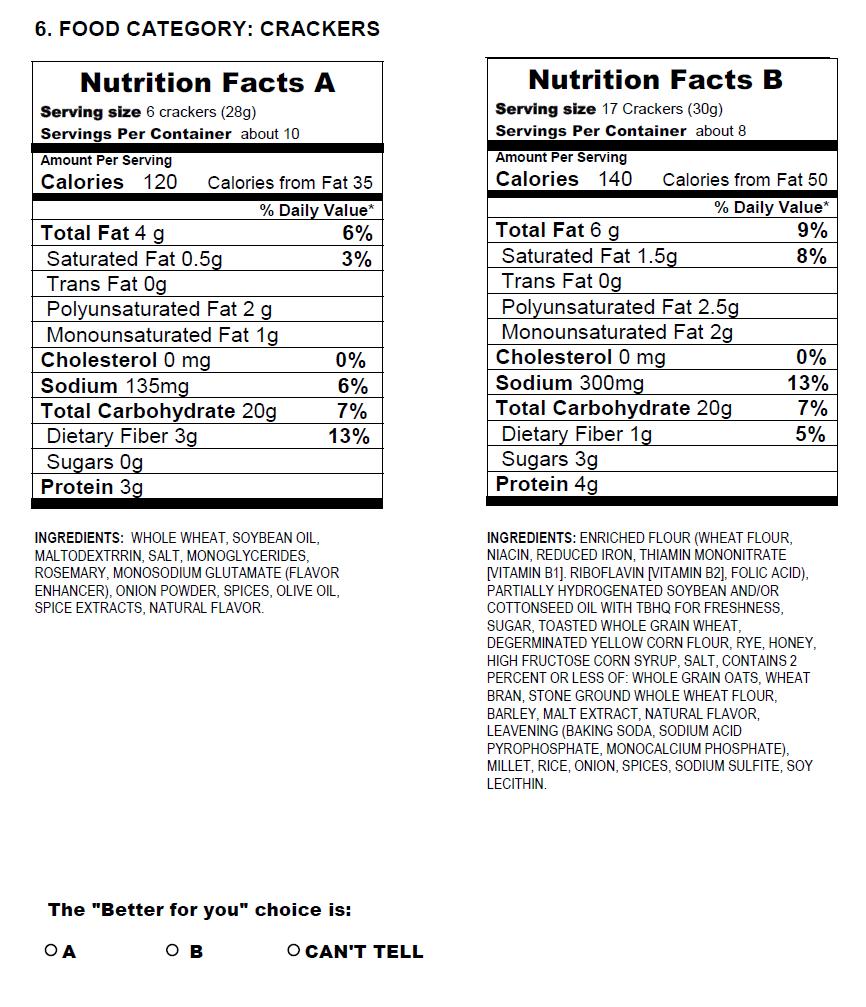
107 107
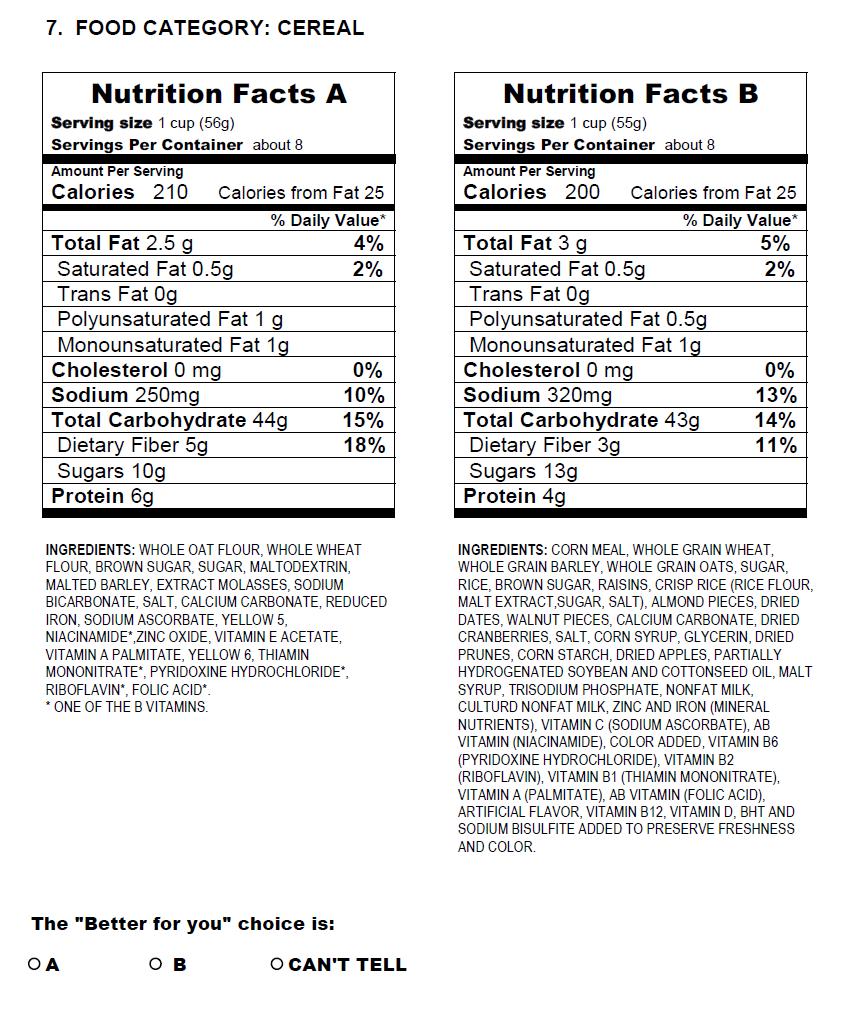
108 108
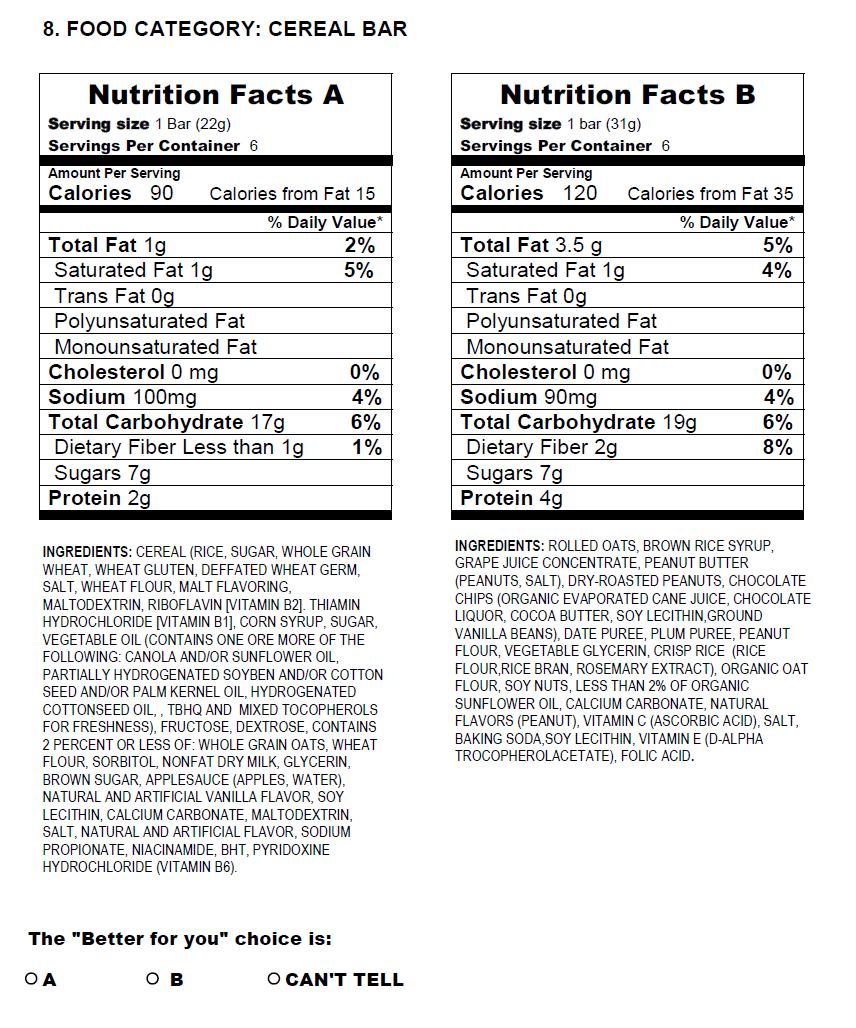
109 109
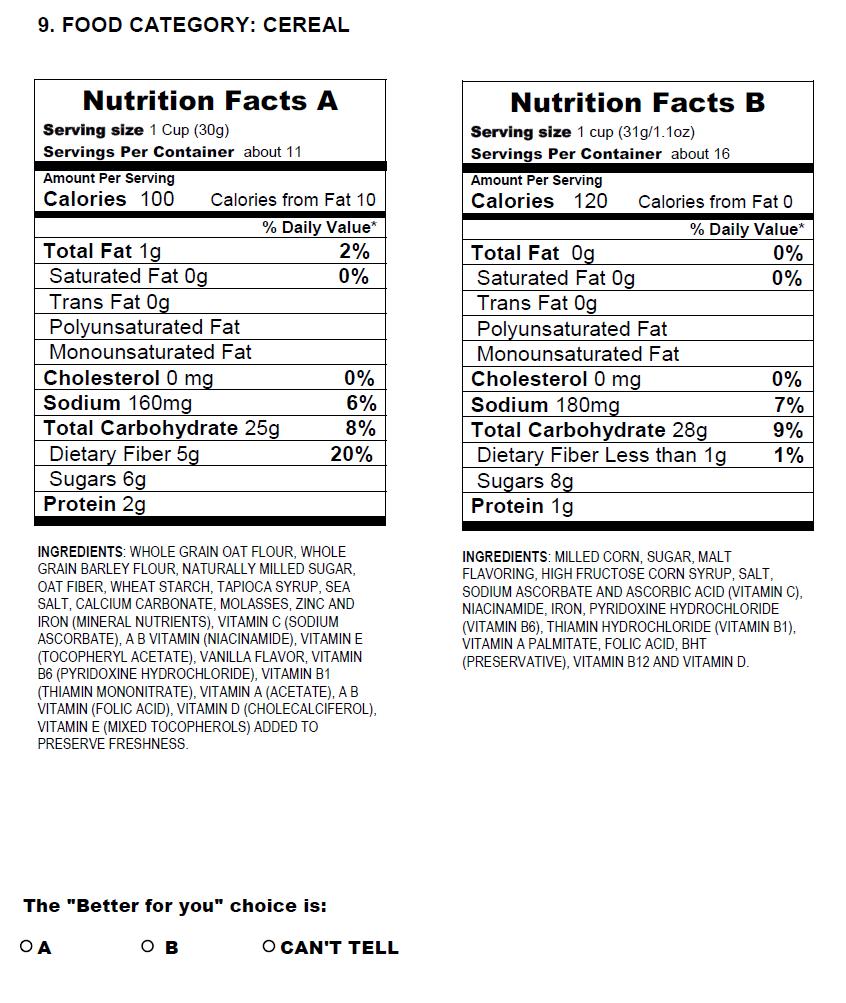
110 110
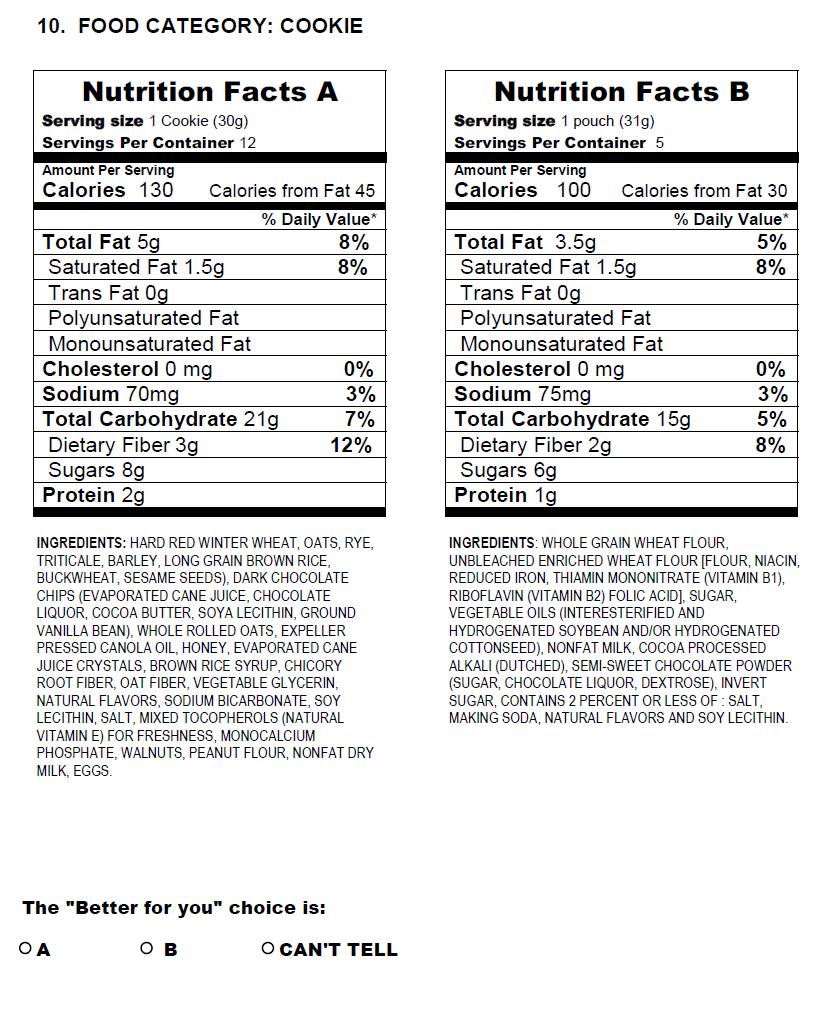
111 111
EDEXCEL FUNCTIONAL SKILLS PILOT TEACHER S NOTES. Maths Level 2. Chapter 4. Working with measures
 EDEXCEL FUNCTIONAL SKILLS PILOT TEACHER S NOTES Maths Level 2 Chapter 4 Working with measures SECTION G 1 Time 2 Temperature 3 Length 4 Weight 5 Capacity 6 Conversion between metric units 7 Conversion
Risk factors in an ageing population: Evidence from SAGE
 Risk factors in an ageing population: Evidence from SAGE Ruy López Ridaura, Rosalba Rojas: National Institute of Public Health, Mexico Center of Research in Population Health. Nirmala Naidoo: Department
Wellness Committee Action Plan. Developed in compliance with the Child Nutrition and Women, Infant and Child (WIC) Reauthorization Act of 2004
 Reauthorization Act of 2004") Wellness Committee Action Plan Developed in compliance with the Child Nutrition and Women, Infant and Child (WIC) Reauthorization Act of 2004 PREAMBLE Overweight children and adolescents have become a
Wellness Committee Action Plan Developed in compliance with the Child Nutrition and Women, Infant and Child (WIC) Reauthorization Act of 2004 PREAMBLE Overweight children and adolescents have become a
Process Evaluations for a Multisite Nutrition Education Program
 Process Evaluations for a Multisite Nutrition Education Program Paul Branscum 1 and Gail Kaye 2 1 The University of Oklahoma 2 The Ohio State University Abstract Process evaluations are an often-overlooked
Global School-based Student Health Survey. UNRWA Global School based Student Health Survey (GSHS)
") UNRWA Global School based Student Health Survey (GSHS) 21 UNRWA school Health services ü New entrant's medical examination ü Screening: for vision and hearing impairment, for thyroid enlargement and for
UNRWA Global School based Student Health Survey (GSHS) 21 UNRWA school Health services ü New entrant's medical examination ü Screening: for vision and hearing impairment, for thyroid enlargement and for
OVERVIEW OF CURRICULUM-BASED MEASUREMENT AS A GENERAL OUTCOME MEASURE
 OVERVIEW OF CURRICULUM-BASED MEASUREMENT AS A GENERAL OUTCOME MEASURE Mark R. Shinn, Ph.D. Michelle M. Shinn, Ph.D. Formative Evaluation to Inform Teaching Summative Assessment: Culmination measure. Mastery
ScienceDirect. A Framework for Clustering Cardiac Patient s Records Using Unsupervised Learning Techniques
 Available online at www.sciencedirect.com ScienceDirect Procedia Computer Science 98 (2016 ) 368 373 The 6th International Conference on Current and Future Trends of Information and Communication Technologies
Person Centered Positive Behavior Support Plan (PC PBS) Report Scoring Criteria & Checklist (Rev ) P. 1 of 8
 Report Scoring Criteria & Checklist (Rev ) P. 1 of 8") Scoring Criteria & Checklist (Rev. 3 5 07) P. 1 of 8 Name: Case Name: Case #: Rater: Date: Critical Features Note: The plan needs to meet all of the critical features listed below, and needs to obtain
Scoring Criteria & Checklist (Rev. 3 5 07) P. 1 of 8 Name: Case Name: Case #: Rater: Date: Critical Features Note: The plan needs to meet all of the critical features listed below, and needs to obtain
4.0 CAPACITY AND UTILIZATION
 4.0 CAPACITY AND UTILIZATION The capacity of a school building is driven by four main factors: (1) the physical size of the instructional spaces, (2) the class size limits, (3) the schedule of uses, and
THE PENNSYLVANIA STATE UNIVERSITY SCHREYER HONORS COLLEGE DEPARTMENT OF MATHEMATICS ASSESSING THE EFFECTIVENESS OF MULTIPLE CHOICE MATH TESTS
 THE PENNSYLVANIA STATE UNIVERSITY SCHREYER HONORS COLLEGE DEPARTMENT OF MATHEMATICS ASSESSING THE EFFECTIVENESS OF MULTIPLE CHOICE MATH TESTS ELIZABETH ANNE SOMERS Spring 2011 A thesis submitted in partial
Health Literacy and Teach-Back: Patient-Centered Communication. Copyright 2011 NewYork-Presbyterian Hospital
 Health Literacy and Teach-Back: Patient-Centered Communication Webinar Logistics: All attendees will be automatically muted and in listen-only mode for the duration of the presentation Participation is
learning collegiate assessment]
![learning collegiate assessment]](/thumbs/71/66063392.jpg "learning collegiate assessment]") [ collegiate learning assessment] INSTITUTIONAL REPORT 2005 2006 Kalamazoo College council for aid to education 215 lexington avenue floor 21 new york new york 10016-6023 p 212.217.0700 f 212.661.9766
[ collegiate learning assessment] INSTITUTIONAL REPORT 2005 2006 Kalamazoo College council for aid to education 215 lexington avenue floor 21 new york new york 10016-6023 p 212.217.0700 f 212.661.9766
Effective Recruitment and Retention Strategies for Underrepresented Minority Students: Perspectives from Dental Students
 Critical Issues in Dental Education Effective Recruitment and Retention Strategies for Underrepresented Minority Students: Perspectives from Dental Students Naty Lopez, Ph.D.; Rose Wadenya, D.M.D., M.S.;
Proficiency Illusion
 KINGSBURY RESEARCH CENTER Proficiency Illusion Deborah Adkins, MS 1 Partnering to Help All Kids Learn NWEA.org 503.624.1951 121 NW Everett St., Portland, OR 97209 Executive Summary At the heart of the
Grade 8: Module 4: Unit 1: Lesson 11 Evaluating an Argument: The Joy of Hunting
 Grade 8: Module 4: Unit 1: Lesson 11 Evaluating an Argument: The Joy of Hunting This work is licensed under a Creative Commons Attribution-NonCommercial-ShareAlike 3.0 Unported License. Exempt third-party
Cooking Matters at the Store Evaluation: Executive Summary
 Cooking Matters at the Store Evaluation: Executive Summary Introduction Share Our Strength is a national nonprofit with the goal of ending childhood hunger in America by connecting children with the nutritious
School Health Survey, Texas Education Agency
 1. School Health Survey, Texas Education Agency This survey must be completed ONLINE ONLY and ONLY ONCE by EACH SCHOOL DISTRICT (not campus) AND CHARTER SCHOOL. Your responses should reflect the academic
Earl of March SS Physical and Health Education Grade 11 Summative Project (15%)
") Earl of March SS Physical and Health Education Grade 11 Summative Project (15%) Student Name: PPL 3OQ/P - Summative Project (8%) Task 1 - Time and Stress Management Assignment Objective: To understand,
Earl of March SS Physical and Health Education Grade 11 Summative Project (15%) Student Name: PPL 3OQ/P - Summative Project (8%) Task 1 - Time and Stress Management Assignment Objective: To understand,
Welcome to ACT Brain Boot Camp
 Welcome to ACT Brain Boot Camp 9:30 am - 9:45 am Basics (in every room) 9:45 am - 10:15 am Breakout Session #1 ACT Math: Adame ACT Science: Moreno ACT Reading: Campbell ACT English: Lee 10:20 am - 10:50
Introduction to Questionnaire Design
 Introduction to Questionnaire Design Why this seminar is necessary! Bad questions are everywhere! Don t let them happen to you! Fall 2012 Seminar Series University of Illinois www.srl.uic.edu The first
Can Money Buy Happiness? EPISODE # 605
 Can Money Buy Happiness? EPISODE # 605 LESSON LEVEL Grades 6-8 KEY TOPICS Community Entrepreneurship Social responsibility LEARNING OBJECTIVES 1. Recognize a need in your community. 2. Learn how to come
STT 231 Test 1. Fill in the Letter of Your Choice to Each Question in the Scantron. Each question is worth 2 point.
 STT 231 Test 1 Fill in the Letter of Your Choice to Each Question in the Scantron. Each question is worth 2 point. 1. A professor has kept records on grades that students have earned in his class. If he
Segmentation Study of Tulsa Area Higher Education Needs Ages 36+ March Prepared for: Conducted by:
 Segmentation Study of Tulsa Area Higher Education Needs Ages 36+ March 2004 * * * Prepared for: Tulsa Community College Tulsa, OK * * * Conducted by: Render, vanderslice & Associates Tulsa, Oklahoma Project
R ESEARCH A RTICLE ABSTRACT
 R ESEARCH A RTICLE Is There a Relationship Between Physical Fitness and Academic Achievement? Positive Results From Public School Children in the Northeastern United States VIRGINIA R. CHOMITZ, PhD a MEGHAN
Evaluation of Teach For America:
 EA15-536-2 Evaluation of Teach For America: 2014-2015 Department of Evaluation and Assessment Mike Miles Superintendent of Schools This page is intentionally left blank. ii Evaluation of Teach For America:
Financing Education In Minnesota
 Financing Education In Minnesota 2016-2017 Created with Tagul.com A Publication of the Minnesota House of Representatives Fiscal Analysis Department August 2016 Financing Education in Minnesota 2016-17
NCEO Technical Report 27
 Home About Publications Special Topics Presentations State Policies Accommodations Bibliography Teleconferences Tools Related Sites Interpreting Trends in the Performance of Special Education Students
NUTRITIONAL SCIENCE (H SCI)
") Nutritional Science (H SCI) 1 NUTRITIONAL SCIENCE (H SCI) Nutritional science looks at the connection between diet and health. Students learn how diet can play a crucial role in the cause, treatment, and
Nutritional Science (H SCI) 1 NUTRITIONAL SCIENCE (H SCI) Nutritional science looks at the connection between diet and health. Students learn how diet can play a crucial role in the cause, treatment, and
Science Fair Rules and Requirements
 Science Fair Rules and Requirements Dear Parents, Soon your child will take part in an exciting school event a science fair. At Forest Park, we believe that this annual event offers our students a rich
Second Step Suite and the Whole School, Whole Community, Whole Child (WSCC) Model
 Model") Second Step Suite and the Whole School, Whole Community, Whole Child (WSCC) Model suite The Second Step Suite and the WSCC model share the common goals of supporting the safety, well-being, and success
Second Step Suite and the Whole School, Whole Community, Whole Child (WSCC) Model suite The Second Step Suite and the WSCC model share the common goals of supporting the safety, well-being, and success
The New York City Department of Education. Grade 5 Mathematics Benchmark Assessment. Teacher Guide Spring 2013
 The New York City Department of Education Grade 5 Mathematics Benchmark Assessment Teacher Guide Spring 2013 February 11 March 19, 2013 2704324 Table of Contents Test Design and Instructional Purpose...
NUTRITIONAL SCIENCE (AGLS)
") Nutritional Science (AGLS) 1 NUTRITIONAL SCIENCE (AGLS) Nutritional science looks at the connection between diet and health. Students learn how diet can play a crucial role in the cause, treatment, and
Nutritional Science (AGLS) 1 NUTRITIONAL SCIENCE (AGLS) Nutritional science looks at the connection between diet and health. Students learn how diet can play a crucial role in the cause, treatment, and
School Health Survey, Texas Education Agency
 1. 2010-2011 School Health Survey, Texas Education Agency This survey must be completed ON-LINE ONLY and ONLY ONCE by EACH SCHOOL DISTRICT (not campus). Work with colleagues in the district to answer questions
Georgia Department of Education
 Georgia Department of Education Early Intervention Program (EIP) Guidance 2014-2015 School Year The Rubrics are required for school districts to use along with other supporting documents in making placement
Chapters 1-5 Cumulative Assessment AP Statistics November 2008 Gillespie, Block 4
 Chapters 1-5 Cumulative Assessment AP Statistics Name: November 2008 Gillespie, Block 4 Part I: Multiple Choice This portion of the test will determine 60% of your overall test grade. Each question is
Nutrition 10 Contemporary Nutrition WINTER 2016
 Nutrition 10 Contemporary Nutrition WINTER 2016 INSTRUCTOR: Anna Miller, MS., RD PHONE 408.864.5576 EMAIL milleranna@fhda.edu Write NUTR 10 and the time your class starts in the subject line of your e-
2005 National Survey of Student Engagement: Freshman and Senior Students at. St. Cloud State University. Preliminary Report.
 National Survey of Student Engagement: Freshman and Senior Students at St. Cloud State University Preliminary Report (December, ) Institutional Studies and Planning National Survey of Student Engagement
Global School-based Student Health Survey (GSHS) and Global School Health Policy and Practices Survey (SHPPS): GSHS
 and Global School Health Policy and Practices Survey (SHPPS): GSHS") Global School-based Student Health Survey () and Global School Health Policy and Practices Survey (SHPPS): 08/2012 Overview of Agenda Overview of the Manual Roles and Responsibilities Personnel Survey
Global School-based Student Health Survey () and Global School Health Policy and Practices Survey (SHPPS): 08/2012 Overview of Agenda Overview of the Manual Roles and Responsibilities Personnel Survey
Learning Microsoft Publisher , (Weixel et al)
") Prentice Hall Learning Microsoft Publisher 2007 2008, (Weixel et al) C O R R E L A T E D T O Mississippi Curriculum Framework for Business and Computer Technology I and II BUSINESS AND COMPUTER TECHNOLOGY
Prentice Hall Learning Microsoft Publisher 2007 2008, (Weixel et al) C O R R E L A T E D T O Mississippi Curriculum Framework for Business and Computer Technology I and II BUSINESS AND COMPUTER TECHNOLOGY
Q1: Why Is Data Analysis Important? Frequently Asked Questions and Answers on BRFSS Data Analysis and Methods. Q2: How Reliable Are BRFSS Data?
 Frequently Asked Questions and Answers on BRFSS Data Analysis and Methods BRFSS Epidemiologists and Staff Division of Behavioral Surveillance PHSIPO, OSELS, CDC Q1: Why Is Data Analysis Important? A1.
Madera Unified School District. Wellness Policy Update
 Madera Unified School District Wellness Policy Update Introduction 2 A local school wellness policy is a written document of official policies that guide a local educational agency (LEA) or school district
Using Choice as a Writing Intervention to Investigate Gender Differences
 Minnesota State University, Mankato Cornerstone: A Collection of Scholarly and Creative Works for Minnesota State University, Mankato Undergraduate Research Symposium Undergraduate Research Symposium 2014
Van Andel Education Institute Science Academy Professional Development Allegan June 2015
 Van Andel Education Institute Science Academy Professional Development Allegan June 2015 Science teachers from Allegan RESA took part in professional development with the Van Andel Education Institute
MADERA SCIENCE FAIR 2013 Grades 4 th 6 th Project due date: Tuesday, April 9, 8:15 am Parent Night: Tuesday, April 16, 6:00 8:00 pm
 MADERA SCIENCE FAIR 2013 Grades 4 th 6 th Project due date: Tuesday, April 9, 8:15 am Parent Night: Tuesday, April 16, 6:00 8:00 pm Why participate in the Science Fair? Science fair projects give students
Executive Summary. Hamilton High School
 Executive Summary Hamilton High School Hamilton School District Dr. Kathleen Cooke, Superintendent W220 N6151 Town Line Rd. Sussex, WI 53089 TABLE OF CONTENTS Introduction 1 Executive Summary 2 Description
A Decision Tree Analysis of the Transfer Student Emma Gunu, MS Research Analyst Robert M Roe, PhD Executive Director of Institutional Research and
 A Decision Tree Analysis of the Transfer Student Emma Gunu, MS Research Analyst Robert M Roe, PhD Executive Director of Institutional Research and Planning Overview Motivation for Analyses Analyses and
Healthier US School Challenge : Smarter Lunchrooms
 Healthier US School Challenge : Smarter Lunchrooms Healthier US School Challenge : Smarter Lunchrooms Voluntary four-year certification initiative recognizing excellence in school nutrition and physical
University of Waterloo School of Accountancy. AFM 102: Introductory Management Accounting. Fall Term 2004: Section 4
 University of Waterloo School of Accountancy AFM 102: Introductory Management Accounting Fall Term 2004: Section 4 Instructor: Alan Webb Office: HH 289A / BFG 2120 B (after October 1) Phone: 888-4567 ext.
A Model to Predict 24-Hour Urinary Creatinine Level Using Repeated Measurements
 Virginia Commonwealth University VCU Scholars Compass Theses and Dissertations Graduate School 2006 A Model to Predict 24-Hour Urinary Creatinine Level Using Repeated Measurements Donna S. Kroos Virginia
EVALUATION PLAN
 UNIVERSITY OF NEW MEXICO COLLEGE OF EDUCATION 2013-14 EVALUATION PLAN NEW MEXICO PUBLIC EDUCATION DEPARTMENT EDUCATIONAL ACCOUNTABILTY REPORTING SYSTEM MSC05 3040 1 UNIVERSITY OF NEW MEXICO ALBUQUERQUE,
Linking the Ohio State Assessments to NWEA MAP Growth Tests *
 Linking the Ohio State Assessments to NWEA MAP Growth Tests * *As of June 2017 Measures of Academic Progress (MAP ) is known as MAP Growth. August 2016 Introduction Northwest Evaluation Association (NWEA
2 nd grade Task 5 Half and Half
 2 nd grade Task 5 Half and Half Student Task Core Idea Number Properties Core Idea 4 Geometry and Measurement Draw and represent halves of geometric shapes. Describe how to know when a shape will show
Research Design & Analysis Made Easy! Brainstorming Worksheet
 Brainstorming Worksheet 1) Choose a Topic a) What are you passionate about? b) What are your library s strengths? c) What are your library s weaknesses? d) What is a hot topic in the field right now that
No Parent Left Behind
 No Parent Left Behind Navigating the Special Education Universe SUSAN M. BREFACH, Ed.D. Page i Introduction How To Know If This Book Is For You Parents have become so convinced that educators know what
African American Male Achievement Update
 Report from the Department of Research, Evaluation, and Assessment Number 8 January 16, 2009 African American Male Achievement Update AUTHOR: Hope E. White, Ph.D., Program Evaluation Specialist Department
Lancaster Lane CP School. The Importance of Motor Skills
 Lancaster Lane CP School The Importance of Motor Skills What Are Gross Motor Skills? Good gross motor skills are required in order for muscles in the body to perform a range of large, everyday movements
TABLE OF CONTENTS 6000 SERIES
 6000 Support Services TABLE OF CONTENTS 6000 SERIES 6100 Goals of Student Health Services 6110 Organization of Student Health Services 6120 Student Health Services 6125 Administering Medicines to Students
Miami-Dade County Public Schools
 ENGLISH LANGUAGE LEARNERS AND THEIR ACADEMIC PROGRESS: 2010-2011 Author: Aleksandr Shneyderman, Ed.D. January 2012 Research Services Office of Assessment, Research, and Data Analysis 1450 NE Second Avenue,
2013 TRIAL URBAN DISTRICT ASSESSMENT (TUDA) RESULTS
 RESULTS") 3 TRIAL URBAN DISTRICT ASSESSMENT (TUDA) RESULTS Achievement and Accountability Office December 3 NAEP: The Gold Standard The National Assessment of Educational Progress (NAEP) is administered in reading
3 TRIAL URBAN DISTRICT ASSESSMENT (TUDA) RESULTS Achievement and Accountability Office December 3 NAEP: The Gold Standard The National Assessment of Educational Progress (NAEP) is administered in reading
Mathematics Success Level E
 T403 [OBJECTIVE] The student will generate two patterns given two rules and identify the relationship between corresponding terms, generate ordered pairs, and graph the ordered pairs on a coordinate plane.
STAT 220 Midterm Exam, Friday, Feb. 24
 STAT 220 Midterm Exam, Friday, Feb. 24 Name Please show all of your work on the exam itself. If you need more space, use the back of the page. Remember that partial credit will be awarded when appropriate.
Pima County, Arizona
 Pima County, Arizona In 2004 Congress mandated that all school districts participating in federal school meals programs create and implement a Local Wellness Policy (LWP) by July 2006. The WellSAT was
AGS THE GREAT REVIEW GAME FOR PRE-ALGEBRA (CD) CORRELATED TO CALIFORNIA CONTENT STANDARDS
 CORRELATED TO CALIFORNIA CONTENT STANDARDS") AGS THE GREAT REVIEW GAME FOR PRE-ALGEBRA (CD) CORRELATED TO CALIFORNIA CONTENT STANDARDS 1 CALIFORNIA CONTENT STANDARDS: Chapter 1 ALGEBRA AND WHOLE NUMBERS Algebra and Functions 1.4 Students use algebraic
AGS THE GREAT REVIEW GAME FOR PRE-ALGEBRA (CD) CORRELATED TO CALIFORNIA CONTENT STANDARDS 1 CALIFORNIA CONTENT STANDARDS: Chapter 1 ALGEBRA AND WHOLE NUMBERS Algebra and Functions 1.4 Students use algebraic
Math Grade 3 Assessment Anchors and Eligible Content
 Math Grade 3 Assessment Anchors and Eligible Content www.pde.state.pa.us 2007 M3.A Numbers and Operations M3.A.1 Demonstrate an understanding of numbers, ways of representing numbers, relationships among
EXPERIENCE UGA Outstanding Process Improvement: Increase Service to Students
 EXPERIENCE UGA Outstanding Process Improvement: Increase Service to Students What is Experience UGA? Experience UGA is a program of the UGA Office of Service-Learning (OSL), in partnership with the College
Organization Profile
 Preview Form This is an example of the application questions with which you will be presented. It is recommended that you compose the answers to the paragraph questions in a word processing program and
Guide for Test Takers with Disabilities
 Guide for Test Takers with Disabilities T O E I C Te s t TOEIC Bridge Test TFI Test ETS Listening. Learning. Leading. Table of Contents Registration Information...2 Standby Test Takers...2 How to Request
HWS Colleges' Social Norms Surveys Online. Survey of Student-Athlete Norms
 http://www.hws.edu/alcohol/aodsurvey/hwsath/ Page 1 of 1 HWS Colleges' Social Norms Surveys Online Survey of Student-Athlete Norms Username: Password: Please Login Login http://www.hws.edu/alcohol/aodsurvey/hwsath/index.pl
Interactive Whiteboard
 50 Graphic Organizers for the Interactive Whiteboard Whiteboard-ready graphic organizers for reading, writing, math, and more to make learning engaging and interactive by Jennifer Jacobson & Dottie Raymer
This survey is intended for Pitt Public Health graduates from December 2013, April 2014, June 2014, and August EOH: MPH. EOH: PhD.
 Pitt Public Health Exit Survey This survey will ask you questions about your program and the services provided by the Office of Student Affairs, as well as your overall assessment of the Graduate School
Executive Summary. Lava Heights Academy. Ms. Joette Hayden, Principal 730 Spring Dr. Toquerville, UT 84774
 Ms. Joette Hayden, Principal 730 Spring Dr. Toquerville, UT 84774 Document Generated On April 25, 2013 TABLE OF CONTENTS Introduction 1 Description of the School 2 School's Purpose 4 Notable Achievements
Measurement. When Smaller Is Better. Activity:
 Measurement Activity: TEKS: When Smaller Is Better (6.8) Measurement. The student solves application problems involving estimation and measurement of length, area, time, temperature, volume, weight, and
An Analysis of the El Reno Area Labor Force
 An Analysis of the El Reno Area Labor Force Summary Report for the El Reno Industrial Development Corporation and Oklahoma Department of Commerce David A. Penn and Robert C. Dauffenbach Center for Economic
Institution of Higher Education Demographic Survey
 Institution of Higher Education Demographic Survey Data from all participating institutions are aggregated for the comparative studies by various types of institutional characteristics. For that purpose,
NDPC-SD Data Probes Worksheet
 NDPC-SD Data Probes Worksheet This worksheet from the National Dropout Prevention Center for Students with Disabilities (NDPC- SD) is an optional tool to help schools organize multiple years of student
Anyone with questions is encouraged to contact Athletic Director, Bill Cairns; Phone him at or
 SKYLINE GRIZZLIES ATHLETIC REQUIREMENTS and REGISTRATION FORMS 2017-18 According to School District #91 and Idaho High School Activities Association rules, all students interested in participating in athletics
A method to teach or reinforce concepts of restriction enzymes, RFLPs, and gel electrophoresis. By: Heidi Hisrich of The Dork Side
 A method to teach or reinforce concepts of restriction enzymes, RFLPs, and gel electrophoresis. By: Heidi Hisrich of The Dork Side My students STRUGGLE with the concepts of restriction enzymes, PCR and
Digital Fabrication and Aunt Sarah: Enabling Quadratic Explorations via Technology. Michael L. Connell University of Houston - Downtown
 Digital Fabrication and Aunt Sarah: Enabling Quadratic Explorations via Technology Michael L. Connell University of Houston - Downtown Sergei Abramovich State University of New York at Potsdam Introduction
Aalya School. Parent Survey Results
 Aalya School Parent Survey Results 2016-2017 Parent Survey Results Academic Year 2016/2017 September 2017 Research Office The Research Office conducts surveys to gather qualitative and quantitative data
John F. Kennedy Middle School
 John F. Kennedy Middle School CUPERTINO UNION SCHOOL DISTRICT Steven Hamm, Principal hamm_steven@cusdk8.org School Address: 821 Bubb Rd. Cupertino, CA 95014-4938 (408) 253-1525 CDS Code: 43-69419-6046890
Enhancing Students Understanding Statistics with TinkerPlots: Problem-Based Learning Approach
 Enhancing Students Understanding Statistics with TinkerPlots: Problem-Based Learning Approach Krongthong Khairiree drkrongthong@gmail.com International College, Suan Sunandha Rajabhat University, Bangkok,
Abu Dhabi Indian. Parent Survey Results
 Abu Dhabi Indian Parent Survey Results 2016-2017 Parent Survey Results Academic Year 2016/2017 September 2017 Research Office The Research Office conducts surveys to gather qualitative and quantitative
Montana Content Standards for Mathematics Grade 3. Montana Content Standards for Mathematical Practices and Mathematics Content Adopted November 2011
 Montana Content Standards for Mathematics Grade 3 Montana Content Standards for Mathematical Practices and Mathematics Content Adopted November 2011 Contents Standards for Mathematical Practice: Grade
Details of educational qualifications
 Name of the Teacher: Name of the Department: Current post held: Associate Professor Date on which this format was filled (dd/mm/yyyy): 15/03/2017 Details of educational qualifications Qualification College
Abu Dhabi Grammar School - Canada
 Abu Dhabi Grammar School - Canada Parent Survey Results 2016-2017 Parent Survey Results Academic Year 2016/2017 September 2017 Research Office The Research Office conducts surveys to gather qualitative
Service-Learning Projects in a Public Health in Pharmacy Course 1
 Service-Learning Projects in a Public Health in Pharmacy Course 1 Jean T. Carter and Gayle A. Cochran School of Pharmacy and Allied Health Sciences, The University of Montana, Skaggs Building, Missoula
Soulbus project/jamk Part B: National tailored pilot Case Gloria, Soultraining, Summary
 Soulbus project/jamk Part B: National tailored pilot Case Gloria, Soultraining, Summary Juurakko Anu, Multicultural Center Gloria Paalanen Kaisu, Jamk UAS Hopia Hanna, Jamk UAS Sihvonen Sanna, Jamk UAS
Smarter Lunchrooms- Part 2 Kathryn Hoy, MFN, RD, CDN Manager, Cornell Center for Behavioral Economics in Child Nutrition Programs
 Smarter Lunchrooms- Part 2 Kathryn Hoy, MFN, RD, CDN Manager, Cornell Center for Behavioral Economics in Child Nutrition Programs CSNA s 62 nd Annual Conference November xx, 2014 Sacramento, CA 6 Basic
COMMUNICATION & NETWORKING. How can I use the phone and to communicate effectively with adults?
 1 COMMUNICATION & NETWORKING Phone and E-mail Etiquette The BIG Idea How can I use the phone and e-mail to communicate effectively with adults? AGENDA Approx. 45 minutes I. Warm Up (5 minutes) II. Phone
Executive Summary. Colegio Catolico Notre Dame, Corp. Mr. Jose Grillo, Principal PO Box 937 Caguas, PR 00725
 Mr. Jose Grillo, Principal PO Box 937 Caguas, PR 00725 Document Generated On December 9, 2015 TABLE OF CONTENTS Introduction 1 Description of the School 2 School's Purpose 4 Notable Achievements and Areas
Why Youth Join Gangs Proposal. Team Members
 Why Youth Join Gangs Proposal Spring 2004 Semester Watsonville Digital Bridge Academy - Cabrillo College 1 Team Members Aurelio Jacobo Sulema Lopez Diana Sanchez Spring 2004 Semester Watsonville Digital
Seasonal Goal Setting Packet
 S O U T H E A S T E R N A Q U A T I C S Name: Date: Seasonal Goal Setting Packet In this packet: Reflect on last season 2 How much is enough? 2 Make a list 3 Will require change 4 Are you a slacker? 5
Spinners at the School Carnival (Unequal Sections)
") Spinners at the School Carnival (Unequal Sections) Maryann E. Huey Drake University maryann.huey@drake.edu Published: February 2012 Overview of the Lesson Students are asked to predict the outcomes of
Spinners at the School Carnival (Unequal Sections) Maryann E. Huey Drake University maryann.huey@drake.edu Published: February 2012 Overview of the Lesson Students are asked to predict the outcomes of
Norms How were TerraNova 3 norms derived? Does the norm sample reflect my diverse school population?
 Frequently Asked Questions Today s education environment demands proven tools that promote quality decision making and boost your ability to positively impact student achievement. TerraNova, Third Edition
TIMSS Highlights from the Primary Grades
 TIMSS International Study Center June 1997 BOSTON COLLEGE TIMSS Highlights from the Primary Grades THIRD INTERNATIONAL MATHEMATICS AND SCIENCE STUDY Most Recent Publications International comparative results
The whole school approach and pastoral care
 The whole school approach and pastoral care Acknowledgement of Country We would like to acknowledge the traditional custodians of this land and pay our respects to the Elders past, present and future for
Extending Place Value with Whole Numbers to 1,000,000
 Grade 4 Mathematics, Quarter 1, Unit 1.1 Extending Place Value with Whole Numbers to 1,000,000 Overview Number of Instructional Days: 10 (1 day = 45 minutes) Content to Be Learned Recognize that a digit
The Impact of Honors Programs on Undergraduate Academic Performance, Retention, and Graduation
 University of Nebraska - Lincoln DigitalCommons@University of Nebraska - Lincoln Journal of the National Collegiate Honors Council - -Online Archive National Collegiate Honors Council Fall 2004 The Impact
The My Class Activities Instrument as Used in Saturday Enrichment Program Evaluation
 Running Head: MY CLASS ACTIVITIES My Class Activities 1 The My Class Activities Instrument as Used in Saturday Enrichment Program Evaluation Nielsen Pereira Purdue University Scott J. Peters University
Average Number of Letters
 Find the average number of letters in a group of 5 names. As a group, discuss strategies to figure out how to find the average number of letters in a group of 5 names. Remember that there will be 5 groups