A COMPARISON BETWEEN PROJECT-BASED LEARNING AND CONVENTIONAL TEACHING STRATEGIES. Burke Jared Torgerson
|
|
|
- Jack Flynn
- 5 years ago
- Views:
Transcription
1 A COMPARISON BETWEEN PROJECT-BASED LEARNING AND CONVENTIONAL TEACHING STRATEGIES. by Burke Jared Torgerson A professional paper submitted in partial fulfillment of the requirements for the degree of Master of Science in Science Education MONTANA STATE UNIVERSITY Bozeman, Montana June 2016
2 COPYRIGHT by Burke Jared Torgerson 2016 All Rights Reserved
3 ii DEDICATION To my wife, Tennille, and my children who supported me the whole step of the way! To my father, Burke, who set an example of excellence in education and a mother who always encouraged and supported me through my life.
4 iii TABLE OF CONTENTS 1. INTRODUCTION AND BACKGROUND CONCEPTUAL FRAMEWORK METHODOLOGY DATA AND ANALYSIS INTERPRETATION AND CONCLUSION VALUE...45 REFERENCES CITED...49 APPENDICES...52 APPENDIX A Fourth Grade Book Project...53 APPENDIX B Climate Panel Presentation Project...60 APPENDIX C Likert Project Surveys...66 APPENDIX D Semi-Guided Interview...69
5 iv LIST OF TABLES 1. Data Triangulation Matrix Comparison of Weather Project Class and Climate Project Class Comparison of Post Test Low Gain Scores and Engagement Comparison of Posttest and Project Rubric Scores...39
6 v LIST OF FIGURES 1. Visual Explaining Methodology Mean Gain Scores from Pre to Posttest Posttest Gain Scores Survey Results Comparing Project to Traditional Methods Correlation of Posttest Scores to Project Rubric Scores...38
7 vi ABSTRACT This study compared Project-based learning to conventional teaching methods of class discussion, lab, video, and note taking to determine its effectiveness at helping students understand Earth science concepts. Two ninth-grade Earth science classes were given two different projects. The first project had students create a fourth-grade book concerning weather related topics and they presented their books to local elementary students. The second project had students prepare and present a PowerPoint to a community panel by discussing climate change and specifically if they feel humans are the cause. The community panel consisted of a United States Forest Service firefighter, farmer, and mother. While one class did the project the other class was instructed using conventional methods. Students were assessed and data was analyzed via pre and post test, surveys, teacher observation, quizzes, and artifacts produced during projects. Results showed an increase in understanding for students who had higher achievement levels and were engaged during the course of the project.
8 1 INTRODUCTION AND BACKGROUND School Demographics Duchesne High School is in a rural area two hours east of Salt Lake City in Duchesne, Utah. Our school is 7-12 and I teach five different classes. I teach 8 th grade integrated science, 9 th grade earth science, chemistry, physics, and 7 th grade math. Most teachers have three to five different subjects to teach as well as coaching and guiding extracurricular activities. We have 367 students comprising grades 7-12 and fluctuate in numbers depending on the local economy. The cultural makeup of our school is 91% white, 7% Hispanic or Latino, 1% Native American, and the remaining 1% are either Black or Pacific Islander. Our students range from very well off financially in the upper middle class to those who come from the outskirts who, a lot of times, have no running water or electricity. Twenty-five percent of our students qualify for either free or reduced lunch. Fifteen percent of students have an IEP. Graduation rates excel at just over 96%. Our school climate is unique in that there is a big emphasis on academics as well as sports. Most athletes compete in two or three sports along with extracurricular activities such as; Family Career and Community Leaders of America, Future Farmers of America, Future Business Leaders America, Academic Decathlon, Speech and Drama, and the school play. We are a well-rounded school and our staff works well to accommodate each other to provide for successes in both realms. It is amazing how the kids who are low achieving students in Jr. High change once they start into high school and I often see a 180 change in how they respond and interact in class due to the accountability that these activities provide.
9 2 Students at Duchesne High School appear to have a dislike or fear of science and show a disconnect between understanding core science concepts and current instructional strategies such as; lab activities, direct instruction, and assignments. I suspect this is from the fact that science has not been engaging but has been presented by rote teaching practices that do not engage or challenge students abilities. I want all earth science students to experience doing science where they use a project that has real world application to learn science. To accomplish this, I will integrate project-based learning (PBL) with current teaching strategies to overcome learning discrepancies. The main question I am seeking to understand is: Does PBL enhance understanding of science concepts compared to conventional instructional strategies? Sub-questions include: 1. Does PBL motivate students to learn more than conventional teaching methods? 2. Can artifacts in a project or the project itself be used as the major assessment during a unit rather than a summative test? CONCEPTUAL FRAMEWORK PBL has had a growing influence in the past few decades. I have been concerned, as I have assigned projects, that there has not been deep understanding exhibited by all students. The PBL approach requires many in depth and multi-faceted steps of planning, design, and assessment to foster and encourage understanding. I will define PBL, discuss its components, explain successes, barriers, and how to mitigate specific barriers involved. In all that is said and done regarding the use of projects the most important aspect involved is a deep understanding when used during science instruction. (Barron, Schwartz, Vye, Moore, Petrosino, Zech, & Bransford, 1998; Kanter, 2010)
10 3 PBL is a method of learning focused on a central project or series of projects. According to Markham, Larmer and Ravitz (2003) the project work is central rather than peripheral to the curriculum (p. 4). Tinker (1992) states that; Projects are what scientists do. Students who are thoroughly engaged in a project-having selected the topic, decided on the approach, performed the experiment, drawn conclusions, and communicated the results-are doing science. They are seeing science not as a noun, an object consisting of facts and formulas, but as a verb, a process, a set of activities, a way of proceeding and thinking (as cited in Colley, 2008, p. 24). According to Krajcik, Blumenfeld, Marx, Bass, Fredericks, & Soloway (1994) PBL is tied to the constructivist theory of learning in that students learn and make sense of the world via active learning. The authors review literature concerning PBL and explain that learning is a social experience. Group members can pull from others knowledge and experience to engage in the learning process. They state that the project attempts to build bridges between science content and real-life experiences (p. 486). The PBL model is used to integrate the science content learned and helps students construct meaning, solve and engage in problems, enhance their cognitive processes, and apply the knowledge gained during the course of project components. Krajcik et al. (1994) gives the first of five major components stating that projects should engage students in investigating an authentic question or problem that drives activities (p. 486). The project is driven by essential questions that are complex and relate to curriculum standards (Schneider, Krajcik, Marx, & Soloway, 2002). The questions can be selected by the teacher or student generated. The questions must be
11 4 molded so as to require more than one or two days to answer. The project and its driving questions should relate to the students and the community in which they live providing a real-world aspect, rather than being distant or unrelated (Rivet & Krajcik, 2008). Speaking of these driving questions Barron et al. (1998) states that these questions need to be well crafted (p. 274). This helps to pique interest and desire to investigate the question or problems more openly. As students pursue their driving questions via PBL, they generate new questions and take on the role of the scientist as they do the work of a real scientist. These driving questions can also be refined or changed as needed along the process (Krajcik et al., 1994). Rivet and Krajcik (2008) explored contextualizing instruction in a PBL setting and how it supports learning. Contextualizing refers to using certain situations, questions, or problems that occur in the students world or real-life that are interesting or meaningful and will also engage students. The study took place in two eighth grade public schools in an urban Detroit area consisting of mainly African-American students. Focus students were observed, actions noted, and assessed based on comments made in class discussions, and small-group work. The course instruction was based on the physics of collisions using the science concepts of force, velocity, and impulse. The unit lasted 10 weeks and focused on the driving question: Why do I need to wear a helmet when I ride my bike? Students then experienced two anchoring events. These are events that are common to students that help memory recall and help students connect existing information to new information (Sherwood, Kinzer, Bransford, & Franks, 1987). Questions were asked about the two anchoring events and related to the initial question as class discussion pursued. Following the driving questions were a series of activities, lab
12 5 investigations, a concept mapping exercise, and a final presentation to sum up learning during the project. Students were assessed based on contextualization scores developed by the researchers to determine the value of anchoring events in the PBL classroom. A contextualization score focused on observations of how the students interacted in class and used the driving questions or topics to develop their understanding of force, velocity, and impulse. Students with a low contextualization score either made no response in class or when they did the comments were short statements that provided lower-level recall type responses. A higher contextualization score showed students elaborating on concepts involved and were accurate in their responses. These responses were more thought provoking or higher-order and often showed students initiating discussion and applying their knowledge to deepen their understanding during the project activities. To assess the relationship between learning and use of contextualization during the project the researchers compared contextualization scores with those pre/post test scores, which showed a significant correlation (r=0.61, p= 0.05). Those students who received high scores on their posttest were also observed to show a high use of contextualization features from the lessons. Rivet and Krajcik (2008) explains the alternative, Students who were not observed engaging with the contextualizing features of the project during classroom observations did not achieve strong pre/posttest gains (p. 92). When anchoring real-world events with driving questions, students can better connect new science knowledge to existing prior knowledge. This allows deeper understanding and application of the new knowledge constructed.
13 6 The second component of good PBL instruction results in students developing a series of artifacts or products that address the question or problem (Krijcek et al., 1994, p. 486). Sometimes the artifacts are the project itself, sometimes they are the assessment, sometimes both; it depends upon the scope of the project. Artifacts can range from homework assignments, storyboards, and lab assignments to multimedia presentations, books, community outreach, and modeling (Barak & Zadok, 2009; Barron et al., 1998; Kanter, 2010; Markham, 2003 p. 50). Many projects are design-based in that they develop or create an artifact or product. Barak and Zadok (2009) discuss how students can start by creating simple artifacts like constructing a fishing rod out of Legos leading to a more difficult design such as a computer controlled car that has to perform certain tasks. Liu and Hsiao (2001) looked at students involved as multimedia designers where they first learn the software, then created multimedia presentations such as PowerPoints or Photoshop, followed by a larger project by creating a website. Barron et al. (1998) researched students designing playhouse blueprints for small children with the winning design being used for an actual playhouse in the community. In all of these design-based projects the use of driving questions and referring to them often enhanced student learning. A third and important component of PBL is that it allows students to engage in investigations (Krijcek et al., 1994, p. 486). Rivet and Krajcik (2008) discussed using contextualization to enhance engagement. This was done by making the investigations relate to the students questions or real life so they could make connections between what they were learning, new content knowledge, and then be able to apply that knowledge. When engaging in projects, Kanter (2010) states that, learners need to be active in
14 7 constructing their understanding of science content (p. 527). In all the examples from component number two where students create or design artifacts, the artifacts were used as the engagement tool where students must be actively involved in order to produce a beneficial project and learn the content. (Barak & Zadok, 2009; Barron et al., 1998; Liu & Hsiao 2001). A fourth component of PBL involves students, teachers, and/or members of society in community as they collaborate about the problem (Krijcek et al., 1994, p. 486). Barron et al. (1998) discuss integrating members of the community into projects. They combine different projects with a feature called Jasper Central (p. 289). With Jasper, community members take part in evaluating students projects. In this study fifth grade math students are faced with the project of designing blueprints for a small playhouse in the community. Once they design the playhouse to scale they prepare a presentation where they must convince Jasper that their design should be used. Jasper was used to evaluate for accuracy, safety, consistency, and how well the students communicated design features in their plans and presentation. The evaluators found that 84% of designs were accurate enough to be built and used in the community. The article does not provide the rubric or specifics of how students were graded, but observations showed that students took seriously the need to convince Jasper Central of the accuracy of their work. They included information about safety requirements and their use of extra wood for trim, and they put forth effort to convince their audience that it would be fun for 4 and 5-year olds to play in (Barron et al., 1998, p. 303). An important aspect of using an outside source rather than the teacher to judge is that it freed up the teachers to become coaches along the process of the
15 8 project. They could engage with the students as they created their designs and helped students hone their presentation skills. Another project was used in conjunction with an outside panel in a college food science class (Lee, 2015). In this study the students were taught via lecture, class activities, and lab activities. At the end of the semester a Final Meal Project (p. 61) was done to apply all that was learned during the class and was worth 15% of their grade. Students were to work in groups to produce a four-course meal and a sensory panel evaluated their food quality as well as their food science knowledge. The panel consisted of faculty and students from the college. Lee (2015) explains that in a survey 71% of students strongly agreed that the project reinforced course materials covered in the lectures (p. 63). Reporting on the comment portion of the survey students said they benefited from the feedback provided by the panel and that the sensory panelists helped them to prepare food to a higher standard. (p. 63). Another comment states that the sensory panelists were able to ask us questions and explain concepts further. We were asked some challenging and thoughtprovoking questions. (p. 64). Through using a panel or members of the community outside the classroom students are required to put more thought and real-world application into what is presented compared to traditional methods of presenting to a single teacher. The fifth and final component for PBL involves students using cognitive tools (Krijcek et al., 1994). In terms of cognitive tools, each project is unique and requires its own set of tools for use in its design and learning goals or outcomes. Liu and Hsiao (2001) speak of using Cognitive aids (p. 3) like storyboards and flowcharts to help
16 9 design and guide students while completing a multimedia project. Krijcek et al. (1994) discuss using computer software and applications to help analyze lab investigations by obtaining information that can be more easily studied and revised with technology. Students can simulate real-world data analysis, which makes the environment more authentic (p. 488). In the study by Barron et. al. (1998) a problem-to-project approach is used to help build cognitions for large and more difficult projects like the designing of the aforementioned playhouse In the problem-to-project approach, students watch a video where a kid gets hit by a car. Next in the video, on career day an architect visits with the students followed by a developer who wants to donate some land for a project. Using student input, the architect, students, and developer decide that a playground should be created to help solve the problem. A challenge is left for the students to design a site plan for the playground, design a model of the playground, and give a view of the equipment containing all the angles, lengths, and depths. They also have to take into account the safety parameters for the ages of kids who will be playing on the playground. Once they solve the playground problem they apply what they have done to the project, which consists of designing a playhouse that will actually be built in a local community. To evaluate the effectiveness of the problem-to-project approach students were assessed three ways. First was a design-a-chair performance assessment. This assessment was given via a pre and post test. The drawings were given to two viewers that had a rubric and scored drawings based on the picture quality, measurements, scale relating to the actual measurements, and measurement labels being consistent to scale.
17 10 The reviewers were able to identify the pretest compared to the posttest drawing correctly 97% of the time. Seventy-one percent of students improved from showing no or unrealistic measurements on their pretest to using realistic measurements on the posttest. Scores on a standards-based geometry test show that all students were able to benefit from their problem and project-based work. Test results show the high-achieving students with the largest test gains from ~28% correct answers on pretest to ~90% correct on posttest. The low and average achieving student levels show gains of ~36% and ~55% respectively. The authors attribute the improvement of all students by imbedding geometry concepts within the project. The last assessment used a presentation to Jasper Central and indicated that 84% of the playhouses designed were judged accurate enough to be built (Barron et al., 1998). Findings from Barak and Zadok (2009) indicate similar gains through using the problem-to-project approach. A major benefit of PBL is that it fosters use of higher order thinking skills and provides motivation to use these skills. Stolk and Harari (2014) state that, When compared to more conventional and direct instruction, PjBL (Project-based learning) and PBL (Problem based learning) promote better problem solving, more effective cognitive skill transfer, and higher use of elaboration, critical thinking, and metacognitive strategies (p ). This only benefits students when the project is designed to specifically address higher order thinking skills (Kanter, 2010). Tiwari, Lai, So and Kwan (2006) compare the use of PBL (Problem-based learning in this case) to Lecture-based instructional methods in a qualitative and quantitative study involving undergraduate nursing students in Hong Kong. The study specifically looks at the use of critical thinking disposition, which is defined in the article
18 11 as, the consistent internal motivation to value and use critical thinking (p. 548). They found that disposition scores were higher for those involved in PBL than lecture and that it was that way for two years after the courses ended to a small degree. They attribute this disposition to the PBL process using case based problems from actual patients from which they had to identify the problem, research it, synthesize, analyze, and apply the new knowledge to help solve a problem in small groups. Students were more active and involved in the learning process than the lecture students. Students also found the PBL process enjoyable, inspiring and self-fulfilling (p. 551) whereas those in the lecture felt negative towards their experience and that the lectures didn t encourage them to think. The authors speculate that the PBL method encourages critical thinking and state that as a result of PBL self-regulated learning, self-efficacy, and motivation increases as students continue in PBL methods. Other benefits of PBL (Project-based learning) include teambuilding, teamwork, collaboration, and cooperation skills that are all experienced and enhanced. Many students enjoy working together because there is a built in support group and all can share in the workload. Students learn to split up tasks and manage time while working together. Teams of students can give each other feedback and help to revise different aspects of their project or activities. Communication skills are taught and students learn how to interact with their group to produce a product more efficiently and complete the learning activities. Students might also come across negative results and learn about conflict resolution. (Barak & Zadok, 2009; Barron et al, 1998; Filippatou & Kaldi, 2010; Liu Hsiao 2001; Tawari et. al 2006)
19 12 There are many benefits to using an outside audience, panel, or members of the community in conjunction with the project (Barron et al., 1998; Lee, 2015). Barron et al. (1998) indicate that using community members simulates more of how the real world works or work life (p. 285). An external audience or panel makes the work more meaningful and offers new opportunities for learning and can help students learn about more effective ways to communicate our ideas (p. 285). As students present to a panel they can learn via feedback and interactions with panel members. Lee (2015) says that the panel used in their project research to judge food helped students produce food to a higher standard than they otherwise would have done without the panel. Another benefit of using an external audience and having to present to them is that it provides a strong incentive to prepare and revise (Barron et al., 1998, p. 286). Students are required to put more thought and make the project more meaningful. In the Jasper program (Barron et al., 1998) students were able to utilize and benefit from constant revision. Students understood that it was to be the norm as they proceeded in the project. Setting clear expectations is important in regards to revision. Teachers who were interviewed were surprised to see that students would actually revise and wanted help from someone else. Interviewers in the research found that every student made at least one revision to their blueprint. It is important to note that the curriculum was designed so that students provided feedback to other groups and teachers filled out evaluation sheets of student projects so they could make revisions as the project proceeded. Filippatou & Kaldi (2010) research the effect of PBL on fourth grade students who show signs of learning disabilities in Greece. Students were learning about sea
20 13 animals via direct instruction, visits to local markets, expert visits, hands on (specifically with the sea animals), and other individual or group activities. They were given a pre and posttest and on all seven units taught on sea animals students scored higher at the end of the project. Self-efficacy increased regarding environmental studies for these students. Comments from students indicate that the students found PBL more effective, fun, and motivational than other forms of class instruction like lecture and using a textbook. The authors state in the discussion that the PBL approach applies better to their educational needs for a multi-sensory teaching method (p. 23). In this article PBL was integrated with activities and helped to provide variety for the students that they were not accustomed to. In a study by Schneider et al. (2002) researchers assessed a school that had restructured their science curriculum to use PBL and inquiry methods and compared them nationally to other schools which had not implemented principles of PBL and inquiry. The school, an alternative high school with 450 students, was situated in a Midwest university town of approximately 100,000. Students had varying abilities and backgrounds and were mostly white middle to upper class. The school was compared to others in the nation by using the NAEP test results from The test was a combination of multiple-choice, short answer, and a performance assessment portion. Item difficulty was compared between the researcher s test and NAEP test indicating a close relationship with a coefficient of (r =.77, p <.001). Conclusions from data show the PBL students outscored the national sample on almost half of the test items putting PBL students in the 70 th percentile of the national average. Many test items in which the length of the response was extended scored even higher
21 14 than the national average. Schneider et al. (2002) further explain that, The format of PBS (project-based science) instruction encourages students to extend their thinking. Tasks and activities are designed to encourage students to express their ideas in a variety of ways (p. 419). With a test rich environment that currently exists this study shows that PBL students can do well on standardized tests similar to other modes of instruction. An interesting note in the data show patterns that science concepts which are difficult to understand in the PBL group are also difficult to understand for those not involved in PBL instruction. In using PBL in science classrooms one can encounter some barriers to success. One major barrier is the fact that there is disconnect between doing a project and the project providing meaningful learning (Kanter 2010). Kanter (2010) states that the way PBL curricula is designed can cause tension between the doing and the learning (p. 529). Baron et al. (1998) explain that many get caught up in the doing of an activity or project rather than doing with understanding (p. 273). In a study involving a robotics experiment the instructor discovered that even after the change to PBL many students would create the robots and then be unable to explain what they had learned by doing the project (Barak & Zadok, 2009). A solution to this challenge would be to create or develop driving questions that relate to the project and fosters learning of the concepts involved. Many researchers view scaffolding as vital to success for gaining deep meaning during the PBL process. These scaffolding strategies must be age and content specific (Barak & Zadok, 2009; Barron et al., 1998; Liu & Hsiao, 2001). Teachers need not be afraid to also interject some direct instruction along the way when discussing deep concepts that students may otherwise not
22 15 learn about while doing the project (Filippatou & Kaldi, 2010; Kanter, 2010). Barak and Zadok (2009) commented that the students in his study actually enjoyed it and it helped them focus their learning. Depending on the experience of students with the PBL method differing scaffolding patterns will be needed along the way to ensure learning takes place (Kanter 2010). Liu and Hsiao (2001) explain that in a study of Middle school students using multimedia design projects used multiple scaffolds to guide students. Scaffolds include the use of direct instruction, contact with multimedia experts, flow charts, storyboards, multimedia tools, and technology in the project. Barron et al. (1998) explains that a major scaffold to help focus students attention during the more open ended projects is to use the problem-to-project method. This will help students put their project into perspective and helps students analyze the specific parts of the whole project. They give the example of monitoring a local river as a project and then using a specific emergency problem to help teach certain aspects or components of the project they are participating in. Another scaffold they explain is the use of contrasting cases. Contrasting cases involve students analyzing two opposing cases or situations and then discuss the differences and similarities. This allows students to ask questions and find out more in depth about a topic within the larger scope of the project. Assessment tools such as interviews, questionnaires, and reflection logs should be used as scaffolding during the project. Liu and Hsiao (2001) in a summary statement concerning scaffolding stated findings indicated that these scaffolds were not only necessary, but also critical for an implementation of this PBL (p. 334). Students need time to self-reflect on what they are learning before finishing the final project. Students can use these assessment tools to finalize, fix, and prepare the final product to bring
23 16 closure and ensure a high quality project. It is also important that students be allowed to take ownership of their project by helping to create the assessments in certain instances (Barron et al., 1998). An interesting barrier to success regarding engagement was discussed in the article involving students with learning disabilities. Filippatou & Kaldi (2010) state that during the project on sea animals, students were engaged behaviorally and motivationally speaking, but these pupils did not seem to be cognitively engaged (p. 24). They explain that students went about learning in a superficial way (p. 24), giving the example that the students wanted help to complete the task but not to understand the content. To combat and help foster cognitive skills in these students the authors state that one must teach them to use cognitive strategies by direct instruction more during the project. It helps to shorten or adapt the PBL activities and provide more specific learning goals. Text (magazines or textbook) materials used should be specific to and adapt to the student s reading level or level of understanding. Another barrier to success of PBL is grouping of students and keeping students accountable for individual as well as group learning. Barron et al. (1998) discuss some solutions in research with fifth graders. The authors mention that the first priority in group work is to establish group norms for individual accountability. An example is given that group members must all come to a certain threshold of achievement in order to move on to other more difficult aspects of the project. One must understand how a scale model works before building the actual model that uses scale models. The researchers explain that oft-times the students will teach each other and make sure that all understand if this is the case. Liu and Hsiao (2001) say that another solution to helping student
24 17 groups function is assigning students certain roles or responsibilities. The way one assesses PBL can overcome the accountability barrier and help ensure understanding has occurred. Rivet and Krajcik (2008) discuss some observations as they reviewed a specific group and its individual members. A pre and posttest was given along with two artifacts that were presented as the assessment. One individual received one of the highest scores on the posttest while scoring low on his artifacts presentation assessment that was more geared to higher cognitive levels. Although he scored well on the posttest the artifacts show a better picture of his actual understanding during the project. If one is to assess the whole group on one product or artifact, then it will not necessarily be an accurate view of an individual s understanding. Rivet and Krajcik (2008) elaborate on the Helmet project stating that, Depending on the focus students role during group work, the artifacts may not be a reflection of their own understanding but that of another, perhaps more dominant, group member (p. 94). They give an example of a student who received a good score on the artifacts, but while observing his presentation and understanding during it that he looked to his group for help half way through and stumbled through the explanation. They reviewed observations showing that the student was quiet during small group discussions and that the group was dominated by another student. The authors state that the posttest scores are a better indicator in this situation of understanding than the artifact that was a product of group work. Thus, two varying assessments for learning help get a better picture of understanding more than just one final product. Barron et al. (1998) states that along with multiple assessments it is important to allow and incorporate reflection and revision during the course of the project
25 and during activities within the project. 18 A barrier to success, when using a sensory panel, is that students may feel nervous or that the judging may be too harsh (Lee, 2015, p. 63). To mitigate, one may use a mock panel or use teachers the students are familiar with. The students can also become familiar with those who will serve on the panel if they have contact with them before they present their project. Other barriers with using the panel are: that the time of day will influence which community members can participate and that the panel may not feel comfortable enough with the content involved to make accurate evaluations of students (Lee, 2015). To mitigate the situation, the teacher must take time to consult with community members and solicit ideas as to how to go about grading or evaluating. One can sit down before the project begins and provide the panel with an overview of the topics covered in class and provide information given to the students in class so they are familiar with content. Community members can be contacted by students and invited to sit in on developing the project to build relationships of trust. All of these factors lead to good project design and time outside of class to ensure contact is made. One last barrier to success is time. PBL takes time and resources to implement! Many teachers and researchers ask Is PBL worth the time and effort? Students generally want more time to complete longer or more difficult projects (Liu and Hsiao 2001). In order to overcome this barrier; students must have a project that relates to them, is interesting, and provides depth enough to maintain focus as well as provide a meaningful learning experience that they will remember (Rivet & Krajcik, 2008; Short, Lundsgaard, & Krajcik, 2008).
26 19 Time constraints can be a barrier to the success during a project. Some projects that are too long will find students losing motivation, while those too short will not provide enough deep meaning. Sometimes the core curriculum is a barrier in and of itself for integration of PBL into the class (Kanter, 2010; Liu & Hsiao, 2001). Liu and Hsaio (2001) reference (Liu & Rutledge, 1997) stating that the challenge for the teachers and researchers is to keep the students interested while engaging them in the more important, but less fun, tasks such as planning, designing and evaluating (p. 6). Kanter (2010) speaks about designing the project so that there is a balance between allowing the students freedom to explore questions and natural phenomenon, while also getting at the meaning of the content that one is to understand. How to do this remains a hot topic in PBL research and is a continuing question many educators and researchers grapple with. The use of the problem-to-project and contrasting case scaffolds can help with this barrier as well (Barron et al. 1998). Teachers will have to plan their tasking by breaking up the mundane planning and designing features of the project. They can also interject useful demonstrations, videos, models, and provide instruction where needed during times of confusion. PBL can be fit to address the needs of students in whatever capacity and must be done to ensure success (Barak & Zadok, 2009). Professional learning communities and collaboration with other teachers will help in planning and developing successful, meaningful, and useful PBL learning environments (Liu & Hsiao, 2001). Barron et al. (1998) give an important reason for using PBL during sacred class time. Students that had completed Jasper were asked what they remember about fifth grade that made them feel proud and creative. Fifty percent mentioned the Jasper
27 20 program and after being asked why many said that is was a very important experience for them (p. 305). Jasper involved using the community panel to assess their blueprints and presentation where they designed a playhouse for a local community park. METHODOLOGY For the intervention I used two freshmen Earth science classes. The first project included the treatment of group one who created a fourth grade book on weather and presented it to our local elementary students (Appendix A). The second group was the non-treatment and were taught about weather using conventional methods including; direct instruction, book assignments, lab work, video, lecture, and discussion. During the second mini-unit on climate group two became the treatment while the other group became the non-treatment (Appendix B). Students involved in the treatment researched global warming, prepared a PowerPoint presentation, and presented to a community panel for evaluation. Each unit lasted four weeks. The total duration of the study was eight weeks. The research methodology for this project received an exemption by Montana State University's Institutional Review Board and compliance for working with human subjects was maintained. My intervention cycled the treatment and comparison between two groups over the course of units on weather and climate change. Figure 1 summarizes the intervention sequence.
28 21 Figure 1. Visual explaining methodology. Both treatment and non-treatment groups began the weather unit using conventional teaching methods. I showed a couple demonstrations in the lab relating to air pressure by crushing a pop can and using air pressure to hold water inside an inverted beaker. Students then viewed a video of air pressure crushing a 55 gallon drum by the same method. Following the demonstrations students began a weather data collection lab that taught them about low and high pressure, temperature, cloud coverage, and humidity. At the end of the lab students drew conclusions using graphs of different weather parameters and how they influenced weather. We specifically discussed air pressure and how important a weather predictor it can be. Students performed a laboratory exercise that involved analyzing dew point and reemphasized the relationship between temperature and cloud formation. Another series of demonstrations were used to present air masses and fronts. Students used structured notes containing essential questions relating to the formation of certain air masses and frontal boundaries. Assessment of air mass and front formation was given via a quick-write where students wrote for five minutes concerning a teacher generated prompt. A review assessment was provided the following day involving a map
29 22 of North America and had students indicate the type of air masses that would form over a specific area. Notes on global wind patterns, Coriolis effect, causes of wind, and pressure belts were then given and discussed. Conventional instruction concluded using videos and structured notes involving conditions that give rise to thunderstorms, tornadoes, and hurricanes. A summative quiz was given regarding all weather content. Students of the second group who were the control during the weather unit moved into the climate unit where they would become the treatment group. Those of group one involved in the weather treatment began work on the fourth grade book project. A rubric was given involving all aspects and expectations for the project (Appendix A). Various fourth grade books were shown and on hand for reference as students created their book. Students were able to choose a partner and were then randomly assigned topics involving air masses and fronts or severe weather. Separate rubrics were given to specifically account for the differing content (Appendix A). Groups then surveyed fourth grade students asking them for their preference in book types and ideas to use for the creation of their book. Once books were finished, students took their book to the fourth grade students and read them their stories. After each book was read students gave each fourth grader a simple survey that asked them how the liked the book and what they learned about weather (Appendix A). The climate unit started with a launch lab where students used Google Earth to gather latitude data. Students then used average temperature data of various locations and analysis questions to compare different factors influencing climate around the globe. A video using Extreme Ice produced by National Geographic was presented and students noted the consequences of global warming. Other short videos were watched and
30 23 analyzed and pertained to desertification, sea level rise, ocean acidification, and habitat loss. A discussion web was given to help analyze conditions contributing to global warming (Appendix B). The essential question asked in the center of the web was, Are humans causing global warming?. On both sides of the discussion web there are boxes for natural causes of global warming and also human causes of global warming. To assess natural causes of global warming; students watched videos concerning Milankovitch cycles, plate tectonics, and solar cycles. Students used book and internet sources to analyze human factors linked to global warming such as; fossil fuel use, deforestation, and the heat island effect. Students performed a lab where they simulated the greenhouse effect. They then did an activity where they measured and analyzed climate influence on tree ring growth from trees spanning from the 1400 s to the 1960 s. They also analyzed graphs from ice core data from the Greenland ice sheet and carbon dioxide levels from the Mauna Loa Observatory provided by Northwestern University in a series of activities called data detectives. Finally, a small PowerPoint was presented showing how sea level and temperatures have changed in the last 500 million years. Project work began for the second treatment group and a breakdown of the project was handed to students along with the grading rubric (Appendix B). The project consisted of researching global warming, creating a PowerPoint presentation, and sharing with a community panel. Students discussed whether or not humans are the cause of global warming or if it is happening through natural processes. The content of the presentation consisted of the students showing the consequences of a warming planet: sea level rise, desertification, ocean acidification, and habitat loss or gain. Students then
31 24 discussed data gathered from ice cores, pollen, and alpine glaciers, and rock record to show the way scientists tell how climate has changed in the past. Lastly, they were to justify their position concerning the question of whether or not humans are the cause of warming with data as well as answer questions from the panel. Students were given three days to prepare their presentations and were to create an outline of their presentation before they were to worry about slide transitions and pictures. On the last day of work students used their grading rubric to do a peer review and help a different group see how they could improve their presentation. In addition to peer evaluation a class aid and I went to each group and showed them areas we thought they could improve. We also helped them formulate responses to possible questions that the panel would ask. I put together the community panel and tried to use people with different backgrounds. One panel member was a farmer and former agricultural science teacher, another is a fire fighter for the forest service, and the last is a mother. I split up the grading rubric between the three so they could focus on a couple of specific parts on the presentation and then added their responses onto one rubric to calculate a score. This allowed the panel time to formulate questions to ask the students when they were to justify their position. Students who were not presenting were in the lab getting ready for their presentations. The class that did not do the project went through the same sequence of instruction minus the project. Both groups filled out a knowledge rating with all weather and climate concepts to help review for their posttest. Data was collected on both groups by first using a pretest. The assessment was teacher generated and was given through Mastery Connect, which is a computer based
32 25 testing website supplied by our District. During direct instruction I administered quizzes to assess content knowledge as well as quick-writes following instruction. A quick-write is simple writing prompt that assesses what is learned during an activity or lesson and allows students to discuss any misconceptions they may encounter during the lesson. A knowledge rating was used at the end of both units to help prepare for the posttest. This is written in the form of I can statements that match content objectives. Class observations and a teacher log served to assess the engagement level, attitude, and general behavior of the class during the project. The first treatment group was assessed on their fourth grade gook by a teacher generated rubric. The fourth graders who read the book were given a simple survey where they could rate the book on content as well as readability or if it was enjoyable to read. These surveys were factored into the students grade. The second treatment group that did the climate unit project produced a PowerPoint presentation for a community panel. After students presented to the panel the panel members asked questions and graded the presentation. I administered a summative exam after grading the projects to see if test results paralleled or matched project grades. In order to assess whether or not PBL motivates more than conventional instruction I used three methods. I used a teacher log/journal to record my perceptions concerning the effectiveness of how the project motivated students to learn compared to conventional instruction. I also used a student survey to tell how they felt about the project compared to other teaching methods. Surveys were administered by paper and tabulated by hand (Appendix C). Semi-guided interviews were conducted at the end of both projects (Appendix D). I randomly selected six students for the interview sessions. There were
33 26 equal numbers of high, medium, and low achieving students. I wanted the students to discuss their perception of the project and how they felt it helped motivate them to learn the content. To assess the question of whether or not a project or artifact would serve as an assessment tool rather than a unit test I used the project rubrics and the post test data. I compared their results to determine the correlation. I also used student grades during the analysis. The data sources are summarized in Table 1. Table 1 Data Triangulation Matrix Focus Question Data Source 1 Data Source 2 Data Source 3 Primary Question 1: PBL s effect on student understanding vs. traditional methods? Sub-Questions 1: Does a project motivate more than regular instruction methods? 2: Artifacts used as assessment tool? Pre-unit test Post-unit test Student Interviews Book creation Formative quizzes and quick-writes Student Survey Panel Presentation rubric Class Observations Teacher log Teacher journal/log Summative test DATA AND ANALYSIS A variety of data collection methods were planned into the design of my intervention. During the course of the treatment for both units on weather and climate constant observations and notes from my teacher log served to help keep the projects on track, aligned to the triangulation matrix, and helped to analyze qualitative and quantitative data gathered.
 on the weather posttest.")
34 27 Influence of PBL On Student Understanding I wanted to evaluate the affect of project-based learning on understanding of science concepts compared to conventional instructional methods. To assess the question a pre and posttest was given to both classes. The first treatment group, or weather project class, showed a mean gain score of 0.15 (N=19) on the weather posttest. This was the portion of the test for which the project was completed. That same group showed a mean gain score of 0.17 (N=19) on the climate portion of the posttest. The second treatment group, or climate project class, showed a gain score of 0.2 (N=22) on the weather portion of the posttest, and a 0.36 (N=22) gain score on the climate portion (Figures 2 and 3). The climate project class had higher gains on both weather and climate sections of the posttest. Figure 2. Mean gain scores from pre to posttest, (N=41).
35 28 Figure 3. Posttest gain scores, (N=41). Both treatment groups that scored gains at or above the median were higher achieving students (Figure 3). Seventy-five percent of students in the weather test treatment group and 78% in the climate test treatment groups with gains above the median were A and B students. There were six students overall that had negative gains scores. Half of those students are F students. Two of the negative gains students were high achieving students and showed negative gains for the test that coincided with the conventional instructional methods while showing positive gains for the test in which they did the project. There were no students from the climate project class that had negative gains on the climate portion of the posttest for which the project was completed.
36 29 The climate class; which scored higher gains and contains students with higher achievement levels, tend to do better on formative quizzes and show more depth of knowledge in their quick-writes (Table 2). Student mean scores on two quizzes given during the weather unit were 75% and 78% for the climate project class. The same two quizzes given to the weather project class were 80% and 64%. The second quiz was more summative in nature and covered all weather content presented over two weeks of class. A simple formative air mass quiz showed climate project students scoring 76% with one or less mistake while the weather project students had 38% with one or less mistake. Table 2 Comparisons of Weather Project Class and Climate Project Class Weather Project Class Climate Project Class Gains from Pre to Weather Unit Climate Unit Weather Unit Climate Unit Posttest Formative Quiz Quiz 1 Quiz 2 Quiz 1 Quiz 2 Scores from weather unit only 80% 64% 75% 78% Formative Air Mass Quiz Discussion Web (Depth of Content in notes). Climate unit only Achievement Levels High Posttest gains + High Achievement Levels Observations from Teacher Log 1 or less Mistake 1 or less Mistake 38% 76% No Depth No Depth Depth Depth 67% 33% 33% 67% 7 students are A and B students 7 D and F students 15 students are A and B students No D and F students 67% 56% 89% 89% Almost half unprepared Poor Group Communication Peer Evaluation Not Used Deadlines met. Good Group Communication Peer Evaluation Tool Used
37 30 Didn t follow instructions or use rubric well Poor class attitude and behavior Followed instructions and used rubric well Good class attitude and behavior The discussion web used during the climate unit were analyzed by categorizing responses as either no depth and erroneous notes to very deep and specific. The weather project class showed 67% of students showing no depth with 33% of students showing depth and were more specific. The climate project class was just opposite with 33% showing no depth and 67% being more specific. Observations (Table 2) show the climate project class was engaged in their project 75% on one day and 82% on another day while the weather project class engaged 30% and 50% of the time respectively. The lower gains group for the weather project had four of ten groups fail to complete the project compared to only one group in the other class. Table two shows a comparison of other observations between the two groups from my teacher log. All students that scored at or above the median gain score were also fully engaged during their instructional time either for the project or during conventional instruction. Engagement observations on Table 3 show 90% of the low gain students from the weather project class were unengaged at some point during their project. Eightythree percent of weather project students that have low gains on both weather and climate sections of the posttest were also unengaged during their project work. The higher achieving climate class had 69% of students that received low gains on both weather and climate posttest sections with 46% of those students unengaged at some point in their project.
38 31 Table 3 Comparison of Posttest Low Gain Scores and Engagement Low Gains and Unengaged Low gains and Unprepared on project due date Low Gains on both weather and climate post test Low gains on both post tests and unengaged during project Mode of low gain students' grades Weather Project Class 90% 60% 60% 83% F Climate Project Class 38% 0% 69% 46% C Note. Low gains students listed were at or below median score in both classes, (N=41). Impact of PBL On Student Motivation The second question I am seeking to answer is; Does a project motivate students to learn more than current teaching methods? I interviewed both classes of different achievement levels. I created a list of students for each class and separated them according to yearly average grade. The groups were randomly selected by placing names in a box and having a student aid choose them. The interviews for both classes were conducted at the end of the climate unit of study. Students were told that the interview would be done as mentioned and that they would have no bearing on their grade. During a class activity I brought each student into the chemistry lab and conducted the interview. Most interviews took approximately fifteen minutes. Students commented positively when asked about their overall impressions concerning the different projects. Sixty-four percent interviewed were positive, 18% had negative comments, and the other 18% were indifferent or had neutral feelings. The negative comments were geared towards having a hard time integrating science content into a story for the fourth grade book project and not wanting to speak in front of people
39 32 for the climate panel presentation, which were expected concerns. Observations showed the fourth grade book project being more difficult to accomplish and many students had issues coming up with a story line that could accurately integrate correct science content along with a story that a fourth grader would find interesting. Survey results show that of those who did the book project 68% said they either strongly agree or somewhat agree that they enjoyed their project overall compared to the climate project students with 58%. Observations and teacher log of the two projects indicate the book project students struggling, unengaged, and with negative attitudes during the course of the project compared to the climate project class. When asked how students felt the project motivated them to learn the concepts of weather or climate better than regular teaching methods, nine of eleven students indicated that it did help. Comments regarding how it motivated included the fact that they could dig deeper into the content, get to experience it more than taking notes, lecture, or class discussion, and it helped summarize the content material. One student commented that; while looking up stuff about hurricanes, it helped me understand it in an easier way. Fifty-three percent of students who did the climate panel project agreed that it helped deepen their understanding compared to 32% in the other class.
40 % of Students who agree 33 Survey Comparing Project to Traditional Teaching Methods Prefer Project Prefer Traditional Methods Figure 4. Survey results comparing project to traditional methods, (N=41). Surveys (Figure 4) show that students strongly prefer projects over taking notes, lecture, and in-class discussion. In all surveys with both classes that compared some form of note taking to doing a project only one student disagreed that they liked notes more than projects. Videos involving severe weather were more popular than the projects, but videos involving global warming issues were not enjoyed. Observations for both classes show more enjoyment during labs than projects, but close to half of students said they preferred the project to the dew point lab. All interviewed indicated that using the outside audience to present their project helped to motivate and deepen their understanding of their respective content. When asked why, students said they didn t want to look like an idiot or confuse the audience
41 34 when they presented or shared their project. It helped to motivate students to be more specific with their project content, in the case of the 4 th graders, because they did not know the content. One student commented that he felt he had a commitment to them. He felt he had to make the book good so they would learn while also making it fun. When asked further about using the elementary students in the project they indicated that it was a good change of scenery from the same old class room activities. Some found it fun to speak with the 4 th graders and said that they really got into their story, while others were nervous and did not want to mess up. Some difficulties from working with the fourth graders were that they provided some feedback that was not helpful. Some students wanted jokes integrated into the book and the student who interviewed found it difficult to find and use jokes in his book. Observing him create his book showed that he got it in his head that he had to make a joke book causing him and his partner to differ in opinion resulting in stress and difference of opinion among them. It was difficult for some groups to receive feedback on their books from the 4 th graders indicating that they did not make sense or did not understand their book. One student observed that one of the fourth graders was not giving good feedback for any of the books. observations upon grading the books show that this fourth grader was right in many cases. The majority of the books were poorly put together, not much effort was put into much of the work, and many stories just did not flow well. Using people from the community to present global warming issues yielded very positive results from interviews, surveys, observations, and post test gains scores. Students indicated that they felt more drive by using community members for presentations. When asked why the panel was better than using regular students in class
42 35 they said that there were less people making it easier than in front of a class. Other factors from using classmates to present to are that they can make you laugh, are unfocused, and it is not realistic. One student commented that using the community panel made it feel that it was a more serious line of work. Another said it was more meaningful because they experience it in their jobs first hand and usually when you are presenting to a class you do not care, but with the panel coming in they wanted to know the material better. When surveyed regarding whether students prefer presenting to the community panel compared to me or the class 63% said they agree that using the community panel was better. The same amount of students also said that using the community helped them create a better and more in depth power point presentation than just presenting to the class or a regular teacher. Using an outside audience produced various caveats during the course of the project. One student surveyed said that he would like more time developing the project. During the book project two days were used going to the elementary to survey and then present to the students. During the first elementary visit students did not know what to expect and many did not use the results of the survey to incorporate into their story line. Efforts were made to use the rubric, but many struggled to integrate the content into the storyline. The panel project seemed less intense due to the fact that both the students and I are used to PowerPoint presentations. In all but one interview, students agreed that they prefer working in groups and prefer project work rather than the regular instruction I usually provide. Comments to this regard included: it is active; less stressful; you don t have to remember all the material at once; you have time to learn at your own pace and time; and have time to
43 36 think about the content. A shy girl stated that there is support during a presentation when you do not know what to say. When asked why they liked the project more compared to regular teaching methods one student commented: I take more in on projects than regular class because it is more hands on and have to work with it. Students were allowed to choose their partners and all interviewed had positive remarks. Weather project students said that they were not worried about their partner, already had a connection, got along, got more done, caught mistakes, and that it was easier to create an idea. Students involved in the panel project presentation commented that they could share the work load and get it done quicker while learning at the same time. One student mentioned that they knew with the partner they chose that they were going to get it done, and because they were picky people they could talk to each other and form a better presentation. Another indicated that they already had a connection, got along, and that they were not worried about their partner. Alternatively, some students had some issues with their partners and had some issues to resolve. One student said that he thought his partner would help more, but was gone a lot and did not help. He owned up to his mistake and said that he would be more selective in choosing a partner next time. Other groups had one person doing the work while others failed to turn it in until two weeks after the due date. When asked what could be done better to keep group members more accountable, mention was made that I could have given group members a specific role during the project. Others stated that they would like a time limit on the rough draft that was to be turned in. In going from weather project to climate panel project I found myself correcting many mistakes that I had made on the first project. I better informed them of
44 37 deadlines with a printed calendar showing project due dates and better utilized the peer review system for the PowerPoint. Most importantly, I specifically sat down with each group and went through the rubric and their PowerPoint and found areas I thought they could do better. I feel that this aspect helped students to produce a more thorough presentation with deeper and better content compared to the book project in which I did not provide this aspect. PBL and Assessment. My third question was to determine if a project alone can be used as the major assessment tool during the unit rather than a summative test. Plotting test scores against rubric scores indicate a weak correlation for both classes. A scatter plot for each class compared the posttest scores within their respective unit in which they had a rubric score for their project. The plots show an R value of 0.16 for the book project and 0.28 for the panel project indicating a weak correlation.
45 Book Project Score (%) Rubric Score (%) Climate Project Treatment Group y = x R² = Climate Post Test (%) 105 Weather Project Treatment Group y = x R² = Weather Post Test (%) Figure 5. Correlation of posttest scores to project rubric scores, (N=41).
46 39 I further broke down each class and their respective rubric score to try to better answer the question and provide more feedback (Table 4). I wanted to see if a good score on the test yielded a good score on the rubric or if a poor test score showed a poor rubric score. I used two different percentage scales and found exactly the same results. When a rubric score and test score were both within the same range I determined it to be a positive correlation. Table 4 Comparison of Posttest and Project Rubric Scores (N=41) Posttest vs. Rubric Score Rubric vs. Post Test Scores (Scale 1) Rubric vs. Post Test Scores (Scale 2) Good Score % Good % Mid-Range Score 50-74% Mid-range 51-79% Poor Score 49% & below Poor 50% & below # of Students % of students # of Students % Students Poor/Poor 8 20% Poor/Poor 8 20% Mid/Mid 7 17% Mid/Mid 9 22% Good/Good 6 15% Good/Good 4 10% Positive Correlation 21 51% 21 51% Poor/Good 4 10% Poor/Good 1 2% Poor/Mid 9 22% Poor/Mid 10 24% Mid/Good 7 17% Mid/Good 9 22% Poor or No Correlation 20 49% 20 49% Only 51% of the time (N=41) did both scores show a positive correlation. Twenty percent of the time did a poor test score yield a poor rubric score, compared to 12.5% good versus good. This indicates a slightly better predictor that those who score poorly on the test will also score poorly on the rubric. For the climate project the students who
47 40 had the top ten scores on the rubric also scored 70% or better on the climate portion of the post test. The top eight students for the book project ranged from 82% to 35% on the weather portion of the test showing a very poor relationship between project to rubric grade. Seven students from the panel project and nine students from the book project all had a difference of 20% or more between their rubric or test score from their respective unit post test. Five of those students had a discrepancy of 30% or greater. Even with a late penalty for students who did the weather project, all test scores were lower than the project rubric score. Better indicators of test outcomes seem to be engagement during a project, and achievement level or yearly average grade. INTERPRETATION AND CONCLUSION This study provides evidence that PBL can enhance understanding of science concepts more than current instructional strategies. PBL provides students with motivation to understand science concepts deeper than regular teaching methods alone. The type of project, project design, project implementation, engagement level, use of scaffolding, and achievement level of students will determine the success of posttest gains and what is retained. Projects; coupled with regular instruction; if done right, can engage, deepen content knowledge, and provide students a unique learning experience that regular instruction alone can not reach. Quantitative and Qualitative data show that the climate project class exceeded the weather project class in almost every aspect. They had higher gains scores on both post test sections and did not even do the weather project. Levels of engagement during the project was a big factor for the learning discrepancy between the two classes. Engagement determined the success on the project scores, and the gains scores during the
48 41 use of PBL. The majority of students that scored low on both the posttest and the project rubric were the students that were unengaged during the project. When they were engaged many of these students fell victim to the problem encountered by Baron et al. (1998) where they got caught doing the activity rather than doing it to understand the science content involved. Many weather project students were frantically making up for squandered time and they were solely focused on the look of the weather book rather than the science content behind it, and a well developed storyline. Observations and post test scores indicate that higher-achieving students who are more engaged in projects achieved higher gains scores. Lower-level students tend to be more distracted, are engaged less, and through doing a project show lower gains scores than their counterpart. Similar to the study concerning contextualization and engagement, students who were observed to engage more in the driving questions of the project received higher gains scores (Rivet & Krijcek, 2008). This has taught me the value of overseeing and getting students engaged in every aspect of the project and throughout any learning activity. In the book project I realized what Kanter (2010) meant when he stated that the way PBL is designed can cause tension between the doing and the learning (p. 529). The nature of the projects and project design influenced the gains from the two different project classes. All students who did the climate project showed at least some gain for the climate portion of the posttest. Only 74% of the weather project students who took the weather posttest showed gains on the test for their respective project. The climate project was more all encompassing than the weather project. Everyone had the same rubric and same expectations so there was less confusion than the book project. The climate project
49 42 contained elements of review from each aspect of regular instruction integrated into it. The discussion web helped to focus students daily on the driving question. Creating a PowerPoint presentation was also more familiar to the students than writing a children s book as well as being not quite as cognitively challenging for the age of students involved. The weather project did not contain the same elements and was fragmented in regards to focusing on more specific content from the weather unit. This was the first time doing the weather book project, but I have done the climate project for the last five years. I planned to use the peer review for the weather project as a form of review where other students could read content from the different topics. This was designed poorly and due to such a large portion of students being unprepared they did not have an opportunity to review all the different aspects of weather that I had assigned. Peer review for the climate project was better integrated and worked well due to a change in my approach from the first project to the second. Students used it to make corrections and improvements to their presentations. They had more time and I was able to individually meet with each group to provide the needed scaffolding for the success of this project as explained by Baron et al. (1998). Low-achieving students did not benefit as much from project work and need extra attention during the project process. Scaffolding efforts that helped were the use of the discussion web to guide students during conventional instruction. Students were able to compare the natural and human causes of climate change and were able to see the driving question for the project daily. It also helped to sit down with the students and examine the rubric noting where they could make needed corrections. Use of a knowledge rating
50 43 as a test review and annotating it helped a student with learning disability receive the top score in the climate project class. The presence of a para-educator in the climate project class helped to spread the work load and yielded better gains scores and higher rubric scores. More importantly it helps keep students engaged and provides support when one teacher is spread thin. Answering the question of PBL motivating students to learn more than current methods provided mixed results. Survey and Interview results indicate that close to two thirds of students enjoyed the projects they were involved in. When asked if weather project students felt the project actually helped to deepen their understanding only 32% said that it helped. This finding matches their gains score as well as observations during the course of the project. Surveys show that in every instance almost 90% of the time they enjoy doing a project compared to taking notes. They liked interacting with others and working with other people whether it be classmates, fourth graders, or people from the community. The book project was more stressful for me and the students. I felt the students did not take ownership in the project and looked at it as something they had to do rather than a project that would help them learn and understand the science content. It was difficult to get students motivated to get the product finished in the timeline allotted. I was surprised to see that these students surveyed and interviewed found the book project more enjoyable than regular instruction because of the negative observations and feelings during the project and even after the project ended. The weather project matched findings by Filippatou & Kaldi (2010) where students were engaged behaviorally and motivationally, but not cognitively. Students enjoyed interacting with the fourth graders, and their group members but it was more
51 44 social than cognitive. I could have been more specific in instructions to provide a storyline with content before worrying about pictures and the frills of the book. A firm timeline with due dates for rough drafts and final drafts would have helped keep students more accountable and help guide with the cognitive aspect. All surveys, interviews, and observations, and gains indicate that understanding occurred on a deeper level more than just providing regular instruction for the project involving the community panel. These results matched those produced by Lee (2015), and Baron et al. (1998) in that the students put more thought into their presentation due to the real world aspect. The members of the community were able to interact with the students and they were able to learn from each other. I was free to observe and evaluate the effectiveness that the project had upon the understanding of students more than if I had to grade each aspect of the presentation. I felt as though I was more of a guide helping the students prepare for their presentation rather than just an authoritative evaluator of their final presentation. Higher achieving students seem to be more motivated to learn and the use of a project helps to deepen their understanding more than regular instruction alone. Two students showed negative gains scores on posttests for which they did not do a project. The same two students showed major growth on the post test in which the project was done. Both students were high-achieving students and their gains scores were among the highest in their class showing again that PBL works well to deepen content knowledge for these students. Quantitative and qualitative data show a weak correlation between using the artifacts and projects in place of a summative test. Using the two scores is useful in that
52 45 many times the higher the score on the rubric the more likely the student will score higher on the post test. This does not necessarily mean that they will show higher gains scores by using a project. Nine percent of students had posttest scores that were poor while the rubric was score good or visa versa. Only about half the time will a student s scores on both show a direct relationship of good to good, or poor to poor. In assessing content knowledge when using projects there should be both a grading rubric for the project as well as a summative assessment. This will keep all students more accountable during the PBL process. VALUE Common themes of PBL found in literature highly correlate to the use of PBL in my classroom. Project design, driving questions, use of an external audience, and engagement of students all combine to influence outcomes involved with understanding. Kanter (2010) states that the way PBL curricula is designed can cause tension between the doing and the learning (p. 529). Baron et al. (1998) explain that many get caught up in the doing of an activity or project rather than doing with understanding (p. 273). I feel that both projects fell right in line with both statements. The climate project was driven by the idea that they would have to speak with an outside audience and have to justify their position concerning global warming. This helped them to focus on doing the project while also understanding the science content. They also had a more direct and simple driving question. The book project got caught in the doing of the project and were hung up so much on how to integrate the weather content with an easy and fun to read story that it caused tension between the project and the learning of the project content. The driving question was different for each group and I could have done a better job of
53 emphasizing it. 46 I have done projects in the past, but not to the extent of which I have been involved in with this research project. A major help to my teaching strategies and which I have already integrated into my practice is the use of observations. More specifically noting engagement during all learning activities. We are currently in the process of implementing standards based grading into our school and observations have been a big factor weighing on my mind when contemplating using the system. I see observational data as a key to making the shift. My fear is that the students will see assignments, labs, and projects as unimportant and will not put as much effort into them if they are not used in their grade. Alternatively, I am fed up with students so worried about an assignment and doing the assignment that they cheat, copy, and think that because assignments are handed in that it relates to learning the science content. I plan to use the results of this study to research further the use of observing engagement during learning activities and somehow experimenting with using those observations to drive me to help students further engage in the science content. I see value in using these observations to keep students accountable for their learning, and use these observations when students have concerns about their grades or scores on assessments. Many students will want to retake a test without having to meet with me and find where they are lacking. With these observations I can use them to show how their engagement influences their test scores. During instances where parents may have issues I can turn to these observation data to explain why. Great gains were made in using the community panel and have found great value in using them to help in grading. I tried using another teacher to help in grading another
54 47 presentation in a different class and it just did not mean much to the students. Statements made during interviews and just before presenting helped to motivate me to want to use them more in the future. It took some work to get schedules arranged and set up, but helped to free me to listen more closely to the content they were presenting and the way that they were presenting. Instead of me focusing on making a judgment for each part of the rubric I was able to note some observations as to who seemed to really understand the climate content. I could just kick back and enjoy the fruits of all our labors. In the book project we used a personal and group evaluation sheet where students rated themselves and their group members. Some group members gave each other a perfect score even when it was observed they did not get along or had issues during the course of the project. There were some who were really hard on themselves and not their group members, while others gave themselves a much higher score than they deserved. Interviews helped me see the value of using group members rate themselves and their group members on a simpler scale of one to ten. I asked them why they rated themselves and their partners the way they did and each time their statement matched their observations. One student said that he should get a ten while his partners got a seven because he did all the work. Another student rated himself as a five and his partner as a seven because he did not feel he did a lot. This showed me that students are quite frank and honest when asked about the work they do and are cognizant of their behavior in group work when interviewed. Creating two projects at the same time proved very stressful and time consuming. I learned that when a large project is planned and implemented there should be a smaller introductory project to help build up to the more complex one. Teacher motivation and
55 48 student motivation is a big factor when using PBL. One must weigh the benefits of the project to the sanity of both the teacher and the class. Motivating students to work on a project is simple, especially when they get to choose their own group. Motivating students to deepen their understanding of content is a different story. Engaging students in PBL so that they learn and learn well takes practice, time, and patience. I am interested to see if the book project would have better results with a different class. I think with a few adjustments and a different group of students the project would produce far better results. I would also like to see whether the climate project would help the lower achieving class more than the book project did. One question I have wondered is what the gains would have been for the book project class had they not done the project. Maybe they would have fewer gains. I would also like to know how they would have done had they took the post test right after the project rather than wait until after the climate project. I would like to investigate what learning gains would occur if I went completely to PBL without any direct instruction. This would help to alleviate the time factor that is involved in class discussion, lecture, and various activities.
56 49 REFERENCES CITED
57 50 Barak, M., & Zadok, Y. (2009). Robotics Projects and Learning Concepts in Science, Technology and Problem Solving. International Journal Of Technology And Design Education, 19(3), Barron, B. J. S., Schwartz, D. L., Vye, N. J., Moore, A., Petrosino, A., Zech, L., & Bransford, J. D. (1998). Doing with understanding: Lessons from research on problem- and project-based learning. Journal of the Learning Sciences, 7(3-4), Colley, K. (2008). Project-Based Science Instruction: A Primer--An Introduction and Learning Cycle for Implementing Project-Based Science. Science Teacher, 75(8), Filippatou, D., & Kaldi, S. (2010). The Effectiveness of Project-Based Learning on Pupils with Learning Difficulties Regarding Academic Performance, Group Work and Motivation. International Journal Of Special Education, 25(1), Kanter, D. E. (2010). Doing the Project and Learning the Content: Designing Project- Based Science Curricula for Meaningful Understanding. Science Education, 94(3), Krajcik, J. S., Blumenfeld, P. C., Marx, R. W., Bass, K. M., Fredericks, J., & Soloway, E. (1994). A Collaborative Model for Helping Middle Grade Science Teachers Learn Project-Based Instruction. Elementary School Journal, 94(5), Krajcik, J., Blumenfeld, P. C., Marx, R. W., Bass, K. M., Fredericks, J., & Soloway, E. (1998). Inquiry in project-based science classrooms: Initial attempts by middle school students. Journal of the Learning Sciences, 7(3-4), Lee, Y. M. (2015). Project-Based Learning Involving Sensory Panelists Improves Student Learning Outcomes. Journal Of Food Science Education, 14(2), Liu, M., & Hsiao, Y. (2001). Middle school students as multimedia designers: A projectbased learning approach. Journal of Interactive Learning Research, 13(4), Markham, T. Larmer, J., & Ravitz, J. (2003). A Guide to Standards-Focused Project Based Learning for Middle and High School Teachers. Oakland, California: Wilsted & Taylor Publishing Services. Rivet, A. E., & Krajcik, J. S. (2008). Contextualizing Instruction: Leveraging Students' Prior Knowledge and Experiences to Foster Understanding of Middle School Science. Journal Of Research In Science Teaching, 45(1),
58 51 Schneider, R. M., Krajcik, J., Marx, R. W., & Soloway, E. (2002). Performance of Students in Project-Based Science Classrooms on a National Measure of Science Achievement. Journal Of Research In Science Teaching, 39(5), Sherwood, R., Kinzer, C.K., Bransford, J.D.,&Franks, J.J. (1987). Some benefits of creating macro-contexts for science instruction: Initial findings. Journal of Research in Science Teaching, 24, Short, H., Lundsgaard, M. V., & Krajcik, J. S. (2008). How Do Geckos Stick?. Science Teacher, 75(8), Stolk, J., & Harari, J. (2014). Student Motivations as Predictors of High-Level Cognitions in Project-Based Classrooms. Active Learning In Higher Education, 15(3), Tal, T., Krajcik, J. S., & Blumenfeld, P. C. (2006). Urban schools' teachers enacting project-based science. Journal of Research in Science Teaching, 43(7), Tiwari, A., Lai, P., So, M., & Kwan, Y. (2006). A comparison of the effects of problembased learning and lecturing on the development of students' critical thinking. Medical Education, 40(6), doi: /j x
59 52 APPENDICES
60 53 APPENDIX A FOURTH GRADE BOOK PROJECT
61 54 Earth Science: Weather Unit 4 th Grade Book Project Driving Question: How can we create a 4 th grade book that can teach Severe Weather (Thunderstorms, Tornadoes, Hurricanes, and El Nino), Air Masses & Fronts to 4 th graders in a meaningful way? 1. Groups of 2-3 a. Even numbered groups: Severe weather (T-storms, Tornadoes, Hurricanes, and El Nino). i. Must find a way to integrate the conditions that give rise to these severe weather phenomenon and how low/high pressure is related. b. Odd numbered groups: Fronts & Air Masses (Cold, Warm, Occluded, and Stationary). i. Must find a way to integrate a diagram and be able to describe two different fronts in the book as well as how low/high pressure is related. 2. Criteria: See attached handout with grading rubric th Grade Quick visit: 1 member from each group will go to the 4 th grade class that will be reading your book. You will give a survey that will find out a little about what students are reading and if they know certain weather concepts that you will be writing about. While with 4 th Graders: We will have the class in groups where you will give them a survey and then you will take a couple minutes talking with them about what they like to read and make a couple notes that will help you create your book. 4. Book Creation: You will have 2 and ½ class periods to create the book and develop it. You will have to use time at home to work on different aspects to make it work. a. Story line and typed text before pictures/diagrams! b. Illustrations: create/draw your own or use printed ones. Be sure to reference them at the end of the book! c. Refer to your plot/book helps given to create a good story. 5. Peer Review (½ class period): Each group will spend time critiquing another groups book via the grading rubric th Grade Visit & Book Reading a. Groups will share their book with 4 th graders b. 4 th graders will fill out a simple grading rubric for each book. 7. Final Grade: 1. Content rubric grade, 2. Book rubric grade, 3. 4 th grade survey. 4. Participation self-evaluation & Group evaluation of participation.
62 55 Sample Grading Rubric for Scientific Content: Grading Criteria for Severe Weather Conditions No conditions are discussed 1 condition is discussed Most conditions are discussed All conditions discussed Mentioned and Mentioned explained and explained somewhat in depth. Not mentioned Briefly Mentioned and Mentioned mentioned or explained in and explained poorly covered some detail in depth. ************ ************ ************* *********** *** *** *** *** giving rise. Pressure Not mentioned Briefly mentioned Associated weather ************ *** Grading Criteria for Fronts & Air Masses Air Masses Fronts Weather associated with fronts Pressure No mention of air masses No mention of fronts No mention of weather involved. No mention of pressure One air mass is briefly mentioned One front is briefly mentioned Weather is mentioned briefly in one type of front. Pressure is mentioned briefly Air masses involved are explained in some detail and illustrated. Both fronts are explained in some detail and/or illustrated in book. Weather is explained and illustrated in some detail with both fronts. Pressure is explained in some detail regarding both types of fronts Air masses involved are explained in depth and illustrated. Both fronts are explained in depth and are illustrated in book. Weather is explained and illustrated in detail with both fronts. Pressure is explained in detail regarding both types of fronts
63 56 Grading Criteria for Fronts & Air Masses Air Masses Fronts Weather associated with fronts Pressure No mention of air masses No mention of fronts No mention of weather involved. No mention of pressure One air mass is briefly mentioned front is briefly mentioned, but not explained Weather is mentioned briefly. Pressure is mentioned briefly. Air masses involved are explained in some detail and illustrated. fronts is explained in some detail and/or illustrated in book. Weather is explained and illustrated in some detail. Pressure is explained in some detail or illustrated. Air masses involved are explained in depth and illustrated. front is explained in depth and is illustrated in book. Weather is explained and illustrated in detail. Pressure is explained in detail and illustrated. Cold Front: Cold Air mass moves into Warm Air mass & pushes out of way Weather: 1. Short lived storms or thunderstorms 2. Fast moving 3. Temperatures cool down 4. Windy Low Pressure Warm Front: Warm Air mass moves into cooler air mass & pushes out of way Weather: 1. Long lasting showers/snowstorms 2. Slow moving 3. Temperatures warm 4. Humidity can increase Low Pressure Occluded: Cool air mass pinches out warmer air mass and moves into another cooler air mass. Weather: 1. light, moderate or heavy continuous precipitation or showers 2. Temperatures get cooler 3. Can be slow or fast depending on warm/cold type air masses 4. Lower dew point temps behind 5. Thunderstorms at times. Low Pressure Stationary: Weather: 1. Usually clouds, 2. prolonged precipitation, and 3. storm trains are found there. 4. When there is a lot of water vapor in the warmer air mass,
64 57 significant amounts of rain or freezing rain can occur. 5. Slow moving/not moving. Low Pressure Group Names & Topic: Grading Criteria for Thunderstorm s Conditions giving rise. Pressure Associated weather Grading Rubric for Severe Weather: No conditions are discussed Not mentioned Not mentioned *************** ************** * 1 condition is discussed Briefly mentioned Briefly mentioned or poorly covered ************** * Most conditions are discussed Mentioned and explained somewhat Mentioned and explained in some detail *************** * Thunderstorms: Conditions 1. unstable/rising air 2. Condensation 3. Thunderclouds Pressure: Low Weather Associated 1. Lightning/Thunder 2. Rain/Hail 3. Wind All conditions discussed Mentioned and explained in depth. Mentioned and explained in depth. ************* * Tornadoes: Conditions 1. unstable/rising air 2. Condensation 3. Thunderclouds 4. Cool dry air mass meeting warm moist air mass 5. Rotating air column Pressure: Low Weather Associated 1. Lightning/Thunder 2. Rain/Hail 3. High Speed Wind 4. Tornado/twisters
65 58 Hurricanes: Conditions 1. unstable/rising air 2. Condensation 3. Thunderclouds 4. Warm Ocean Water 5. Rotating Clouds/Trade winds 6. Coriolis deflects winds & rotates Pressure: Low Weather Associated 1. Lightning/Thunder 2. Excessive Rain 3. High Speed Wind 4. Storm Surge 5. Eye: calm/no wind 6. Flooding El Nino: Conditions 1. Trade winds weaken/reverse 2. Warm pile of warm water moves to East Pacific Pressure: 1. Low in South America 2. High in Australia & West Pacific Weather Associated South America: 1. Rain 2. Mudslides 3. Intensified storms/hurricanes 4. Upwelling stops/poor fishing off Peru coast North America: 1. Warmer than usual winters 2. Wetter than normal in places. 3. Flooding in California Australia/West Pacific: 1. Dryer than normal 2. Drought 4 th grade book introduction survey: Place a check in the column that best answers the question. Survey Questions Yes No 1. I like to read? 2. I like pictures in books that I read? 3. I like to read books with big words? 4. I know what air pressure means? 5. I know what an air mass is when speaking about weather? 6. I know what a front is when speaking about weather? 7. I know what causes thunderstorms? 8. I know what causes tornadoes?
66 59 9. I know what causes hurricanes? 10. I know what El Nino is? Write any other ideas you have that would make an interesting book about weather. 4th Grading Survey Book Title: Book Authors: Survey Questions Yes No 1. I liked this book? 2. This book made sense to me and was not confusing? 3. I understood the story? 4. I learned something new about weather by reading the book? 5. I liked the pictures and diagrams in the book? *************************************************** *********** What was one thing you liked about the book? ******* ** ******* ** What is one thing you thought could be better about the book?
67 60 APPENDIX B CLIMATE PANEL PRESENTATION PROJECT
68 61 Climate Change Panel Presentation Objective: Understand the issues involving Global Climate change. We will understand natural causes and human causes for climate change. Groups will present to members of the community and be able to defend position regarding the question: Are humans causing Global Warming? Presentation Guidelines 1. Create a Power point or Prezi presentation 2. Groups of 2 or 3 3. Each member of group must take part in presentation 4. Content of Power point: a. Consequences of Global Climate Change (What is happening today?) i. Sea level Rise & its implications ii. Ocean acidification iii. Desertification iv. Habitat loss v. Other? b. Past/Present Climate Change i. Present what has happened since the dawn of time via the geologic record. ii. Present data as to what is happening today with climate change and data from ice cores, tree rings, pollen, and alpine glaciers. c. Present Natural and Human causes for climate change. d. Introduce the question: Are humans causing Global Warming? e. Propose your position to the question of human causes vs. natural and be able to justify it with data! f. Q & A period from community panel. 5. You have 3 class periods to prepare presentation. a. Produce some cue cards to help you present so you know exactly who is presenting which part. b. Graphs, Data, Images etc. obtained must be referenced & used from credible sources.
69 62 Sample Grading Rubric for Science Content: Grading Criteria for Content Sea Level Rise Not mentioned Briefly mentioned Ocean Acidification Desertification Habitat Loss Other consequences. Geologic Record & Past Climate Change Data Present Day Climate Change Data Not mentioned Not mentioned Not mentioned Not mentioned Not mentioned No mention Briefly mentioned Briefly mentioned or poorly covered Briefly mentioned Briefly mentioned Briefly mention that climate has changed in the past. Briefly mentioned. Data from 1 of 4 sources is presented (ice cores, tree Mentioned and explained somewhat. 1 example given. Mentioned and explained somewhat. 1 example of implications to habitat. Mentioned and explained in some detail. 1 example given. Mentioned and explained somewhat. 1 Example given. Mentioned and explained somewhat Mentioned and explained somewhat. Brief mention of geologic record. Data is shown, but not explained Data mentioned and explained in some detail. Data from 2 of 4 sources is presented (ice Mentioned and explained in depth. Examples given. Mentioned and explained in depth. Examples of implications to habitat. Mentioned and explained in depth. Examples of where it happens. Mentioned and explained in depth. Examples explained Mentioned and explained in depth. Geologic record is explained in depth. Data is shown and explains relationship to climate change over time. Data shows trends occurring today, and students explain in
70 63 rings, pollen, and alpine glaciers.) cores, tree rings, pollen, and alpine glaciers.) depth what the data means. Data from ice cores, tree rings, pollen, and alpine glaciers is present Natural Causes of Climate Change discussed. Human Causes of Global Warming discussed. Question posed: Are Humans Causing Global Warming? Group position on global warming discussed. Question 1: No mention No mention No mention No mention Question not answered Briefly mentions 1 or 2. Milankovitch cycle, solar fluctuations, plate tectonics forest fires etc. Briefly mentioned but not explained. Position stated but not explained. Backed by one piece of data/evidence. Question briefly answered to author s liking Mentions 2 or 3 natural causes and explained in some detail. 1 or 2 Human causes are presented and explained in some detail. Position stated and explained in some detail. Backed by one or two pieces of evidence. Question answered in some detail and data is mentioned. Milankovitch, Solar Fluctuations, and Plate Tectonics all discussed in detail and others are mentioned. 3 Human causes are presented and Fossil Fuel use is explained in detail. Mentioned Position stated and explained in detail as well as data. Backed by at least 3 pieces of evidence and evidence used justifies position well. Question answered in detail and data used to support answer.
71 Question 2: Question not answered 64 Question briefly answered to author s liking Question answered in some detail and data is mentioned. Question answered in detail and data used to support answer. Presentation Grading All participate and knowledgeable person dominates presentation 1 person does ¾ of the presentation while partner does 1/4 All present, but one is knowledgeable and appears to understand while other group members show inadequate knowledge during presentation or questioning. All present and show understanding during presentation and during questions asked. Overall Powerpoint flow, text, and graphic features Spelling & grammar Poorly created presentation with little or no data. Background clashes with text and data. Too much text. Presentation is plagued with errors Presentation has a few issues with the flow. Background clashes at times with text and graphics. Could use less text in places. Presentation has errors every other slide. throughout. Works Cited No citations 1 or 2 citations and mostly search engines cited rather than correct web pages. Presentation mostly flows well, has almost the right amount of text, background works ok with text and graphics. Presentation has a couple errors Citations present but have a few search engines cited or not correctly done. Presentation flows well, has the right amount of text, background works well with text and graphics. No noticeable errors Citations present and cited correctly.
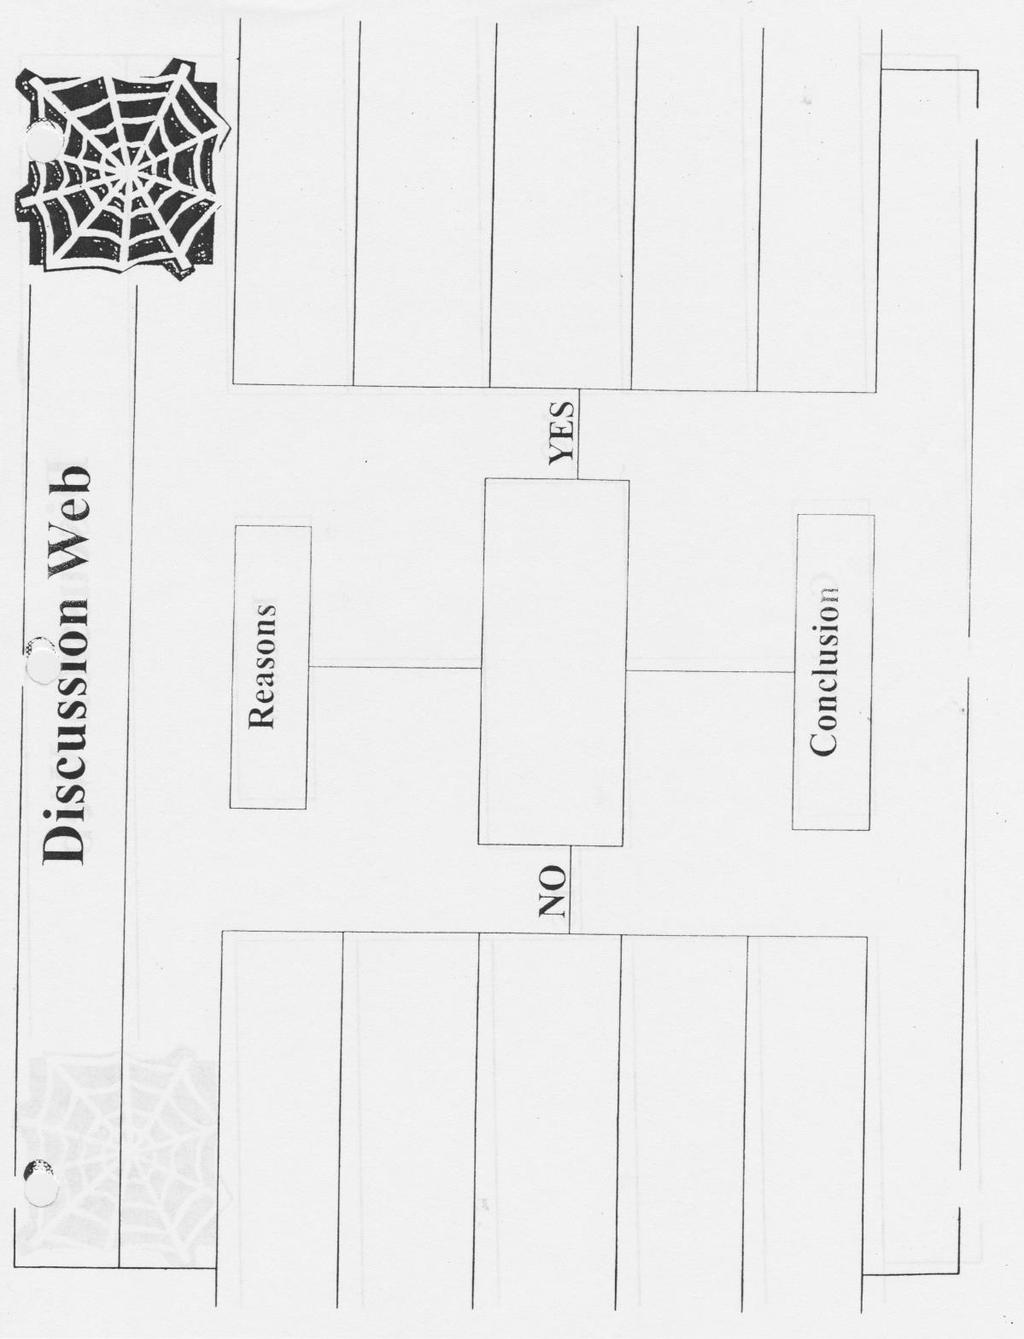
72 65
EQuIP Review Feedback
 EQuIP Review Feedback Lesson/Unit Name: On the Rainy River and The Red Convertible (Module 4, Unit 1) Content Area: English language arts Grade Level: 11 Dimension I Alignment to the Depth of the CCSS
This Performance Standards include four major components. They are
 Environmental Physics Standards The Georgia Performance Standards are designed to provide students with the knowledge and skills for proficiency in science. The Project 2061 s Benchmarks for Science Literacy
Calculators in a Middle School Mathematics Classroom: Helpful or Harmful?
 University of Nebraska - Lincoln DigitalCommons@University of Nebraska - Lincoln Action Research Projects Math in the Middle Institute Partnership 7-2008 Calculators in a Middle School Mathematics Classroom:
A Pilot Study on Pearson s Interactive Science 2011 Program
 Final Report A Pilot Study on Pearson s Interactive Science 2011 Program Prepared by: Danielle DuBose, Research Associate Miriam Resendez, Senior Researcher Dr. Mariam Azin, President Submitted on August
1. Locate and describe major physical features and analyze how they influenced cultures/civilizations studied.
 Unit Plan 8th Grade Geography Ciara Timothy SOST 450- Professor Johnson 2.22.2012 Contents: 1. Student Handout 2. Day to Day Outline 3. MN Graduation Standards and Benchmarks 4. Differentiated for Content,
George Mason University Graduate School of Education Program: Special Education
 George Mason University Graduate School of Education Program: Special Education 1 EDSE 590: Research Methods in Special Education Instructor: Margo A. Mastropieri, Ph.D. Assistant: Judy Ericksen Section
IS FINANCIAL LITERACY IMPROVED BY PARTICIPATING IN A STOCK MARKET GAME?
 21 JOURNAL FOR ECONOMIC EDUCATORS, 10(1), SUMMER 2010 IS FINANCIAL LITERACY IMPROVED BY PARTICIPATING IN A STOCK MARKET GAME? Cynthia Harter and John F.R. Harter 1 Abstract This study investigates the
Distributed Weather Net: Wireless Sensor Network Supported Inquiry-Based Learning
 Distributed Weather Net: Wireless Sensor Network Supported Inquiry-Based Learning Ben Chang, Department of E-Learning Design and Management, National Chiayi University, 85 Wenlong, Mingsuin, Chiayi County
Carolina Course Evaluation Item Bank Last Revised Fall 2009
 Carolina Course Evaluation Item Bank Last Revised Fall 2009 Items Appearing on the Standard Carolina Course Evaluation Instrument Core Items Instructor and Course Characteristics Results are intended for
Improving Conceptual Understanding of Physics with Technology
 INTRODUCTION Improving Conceptual Understanding of Physics with Technology Heidi Jackman Research Experience for Undergraduates, 1999 Michigan State University Advisors: Edwin Kashy and Michael Thoennessen
Just in Time to Flip Your Classroom Nathaniel Lasry, Michael Dugdale & Elizabeth Charles
 Just in Time to Flip Your Classroom Nathaniel Lasry, Michael Dugdale & Elizabeth Charles With advocates like Sal Khan and Bill Gates 1, flipped classrooms are attracting an increasing amount of media and
Supporting Students Construction of Scientific Explanation through Generic versus Context- Specific Written Scaffolds
 Supporting Students Construction of Scientific Explanation through Generic versus Context- Specific Written Scaffolds Katherine L. McNeill and Joseph Krajcik University of Michigan contact info: Center
ENVR 205 Engineering Tools for Environmental Problem Solving Spring 2017
 ENVR 205 Engineering Tools for Environmental Problem Solving Spring 2017 Instructor: Dr. Barbara rpin, Professor Environmental Science and Engineering Gillings School of Global Public Health University
Running head: DEVELOPING MULTIPLICATION AUTOMATICTY 1. Examining the Impact of Frustration Levels on Multiplication Automaticity.
 Running head: DEVELOPING MULTIPLICATION AUTOMATICTY 1 Examining the Impact of Frustration Levels on Multiplication Automaticity Jessica Hanna Eastern Illinois University DEVELOPING MULTIPLICATION AUTOMATICITY
Developing an Assessment Plan to Learn About Student Learning
 Developing an Assessment Plan to Learn About Student Learning By Peggy L. Maki, Senior Scholar, Assessing for Learning American Association for Higher Education (pre-publication version of article that
Scoring Guide for Candidates For retake candidates who began the Certification process in and earlier.
 Adolescence and Young Adulthood SOCIAL STUDIES HISTORY For retake candidates who began the Certification process in 2013-14 and earlier. Part 1 provides you with the tools to understand and interpret your
INSTRUCTIONAL FOCUS DOCUMENT Grade 5/Science
 Exemplar Lesson 01: Comparing Weather and Climate Exemplar Lesson 02: Sun, Ocean, and the Water Cycle State Resources: Connecting to Unifying Concepts through Earth Science Change Over Time RATIONALE:
Unpacking a Standard: Making Dinner with Student Differences in Mind
 Unpacking a Standard: Making Dinner with Student Differences in Mind Analyze how particular elements of a story or drama interact (e.g., how setting shapes the characters or plot). Grade 7 Reading Standards
Lesson 1 Taking chances with the Sun
 P2 Radiation and life Lesson 1 Taking chances with the Sun consider health benefits as well as risks that sunlight presents introduce two ideas: balancing risks and benefits, reducing risks revisit the
Proficiency Illusion
 KINGSBURY RESEARCH CENTER Proficiency Illusion Deborah Adkins, MS 1 Partnering to Help All Kids Learn NWEA.org 503.624.1951 121 NW Everett St., Portland, OR 97209 Executive Summary At the heart of the
Inquiry Learning Methodologies and the Disposition to Energy Systems Problem Solving
 Inquiry Learning Methodologies and the Disposition to Energy Systems Problem Solving Minha R. Ha York University minhareo@yorku.ca Shinya Nagasaki McMaster University nagasas@mcmaster.ca Justin Riddoch
Rendezvous with Comet Halley Next Generation of Science Standards
 Next Generation of Science Standards 5th Grade 6 th Grade 7 th Grade 8 th Grade 5-PS1-3 Make observations and measurements to identify materials based on their properties. MS-PS1-4 Develop a model that
Indiana Collaborative for Project Based Learning. PBL Certification Process
 Indiana Collaborative for Project Based Learning ICPBL Certification mission is to PBL Certification Process ICPBL Processing Center c/o CELL 1400 East Hanna Avenue Indianapolis, IN 46227 (317) 791-5702
Computer Science and Information Technology 2 rd Assessment Cycle
 Assessment of Student Learning Computer Science and Information Technology 2 rd Assessment Cycle 2012-2015 Assessment Plan Background Introduction to Computers and Information Processing provides students
Teaching a Laboratory Section
 Chapter 3 Teaching a Laboratory Section Page I. Cooperative Problem Solving Labs in Operation 57 II. Grading the Labs 75 III. Overview of Teaching a Lab Session 79 IV. Outline for Teaching a Lab Session
Facing our Fears: Reading and Writing about Characters in Literary Text
 Facing our Fears: Reading and Writing about Characters in Literary Text by Barbara Goggans Students in 6th grade have been reading and analyzing characters in short stories such as "The Ravine," by Graham
Coimisiún na Scrúduithe Stáit State Examinations Commission LEAVING CERTIFICATE 2008 MARKING SCHEME GEOGRAPHY HIGHER LEVEL
 Coimisiún na Scrúduithe Stáit State Examinations Commission LEAVING CERTIFICATE 2008 MARKING SCHEME GEOGRAPHY HIGHER LEVEL LEAVING CERTIFICATE 2008 MARKING SCHEME GEOGRAPHY HIGHER LEVEL PART ONE: SHORT-ANSWER
Practices Worthy of Attention Step Up to High School Chicago Public Schools Chicago, Illinois
 Step Up to High School Chicago Public Schools Chicago, Illinois Summary of the Practice. Step Up to High School is a four-week transitional summer program for incoming ninth-graders in Chicago Public Schools.
Syllabus Fall 2014 Earth Science 130: Introduction to Oceanography
 Syllabus Fall 2014 Earth Science 130: Introduction to Oceanography Background Information Welcome Aboard! These guidelines establish specific requirements, grading criteria, descriptions of assignments
What is PDE? Research Report. Paul Nichols
 What is PDE? Research Report Paul Nichols December 2013 WHAT IS PDE? 1 About Pearson Everything we do at Pearson grows out of a clear mission: to help people make progress in their lives through personalized
Student Support Services Evaluation Readiness Report. By Mandalyn R. Swanson, Ph.D., Program Evaluation Specialist. and Evaluation
 Student Support Services Evaluation Readiness Report By Mandalyn R. Swanson, Ph.D., Program Evaluation Specialist and Bethany L. McCaffrey, Ph.D., Interim Director of Research and Evaluation Evaluation
THE PENNSYLVANIA STATE UNIVERSITY SCHREYER HONORS COLLEGE DEPARTMENT OF MATHEMATICS ASSESSING THE EFFECTIVENESS OF MULTIPLE CHOICE MATH TESTS
 THE PENNSYLVANIA STATE UNIVERSITY SCHREYER HONORS COLLEGE DEPARTMENT OF MATHEMATICS ASSESSING THE EFFECTIVENESS OF MULTIPLE CHOICE MATH TESTS ELIZABETH ANNE SOMERS Spring 2011 A thesis submitted in partial
AC : DEVELOPMENT OF AN INTRODUCTION TO INFRAS- TRUCTURE COURSE
 AC 2011-746: DEVELOPMENT OF AN INTRODUCTION TO INFRAS- TRUCTURE COURSE Matthew W Roberts, University of Wisconsin, Platteville MATTHEW ROBERTS is an Associate Professor in the Department of Civil and Environmental
Statistical Analysis of Climate Change, Renewable Energies, and Sustainability An Independent Investigation for Introduction to Statistics
 5/22/2012 Statistical Analysis of Climate Change, Renewable Energies, and Sustainability An Independent Investigation for Introduction to Statistics College of Menominee Nation & University of Wisconsin
Stakeholder Debate: Wind Energy
 Activity ENGAGE For Educator Stakeholder Debate: Wind Energy How do stakeholder interests determine which specific resources a community will use? For the complete activity with media resources, visit:
Examining the Structure of a Multidisciplinary Engineering Capstone Design Program
 Paper ID #9172 Examining the Structure of a Multidisciplinary Engineering Capstone Design Program Mr. Bob Rhoads, The Ohio State University Bob Rhoads received his BS in Mechanical Engineering from The
PEDAGOGICAL LEARNING WALKS: MAKING THE THEORY; PRACTICE
 PEDAGOGICAL LEARNING WALKS: MAKING THE THEORY; PRACTICE DR. BEV FREEDMAN B. Freedman OISE/Norway 2015 LEARNING LEADERS ARE Discuss and share.. THE PURPOSEFUL OF CLASSROOM/SCHOOL OBSERVATIONS IS TO OBSERVE
Enhancing Learning with a Poster Session in Engineering Economy
 1339 Enhancing Learning with a Poster Session in Engineering Economy Karen E. Schmahl, Christine D. Noble Miami University Abstract This paper outlines the process and benefits of using a case analysis
Grade 2: Using a Number Line to Order and Compare Numbers Place Value Horizontal Content Strand
 Grade 2: Using a Number Line to Order and Compare Numbers Place Value Horizontal Content Strand Texas Essential Knowledge and Skills (TEKS): (2.1) Number, operation, and quantitative reasoning. The student
PROFESSIONAL TREATMENT OF TEACHERS AND STUDENT ACADEMIC ACHIEVEMENT. James B. Chapman. Dissertation submitted to the Faculty of the Virginia
 PROFESSIONAL TREATMENT OF TEACHERS AND STUDENT ACADEMIC ACHIEVEMENT by James B. Chapman Dissertation submitted to the Faculty of the Virginia Polytechnic Institute and State University in partial fulfillment
Evidence-based Practice: A Workshop for Training Adult Basic Education, TANF and One Stop Practitioners and Program Administrators
 Evidence-based Practice: A Workshop for Training Adult Basic Education, TANF and One Stop Practitioners and Program Administrators May 2007 Developed by Cristine Smith, Beth Bingman, Lennox McLendon and
Shelters Elementary School
 Shelters Elementary School August 2, 24 Dear Parents and Community Members: We are pleased to present you with the (AER) which provides key information on the 23-24 educational progress for the Shelters
Grade Band: High School Unit 1 Unit Target: Government Unit Topic: The Constitution and Me. What Is the Constitution? The United States Government
 The Constitution and Me This unit is based on a Social Studies Government topic. Students are introduced to the basic components of the U.S. Constitution, including the way the U.S. government was started
Full text of O L O W Science As Inquiry conference. Science as Inquiry
 Page 1 of 5 Full text of O L O W Science As Inquiry conference Reception Meeting Room Resources Oceanside Unifying Concepts and Processes Science As Inquiry Physical Science Life Science Earth & Space
2013 TRIAL URBAN DISTRICT ASSESSMENT (TUDA) RESULTS
 RESULTS") 3 TRIAL URBAN DISTRICT ASSESSMENT (TUDA) RESULTS Achievement and Accountability Office December 3 NAEP: The Gold Standard The National Assessment of Educational Progress (NAEP) is administered in reading
3 TRIAL URBAN DISTRICT ASSESSMENT (TUDA) RESULTS Achievement and Accountability Office December 3 NAEP: The Gold Standard The National Assessment of Educational Progress (NAEP) is administered in reading
Copyright Corwin 2014
 When Jane was a high school student, her history class took a field trip to a historical Western town located about 50 miles from her school. At the local museum, she and her classmates followed a docent
MAR Environmental Problems & Solutions. Stony Brook University School of Marine & Atmospheric Sciences (SoMAS)
") MAR 340-01 Environmental Problems & Solutions Stony Brook University School of Marine & Atmospheric Sciences (SoMAS) This course satisfies the DEC category H This course satisfies the SBC category STAS
MAR 340-01 Environmental Problems & Solutions Stony Brook University School of Marine & Atmospheric Sciences (SoMAS) This course satisfies the DEC category H This course satisfies the SBC category STAS
Student-Centered Learning
 ESSAI Volume 9 Article 32 4-1-2011 Student-Centered Learning Kimberly Overby College of DuPage Follow this and additional works at: http://dc.cod.edu/essai Recommended Citation Overby, Kimberly (2011)
Arizona s English Language Arts Standards th Grade ARIZONA DEPARTMENT OF EDUCATION HIGH ACADEMIC STANDARDS FOR STUDENTS
 Arizona s English Language Arts Standards 11-12th Grade ARIZONA DEPARTMENT OF EDUCATION HIGH ACADEMIC STANDARDS FOR STUDENTS 11 th -12 th Grade Overview Arizona s English Language Arts Standards work together
TASK 2: INSTRUCTION COMMENTARY
 TASK 2: INSTRUCTION COMMENTARY Respond to the prompts below (no more than 7 single-spaced pages, including prompts) by typing your responses within the brackets following each prompt. Do not delete or
Study Group Handbook
 Study Group Handbook Table of Contents Starting out... 2 Publicizing the benefits of collaborative work.... 2 Planning ahead... 4 Creating a comfortable, cohesive, and trusting environment.... 4 Setting
Kindergarten Lessons for Unit 7: On The Move Me on the Map By Joan Sweeney
 Kindergarten Lessons for Unit 7: On The Move Me on the Map By Joan Sweeney Aligned with the Common Core State Standards in Reading, Speaking & Listening, and Language Written & Prepared for: Baltimore
Kelli Allen. Vicki Nieter. Jeanna Scheve. Foreword by Gregory J. Kaiser
 Kelli Allen Jeanna Scheve Vicki Nieter Foreword by Gregory J. Kaiser Table of Contents Foreword........................................... 7 Introduction........................................ 9 Learning
Copyright Corwin 2015
 2 Defining Essential Learnings How do I find clarity in a sea of standards? For students truly to be able to take responsibility for their learning, both teacher and students need to be very clear about
Read the passage above. What does Chief Seattle believe about owning land?
 The Great Chief in Washington sends word that he wishes to buy our land. How can you buy or sell the sky the warmth of the land? The idea is strange to us. We do not own the freshness of the air or the
A Study of the Effectiveness of Using PER-Based Reforms in a Summer Setting
 A Study of the Effectiveness of Using PER-Based Reforms in a Summer Setting Turhan Carroll University of Colorado-Boulder REU Program Summer 2006 Introduction/Background Physics Education Research (PER)
The Incentives to Enhance Teachers Teaching Profession: An Empirical Study in Hong Kong Primary Schools
 Social Science Today Volume 1, Issue 1 (2014), 37-43 ISSN 2368-7169 E-ISSN 2368-7177 Published by Science and Education Centre of North America The Incentives to Enhance Teachers Teaching Profession: An
Executive Summary. Laurel County School District. Dr. Doug Bennett, Superintendent 718 N Main St London, KY
 Dr. Doug Bennett, Superintendent 718 N Main St London, KY 40741-1222 Document Generated On January 13, 2014 TABLE OF CONTENTS Introduction 1 Description of the School System 2 System's Purpose 4 Notable
Guidelines for Project I Delivery and Assessment Department of Industrial and Mechanical Engineering Lebanese American University
 Guidelines for Project I Delivery and Assessment Department of Industrial and Mechanical Engineering Lebanese American University Approved: July 6, 2009 Amended: July 28, 2009 Amended: October 30, 2009
SOCIAL STUDIES GRADE 1. Clear Learning Targets Office of Teaching and Learning Curriculum Division FAMILIES NOW AND LONG AGO, NEAR AND FAR
 SOCIAL STUDIES FAMILIES NOW AND LONG AGO, NEAR AND FAR GRADE 1 Clear Learning Targets 2015-2016 Aligned with Ohio s Learning Standards for Social Studies Office of Teaching and Learning Curriculum Division
Synthesis Essay: The 7 Habits of a Highly Effective Teacher: What Graduate School Has Taught Me By: Kamille Samborski
 Synthesis Essay: The 7 Habits of a Highly Effective Teacher: What Graduate School Has Taught Me By: Kamille Samborski When I accepted a position at my current school in August of 2012, I was introduced
Linking the Common European Framework of Reference and the Michigan English Language Assessment Battery Technical Report
 Linking the Common European Framework of Reference and the Michigan English Language Assessment Battery Technical Report Contact Information All correspondence and mailings should be addressed to: CaMLA
Create A City: An Urban Planning Exercise Students learn the process of planning a community, while reinforcing their writing and speaking skills.
 Create A City: An Urban Planning Exercise Students learn the process of planning a community, while reinforcing their writing and speaking skills. Author Gale Ekiss Grade Level 4-8 Duration 3 class periods
United states panel on climate change. memorandum
 United states panel on climate change memorandum Welcome to the U.S. Convention on Climate Change. Each of you is a member of a delegation (interest group) at an upcoming meeting to debate and vote on
A Survey of Authentic Assessment in the Teaching of Social Sciences
 International Journal of Education and nce www.ijessnet.com Vol. 2 No. 6; June 2015 A Survey of Authentic Assessment in the Teaching of nces Ruby Ann L. Ayo, Ph.D. Associate Professor III Bicol University
MEE 6501, Advanced Air Quality Control Course Syllabus. Course Description. Course Textbook. Course Learning Outcomes. Credits.
 MEE 6501, Advanced Air Quality Control Course Syllabus Course Description An in-depth study of advanced air quality control science and management practices. Addresses health effects, environmental impacts,
PART C: ENERGIZERS & TEAM-BUILDING ACTIVITIES TO SUPPORT YOUTH-ADULT PARTNERSHIPS
 PART C: ENERGIZERS & TEAM-BUILDING ACTIVITIES TO SUPPORT YOUTH-ADULT PARTNERSHIPS The following energizers and team-building activities can help strengthen the core team and help the participants get to
Airplane Rescue: Social Studies. LEGO, the LEGO logo, and WEDO are trademarks of the LEGO Group The LEGO Group.
 Airplane Rescue: Social Studies LEGO, the LEGO logo, and WEDO are trademarks of the LEGO Group. 2010 The LEGO Group. Lesson Overview The students will discuss ways that people use land and their physical
Text: envisionmath by Scott Foresman Addison Wesley. Course Description
 Ms. Burr 4B Mrs. Hession 4A Math Syllabus 4A & 4B Text: envisionmath by Scott Foresman Addison Wesley In fourth grade we will learn and develop in the acquisition of different mathematical operations while
This table contains the extended descriptors for Active Learning on the Technology Integration Matrix (TIM).
.") TIM: Active Learning This table contains the extended descriptors for Active Learning on the Technology Integration Matrix (TIM). The Active attribute makes the distinction between lessons in which students
TIM: Active Learning This table contains the extended descriptors for Active Learning on the Technology Integration Matrix (TIM). The Active attribute makes the distinction between lessons in which students
Common Core State Standards for English Language Arts
 Reading Standards for Literature 6-12 Grade 9-10 Students: 1. Cite strong and thorough textual evidence to support analysis of what the text says explicitly as well as inferences drawn from the text. 2.
Math 96: Intermediate Algebra in Context
 : Intermediate Algebra in Context Syllabus Spring Quarter 2016 Daily, 9:20 10:30am Instructor: Lauri Lindberg Office Hours@ tutoring: Tutoring Center (CAS-504) 8 9am & 1 2pm daily STEM (Math) Center (RAI-338)
Unit Lesson Plan: Native Americans 4th grade (SS and ELA)
") Unit Lesson Plan: Native Americans 4th grade (SS and ELA) Angie- comments in red Emily's comments in purple Sue's in orange Kasi Frenton-Comments in green-kas_122@hotmail.com 10/6/09 9:03 PM Unit Lesson
Unit Lesson Plan: Native Americans 4th grade (SS and ELA) Angie- comments in red Emily's comments in purple Sue's in orange Kasi Frenton-Comments in green-kas_122@hotmail.com 10/6/09 9:03 PM Unit Lesson
Secondary English-Language Arts
 Secondary English-Language Arts Assessment Handbook January 2013 edtpa_secela_01 edtpa stems from a twenty-five-year history of developing performance-based assessments of teaching quality and effectiveness.
The Round Earth Project. Collaborative VR for Elementary School Kids
 Johnson, A., Moher, T., Ohlsson, S., The Round Earth Project - Collaborative VR for Elementary School Kids, In the SIGGRAPH 99 conference abstracts and applications, Los Angeles, California, Aug 8-13,
Rover Races Grades: 3-5 Prep Time: ~45 Minutes Lesson Time: ~105 minutes
 Rover Races Grades: 3-5 Prep Time: ~45 Minutes Lesson Time: ~105 minutes WHAT STUDENTS DO: Establishing Communication Procedures Following Curiosity on Mars often means roving to places with interesting
Guidelines for Writing an Internship Report
 Guidelines for Writing an Internship Report Master of Commerce (MCOM) Program Bahauddin Zakariya University, Multan Table of Contents Table of Contents... 2 1. Introduction.... 3 2. The Required Components
5th Grade Unit Plan Social Studies Comparing the Colonies. Created by: Kylie Daniels
 5th Grade Unit Plan Social Studies Comparing the Colonies Created by: Kylie Daniels 1 Table of Contents Unit Overview pp. 3 7 Lesson Plan 1 pp. 8 11 Lesson Plan 2 pp. 12 15 Lesson Plan 3 pp. 16 19 Lesson
EFFECTS OF MATHEMATICS ACCELERATION ON ACHIEVEMENT, PERCEPTION, AND BEHAVIOR IN LOW- PERFORMING SECONDARY STUDENTS
 EFFECTS OF MATHEMATICS ACCELERATION ON ACHIEVEMENT, PERCEPTION, AND BEHAVIOR IN LOW- PERFORMING SECONDARY STUDENTS Jennifer Head, Ed.S Math and Least Restrictive Environment Instructional Coach Department
Sectionalism Prior to the Civil War
 Sectionalism Prior to the Civil War GRADE 7 This sample task contains a set of primary and authentic sources about how the differences between the North and South deepened the feelings of sectionalism
TIM: Table of Summary Descriptors This table contains the summary descriptors for each cell of the Technology Integration Matrix (TIM).
.") TIM: Table of Summary Descriptors This table contains the summary descriptors for each cell of the Technology Integration Matrix (TIM). The Technology Integration Matrix (TIM) provides a framework for
TIM: Table of Summary Descriptors This table contains the summary descriptors for each cell of the Technology Integration Matrix (TIM). The Technology Integration Matrix (TIM) provides a framework for
GUIDE CURRICULUM. Science 10
 Science 10 Arts Education Business Education English Language Arts Entrepreneurship Family Studies Health Education International Baccalaureate Languages Mathematics Personal Development and Career Education
Food Products Marketing
 Food Products Marketing AG BM 302 Spring 2017 Instructor: Scott Colby sjc24@psu.edu 814-863-8633 509-710-5933 (cell) 207-D Armsby Location: 106 Forest Resources Building Time: Tuesday and Thursday 9:05-10:20
How to make an A in Physics 101/102. Submitted by students who earned an A in PHYS 101 and PHYS 102.
 How to make an A in Physics 101/102. Submitted by students who earned an A in PHYS 101 and PHYS 102. PHYS 102 (Spring 2015) Don t just study the material the day before the test know the material well
Evaluation of Respondus LockDown Browser Online Training Program. Angela Wilson EDTECH August 4 th, 2013
 Evaluation of Respondus LockDown Browser Online Training Program Angela Wilson EDTECH 505-4173 August 4 th, 2013 1 Table of Contents Learning Reflection... 3 Executive Summary... 4 Purpose of the Evaluation...
ACTL5103 Stochastic Modelling For Actuaries. Course Outline Semester 2, 2014
 UNSW Australia Business School School of Risk and Actuarial Studies ACTL5103 Stochastic Modelling For Actuaries Course Outline Semester 2, 2014 Part A: Course-Specific Information Please consult Part B
School Performance Plan Middle Schools
 SY 2012-2013 School Performance Plan Middle Schools 734 Middle ALternative Program @ Lombard, Principal Roger Shaw (Interim), Executive Director, Network Facilitator PLEASE REFER TO THE SCHOOL PERFORMANCE
Disciplinary Literacy in Science
 Disciplinary Literacy in Science 18 th UCF Literacy Symposium 4/1/2016 Vicky Zygouris-Coe, Ph.D. UCF, CEDHP vzygouri@ucf.edu April 1, 2016 Objectives Examine the benefits of disciplinary literacy for science
Rubric for Scoring English 1 Unit 1, Rhetorical Analysis
 FYE Program at Marquette University Rubric for Scoring English 1 Unit 1, Rhetorical Analysis Writing Conventions INTEGRATING SOURCE MATERIAL 3 Proficient Outcome Effectively expresses purpose in the introduction
Thesis-Proposal Outline/Template
 Thesis-Proposal Outline/Template Kevin McGee 1 Overview This document provides a description of the parts of a thesis outline and an example of such an outline. It also indicates which parts should be
Developing Effective Teachers of Mathematics: Factors Contributing to Development in Mathematics Education for Primary School Teachers
 Developing Effective Teachers of Mathematics: Factors Contributing to Development in Mathematics Education for Primary School Teachers Jean Carroll Victoria University jean.carroll@vu.edu.au In response
Alpha provides an overall measure of the internal reliability of the test. The Coefficient Alphas for the STEP are:
 Every individual is unique. From the way we look to how we behave, speak, and act, we all do it differently. We also have our own unique methods of learning. Once those methods are identified, it can make
Assessment and Evaluation
 Assessment and Evaluation 201 202 Assessing and Evaluating Student Learning Using a Variety of Assessment Strategies Assessment is the systematic process of gathering information on student learning. Evaluation
Learning Fields Unit and Lesson Plans
 Learning Fields Unit and Lesson Plans UNIT INTRODUCTION Learning Fields seeks to connect people with agriculture and rural life today. The lessons in this unit will help students to understand how agriculture
Active Ingredients of Instructional Coaching Results from a qualitative strand embedded in a randomized control trial
 Active Ingredients of Instructional Coaching Results from a qualitative strand embedded in a randomized control trial International Congress of Qualitative Inquiry May 2015, Champaign, IL Drew White, Michelle
NAME OF ASSESSMENT: Reading Informational Texts and Argument Writing Performance Assessment
 GRADE: Seventh Grade NAME OF ASSESSMENT: Reading Informational Texts and Argument Writing Performance Assessment STANDARDS ASSESSED: Students will cite several pieces of textual evidence to support analysis
November 11, 2014 SCHOOL NAMING NEWS:
 November 11, 2014 SCHOOL NAMING NEWS: Town Council feels that the new school to be built in the Inspiration Subdivision warrants the named after St Paul residents John and Paula Scanlan. They passed the
SMARTboard: The SMART Way To Engage Students
 SMARTboard: The SMART Way To Engage Students Emily Goettler 2nd Grade Gray s Woods Elementary School State College Area School District esg5016@psu.edu Penn State Professional Development School Intern
1.0 INTRODUCTION. The purpose of the Florida school district performance review is to identify ways that a designated school district can:
 1.0 INTRODUCTION 1.1 Overview Section 11.515, Florida Statutes, was created by the 1996 Florida Legislature for the purpose of conducting performance reviews of school districts in Florida. The statute
understandings, and as transfer tasks that allow students to apply their knowledge to new situations.
 Building a Better PBL Problem: Lessons Learned from The PBL Project for Teachers By Tom J. McConnell - Research Associate, Division of Science & Mathematics Education, Michigan State University, et al