Graphing & Data Predictions Includes PowerPoint Presentations Developed by: Sara Behm & Austin DeLaRonde Lebanon Valley College Fall 2015
|
|
|
- Nathaniel Waters
- 6 years ago
- Views:
Transcription
1 AACA Museum Graphing & Data Predictions Includes PowerPoint Presentations Developed by: Sara Behm & Austin DeLaRonde Lebanon Valley College Fall 2015
2 Austin De La Ronde and Sara Behm Content: Gas prices and the cost to fill a tank depending on size Knows: Dos: EQ: Gas prices in the past and present Using line of best fit Line graph Bar graph (histogram) Scatter plot Linear Equations Research Plot different types of graphs and describe what they are used for Compare data and patterns and make correlations from past to present Use line of best fit to make predictions for future prices Research gas prices and gas tank sizes from the past and present Discuss data Write about the comparisons in data How have gas prices and the average miles per gallon over the past 100 years? How and when are different types of graphs used to display data about gas prices and car information? Prior Knowledge: Coordinate plane How to write linear equations How to find slope How to find intercepts How to plot points Standards: M8.E.4.1.2: Draw conclusions, make inferences and/or evaluate hypotheses based on statistical and data displays M8.E.4.1.2: Make predictions based on survey results or graphs (bar, line, circle, scatterplots, etc.). M8.E.4.1.1: Fit a line to a scatter plot and/or describe any correlation between the two variables (positive, negative, strong, weak or none).
3 M8.E.1.1.1: Choose and/or explain the correct representation (graph) for a set of data. A : Write, solve, and/or graph linear equations and inequalities using various methods.
4
5 What I Know KWL Chart Topic: Writing Linear Equations What I Want to Know What I Learned
6
7
8

9 Price Prices of Car
10 Name: Date: Directions: Construct a bar graph using the data given below. Speed of Car Miles per Gallon
11 Name: Date: Directions: Construct a line graph with the given data below. Width of a Tire (in millimeters) Jump (cm)
12 Name: Date: Directions: Construct a scatter plot with the given data below. Year of Car Price of Car , , , , , ,028
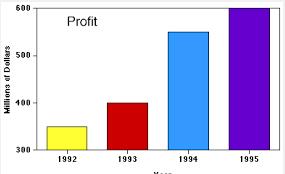
13 Line Graphs 1. What is a line graph? Look up the definition. Explain your answers. 2. How many cars were sold in February? 3. In which two months were the same number of cars sold? 4. What is the difference in number of cars sold in the months of May and April? 5. What is the difference in the number of cars sold between the months in which the maximum and minimum cars were sold? Scatter Plot
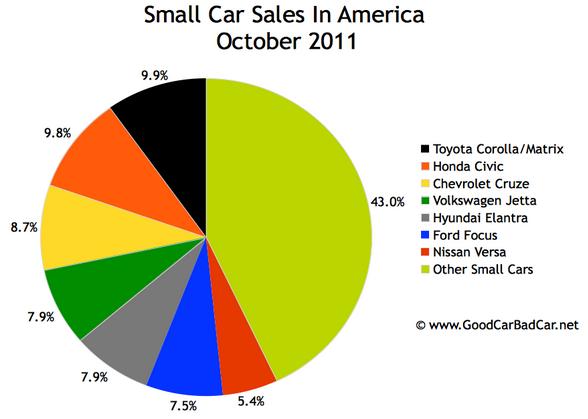
14 1. What is a scatter plot? Look up the definition. 2. If the graph were to continue, what would you guess would be the stopping distance of a car traveling at 45 km/hr? 3. Does the graph look like it has a positive or negative relationship? Explain your thoughts. Bar Graphs 1. What is a bar graph? Look up the definition.

15 2. Which type of car was sold the most? 3. How many fewer minivans were sold than micro cars? 4. How many more hatchbacks were sold than Sedans? 5. Find the total number of cars sold.
16 Topic Date Class Essential Questions: How do we draw a line of best fit? Objectives: SWBAT: draw a line of best fit given a set of data and write an equation for the line. Activating Strategy: Review of linear equations. Students will complete 3 problems on linear equations. Game Plan: Step-by-Step A/S Short presentation on line of best fit and how to find it. This will include an example. Give the students a set of data. Have the students plot the points. Give the students an uncooked piece of spaghetti to find the line of best fit of the data. The students will then draw this line and find the equation for it. S/S Summarizing Strategy- Key Points Summary Students will write a list of the key points of how to find a line of best fit. Differentiation Students can choose to work individually or with a partner on the activity. Give varying difficulties of sets of data while students complete activity. Assessment/Assignment & Materials needed Homework: Benchmark 2 Materials: Spaghetti Graph paper Rulers Worksheet for activity
17 Topic Class Lesson Plan 5 Date Essential Questions: How are predictions made and on what are they based? Objectives: SWBAT: Make predictions based on given data Standards: M8.E.4.1.2: Draw conclusions, make inferences and/or evaluate hypotheses based on statistical and data displays Activating Strategy: Sticky Notes: Students will receive sticky notes to post on to a wall in the classroom. Ask the students to write down how they think predictions in math are made. Have the students answer the question why do think companies need to make predictions? and ask what they think the predictions are made from. Differentiation Sticky notes Game Plan: Step-by-Step Activating Strategy Have students look at car data from the past and the present like the Edsel, Pinto and car recalls as well as Ford, Chevy, and Toyota Use the data to have students make predictions based upon the data. Have class discuss what predictions can be made from different types of data. Summarizing Strategy Summarizing Strategy Review the sticky notes and add sticky notes with other ways to predict outcomes from data and what the students have learned. Assessment/Assignment & Materials needed Worksheet Materials: Sticky Notes
18
19 Name: Date: Making Predictions Worksheet A local car wash business keeps track of how many cars they wash versus the average temperature on that day. Provided below is a scatter plot and line of best fit for the car wash business during the past 12 months Temperature in Farenheit 1. Write the equation of the line of best fit provided in the picture. 2. Based upon the equation that you made. Make a prediction for the following temperatures. Include units. a. 90 b. 20 c. 100
20 Car Project (Performance Task) You will be working with 6 different cars. Choose one specific car from 1920, 1940, 1960, 1980, 2000 and present of the same general make and model. Research the price for gas the year the cars you chose was manufactured as well as the average miles per gallon of the car. You will be making 2 graphs. In the first graph you will plot data points for each specific year and price of gas, and for the second graph you will plot data points for each specific year and miles per gallon. You will draw a line of best fit for each graph and write an equation that represents each line. From this equation you will pick three future years and predict gas prices and miles per gallon. Summarize your findings of the car s mile per gallon and gas prices from each year in a minimum of two paragraphs. You will discuss your research and finding in the first paragraph and you will discuss your graphs and future prices in the second paragraph. Benchmark 1 Students will choose two points to plot on a graph. They will connect the dots and write an equation that represents the lines. Benchmark 2 Scatter Plot Benchmark Worksheet
21 Austin De La Ronde and Sara Behm Performance Task Rubric Rubric Performance Task Research Exemplary Proficient Adequate Poor Students collected all information for the 6 cars with all sources provided. Label for Graphs Both graphs are correctly labeled with units and an appropriate title. Plotted Points for Graphs Both graphs have all points plotted correctly Students collected most of the information for the 6 cars with most sources provided. Both graphs are labeled with units and a title but may have a few mistakes or missing parts. Both graphs have most points plotted correctly Students collected some of the information for the 6 cars with some sources provided. Only one graph is labeled with units and a title with many mistakes and/or missing parts. Only one graph has many mistakes. Students collected little to no information for the 6 cars with little to no sources. Neither graph is labeled with units and a title. Both graphs have many mistakes Line of Best Fit and Equation Summary MUGS Both graphs have a correctly placed line of best fit with correct equations First paragraph summary was complete and appropriate. Second paragraph expertly included information on future prices and mpg of all cars. Typed, double spaced, 12 points where appropriate. Grammar, Both graphs have a line of best fit with mostly correct equations First paragraph summary was mostly complete and appropriate. Second paragraph included most information on future prices and mpg of the cars. Mostly typed, double spaced, 12 points. Few grammar, syntax, & Only one graph has a line of best fit with an equation Only one paragraph is included and is appropriate. Or First paragraph was semicomplete and appropriate. Second paragraph included some information on future prices and mpg of the cars. Some typed, double spaced, or 12 points. Many grammar, syntax, & Neither graph has a line of best fit or an equation. Neither paragraph was included. Or First paragraph summary was not complete or appropriate. Second paragraph did not include information on future prices and mpg for the cars. Minimally typed, double spaced, and not 12 points. Numerous
22 Austin De La Ronde and Sara Behm Performance Task Rubric syntax, & spelling were perfect. spelling errors. spelling errors grammar, syntax, & spelling errors.
23 Topic Date Class Essential Questions: How and why is research conducted? Objectives: SWBAT: Conduct proper research using credible sources Standards: M8.E.4.1.2: Draw conclusions, make inferences and/or evaluate hypotheses based on statistical and data displays Activating Strategy: Quick Write Have students write on the topic of research. Ask questions like: What have you researched before? How did you conduct the research? What does a credible source look like? When students are finished writing, have students share their responses with the class. Game Plan: Step-by-Step Activating Strategy Have students complete an online mini-research worksheet in groups on how to conduct proper research. When groups are finished, review answers to the worksheet and answer any questions that students have Time-allowing, let students start working on research for performance task Summarizing Strategy Summarizing Strategy: Group Review Have students get in groups of 4-5. Have students discuss what they have learned about how to conduct research and what a credible source looks like. Have groups share their responses with the class. Differentiation Students can pick their groups. Students are able to find different sources but arrive at the same conclusion. Assessment/Assignment & Materials needed Homework: Start and/or finish research for Performance Task Materials: Access to internet or computer lab Worksheet on conducting research
24 Topic Date Class Essential Questions: What are different types of graphs and how can they be used? Objectives: SWBAT: identify different types of graphs and their uses. Activating Strategy: Matching Put examples of each type of graph on the board and then have the students match them to the type of graph. These types of graphs will be included in a word bank. Game Plan: Step-by-Step A/S Station work on line graphs, bar graphs, and scatter plots S/S Summarizing Strategy-Aha! and Huh? Students will write down 1 or 2 ahas (something you learned) and 1 or 2 huhs (things you still have questions about) Differentiation Let the students choose their groups or choose the groups for them. Have some stations that are individual work and others that are group work. Assessment/Assignment & Materials needed Homework: Worksheet Materials: worksheets for each station
Probability and Statistics Curriculum Pacing Guide
 Unit 1 Terms PS.SPMJ.3 PS.SPMJ.5 Plan and conduct a survey to answer a statistical question. Recognize how the plan addresses sampling technique, randomization, measurement of experimental error and methods
Characteristics of Functions
 Characteristics of Functions Unit: 01 Lesson: 01 Suggested Duration: 10 days Lesson Synopsis Students will collect and organize data using various representations. They will identify the characteristics
AP Statistics Summer Assignment 17-18
 AP Statistics Summer Assignment 17-18 Welcome to AP Statistics. This course will be unlike any other math class you have ever taken before! Before taking this course you will need to be competent in basic
Research Design & Analysis Made Easy! Brainstorming Worksheet
 Brainstorming Worksheet 1) Choose a Topic a) What are you passionate about? b) What are your library s strengths? c) What are your library s weaknesses? d) What is a hot topic in the field right now that
Cal s Dinner Card Deals
 Cal s Dinner Card Deals Overview: In this lesson students compare three linear functions in the context of Dinner Card Deals. Students are required to interpret a graph for each Dinner Card Deal to help
Exemplar 6 th Grade Math Unit: Prime Factorization, Greatest Common Factor, and Least Common Multiple
 Exemplar 6 th Grade Math Unit: Prime Factorization, Greatest Common Factor, and Least Common Multiple Unit Plan Components Big Goal Standards Big Ideas Unpacked Standards Scaffolded Learning Resources
Student s Edition. Grade 6 Unit 6. Statistics. Eureka Math. Eureka Math
 Student s Edition Grade 6 Unit 6 Statistics Eureka Math Eureka Math Lesson 1 Lesson 1: Posing Statistical Questions Statistics is about using data to answer questions. In this module, the following four
Chapters 1-5 Cumulative Assessment AP Statistics November 2008 Gillespie, Block 4
 Chapters 1-5 Cumulative Assessment AP Statistics Name: November 2008 Gillespie, Block 4 Part I: Multiple Choice This portion of the test will determine 60% of your overall test grade. Each question is
Physics 270: Experimental Physics
 2017 edition Lab Manual Physics 270 3 Physics 270: Experimental Physics Lecture: Lab: Instructor: Office: Email: Tuesdays, 2 3:50 PM Thursdays, 2 4:50 PM Dr. Uttam Manna 313C Moulton Hall umanna@ilstu.edu
MGSE: MGSE4.MD.1; MGSE4.MD.2; MGSE4.MD.3; MGSE4.MD.8; MGSE4.MD.4; MGSE4.MD.5; MGSE4.MD.6; MGSE4.MD.7
 Melissa Phillips 4 th Grade April 25 29, 2016 Math Monday EQ: How are area and perimeter related? How is data collected? How are fluid ounces, cups, pints, quarts, and gallons related? How are the angles
Name Class Date. Graphing Proportional Relationships
 Name Class Date Practice 5-1 Graphing Proportional Relationships 5-1 Graphing Proportional Relationships 1. An electronics store has a frequent shopper program. The buyer earns 4 points for every movie
STT 231 Test 1. Fill in the Letter of Your Choice to Each Question in the Scantron. Each question is worth 2 point.
 STT 231 Test 1 Fill in the Letter of Your Choice to Each Question in the Scantron. Each question is worth 2 point. 1. A professor has kept records on grades that students have earned in his class. If he
Statistical Analysis of Climate Change, Renewable Energies, and Sustainability An Independent Investigation for Introduction to Statistics
 5/22/2012 Statistical Analysis of Climate Change, Renewable Energies, and Sustainability An Independent Investigation for Introduction to Statistics College of Menominee Nation & University of Wisconsin
Math 96: Intermediate Algebra in Context
 : Intermediate Algebra in Context Syllabus Spring Quarter 2016 Daily, 9:20 10:30am Instructor: Lauri Lindberg Office Hours@ tutoring: Tutoring Center (CAS-504) 8 9am & 1 2pm daily STEM (Math) Center (RAI-338)
Common Core State Standards
 Common Core State Standards Common Core State Standards 7.NS.3 Solve real-world and mathematical problems involving the four operations with rational numbers. Mathematical Practices 1, 3, and 4 are aspects
Unit 3 Ratios and Rates Math 6
 Number of Days: 20 11/27/17 12/22/17 Unit Goals Stage 1 Unit Description: Students study the concepts and language of ratios and unit rates. They use proportional reasoning to solve problems. In particular,
OVERVIEW OF CURRICULUM-BASED MEASUREMENT AS A GENERAL OUTCOME MEASURE
 OVERVIEW OF CURRICULUM-BASED MEASUREMENT AS A GENERAL OUTCOME MEASURE Mark R. Shinn, Ph.D. Michelle M. Shinn, Ph.D. Formative Evaluation to Inform Teaching Summative Assessment: Culmination measure. Mastery
Mathematics Success Level E
 T403 [OBJECTIVE] The student will generate two patterns given two rules and identify the relationship between corresponding terms, generate ordered pairs, and graph the ordered pairs on a coordinate plane.
Case study Norway case 1
 Case study Norway case 1 School : B (primary school) Theme: Science microorganisms Dates of lessons: March 26-27 th 2015 Age of students: 10-11 (grade 5) Data sources: Pre- and post-interview with 1 teacher
TABE 9&10. Revised 8/2013- with reference to College and Career Readiness Standards
 TABE 9&10 Revised 8/2013- with reference to College and Career Readiness Standards LEVEL E Test 1: Reading Name Class E01- INTERPRET GRAPHIC INFORMATION Signs Maps Graphs Consumer Materials Forms Dictionary
Statewide Framework Document for:
 Statewide Framework Document for: 270301 Standards may be added to this document prior to submission, but may not be removed from the framework to meet state credit equivalency requirements. Performance
The New York City Department of Education. Grade 5 Mathematics Benchmark Assessment. Teacher Guide Spring 2013
 The New York City Department of Education Grade 5 Mathematics Benchmark Assessment Teacher Guide Spring 2013 February 11 March 19, 2013 2704324 Table of Contents Test Design and Instructional Purpose...
Interpreting Graphs Middle School Science
 Middle School Free PDF ebook Download: Download or Read Online ebook interpreting graphs middle school science in PDF Format From The Best User Guide Database. Rain, Rain, Go Away When the student council
Mathematics process categories
 Mathematics process categories All of the UK curricula define multiple categories of mathematical proficiency that require students to be able to use and apply mathematics, beyond simple recall of facts
Dublin City Schools Mathematics Graded Course of Study GRADE 4
 I. Content Standard: Number, Number Sense and Operations Standard Students demonstrate number sense, including an understanding of number systems and reasonable estimates using paper and pencil, technology-supported
MADERA SCIENCE FAIR 2013 Grades 4 th 6 th Project due date: Tuesday, April 9, 8:15 am Parent Night: Tuesday, April 16, 6:00 8:00 pm
 MADERA SCIENCE FAIR 2013 Grades 4 th 6 th Project due date: Tuesday, April 9, 8:15 am Parent Night: Tuesday, April 16, 6:00 8:00 pm Why participate in the Science Fair? Science fair projects give students
AGS THE GREAT REVIEW GAME FOR PRE-ALGEBRA (CD) CORRELATED TO CALIFORNIA CONTENT STANDARDS
 CORRELATED TO CALIFORNIA CONTENT STANDARDS") AGS THE GREAT REVIEW GAME FOR PRE-ALGEBRA (CD) CORRELATED TO CALIFORNIA CONTENT STANDARDS 1 CALIFORNIA CONTENT STANDARDS: Chapter 1 ALGEBRA AND WHOLE NUMBERS Algebra and Functions 1.4 Students use algebraic
AGS THE GREAT REVIEW GAME FOR PRE-ALGEBRA (CD) CORRELATED TO CALIFORNIA CONTENT STANDARDS 1 CALIFORNIA CONTENT STANDARDS: Chapter 1 ALGEBRA AND WHOLE NUMBERS Algebra and Functions 1.4 Students use algebraic
Sample Problems for MATH 5001, University of Georgia
 Sample Problems for MATH 5001, University of Georgia 1 Give three different decimals that the bundled toothpicks in Figure 1 could represent In each case, explain why the bundled toothpicks can represent
Broward County Public Schools G rade 6 FSA Warm-Ups
 Day 1 1. A florist has 40 tulips, 32 roses, 60 daises, and 50 petunias. Draw a line from each comparison to match it to the correct ratio. A. tulips to roses B. daises to petunias C. roses to tulips D.
Science Fair Project Handbook
 Science Fair Project Handbook IDENTIFY THE TESTABLE QUESTION OR PROBLEM: a) Begin by observing your surroundings, making inferences and asking testable questions. b) Look for problems in your life or surroundings
TEKS Resource System. Effective Planning from the IFD & Assessment. Presented by: Kristin Arterbury, ESC Region 12
 TEKS Resource System Effective Planning from the IFD & Assessments Presented by: Kristin Arterbury, ESC Region 12 karterbury@esc12.net, 254-297-1115 Assessment Curriculum Instruction planwithifd.wikispaces.com
Unit 1: Scientific Investigation-Asking Questions
 Unit 1: Scientific Investigation-Asking Questions Standards: OKC 3 Process Standard 3: Experimental design - Understanding experimental designs requires that students recognize the components of a valid
Standards-Based Bulletin Boards. Tuesday, January 17, 2012 Principals Meeting
 Standards-Based Bulletin Boards Tuesday, January 17, 2012 Principals Meeting Questions: How do your teachers demonstrate the rigor of the standards-based assignments? How do your teachers demonstrate that
Project Based Learning Debriefing Form Elementary School
 Project Name: Student Name: Project Based Learning Debriefing Form Elementary School Use this form to debrief after completing the project (or staff may modify the questions to suit your project). Youth
LLD MATH. Student Eligibility: Grades 6-8. Credit Value: Date Approved: 8/24/15
 PUBLIC SCHOOLS OF EDISON TOWNSHIP DIVISION OF CURRICULUM AND INSTRUCTION LLD MATH Length of Course: Elective/Required: School: Full Year Required Middle Schools Student Eligibility: Grades 6-8 Credit Value:
Hardhatting in a Geo-World
 Hardhatting in a Geo-World TM Developed and Published by AIMS Education Foundation This book contains materials developed by the AIMS Education Foundation. AIMS (Activities Integrating Mathematics and
OFFICE SUPPORT SPECIALIST Technical Diploma
 OFFICE SUPPORT SPECIALIST Technical Diploma Program Code: 31-106-8 our graduates INDEMAND 2017/2018 mstc.edu administrative professional career pathway OFFICE SUPPORT SPECIALIST CUSTOMER RELATIONSHIP PROFESSIONAL
Diagnostic Test. Middle School Mathematics
 Diagnostic Test Middle School Mathematics Copyright 2010 XAMonline, Inc. All rights reserved. No part of the material protected by this copyright notice may be reproduced or utilized in any form or by
English 491: Methods of Teaching English in Secondary School. Identify when this occurs in the program: Senior Year (capstone course), week 11
, week 11") English 491: Methods of Teaching English in Secondary School Literacy Story and Analysis through Critical Lens Identify when this occurs in the program: Senior Year (capstone course), week 11 Part 1: Story
English 491: Methods of Teaching English in Secondary School Literacy Story and Analysis through Critical Lens Identify when this occurs in the program: Senior Year (capstone course), week 11 Part 1: Story
STA 225: Introductory Statistics (CT)
") Marshall University College of Science Mathematics Department STA 225: Introductory Statistics (CT) Course catalog description A critical thinking course in applied statistical reasoning covering basic
Marshall University College of Science Mathematics Department STA 225: Introductory Statistics (CT) Course catalog description A critical thinking course in applied statistical reasoning covering basic
Grade 6: Correlated to AGS Basic Math Skills
 Grade 6: Correlated to AGS Basic Math Skills Grade 6: Standard 1 Number Sense Students compare and order positive and negative integers, decimals, fractions, and mixed numbers. They find multiples and
INSTRUCTIONAL FOCUS DOCUMENT Grade 5/Science
 Exemplar Lesson 01: Comparing Weather and Climate Exemplar Lesson 02: Sun, Ocean, and the Water Cycle State Resources: Connecting to Unifying Concepts through Earth Science Change Over Time RATIONALE:
Math-U-See Correlation with the Common Core State Standards for Mathematical Content for Third Grade
 Math-U-See Correlation with the Common Core State Standards for Mathematical Content for Third Grade The third grade standards primarily address multiplication and division, which are covered in Math-U-See
Unit: Human Impact Differentiated (Tiered) Task How Does Human Activity Impact Soil Erosion?
 Task How Does Human Activity Impact Soil Erosion?") The following instructional plan is part of a GaDOE collection of Unit Frameworks, Performance Tasks, examples of Student Work, and Teacher Commentary. Many more GaDOE approved instructional plans are
The following instructional plan is part of a GaDOE collection of Unit Frameworks, Performance Tasks, examples of Student Work, and Teacher Commentary. Many more GaDOE approved instructional plans are
Algebra 1, Quarter 3, Unit 3.1. Line of Best Fit. Overview
 Algebra 1, Quarter 3, Unit 3.1 Line of Best Fit Overview Number of instructional days 6 (1 day assessment) (1 day = 45 minutes) Content to be learned Analyze scatter plots and construct the line of best
SANTIAGO CANYON COLLEGE Reading & English Placement Testing Information
 SANTIAGO CANYON COLLEGE Reaing & English Placement Testing Information DO YOUR BEST on the Reaing & English Placement Test The Reaing & English placement test is esigne to assess stuents skills in reaing
Exploring Derivative Functions using HP Prime
 Exploring Derivative Functions using HP Prime Betty Voon Wan Niu betty@uniten.edu.my College of Engineering Universiti Tenaga Nasional Malaysia Wong Ling Shing Faculty of Health and Life Sciences, INTI
Interpretive (seeing) Interpersonal (speaking and short phrases)
 Interpersonal (speaking and short phrases)") Subject Spanish Grammar Lesson Length 50 minutes Linguistic Level Beginning Spanish 1 Topic Descriptive personal characteristics using the verb ser Students will be able to identify the appropriate situations
Subject Spanish Grammar Lesson Length 50 minutes Linguistic Level Beginning Spanish 1 Topic Descriptive personal characteristics using the verb ser Students will be able to identify the appropriate situations
PAGE(S) WHERE TAUGHT If sub mission ins not a book, cite appropriate location(s))
 WHERE TAUGHT If sub mission ins not a book, cite appropriate location(s))") Ohio Academic Content Standards Grade Level Indicators (Grade 11) A. ACQUISITION OF VOCABULARY Students acquire vocabulary through exposure to language-rich situations, such as reading books and other
Ohio Academic Content Standards Grade Level Indicators (Grade 11) A. ACQUISITION OF VOCABULARY Students acquire vocabulary through exposure to language-rich situations, such as reading books and other
3rd Grade Ngsss Standards Checklist
 3rd Grade Ngsss Free PDF ebook Download: 3rd Grade Ngsss Download or Read Online ebook 3rd grade ngsss standards checklist in PDF Format From The Best User Guide Database 2013 FCAT 2.0. Next Generation
Edexcel GCSE. Statistics 1389 Paper 1H. June Mark Scheme. Statistics Edexcel GCSE
 Edexcel GCSE Statistics 1389 Paper 1H June 2007 Mark Scheme Edexcel GCSE Statistics 1389 NOTES ON MARKING PRINCIPLES 1 Types of mark M marks: method marks A marks: accuracy marks B marks: unconditional
The lab is designed to remind you how to work with scientific data (including dealing with uncertainty) and to review experimental design.
 and to review experimental design.") Name: Partner(s): Lab #1 The Scientific Method Due 6/25 Objective The lab is designed to remind you how to work with scientific data (including dealing with uncertainty) and to review experimental design.
Name: Partner(s): Lab #1 The Scientific Method Due 6/25 Objective The lab is designed to remind you how to work with scientific data (including dealing with uncertainty) and to review experimental design.
Experience College- and Career-Ready Assessment User Guide
 Experience College- and Career-Ready Assessment User Guide 2014-2015 Introduction Welcome to Experience College- and Career-Ready Assessment, or Experience CCRA. Experience CCRA is a series of practice
RESPONSE TO LITERATURE
 RESPONSE TO LITERATURE TEACHER PACKET CENTRAL VALLEY SCHOOL DISTRICT WRITING PROGRAM Teacher Name RESPONSE TO LITERATURE WRITING DEFINITION AND SCORING GUIDE/RUBRIC DE INITION A Response to Literature
End-of-Module Assessment Task
 Student Name Date 1 Date 2 Date 3 Topic E: Decompositions of 9 and 10 into Number Pairs Topic E Rubric Score: Time Elapsed: Topic F Topic G Topic H Materials: (S) Personal white board, number bond mat,
Table of Contents. Introduction Choral Reading How to Use This Book...5. Cloze Activities Correlation to TESOL Standards...
 Table of Contents Introduction.... 4 How to Use This Book.....................5 Correlation to TESOL Standards... 6 ESL Terms.... 8 Levels of English Language Proficiency... 9 The Four Language Domains.............
Loughton School s curriculum evening. 28 th February 2017
 Loughton School s curriculum evening 28 th February 2017 Aims of this session Share our approach to teaching writing, reading, SPaG and maths. Share resources, ideas and strategies to support children's
CAAP. Content Analysis Report. Sample College. Institution Code: 9011 Institution Type: 4-Year Subgroup: none Test Date: Spring 2011
 CAAP Content Analysis Report Institution Code: 911 Institution Type: 4-Year Normative Group: 4-year Colleges Introduction This report provides information intended to help postsecondary institutions better
One Way Draw a quick picture.
 Name Multiply Tens, Hundreds, and Thousands Essential Question How does understanding place value help you multiply tens, hundreds, and thousands? Lesson 2.3 Number and Operations in Base Ten 4.NBT.5 Also
AP Chemistry
 AP Chemistry 2016-2017 Welcome to AP Chemistry! I am so excited to have you in this course next year! To get geared up for the class, there are some things that you need to do this summer. None of it is
Content Language Objectives (CLOs) August 2012, H. Butts & G. De Anda
 August 2012, H. Butts & G. De Anda") Content Language Objectives (CLOs) Outcomes Identify the evolution of the CLO Identify the components of the CLO Understand how the CLO helps provide all students the opportunity to access the rigor of
Content Language Objectives (CLOs) Outcomes Identify the evolution of the CLO Identify the components of the CLO Understand how the CLO helps provide all students the opportunity to access the rigor of
After your registration is complete and your proctor has been approved, you may take the Credit by Examination for MATH 6A.
 MATH 6A Mathematics, Grade 6, First Semester #03 (v.3.0) To the Student: After your registration is complete and your proctor has been approved, you may take the Credit by Examination for MATH 6A. WHAT
Functional Maths Skills Check E3/L x
 Functional Maths Skills Check E3/L1 Name: Date started: The Four Rules of Number + - x May 2017. Kindly contributed by Nicola Smith, Gloucestershire College. Search for Nicola on skillsworkshop.org Page
Math Grade 3 Assessment Anchors and Eligible Content
 Math Grade 3 Assessment Anchors and Eligible Content www.pde.state.pa.us 2007 M3.A Numbers and Operations M3.A.1 Demonstrate an understanding of numbers, ways of representing numbers, relationships among
English Language Arts Scoring Guide for Sample Test 2005
 English Language Arts Scoring Guide for Sample Test 2005 Grade 5 Contents Standard and Performance Indicator Map with Answer Key..................... 2 Question 14 Reading Rubric Key Points........................................
Getting Started with TI-Nspire High School Science
 Getting Started with TI-Nspire High School Science 2012 Texas Instruments Incorporated Materials for Institute Participant * *This material is for the personal use of T3 instructors in delivering a T3
Introduction to the Practice of Statistics
 Chapter 1: Looking at Data Distributions Introduction to the Practice of Statistics Sixth Edition David S. Moore George P. McCabe Bruce A. Craig Statistics is the science of collecting, organizing and
PHYSICS 40S - COURSE OUTLINE AND REQUIREMENTS Welcome to Physics 40S for !! Mr. Bryan Doiron
 PHYSICS 40S - COURSE OUTLINE AND REQUIREMENTS Welcome to Physics 40S for 2016-2017!! Mr. Bryan Doiron The course covers the following topics (time permitting): Unit 1 Kinematics: Special Equations, Relative
Ready Common Core Ccls Answer Key
 Ready Ccls Answer Key Free PDF ebook Download: Ready Ccls Answer Key Download or Read Online ebook ready common core ccls answer key in PDF Format From The Best User Guide Database Learning Standards Coverage
Unit Lesson Plan: Native Americans 4th grade (SS and ELA)
") Unit Lesson Plan: Native Americans 4th grade (SS and ELA) Angie- comments in red Emily's comments in purple Sue's in orange Kasi Frenton-Comments in green-kas_122@hotmail.com 10/6/09 9:03 PM Unit Lesson
Unit Lesson Plan: Native Americans 4th grade (SS and ELA) Angie- comments in red Emily's comments in purple Sue's in orange Kasi Frenton-Comments in green-kas_122@hotmail.com 10/6/09 9:03 PM Unit Lesson
MULTIPLE CHOICE. Choose the one alternative that best completes the statement or answers the question.
 Ch 2 Test Remediation Work Name MULTIPLE CHOICE. Choose the one alternative that best completes the statement or answers the question. Provide an appropriate response. 1) High temperatures in a certain
Mathematics. Mathematics
 Mathematics Program Description Successful completion of this major will assure competence in mathematics through differential and integral calculus, providing an adequate background for employment in
Honors Mathematics. Introduction and Definition of Honors Mathematics
 Honors Mathematics Introduction and Definition of Honors Mathematics Honors Mathematics courses are intended to be more challenging than standard courses and provide multiple opportunities for students
Let's Learn English Lesson Plan
 Let's Learn English Lesson Plan Introduction: Let's Learn English lesson plans are based on the CALLA approach. See the end of each lesson for more information and resources on teaching with the CALLA
Section 7, Unit 4: Sample Student Book Activities for Teaching Listening
 Section 7, Unit 4: Sample Student Book Activities for Teaching Listening I. ACTIVITIES TO PRACTICE THE SOUND SYSTEM 1. Listen and Repeat for elementary school students. It could be done as a pre-listening
Learning Disability Functional Capacity Evaluation. Dear Doctor,
 Dear Doctor, I have been asked to formulate a vocational opinion regarding NAME s employability in light of his/her learning disability. To assist me with this evaluation I would appreciate if you can
Statistical Studies: Analyzing Data III.B Student Activity Sheet 7: Using Technology
 Suppose data were collected on 25 bags of Spud Potato Chips. The weight (to the nearest gram) of the chips in each bag is listed below. 25 28 23 26 23 25 25 24 24 27 23 24 28 27 24 26 24 25 27 26 25 26
Odyssey Writer Online Writing Tool for Students
 Odyssey Writer Online Writing Tool for Students Ways to Access Odyssey Writer: 1. Odyssey Writer Icon on Student Launch Pad Stand alone icon on student launch pad for free-form writing. This is the drafting
(I couldn t find a Smartie Book) NEW Grade 5/6 Mathematics: (Number, Statistics and Probability) Title Smartie Mathematics
 NEW Grade 5/6 Mathematics: (Number, Statistics and Probability) Title Smartie Mathematics") (I couldn t find a Smartie Book) NEW Grade 5/6 Mathematics: (Number, Statistics and Probability) Title Smartie Mathematics Lesson/ Unit Description Questions: How many Smarties are in a box? Is it the
(I couldn t find a Smartie Book) NEW Grade 5/6 Mathematics: (Number, Statistics and Probability) Title Smartie Mathematics Lesson/ Unit Description Questions: How many Smarties are in a box? Is it the
SMALL GROUPS AND WORK STATIONS By Debbie Hunsaker 1
 SMALL GROUPS AND WORK STATIONS By Debbie Hunsaker 1 NOTES: 2 Step 1: Environment First: Inventory your space Why: You and your students will be much more successful during small group instruction if you
National Literacy and Numeracy Framework for years 3/4
 1. Oracy National Literacy and Numeracy Framework for years 3/4 Speaking Listening Collaboration and discussion Year 3 - Explain information and ideas using relevant vocabulary - Organise what they say
Statistics and Probability Standards in the CCSS- M Grades 6- HS
 Statistics and Probability Standards in the CCSS- M Grades 6- HS Grade 6 Develop understanding of statistical variability. -6.SP.A.1 Recognize a statistical question as one that anticipates variability
Welcome to ACT Brain Boot Camp
 Welcome to ACT Brain Boot Camp 9:30 am - 9:45 am Basics (in every room) 9:45 am - 10:15 am Breakout Session #1 ACT Math: Adame ACT Science: Moreno ACT Reading: Campbell ACT English: Lee 10:20 am - 10:50
How the Guppy Got its Spots:
 This fall I reviewed the Evobeaker labs from Simbiotic Software and considered their potential use for future Evolution 4974 courses. Simbiotic had seven labs available for review. I chose to review the
ASSESSMENT TASK OVERVIEW & PURPOSE:
 Performance Based Learning and Assessment Task A Place at the Table I. ASSESSMENT TASK OVERVIEW & PURPOSE: Students will create a blueprint for a decorative, non rectangular picnic table (top only), and
1.11 I Know What Do You Know?
 50 SECONDARY MATH 1 // MODULE 1 1.11 I Know What Do You Know? A Practice Understanding Task CC BY Jim Larrison https://flic.kr/p/9mp2c9 In each of the problems below I share some of the information that
Facing our Fears: Reading and Writing about Characters in Literary Text
 Facing our Fears: Reading and Writing about Characters in Literary Text by Barbara Goggans Students in 6th grade have been reading and analyzing characters in short stories such as "The Ravine," by Graham
Mathematics Scoring Guide for Sample Test 2005
 Mathematics Scoring Guide for Sample Test 2005 Grade 4 Contents Strand and Performance Indicator Map with Answer Key...................... 2 Holistic Rubrics.......................................................
Visit us at:
 White Paper Integrating Six Sigma and Software Testing Process for Removal of Wastage & Optimizing Resource Utilization 24 October 2013 With resources working for extended hours and in a pressurized environment,
Functional Skills Mathematics Level 2 sample assessment
 Functional Skills Mathematics Level 2 sample assessment Sample paper 3 Candidate Name (First, Middle, Last) www.cityandguilds.com May 2015 Version 1-3 Total marks Task Mark Candidate enrolment number DOB
5 Star Writing Persuasive Essay
 5 Star Writing Persuasive Essay Grades 5-6 Intro paragraph states position and plan Multiparagraphs Organized At least 3 reasons Explanations, Examples, Elaborations to support reasons Arguments/Counter
KeyTrain Level 7. For. Level 7. Published by SAI Interactive, Inc., 340 Frazier Avenue, Chattanooga, TN
 Introduction For Level 7 Published by SAI Interactive, Inc., 340 Frazier Avenue, Chattanooga, TN 37405. Copyright 2000 by SAI Interactive, Inc. KeyTrain is a registered trademark of SAI Interactive, Inc.
Grade 3: Module 2B: Unit 3: Lesson 10 Reviewing Conventions and Editing Peers Work
 Grade 3: Module 2B: Unit 3: Lesson 10 This work is licensed under a Creative Commons Attribution-NonCommercial-ShareAlike 3.0 Unported License. Exempt third-party content is indicated by the footer: (name
UNIT ONE Tools of Algebra
 UNIT ONE Tools of Algebra Subject: Algebra 1 Grade: 9 th 10 th Standards and Benchmarks: 1 a, b,e; 3 a, b; 4 a, b; Overview My Lessons are following the first unit from Prentice Hall Algebra 1 1. Students
Creating a Test in Eduphoria! Aware
 in Eduphoria! Aware Login to Eduphoria using CHROME!!! 1. LCS Intranet > Portals > Eduphoria From home: LakeCounty.SchoolObjects.com 2. Login with your full email address. First time login password default
Create A City: An Urban Planning Exercise Students learn the process of planning a community, while reinforcing their writing and speaking skills.
 Create A City: An Urban Planning Exercise Students learn the process of planning a community, while reinforcing their writing and speaking skills. Author Gale Ekiss Grade Level 4-8 Duration 3 class periods
Minitab Tutorial (Version 17+)
") Minitab Tutorial (Version 17+) Basic Commands and Data Entry Graphical Tools Descriptive Statistics Outline Minitab Basics Basic Commands, Data Entry, and Organization Minitab Project Files (*.MPJ) vs.
Minitab Tutorial (Version 17+) Basic Commands and Data Entry Graphical Tools Descriptive Statistics Outline Minitab Basics Basic Commands, Data Entry, and Organization Minitab Project Files (*.MPJ) vs.
Measures of the Location of the Data
 OpenStax-CNX module m46930 1 Measures of the Location of the Data OpenStax College This work is produced by OpenStax-CNX and licensed under the Creative Commons Attribution License 3.0 The common measures
Lesson M4. page 1 of 2
 Lesson M4 page 1 of 2 Miniature Gulf Coast Project Math TEKS Objectives 111.22 6b.1 (A) apply mathematics to problems arising in everyday life, society, and the workplace; 6b.1 (C) select tools, including