E-Textbook Evaluation Study. Fatimah Aldubaisi
|
|
|
- Austin Daniel
- 6 years ago
- Views:
Transcription
1 E-Textbook Evaluation Study by Fatimah Aldubaisi A thesis submitted to the Graduate Faculty of Auburn University in partial fulfillment of the requirements for the Degree of Master of Science Auburn, Alabama December 13, 2014 Keywords: E-TextBook, Algorithm Visualization, Digital Education Copyright 2014 by Fatimah Aldubaisi Approved by Hari Narayanan, Chair, Professor of Computer Science and Software Engineering Dean Hendrix, Associate Professor of Computer Science and Software Engineering Cheryl Seals, Associate Professor of Computer Science and Software Engineering
2 Abstract The effects that technological advances have on education and how these advances can be used to improve the learning process are important research questions that attract many researchers to study different aspects of these issues. One such aspect is the development of interactive e-textbooks. Interactive e-textbooks are defined as electronic books that go beyond the static nature of printed textbooks. In this study, an e-textbook was developed that uses JavaScript for its interactive elements, and employs a concept map for navigational purposes. This e-textbook prototype was tested for the purpose of answering the following research questions. Does an e-textbook improve a student s learning as measured by his/her performance in a test? Does an e-textbook improve a student s learning and performance better than a printed textbook? Do students like interacting with the interface of an e- textbook and does it increase a student s engagement with the course material? Results showed that undergraduate students performance improved after using the e-textbook. Results also showed that both undergraduate students and graduate students had a positive reaction to the e-textbook. ii
3 Acknowledgments I would like to take this opportunity to express my gratitude to my supervisor, Dr. Hari Narayanan, for his support, excellent guidance, and providing me with a research atmosphere that challenged me and pushed me forward, and to my committee members: Dr. Dean Hendrix and Dr. Cheryl Seals. I would also like to thank my friends who supported me, stood by me, and helped me finish my thesis. Special thanks to Haneen, Yasmeen, Neda, and Shubbhi for taking the time to participate in my study and helping me get the needed results. Many thanks to my best friend Zainab who was always there for me, encouraging me, supporting me, and giving me advices and suggestions. I would like to thank my family. My parents, my brothers, and my sisters, who I owe my achievements to, and who encouraged me and kept me in their prayers. Finally, I would like to express my heartfelt thanks to my older brother Ali who was my companion and my friend throughout this journey. I would not have been able to finish my thesis without him. iii
4 Table of Contents Abstract Acknowledgments ii iii List of Figures vi List of Tables ix 1 Introduction Literature Review Software Design Use Cases Actors Use Cases Diagram Use Cases Software Architecture Object Descriptions Object Collaborations Human Interface Design Overview of User Interface Screen Images Methodology Usability Testing Pilot Testing Actual Testing Data Analysis and Results Usability Testing iv
5 5.1.1 User Interface Evaluation Survey Actual testing Pretest, Posttest, and Improvement Scores User Interface Evaluation Survey Log Files Discussion Conclusion and Future Work Bibliography Appendices A E-Textbook Screen Shots B Flyer, Demographic Data Questionnaire, and Consent Form C Usability Testing Collected Data D Demographic Data Summary E Actual Testing Collected Data F Google Analytics Reports v
6 List of Figures 3.1 Use Cases Diagram Software Architecture Class Diagram E-Textbook Main Page E-Textbook s Concept s Definition and Example E-Textbook s Side Menu Hypothesis 1 Paired t-test Hypothesis 2 Paired t-test Hypothesis 3 Paired t-test Hypothesis 4 Paired t-test Hypothesis 5 Two-sample t-test Assuming Unequal Variances Hypothesis 6 Two-sample t-test Assuming Unequal Variances Hypothesis 7 Two-sample t-test Assuming Unequal Variances Hypothesis 8 Two-sample t-test Assuming Unequal Variances Hypothesis 9 Two-sample t-test Assuming Unequal Variances vi
7 5.10 Hypothesis 10 Two-sample t-test Assuming Unequal Variances Hypothesis 11 Two-sample t-test Assuming Unequal Variances Hypothesis 12 Two-sample t-test Assuming Unequal Variances Hypothesis 13 Two-sample t-test Assuming Unequal Variances Hypothesis 14 Two-sample t-test Assuming Unequal Variances Hypothesis 15 Two-sample t-test Assuming Unequal Variances Hypothesis 16 Two-sample t-test Assuming Unequal Variances Overall reaction to the interface (terrible - wonderful) Overall reaction to the interface (difficult - easy) Overall reaction to the interface (frustrating - satisfying) Overall reaction to the interface (dull - stimulating) Overall reaction to the interface (rigid - flexible) Screen: Overall layout Screen: The color scheme Screen: Font style (size, color...) Screen: Separation/ layout of the information with concept maps on the left and text on the right Screen: Sequence of screens Screen: Use of terms throughout the system vii
8 5.28 Learning to use the system Exploring features by trial and error Navigation is straightforward Help menu item The concept map is helpful in understanding the relationships between graph concepts The concept map is helpful in navigating the system The information presented is useful The information presented is interesting The definitions of concepts are clear The examples helped me understand concepts better The animations helped me understand concepts better The algorithms helped me understand concepts better I gained new knowledge about graph data structure and algorithms from the system I think the system helped me understand the concepts better than a textbook. 95 viii
9 List of Tables 3.1 View A Concept Use Case View An Algorithm Use Case View An Animation Use Case Map Object Description Node Object Description Link Object Description Overall reaction to the interface (terrible - wonderful) Overall reaction to the interface (difficult - easy) Overall reaction to the interface (frustrating - satisfying) Overall reaction to the interface (dull - stimulating) Overall reaction to the interface (rigid - flexible) Screen: Overall layout Screen: The color scheme Screen: Font style (size, color...) Screen: Separation/ layout of the information with concept maps on the left and text on the right Screen: Sequence of screens Screen: Use of terms throughout the system Learning to use the system Exploring features by trial and error Navigation is straightforward ix
10 5.15 Help menu item The concept map is helpful in understanding the relationships between graph concepts The concept map is helpful in navigating the system The information presented is useful The information presented is interesting The definitions of concepts are clear The examples helped me understand concepts better The animations helped me understand concepts better The algorithms helped me understand concepts better I gained new knowledge about graph data structure and algorithms from the system I think the system helped me understand the concepts better than a textbook Hypothesis 1 Paired t-test Hypothesis 2 Paired t-test Hypothesis 3 Paired t-test Hypothesis 4 Paired t-test Hypothesis 5 Two-sample t-test Assuming Unequal Variances Hypothesis 6 Two-sample t-test Assuming Unequal Variances Hypothesis 7 Two-sample t-test Assuming Unequal Variances Hypothesis 8 Two-sample t-test Assuming Unequal Variances Hypothesis 9 Two-sample t-test Assuming Unequal Variances Hypothesis 10 Two-sample t-test Assuming Unequal Variances Hypothesis 11 Two-sample t-test Assuming Unequal Variances Hypothesis 12 Two-sample t-test Assuming Unequal Variances Hypothesis 13 Two-sample t-test Assuming Unequal Variances Hypothesis 14 Two-sample t-test Assuming Unequal Variances Hypothesis 15 Two-sample t-test Assuming Unequal Variances Hypothesis 16 Two-sample t-test Assuming Unequal Variances Improvement scores of all groups x
11 Chapter 1 Introduction The effects that technological advances have on education and how these advances can be used to improve the learning process are research fields that attract a large number of researchers to study their many different aspects. One such aspect is the development of interactive e-textbooks. Interactive e-textbooks are defined as books that go beyond the static nature of printed textbooks. The first chapter of this thesis explains what e-textbooks are and what characteristics they have over traditional printed textbooks. This chapter also reviews previous research on e-textbooks in terms of its contributions, achievements, the technologies used, and limitations. It also states our vision of an e-textbook, the motivation behind it and its requirements. The rest of the thesis is structured as follows: the second chapter discusses the efforts that went toward developing an e-textbook prototype and how the requirements of our vision were met. It explains the functions provided to the user (student), the software architecture, and the user interface. Methodology used to test the system is described in the third chapter. This chapter describes the procedure followed in three studies: the usability testing, pilot testing, and actual testing. The purpose of each testing, and the statistical tests used to analyze the collected data are also discussed. Results of data analyses and their implications are discussed in the fourth chapter. We ask three research questions. Does an e-textbook improve student s performance? Does it improve student s performance better than a traditional printed text? Does it increase student s engagement with the material? T-tests aim to answer the first research question about 1
12 the effect of e-textbooks on student performance and the second question that compares between the performances of students who used the e-textbook and students who used the printed textbook. The third research question is answered by analyzing students answers to the user interface evaluation survey that measures students reaction to the e-textbook. Lastly, a conclusion is included along with suggestions for future work and how the developed prototype can be used as a basis for further research in the field of e-textbooks, which in turn can lead to advances in learning from e-textbooks. 2
13 Chapter 2 Literature Review Advances in computer technology, especially interactive technologies, can potentially benefit the teaching and learning process tremendously. One area ripe for development is that of textbooks. Despite the proliferation of the web and mobile devices, textbooks remain mostly as printed hard copies. Even the so-called e-books are generally digitized versions of the printed textbooks with interactive elements such as video and animations embedded into them. In the present research, we explore the possibility of structuring knowledge in e- textbooks not as chapters and sections, but as small chunks of knowledge connected together in concept maps that students can interactively navigate through. In this chapter we discuss a few selected papers on the development and evaluation of interactive e-textbooks. Interactive e-textbooks are defined as books that go beyond the static nature of printed textbooks. These books are often characterized by some or all of the following requirements: Interactive visualization Automatically assessed exercises that provide feedback to the learner Interactive learning activities Customization of content [3] Many interactive e-textbooks have been developed on different science subjects, but especially in Computer Science as the nature of the field itself makes it intuitive to use this kind of tool in teaching. One system that fulfils one of the previous requirements is Trakala2 for data structures and algorithms. Trakala2 provides interactive simulation exercises that allow students to 3
14 manipulate data structures as the actual algorithm would. The system provides feedback and compares student s answer against a model answer. Several studies were conducted to see the effects of Trakala2 on students learning processes and outcomes. One such study was done at Helisnki University of Technology with Computer Science students on a data structure and algorithms course. Two students were paired together and were assigned to either a viewing group or a changing group. Results showed performance differences between the two groups, indicating that it was important for students to engage and interact with the visualizations rather than just passively viewing them [4]. Another attempt at designing an e-textbook was the Computational Physics e-textbook created at Oregon State University. The developers chose a PDF format for the book to be accessible on any platform, and then added capabilities that made it more interactive, like video-based lectures that showed the professor explaining the topic alongside slides and links to codes and applets. The e-textbook also has Python simulations, executable equations and figures, a glossary for the different concepts and the ability to hear the definition of a word without leaving the page. An external assessment rated the e-textbook 4 out of 5 stars [5]. A research group from China and Germany built an e-textbook for a Theory of Computation course based on ActiveMath. ActiveMath is a web-based learning environment that adapts to the individual needs of each learner. The prototype of the e-textbook contained, among other things, interactive exercises that provided feedback to the students and measured their performance, and because of the adaptive nature of ActiveMath, the student model (the model that the system builds to assess students skills against the domain knowledge) updates dynamically to reflect the student s progress. The researchers are planning to improve this prototype by allowing students to post questions and instructors to grade and provide feedback. Also, they are planning to develop a concept map navigator that is color coded to reflect what concepts are well understood and what concepts need more work [2]. Sadhana, Stylianou and Hubscher (2003) discussed their motivation, design and efforts in building a Concept Mapped Project-Based Activity Scaffolding System (CoMPASS) in [8]. 4
15 CoMPASS provides students with a concept map (a graphical representation of the domain knowledge) and a text, both of which change dynamically when the student navigates through the system. A study using CoMPASS with middle school students found that students who used the concept maps to navigate performed significantly better than students who used the system without the map [8]. Puntambekar and Stylianou (2005) reported another study that used CoMPASS. In this study, CoMPASS was used to analyze students navigation patterns and group them into clusters. According to this analysis, students navigation patterns were clustered into four groups, each requiring a different kind of support. Another study was later conducted, after using the first study as a basis to build different kinds of navigation support into CoMPASS. This second study had two groups of students, one group used the CoMPASS system with navigation support (prompts that provided hints to students about what concept or topics they need to view next), and the second one was not provided with the navigation support. Results from this study showed that students who had the navigation support performed better on a concept map test [9]. Shaffer, Karavirta, Korhonen and Naps (2011) described their efforts with OpenDSA, an interactive book for data structures and algorithms. This project builds upon previous experiences in the field to create an e-textbook that does not suffer from known problems and drawbacks. One such improvement is the use of HTML5 and JavaScript to author the content (static and dynamic). The reason behind this decision is that Flash and Java Applets that were used to build most of the previous e-textbooks require a plug-in to run and are not compatible (do not run) on tablet devices. Furthermore, to make content authoring an easier process, a specialized JavaScript library was developed; it is called JSAV (JavaScript Algorithm Visualization) library. The authors also acknowledged the tremendous effort that is required for such a project, and for that reason they sought an open source environment to host the e-textbook. This will attract more authors to take part in the project and create content for the book, and more developers to develop and build interactive elements. In 5
16 addition, instructors will benefit by being able to arrange topics and units as they see fit for their individual courses and classes [10]. Miller and Ranum (2012) explained their vision for e-textbooks, how it was implemented, and the results of a trial. Their e-textbook included a number of features such as videos, code editing, execution, and visualization. It also used an open source authoring system to give instructors the ability to edit content. After using the e-textbook for teaching an Introduction to Computer Science course at Luther College for a semester, they reported results showing a positive reaction from students [6]. Alvarado et al. (2012) used the e-textbook developed by Miller and Ranum to explore how students use its features and how their usage affects their performance. Though these reseachers reported that students used the e-textbook much like a traditional textbook despite their high level of satisfaction with the e-textbook, they also reported that students, who used the e-textbook more outside of class hours, preformed higher on midterm exams [1]. With the current technological advances and the spread of tablet devices that do not support Java or Flash, an e-textbook that does not require these technologies is an ideal solution to the problems encountered in the previous research efforts. An e-textbook that is platform independent is better. In this study, an e-textbook prototype was developed according to this vision and above mentioned requirements (except for the inclusion of automatically assessed exercises). Interactive elements of the prototype were built with JavaScript making the e-textbook platform independent. Inspired by the CoMPASS e-textbook, a concept map was used as the navigational tool. It has been shown that concept maps provide a powerful tool for learning and teaching if designed and constructed carefully [7]. This prototype was then used in three studies to investigate the effect of the e-textbook on students performance and whether the e-textbook increased students engagement with the material. 6
17 Chapter 3 Software Design Our goal was to build a prototype embodying our vision of a platform independent e-textbook - an e-textbook that does not require additional plug-ins to run on PCs or laptops. In addition, this e-textbook uses JavaScript to implement the interactive elements of its architecture. This prototype concentrates on the graph data structure and associated algorithms, and uses concept maps as a navigation tool. There were two parts to building this prototype: the technical part of building and coding the concept maps, pages, and interface, and the content part that included deciding what concepts to include, the definitions, examples, images, and animations. 3.1 Use Cases Actors The primary actors (users) for the e-textbook prototype are the students, especially Computer Science students. Students will use the system to gain new knowledge or to improve their understanding of the subject. However, instructors can also be actors (users) of the system. They may use the system as a tool when teaching a class or as an additional reading. In addition, public users who are not students or instructors but are interested in gaining information about the e-textbook subject may also use the system. Note that the use case diagram presented later only shows the student because a student is the main actor and user that we focused on when building this prototype. 7

18 3.1.2 Use Cases Diagram Figure 3.1: Use Cases Diagram 8
19 3.1.3 Use Cases Use case name: Primary actor: View A Concept Student, Instructor, Public Users Supporting actors: Supporting use cases: Use case objective: Displaying a concepts definition and examples Entry criteria: Trigger: Basic Flow: Success exit criteria: The user clicks on a concepts node in the map The student clicks on a node in the map. Then the definition and examples are loaded and displayed. The definition and examples have been displayed Alternate Flow: Failure exit criteria: Notes: Table 3.1: View A Concept Use Case Use case name Primary actor View An Algorithm Student, Instructor, Public Users Supporting actors Supporting use cases Use case objective Entry criteria Trigger Basic Flow Success exit criteria View A Concept Displaying a concepts algorithm The clicked concept has an associated algorithm The user clicks on a concepts node in the map The student clicks on a node in the map. Then the student selects the algorithm. After that, the algorithm is loaded and displayed. The algorithm has been displayed Alternate Flow Failure exit criteria Notes Table 3.2: View An Algorithm Use Case 9
20 Use case name: Primary actor: View An Animation Student, Instructor, Public Users Supporting actors: Supporting use cases: Use case objective: Entry criteria: Trigger: Basic Flow: Success exit criteria: View A Concept Opening a concepts animation The clicked concept has an associated animation The user clicks on a concepts node in the map The student clicks on a node in the map. Then the student selects the animation. After that, an animation is loaded and displayed The animation has been displayed Alternate Flow: Failure exit criteria: Notes: Table 3.3: View An Animation Use Case 3.2 Software Architecture The main feature of the prototype e-textbook is the navigational concept map. However, unlike the concept maps in CoMPASS [8], which were developed as Java Applets and required plug-ins from users browsers, we wanted our system to be platform independent, able to run on laptops as well as tablet devices, and not require any additional plug-ins from users. These requirements steered us toward the use of HTML5 and JavaScript. One of the first libraries that we experimented with was SipcyNodes 1. This library provides a nice interface and smooth animations, and uses XML to store the nodes information. However, the library has one major drawback and that is the Flash elements used for animation. This drawback not only makes it hard to configure and customize the map as we needed, but it also does not meet our main requirement of not needing a plug-in to run the interface. One other tool that we looked into was CmapTools 2. CmapTools is a software for creating concept maps and sharing them. It has great features to control the appearance of the map, the links, and the labels. In addition, it allows linking the concepts to external resources and other created concept maps. The problem with the maps created with this
21 tool is that they are static and would require another library to read them (using XML files or other extensions that are supported with CmapTools). This meant that we would need to create a library specifically to read those files and configure them to the way we want our concept maps to look like. We did not go with this approach because we wanted the process of creating concept maps to be easy for authors and developers. We did not want them to have to deal with using multiple tools just to create a single concept map. After experimenting with many options and many JavaScript libraries, we decided to use the D3 3 (Data-Driven Documents) library. D3 is a JavaScript library that has the capabilities to visualize data using HTML, CSS, and SVG. D3 meets our requirements of not requiring any plug-ins, being platform independent, and the ability to run on laptops as well as tablet devices. In addition, the library is flexible, easy to configure and customize to function as we desire. D3 requires the data to be written and stored in JSON files. It then reads these files and produce the concept maps as configured by the author. Using this approach means that all work is done at the server-side and that browser at the client-side is only responsible for interpreting and displaying the HTML files. Figure 3.2 shows the architecture of the system. 3.3 Object Descriptions As stated in the previous section, D3 uses JSON to store the concept maps data. The data is stored into objects, namely: nodes and links. Below we provide a detailed description of each of these objects and their attributes (Tables 3.4, 3.5, 3.6). Note that each JSON file i.e. each map is also considered an object that contains other objects
 Name Attributes Description This is the name of the map to be referenced on the program.")
22 Figure 3.2: Software Architecture Class Name: Map Brief Description: The Map class is responsible for creating concept maps. It holds Node objects and Link objects together. Attributes (fields) Name Attributes Description This is the name of the map to be referenced on the program. Table 3.4: Map Object Description 12
23 Class Name: Node Brief Description: The Node class is responsible for storing information about each concept on the domain knowledge. Attributes (fields) Name Color Content X Y Fixed Size Algorithm Animation Attributes Description This is the name of the concept. This is the color of the concepts node. This is the name of the HTML page that contains the concepts definition and examples. This is the x-coordinate of the concepts circle center. This is the y-coordinate of the concepts circle center. This is a flag that indicates whether the position of the concepts circle is fixed or not. This is the size of the concepts circle radius. This is the name of the HTML page that contains the concepts algorithm. This is the link of the HTML page that contains the concepts animation. Table 3.5: Node Object Description Class Name: Link Brief Description: The Link class is responsible for connecting two objects of Node class together Attributes (fields) Source Target Attributes Description This is the starting concept. This is the ending concept Table 3.6: Link Object Description 13

24 3.4 Object Collaborations Figure 3.3: Class Diagram 3.5 Human Interface Design Overview of User Interface The e-textbooks interface was developed entirely through HTML5 and CSS3. The interface was kept simple so that a student s attention is focused and finding the needed information is easy. The screen is split into three parts: the navigation bar at the top, the concept map at the left, and the content panel at the right. The navigation bar contains links to the home page, about page, help page, and contact page. 14
25 The concept map on the left is color coded to show three different levels. The first level is the central node or concept (which is the concept that is being viewed by the student at any moment). The second level is the nodes or concepts coming out of the central node or concept, and the third level is the node or concept that gets the student to the previous page. When a student clicks on a concept, the system can behave in two different ways. The system either loads a new page with a new concept map, or the clicked concepts node changes size (gets bigger) and the concepts definition and examples are loaded on the right panel. The content panel on the right shows the information requested by the user, such as the concepts definition, examples, and algorithms. However, the user can navigate or jump from one concept to another through the content panel by clicking on the links available on the displayed text. Each concept on the content area is a link that can be clicked and upon clicking this link, the system will behave in a similar manner as if the user clicked on a concept on the map. The system will either load a new page with a new concept map with the clicked concept in focus, or if the clicked concept is on the same map, then its node will get bigger while the previous concept s node will return to its original size and its definition will be displayed on the right panel. In addition, the content panel has a menu icon on the upper right that can be clicked to view the side menu. The side menu has several links to additional information about a concept, like algorithms, animations, exercises, and videos. These links will either load the information on the content panel or will direct the user to an external page that contains the required information Screen Images Below are some screen shots (Figures 3.4, 3.5, 3.6) highlighting different features of the e-textbook. To see more screen shots, refer to appendix A. 15

26 Figure 3.4: E-Textbook Main Page Figure 3.5: E-Textbook s Concept s Definition and Example 16

27 Figure 3.6: E-Textbook s Side Menu 17
28 Chapter 4 Methodology This study focused on the following questions: Does an e-textbook improve a student s learning as measured by his/her performance in a test? Does an e-textbook improve a student s learning and performance better than a printed textbook? Do students like interacting with the interface of an e-textbook and does it increase a student s engagement with the course material? To answer the first question, a paired t-test was performed to determine if there is a significance difference between students performance on a test after they used the e-textbook compared to their performance on a test before they used the e-textbook. The second question is answered by performing an independent t-test to determine if there is a significance difference of performance on a test between students who used the e-textbook compared to students who used a printed textbook. An interface evaluation survey was used to answer the third question. The survey questions explored the students reaction to the e-textbook s interface, the layout and organization of its screen, if it is easy to use or not, and if the e-textbook s content helped them understand the subject in a better way than a printed textbook. To recruit participants for this study, an flyer was sent to the mailing lists of the undergraduate students and graduate students of the Computer Science and Software Engineering (CSSE) Department at Auburn University. The flyer contained a set of 18
29 demographic questions that students had to answer and their answers back to set a time for them to do the study. The demographic survey asked about student s school year, GPA range, and if the student have any previous knowledge about graph data structure. See appendix B for the flyer, demographic data questionnaire, and the consent form. Appendix D summarizes the collected demographic data. However, due to the difficulty of assigning students to the different groups on a matched basis, the students were assigned to these groups randomly. One final note to point out is that the content material covered in this study was the graph data structure. To test our e-textbook and answer our research questions, we first performed a usability testing. After that, we did a pilot test, and lastly we performed the actual testing. We explain each of these tests and the purpose of each one of them in the following sections. 4.1 Usability Testing Before testing the usefulness of the e-textbook, a usability testing was done to evaluate the e-textbook s interface. The test was completed by four graduate students who work in the field of Human Computer Interaction (HCI). The participants were asked to come to the lab at a scheduled time, then they were given the consent form to sign and the procedure was explained to them. They had the opportunity to ask any questions they had before they started. The participants were given a set of 27 questions and were asked to find the answers to these questions using the e-textbook. The usability testing was done using the Concurrent Think Aloud technique [11] in which the participants were asked and encouraged to say their thoughts aloud while they were using the system. Their thoughts and notes were recorded by the observer along with the observer s notes on how the participants used and interacted with the system. In addition, log files that contain the pages each participant visited and the concepts he/she viewed were recorded and stored. 19
30 All data collected from this test can be found in appendix C. We discuss the results of this testing in the next chapter. 4.2 Pilot Testing Before starting the actual testing, we ran a pilot test to make certain that no problems would occur when we did the actual test and to decide the time that should be allocated for each task of the procedure. Four undergraduate students did the pilot test. Participants came to the lab at the scheduled time, signed the consent form, and the procedure was explained to them. Any questions they had were answered before they started. The pilot test was composed of four tasks: a pretest, a time to explore the e-textbook and study its material, a posttest, and a survey to evaluate the e-textbook. Both the pretest and the posttest consisted of 20 questions. The observer recorded the time each participant spent on each of these tasks. 4.3 Actual Testing For the actual testing, we had 31 participants. Those participants were divided to two groups: undergraduate students (n = 21) and graduate students (n = 10). The undergraduate students were further divided to two groups: students who have previous knowledge of the graph data structure (Students who took or are taking COMP 3270), and students who have little previous knowledge. The actual testing followed the same procedure as the pilot testing with one exception. The tasks on the actual testing are timed unlike the pilot testing. Those times are based on the times recorded from the pilot testing. The undergraduate students were randomly assigned to one of two groups: the e- textbook group, or the printed text group. The undergraduate students e-textbook group 20
31 had a total of 11 participants while the undergraduate students printed text group had a total of 10 participants. The graduate students were also randomly assigned to one of those two groups. The graduate students e-textbook group had a total of 5 participants and the graduate students printed text group had a total of 5 participants. The procedure consisted of taking a pretest (time limited to 15 minutes), studying from an e-textbook or a printed text (time limited to 30 minutes), and a posttest (time limited to 15 minutes). Participants on the e-textbook group also answered the interface evaluation survey s questions (no time limit). Before starting the study, students were handed the consent forms to read and sign, and the study was explained to them. Any questions and concerns they had were answered before they started. Data collected from this test consisted of pretest scores, posttest score, improvement (posttest score - pretest score) scores, answers to the survey questions, and log files containing visited pages and concepts viewed by each participant. In this document, we will call undergraduate students who have previous knowledge of graph data structure as 3270 COMP students, and undergraduate students who have little previous knowledge of graph data structure as other UG students. When referring to both of these groups, we will use the term undergraduate students. The following statistical analysis tests were performed in this study: paired t-test and independent t-test. The paired t-test was used to determine if the performance of students in the e-textbook group (treatment group) improved after the students used the e-textbook. This test helped us answer our first research question. The following hypotheses were tested: Hypothesis Test 1: 21
32 There is no difference in the mean scores between the posttest and the pretest of 3270 COMP students in the e-textbook group vs. the posttest mean score for 3270 COMP students in the e-textbook group is greater than their pretest mean scores. H 0 : µ post = µ pre, H A : µ post > µ pre post = posttest mean score of 3270 COMP students in the e-textbook group pre = pretest mean score of 3270 COMP students in the e-textbook group Hypothesis Test 2: There is no difference in the mean scores between the posttest and the pretest of other UG students in the e-textbook group vs. the posttest mean score for other UG students in the e-textbook group is greater than their pretest mean scores. H 0 : µ post = µ pre, H A : µ post > µ pre post = posttest mean score of other UG students in the e-textbook group pre = pretest mean score of other UG students in the e-textbook group Hypothesis Test 3: There is no difference in the mean scores between the posttest and the pretest of all undergraduate students in the e-textbook group vs. the posttest mean score for all undergraduate students in the e-textbook group is greater than their pretest mean scores. H 0 : µ post = µ pre, H A : µ post > µ pre post = posttest mean score of undergraduate students in the e-textbook group pre = pretest mean score of undergraduate students in the e-textbook group Hypothesis Test 4: There is no difference in the mean scores between the posttest and the pretest of graduate students in the e-textbook group vs. the posttest mean score for graduate students in the e-textbook group is greater than their pretest mean scores. 22
33 H 0 : µ post = µ pre, H A : µ post > µ pre post = posttest mean score of graduate students in the e-textbook group pre = pretest mean score of graduate students in the e-textbook group To answer the second research question, an independent t-test was performed. This test was used to determine if the performance of students in the e-textbook group (treatment group) was better than that of students in the printed textbook. To compare student performance, we first compared the pretest scores of each group of students to ensure that they had similar prior knowledge coming into the experiment (i.e., that the null hypotheses were supported). Then we compared their posttest scores to see if the e-textbook group learned and performed better than the text groups. A comparison of the improvement scores (posttest score - pretest score) was done for a similar purpose. The following hypotheses were tested: Hypothesis Test 5: There is no difference in the pretest mean scores of 3270 COMP students in the e- textbook group and 3270 COMP students in the printed textbook group vs. the pretest mean score for 3270 COMP students in the e-textbook group is different from the pretest mean scores for 3270 COMP students in the printed textbook group. H 0 : µ epre = µ pre, H A : µ epre µ pre epre = pretest mean score of 3270 COMP students in the e-textbook group pre = pretest mean score of 3270 COMP students in the printed textbook group Hypothesis Test 6: There is no difference in the pretest mean scores of other UG students in the e-textbook group and other UG students in the printed textbook group vs. the pretest mean score for other UG students in the e-textbook group is different from the pretest mean scores for other UG students in the printed textbook group 23
34 H 0 : µ epre = µ pre, H A : µ epre µ pre epre = pretest mean score of other UG students in the e-textbook group pre = pretest mean score of other UG students in the printed textbook group Hypothesis Test 7: There is no difference in the pretest mean scores of all undergraduate students in the e-textbook group and all undergraduate students in the printed textbook group vs. the pretest mean score for all undergraduate students in the e-textbook group is different from the pretest mean scores for all undergraduate students in the printed textbook group H 0 : µ epre = µ pre, H A : µ epre µ pre epre = pretest mean score of undergraduate students in the e-textbook group pre = pretest mean score of undergraduate students in the printed textbook group Hypothesis Test 8: There is no difference in the pretest mean scores of graduate students in the e-textbook group and graduate students in the printed textbook group vs. the pretest mean score for graduate students in the e-textbook group is different from the pretest mean scores for graduate students in the printed textbook group H 0 : µ epre = µ pre, H A : µ epre µ pre epre = pretest mean score of graduate students in the e-textbook group pre = pretest mean score of graduate students in the printed textbook group Hypothesis Test 9: There is no difference in the posttest mean scores of 3270 COMP students in the e- textbook group and 3270 COMP students in the printed textbook group vs. the posttest mean score for 3270 COMP students in the e-textbook group is greater than the posttest mean scores for 3270 COMP students in the printed textbook group. 24
35 H 0 : µ epost = µ post, H A : µ epost > µ post epost = posttest mean score of 3270 COMP students in the e-textbook group post = posttest mean score of 3270 COMP students in the printed textbook group Hypothesis Test 10: There is no difference in the posttest mean scores of other UG students in the e-textbook group and other UG students in the printed textbook group vs. the posttest mean score for other UG students in the e-textbook group is greater than the posttest mean scores for other UG students in the printed textbook group. H 0 : µ epost = µ post, H A : µ epost > µ post epost = posttest mean score of other UG students in the e-textbook group post = posttest mean score of other UG students in the printed textbook group Hypothesis Test 11: There is no difference in the posttest mean scores of all undergraduate students in the e-textbook group and all undergraduate students in the printed textbook group vs. the posttest mean score for all undergraduate students in the e-textbook group is greater than the posttest mean scores for all undergraduate students in the printed textbook group H 0 : µ epost = µ post, H A : µ epost > µ post epost = posttest mean score of undergraduate students in the e-textbook group post = posttest mean score of undergraduate students in the printed textbook group Hypothesis Test 12: There is no difference in the posttest mean scores of graduate students in the e-textbook group and graduate students in the printed textbook group vs. the posttest mean score for graduate students in the e-textbook group is greater than the posttest mean scores for graduate students in the printed textbook group 25
36 H 0 : µ epost = µ post, H A : µ epost > µ post epost = posttest mean score of graduate students in the e-textbook group post = posttest mean score of graduate students in the printed textbook group Hypothesis Test 13: There is no difference in the improvement mean scores of 3270 COMP students in the e- textbook group and 3270 COMP students in the printed textbook group vs. the improvement mean score for 3270 COMP students in the e-textbook group is greater than the improvement mean scores for 3270 COMP students in the printed textbook group. H 0 : µ EI = µ P I, H A : µ EI > µ P I EI = improvement mean score of 3270 COMP students in the e-textbook group PI = improvement mean score of 3270 COMP students in the printed textbook group Hypothesis Test 14: There is no difference in the improvement mean scores of other UG students in the e- textbook group and other UG students in the printed textbook group vs. the improvement mean score for other UG students in the e-textbook group is greater than the improvement mean scores for other UG students in the printed textbook group. H 0 : µ EI = µ P I, H A : µ EI > µ P I EI = improvement mean score of other UG students in the e-textbook group PI = improvement mean score of other UG students in the printed textbook group Hypothesis Test 15: There is no difference in the improvement mean scores of all undergraduate students in the e-textbook group and all undergraduate students in the printed textbook group vs. the improvement mean score for all undergraduate students in the e-textbook group is greater than the improvement mean scores for all undergraduate students in the printed textbook group. 26
37 H 0 : µ EI = µ P I, H A : µ EI > µ P I EI = improvement mean score of undergraduate students in the e-textbook group PI = improvement mean score of undergraduate students in the printed textbook group Hypothesis Test 16: There is no difference in the improvement mean scores of graduate students in the e- textbook group and graduate students in the printed textbook group vs. the improvement mean score for graduate students in the e-textbook group is greater than the improvement mean scores for graduate students in the printed textbook group. H 0 : µ EI = µ P I, H A : µ EI > µ P I EI = improvement mean score of graduate students in the e-textbook group PI = improvement mean score of graduate students in the printed textbook group Data collected from this test can be found in appendix E. We discuss the results of data analyses in the next chapter. 27
38 Chapter 5 Data Analysis and Results 5.1 Usability Testing The aim of the usability testing was to uncover any problems the e-textbooks interface might have. As stated in the previous chapter, participants notes and their interactions with the system were recorded. These notes were reviewed after the testing to decide what needed to be fixed, if any, before the actual testing. We list below a number of interface changes that were implemented before the actual testing and the reasons for each. To see the full list of the recorded notes, see appendix C. Usability testers suggested adding/changing the headings on some graph representation examples. As we thought that this suggestion would make the content more clear and understandable to students, it was taken into account and implemented before the actual testing. Usability testers suggested adding the information that the matrix representation for an undirected graph will be a symmetric matrix. As we thought that this suggestion would help students understand the content better, it was taken into account and implemented before the actual testing. Usability testers suggested changing the common examples of ancestor and parent concepts to a different example on each concept. As we thought that this suggestion would help students understand each concept better and to differentiate between the two concepts, it was taken into account and implemented before the actual testing. 28
39 Two nodes on two different concept maps had the same name. Usability testers suggested editing the labels of these nodes to remove any confusion a student might have. As we thought that this suggestion would make the content more clear to students, it was taken into account and implemented before the actual testing. One other suggestion that was mentioned by two testers is that the graph types concept map is cluttered and has a large number of nodes that makes it hard to keep track of all the concepts on it. While this suggestion is valid, it was decided to implement it on the next development iteration of the e-textbook because it is a major change requiring considerable time to develop. Other suggestions (appendix C) that were not considered for implementation were either invalid or out of the scope of the e-textbook subject materials User Interface Evaluation Survey These are the answers of the usability testing participants to the user interface evaluation survey. Reaction to the interface: 1. Overall reaction to the interface (terrible - wonderful): see Table 5.1 Response range: 0 (terrible) - 9 (wonderful) Result: Number of responses = 4, Mean = 7.75, Standard deviation =
40 Response Values Response Counts % 0 (terrible) 0 0% 1 0 0% 2 0 0% 3 0 0% 4 0 0% 5 0 0% 6 0 0% % % 9 (wonderful) 0 0% Total 4 100% Table 5.1: Overall reaction to the interface (terrible - wonderful) 2. Overall reaction to the interface (difficult - easy): see Table 5.2 Response range: 0 (difficult) - 9 (easy) Result: Number of responses = 4, Mean = 8.75, Standard deviation =
41 Response Values Response Counts % 0 (difficult) 0 0% 1 0 0% 2 0 0% 3 0 0% 4 0 0% 5 0 0% 6 0 0% 7 0 0% % 9 (easy) 3 75% Total 4 100% Table 5.2: Overall reaction to the interface (difficult - easy) 3. Overall reaction to the interface (frustrating - satisfying): see Table 5.3 Response range: 0 (frustrating) - 9 (satisfying) Result: Number of responses = 4, Mean = 8.5, Standard deviation =
42 Response Values Response Counts % 0 (frustrating) 0 0% 1 0 0% 2 0 0% 3 0 0% 4 0 0% 5 0 0% 6 0 0% % 8 0 0% 9 (satisfying) 3 75% Total 4 100% Table 5.3: Overall reaction to the interface (frustrating - satisfying) 4. Overall reaction to the interface (dull - stimulating): see Table 5.4 Response range: 0 (dull) - 9 (stimulating) Result: Number of responses = 4, Mean = 8.5, Standard deviation =
43 Response Values Response Counts % 0 (dull) 0 0% 1 0 0% 2 0 0% 3 0 0% 4 0 0% 5 0 0% 6 0 0% 7 0 0% % 9 (stimulating) 2 50% Total 4 100% Table 5.4: Overall reaction to the interface (dull - stimulating) 5. Overall reaction to the interface (rigid - flexible): see Table 5.5 Response range: 0 (rigid) - 9 (flexible) Result: Number of responses = 4, Mean = 7.75, Standard deviation =
44 Response Values Response Counts % 0 (rigid) 0 0% 1 0 0% 2 0 0% 3 0 0% 4 0 0% 5 0 0% % 7 0 0% % 9 (flexible) 1 25% Total 4 100% Table 5.5: Overall reaction to the interface (rigid - flexible) Screen: 1. Screen: Overall layout: see Table 5.6 Response range: 0 (bad) - 9 (good) Result: Number of responses = 4, Mean = 8, Standard deviation =
45 Response Values Response Counts % 0 (bad) 0 0% 1 0 0% 2 0 0% 3 0 0% 4 0 0% 5 0 0% % 7 0 0% % 9 (good) 2 50% Total 4 100% Table 5.6: Screen: Overall layout 2. Screen: The color scheme: see Table 5.7 Response range: 0 (bad) - 9 (good) Result: Number of responses = 4, Mean = 8, Standard deviation =
46 Response Values Response Counts % 0 (bad) 0 0% 1 0 0% 2 0 0% 3 0 0% 4 0 0% 5 0 0% 6 0 0% % % 9 (good) 1 25% Total 4 100% Table 5.7: Screen: The color scheme 3. Screen: Font style (size, color...): see Table 5.8 Response range: 0 (bad) - 9 (good) Result: Number of responses = 4, Mean = 8, Standard deviation = 0 36
47 Response Values Response Counts % 0 (bad) 0 0% 1 0 0% 2 0 0% 3 0 0% 4 0 0% 5 0 0% 6 0 0% 7 0 0% % 9 (good) 0 0% Total 4 100% Table 5.8: Screen: Font style (size, color...) 4. Screen: Separation/ layout of the information with concept maps on the left and text on the right: see Table 5.9 Response range: 0 (confusing) - 9 (very clear) Result: Number of responses = 4, Mean = 9, Standard deviation = 0 37
48 Response Values Response Counts % 0 (confusing) 0 0% 1 0 0% 2 0 0% 3 0 0% 4 0 0% 5 0 0% 6 0 0% 7 0 0% 8 0 0% 9 (very clear) 4 100% Total 4 100% Table 5.9: Screen: Separation/ layout of the information with concept maps on the left and text on the right 5. Screen: Sequence of screens: see Table 5.10 Response range: 0 (confusing) - 9 (very clear) Result: Number of responses = 4, Mean = 7.25, Standard deviation =
49 Response Values Response Counts % 0 (confusing) 0 0% 1 0 0% 2 0 0% 3 0 0% 4 0 0% 5 0 0% % % % 9 (very clear) 0 0% Total 4 100% Table 5.10: Screen: Sequence of screens 6. Screen: Use of terms throughout the system: see Table 5.11 Response range: 0 (inconsistent) - 9 (consistent) Result: Number of responses = 4, Mean = 9, Standard deviation = 0 39
50 Response Values Response Counts % 0 (inconsistent) 0 0% 1 0 0% 2 0 0% 3 0 0% 4 0 0% 5 0 0% 6 0 0% 7 0 0% 8 0 0% 9 (consistent) 4 100% Total 4 100% Table 5.11: Screen: Use of terms throughout the system Learning: 1. Learning to use the system: see Table 5.12 Response range: 0 (difficult) - 9 (easy) Result: Number of responses = 4, Mean = 8.75, Standard deviation =
51 Response Values Response Counts % 0 (difficult) 0 0% 1 0 0% 2 0 0% 3 0 0% 4 0 0% 5 0 0% 6 0 0% 7 0 0% % 9 (easy) 3 75% Total 4 100% Table 5.12: Learning to use the system 2. Exploring features by trial and error: see Table 5.13 Response range: 0 (difficult) - 9 (easy) Result: Number of responses = 4, Mean = 8.75, Standard deviation =
52 Response Values Response Counts % 0 (difficult) 0 0% 1 0 0% 2 0 0% 3 0 0% 4 0 0% 5 0 0% 6 0 0% 7 0 0% % 9 (easy) 3 75% Total 4 100% Table 5.13: Exploring features by trial and error 3. Navigation is straightforward: see Table 5.14 Response range: 0 (never) - 9 (always) Result: Number of responses = 4, Mean = 8.5, Standard deviation =
53 Response Values Response Counts % 0 (never) 0 0% 1 0 0% 2 0 0% 3 0 0% 4 0 0% 5 0 0% 6 0 0% % 8 0 0% 9 (always) 3 75% Total 4 100% Table 5.14: Navigation is straightforward 4. Help menu item: see Table 5.15 Response range: 0 (unhelpful) - 9 (helpful) Result: Number of responses = 2, Mean = 7.5, Standard deviation =
54 Response Values Response Counts % 0 (Unhelpful) 0 0% 1 0 0% 2 0 0% 3 0 0% 4 0 0% 5 0 0% 6 0 0% % % 9 (Helpful) 0 0% Total 2 100% Table 5.15: Help menu item Content: 1. The concept map is helpful in understanding the relationships between graph concepts: see Table 5.16 Response Values Response Counts % Strongly Disagree 0 0% Disagree 0 0% Neutral 0 0% Agree 2 50% Strongly Agree 2 50% Total 4 100% Table 5.16: The concept map is helpful in understanding the relationships between graph concepts 44
55 2. The concept map is helpful in navigating the system: see Table 5.17 Response Values Response Counts % Strongly Disagree 0 0% Disagree 0 0% Neutral 0 0% Agree 2 50% Strongly Agree 2 50% Total 4 100% Table 5.17: The concept map is helpful in navigating the system 3. The information presented is useful: see Table 5.18 Response Values Response Counts % Strongly Disagree 0 0% Disagree 0 0% Neutral 0 0% Agree 2 50% Strongly Agree 2 50% Total 4 100% Table 5.18: The information presented is useful 4. The information presented is interesting: see Table
56 Response Values Response Counts % Strongly Disagree 0 0% Disagree 0 0% Neutral 0 0% Agree 3 75% Strongly Agree 1 25% Total 4 100% Table 5.19: The information presented is interesting 5. The definitions of concepts are clear: see Table 5.20 Response Values Response Counts % Strongly Disagree 0 0% Disagree 0 0% Neutral 0 0% Agree 3 75% Strongly Agree 1 25% Total 4 100% Table 5.20: The definitions of concepts are clear 6. The examples helped me understand concepts better: see Table
57 Response Values Response Counts % Strongly Disagree 0 0% Disagree 0 0% Neutral 1 25% Agree 1 25% Strongly Agree 2 50% Total 4 100% Table 5.21: The examples helped me understand concepts better 7. The animations helped me understand concepts better: see Table 5.22 Response Values Response Counts % Strongly Disagree 0 0% Disagree 0 0% Neutral 0 0% Agree 2 67% Strongly Agree 1 33% Total 3 100% Table 5.22: The animations helped me understand concepts better 8. The algorithms helped me understand concepts better: see Table
58 Response Values Response Counts % Strongly Disagree 0 0% Disagree 0 0% Neutral 0 0% Agree 1 33% Strongly Agree 2 67% Total 3 100% Table 5.23: The algorithms helped me understand concepts better 9. I gained new knowledge about graph data structure and algorithms from the system: see Table 5.24 Response Values Response Counts % Strongly Disagree 0 0% Disagree 0 0% Neutral 1 25% Agree 1 25% Strongly Agree 2 50% Total 4 100% Table 5.24: I gained new knowledge about graph data structure and algorithms from the system 10. I think the system helped me understand the concepts better than a textbook: see Table
59 Response Values Response Counts % Strongly Disagree 0 0% Disagree 0 0% Neutral 0 0% Agree 2 50% Strongly Agree 2 50% Total 4 100% Table 5.25: I think the system helped me understand the concepts better than a textbook These results are summarized and discussed at the end of this chapter. 5.2 Actual testing We divide the data collected from this testing to three parts: the pretest, posttest and improvement scores, the user interface evaluation surveys answers, and the log files of the user interaction with the system. Each part of this data is analyzed separately. We grouped the data as follows for analysis purposes: (1) data from COMP 3270 (Introduction to Algorithms) student participants, (2) data from other CSSE undergraduate (UG) student participants, (3) data from all UG students (combining groups 1 and 2), and (4) data from all CSSE graduate student participants. We discuss their analysis in the next sections Pretest, Posttest, and Improvement Scores The pretest, posttest, and improvement scores are helpful in answering the first two research questions we stated in the previous chapter. Paired t-tests and independent t-tests were performed to statistically analyze these data. We report on the results of these tests below. We discuss these results and findings later on. The maximum possible score on both pre and posttest is
60 Mean Standard deviation pretest posttest Table 5.26: Hypothesis 1 Paired t-test Q1. Does an e-textbook improve a student s learning as measured by his/her performance in a test? Null hypothesis 1 states that there is no difference in the mean scores between the posttest and the pretest of 3270 COMP students in the e-textbook group. The alternative hypothesis states that the posttest mean score for 3270 COMP students in the e-textbook group is greater than their pretest mean scores. H 0 : µ post = µ pre, H A : µ post > µ pre post = posttest mean score of 3270 COMP students in the e-textbook group pre = pretest mean score of 3270 COMP students in the e-textbook group A paired t-test was done on the mean scores of the posttest and pretest of 3270 COMP students in the e-textbook group. The test gave a t-statistical of 4.75 and p-value of With p-value and a significance level of α = 0.05, we can reject the null hypothesis. There is sufficient evidence to conclude that there was a statistically significant difference between the mean posttest performance and the mean pretest performance of 3270 COMP students in the e-textbook group with 95% confidence. See Table 5.26 and Figure 5.1. Null hypothesis 2 states that there is no difference in the mean scores between the posttest and the pretest of other UG students in the e-textbook group. The alternative hypothesis states that the posttest mean score for other UG students in the e-textbook group is greater than their pretest mean scores. H 0 : µ post = µ pre, H A : µ post > µ pre post = posttest mean score of other UG students in the e-textbook group pre = pretest mean score of other UG students in the e-textbook group 50

61 Figure 5.1: Hypothesis 1 Paired t-test Mean Standard deviation pretest posttest Table 5.27: Hypothesis 2 Paired t-test A paired t-test was done on the mean scores of the posttest and pretest of other UG students in the e-textbook group. The test gave a t-statistical of 4.58 and p-value of With p-value and a significance level of α = 0.05, we can reject the null hypothesis. There is sufficient evidence to conclude that there was a statistically significant difference between the mean posttest performance and the mean pretest performance of other UG students in the e-textbook group with 95% confidence. See Table 5.27 and Figure
62 Figure 5.2: Hypothesis 2 Paired t-test Null hypothesis 3 states that there is no difference in the mean scores between the posttest and the pretest of all undergraduate students in the e-textbook group. The alternative hypothesis states that the posttest mean score for all undergraduate students in the e-textbook group is greater than their pretest mean scores. H 0 : µ post = µ pre, H A : µ post > µ pre post = posttest mean score of undergraduate students in the e-textbook group pre = pretest mean score of undergraduate students in the e-textbook group A paired t-test was done on the mean scores of the posttest and pretest of all undergraduate students in the e-textbook group. The test gave a t-statistical of 6.29 and p-value of With p-value and a significance level of α = 0.05, we can reject the null hypothesis. There is sufficient evidence to conclude that there was a statistically significant difference 52
63 Mean Standard deviation pretest posttest Table 5.28: Hypothesis 3 Paired t-test Figure 5.3: Hypothesis 3 Paired t-test between the mean posttest performance and the mean pretest performance of all undergraduate students in the e-textbook group with 95% confidence. See Table 5.28 and Figure 5.3. Null hypothesis 4 states that there is no difference in the mean scores between the posttest and the pretest of all graduate students in the e-textbook group. The alternative hypothesis states that the posttest mean score for graduate students in the e-textbook group is greater than their pretest mean scores. H 0 : µ post = µ pre, H A : µ post > µ pre post = posttest mean score of graduate students in the e-textbook group 53
64 Mean Standard deviation pretest posttest Table 5.29: Hypothesis 4 Paired t-test Figure 5.4: Hypothesis 4 Paired t-test pre = pretest mean score of graduate students in the e-textbook group A paired t-test was done on the mean scores of the posttest and pretest of graduate students in the e-textbook group. The test gave a t-statistical of 0.93 and p-value of With p-value and a significance level of α = 0.05, we fail to reject the null hypothesis. Therefore, there is not sufficient evidence to conclude that there was a statistically significant difference between the mean posttest performance and the mean pretest performance of graduate students in the e-textbook group with 95% confidence. See Table 5.29 and Figure
65 Mean Standard deviation E-textbook Group pretest Printed Textbook Group pretest Table 5.30: Hypothesis 5 Two-sample t-test Assuming Unequal Variances Q2. Does an e-textbook improve a student s learning and performance better than a printed textbook? Null hypothesis 5 states that there is no difference in the pretest mean scores of 3270 COMP students in the e-textbook group and 3270 COMP students in the printed textbook group. The alternative hypothesis states that the pretest mean score for 3270 COMP students in the e-textbook group is different from the pretest mean scores for 3270 COMP students in the printed textbook group. H 0 : µ epre = µ pre, H A : µ epre µ pre epre = pretest mean score of 3270 COMP students in the e-textbook group pre = pretest mean score of 3270 COMP students in the printed textbook group An independent t-test was done on the mean score of the pretest of 3270 COMP students in the e-textbook group and the mean score of the pretest of 3270 COMP students in the printed textbook group. The test gave a t-statistical of and p-value of With p-value and a significance level of α= 0.05, we fail to reject the null hypothesis. There is sufficient evidence to conclude that there was not a statistically significant difference between the mean pretest performance of 3270 COMP students in the e-textbook group and the mean pretest performance of 3270 COMP students in the printed textbook group with 95% confidence. See Table 5.30 and Figure 5.5. Null hypothesis 6 states that there is no difference in the pretest mean scores of other UG students in the e-textbook group and other UG students in the printed textbook group. The alternative hypothesis states that the pretest mean score for other UG students in the e-textbook group is different from the pretest mean scores for other UG students in the printed textbook group. 55
66 Figure 5.5: Hypothesis 5 Two-sample t-test Assuming Unequal Variances H 0 : µ epre = µ pre, H A : µ epre µ pre epre = pretest mean score of other UG students in the e-textbook group pre = pretest mean score of other UG students in the printed textbook group An independent t-test was done on the mean score of the pretest of other UG students in the e-textbook group and the mean score of the pretest of other UG students in the printed textbook group. The test gave a t-statistical of and p-value of With p-value and a significance level of α= 0.05, we fail to reject the null hypothesis. There is sufficient evidence to conclude that there was not a statistically significant difference between the mean pretest performance of other UG students in the e-textbook group and the mean pretest performance of other UG students in the printed textbook group with 95% confidence. See Table 5.31 and Figure 5.6. Null hypothesis 7 states that there is no difference in the pretest mean scores of all undergraduate students in the e-textbook group and all undergraduate students in the printed 56
67 Mean Standard deviation E-textbook Group pretest Printed Textbook Group pretest Table 5.31: Hypothesis 6 Two-sample t-test Assuming Unequal Variances Figure 5.6: Hypothesis 6 Two-sample t-test Assuming Unequal Variances 57
68 Mean Standard deviation E-textbook Group pretest Printed Textbook Group pretest Table 5.32: Hypothesis 7 Two-sample t-test Assuming Unequal Variances textbook group. The alternative hypothesis states that the pretest mean score for undergraduate students in the e-textbook group is different from the pretest mean scores for undergraduate students in the printed textbook group. H 0 : µ epre = µ pre, H A : µ epre µ pre epre = pretest mean score of undergraduate students in the e-textbook group pre = pretest mean score of undergraduate students in the printed textbook group An independent t-test was done on the mean score of the pretest of undergraduate students in the e-textbook group and the mean score of the pretest of undergraduate students in the printed textbook group. The test gave a t-statistical of and p-value of With p-value and a significance level of α= 0.05, we fail to reject the null hypothesis. There is sufficient evidence to conclude that there was not a statistically significant difference between the mean pretest performance of undergraduate students in the e-textbook group and the mean pretest performance of undergraduate students in the printed textbook group with 95% confidence. See Table 5.32 and Figure 5.7. Null hypothesis 8 states that there is no difference in the pretest mean scores of graduate students in the e-textbook group and graduate students in the printed textbook group. The alternative hypothesis states that the pretest mean score for graduate students in the e- textbook group is different from the pretest mean scores for graduate students in the printed textbook group. H 0 : µ epre = µ pre, H A : µ epre µ pre epre = pretest mean score of graduate students in the e-textbook group pre = pretest mean score of graduate students in the printed textbook group 58

69 Figure 5.7: Hypothesis 7 Two-sample t-test Assuming Unequal Variances Mean Standard deviation E-textbook Group pretest Printed Textbook Group pretest Table 5.33: Hypothesis 8 Two-sample t-test Assuming Unequal Variances An independent t-test was done on the mean score of the pretest of graduate students in the e-textbook group and the mean score of the pretest of graduate students in the printed textbook group. The test gave a t-statistical of 2.38 and p-value of With p-value and a significance level of α= 0.05, we fail to reject the null hypothesis. There is sufficient evidence to conclude that there was not a statistically significant difference between the mean pretest performance of graduate students in the e-textbook group and the mean pretest performance of graduate students in the printed textbook group with 95% confidence. See Table 5.33 and Figure 5.8. Null hypothesis 9 states that there is no difference in the posttest mean scores of 3270 COMP students in the e-textbook group and 3270 COMP students in the printed textbook 59
70 Figure 5.8: Hypothesis 8 Two-sample t-test Assuming Unequal Variances group. The alternative hypothesis states that the posttest mean score for 3270 COMP students in the e-textbook group is greater than the posttest mean scores for 3270 COMP students in the printed textbook group. H 0 : µ epost = µ post, H A : µ epost > µ post epost = posttest mean score of 3270 COMP students in the e-textbook group post = posttest mean score of 3270 COMP students in the printed textbook group An independent t-test was done on the mean score of the posttest of 3270 COMP students in the e-textbook group and the mean score of the posttest of 3270 COMP students in the printed textbook group. The test gave a t-statistical of and p-value of With p-value and a significance level of α = 0.05, we fail to reject the null hypothesis. There is not sufficient evidence to conclude that there was a statistically significant difference between the mean posttest performance of 3270 COMP students in the e-textbook group 60
71 Mean Standard deviation E-textbook Group posttest Printed Textbook Group posttest Table 5.34: Hypothesis 9 Two-sample t-test Assuming Unequal Variances Figure 5.9: Hypothesis 9 Two-sample t-test Assuming Unequal Variances and the mean posttest performance of 3270 COMP students in the printed textbook group with 95% confidence. See Table 5.34 and Figure 5.9. Null hypothesis 10 states that there is no difference in the posttest mean scores of other UG students in the e-textbook group and other UG students in the printed textbook group. The alternative hypothesis states that the posttest mean score for other UG students in the e-textbook group is greater than the posttest mean scores for other UG students in the printed textbook group. H 0 : µ epost = µ post, H A : µ epost > µ post epost = posttest mean score of other UG students in the e-textbook group post = posttest mean score of other UG students in the printed textbook group 61
72 Mean Standard deviation E-textbook Group posttest Printed Textbook Group posttest Table 5.35: Hypothesis 10 Two-sample t-test Assuming Unequal Variances Figure 5.10: Hypothesis 10 Two-sample t-test Assuming Unequal Variances An independent t-test was done on the mean score of the posttest of other UG students in the e-textbook group and the mean score of the posttest of other UG students in the printed textbook group. The test gave a t-statistical of and p-value of With p-value and a significance level of α = 0.05, we fail to reject the null hypothesis. There is not sufficient evidence to conclude that there was a statistically significant difference between the mean posttest performance of other UG students in the e-textbook group and the mean posttest performance of other UG students in the printed textbook group with 95% confidence. See Table 5.35 and Figure Null hypothesis 11 states that there is no difference in the posttest mean scores of all undergraduate students in the e-textbook group and all undergraduate students in the 62
73 Mean Standard deviation E-textbook Group posttest Printed Textbook Group posttest Table 5.36: Hypothesis 11 Two-sample t-test Assuming Unequal Variances printed textbook group. The alternative hypothesis states that the posttest mean score for all undergraduate students in the e-textbook group is greater than the posttest mean scores for all undergraduate students in the printed textbook group. H 0 : µ epost = µ post, H A : µ epost > µ post epost = posttest mean score of undergraduate students in the e-textbook group post = posttest mean score of undergraduate students in the printed textbook group An independent t-test was done on the mean score of the posttest of all undergraduate students in the e-textbook group and the mean score of the posttest of all undergraduate students in the printed textbook group. The test gave a t-statistical of and p-value of With p-value and a significance level of α = 0.05, we fail to reject the null hypothesis. There is not sufficient evidence to conclude that there was a statistically significant difference between the mean posttest performance of all undergraduate students in the e- textbook group and the mean posttest performance of all undergraduate students in the printed textbook group with 95% confidence. See Table 5.36 and Figure Null hypothesis 12 states that there is no difference in the posttest mean scores of graduate students in the e-textbook group and graduate students in the printed textbook group. The alternative hypothesis states that the posttest mean score for graduate students in the e-textbook group is greater than the posttest mean scores for graduate students in the printed textbook group. H 0 : µ epost = µ post, H A : µ epost > µ post epost = posttest mean score of graduate students in the e-textbook group post = posttest mean score of graduate students in the printed textbook group 63
74 Figure 5.11: Hypothesis 11 Two-sample t-test Assuming Unequal Variances Mean Standard deviation E-textbook Group posttest Printed Textbook Group posttest Table 5.37: Hypothesis 12 Two-sample t-test Assuming Unequal Variances An independent t-test was done on the mean score of the posttest of graduate students in the e-textbook group and the mean score of the posttest of graduate students in the printed textbook group. The test gave a t-statistical of 1.35 and p-value of With p-value and a significance level of α = 0.05, we fail to reject the null hypothesis. There is not sufficient evidence to conclude that there was a statistically significant difference between the mean posttest performance of graduate students in the e-textbook group and the mean posttest performance of graduate students in the printed textbook group with 95% confidence. See Table 5.37 and Figure Null hypothesis 13 states that there is no difference in the improvement mean scores of 3270 COMP students in the e-textbook group and 3270 COMP students in the printed 64

75 Figure 5.12: Hypothesis 12 Two-sample t-test Assuming Unequal Variances textbook group. The alternative hypothesis states that the improvement mean score for 3270 COMP students in the e-textbook group is greater than the improvement mean score for 3270 COMP students in the printed textbook group. H 0 : µ EI = µ P I, H A : µ EI > µ P I EI = improvement mean score of 3270 COMP students in the e-textbook group PI = improvement mean score of 3270 COMP students in the printed textbook group An independent t-test was done on the mean score of the improvement of 3270 COMP students in the e-textbook group and the mean score of the improvement of 3270 COMP students in the printed textbook group. The test gave a t-statistical of and p-value of With p-value and a significance level of α = 0.05, we fail to reject the null hypothesis. There is not sufficient evidence to conclude that there was a statistically significant difference between the mean improvement of 3270 COMP students in the e-textbook group 65
76 Mean Standard deviation E-textbook Group improvement Printed Textbook Group improvement Table 5.38: Hypothesis 13 Two-sample t-test Assuming Unequal Variances Figure 5.13: Hypothesis 13 Two-sample t-test Assuming Unequal Variances and the mean improvement of 3270 COMP students in the printed textbook group with 95% confidence. See Table 5.38 and Figure Null hypothesis 14 states that there is no difference in the improvement mean scores of other UG students in the e-textbook group and other UG students in the printed textbook group. The alternative hypothesis states that the improvement mean score for other UG students in the e-textbook group is greater than the improvement mean score for other UG students in the printed textbook group. H 0 : µ EI = µ P I, H A : µ EI > µ P I EI = improvement mean score of other UG students in the e-textbook group PI = improvement mean score of other UG students in the printed textbook group 66

77 Mean Standard deviation E-textbook Group improvement Printed Textbook Group improvement Table 5.39: Hypothesis 14 Two-sample t-test Assuming Unequal Variances Figure 5.14: Hypothesis 14 Two-sample t-test Assuming Unequal Variances An independent t-test was done on the mean score of the improvement of other UG students in the e-textbook group and the mean score of the improvement of other UG students in the printed textbook group. The test gave a t-statistical of 1.02 and p-value of With p-value and a significance level of α = 0.05, we fail to reject the null hypothesis. There is not sufficient evidence to conclude that there was a statistically significant difference between the mean improvement of other UG students in the e-textbook group and the mean improvement of other UG students in the printed textbook group with 95% confidence. See Table 5.39 and Figure Null hypothesis 15 states that there is no difference in the improvement mean scores of all undergraduate students in the e-textbook group and all undergraduate students in 67
78 Mean Standard deviation E-textbook Group improvement Printed Textbook Group improvement Table 5.40: Hypothesis 15 Two-sample t-test Assuming Unequal Variances the printed textbook group. The alternative hypothesis states that the improvement mean score for all undergraduate students in the e-textbook group is greater than the improvement mean score for all undergraduate students in the printed textbook group. H 0 : µ EI = µ P I, H A : µ EI > µ P I EI = improvement mean score of undergraduate students in the e-textbook group PI = improvement mean score of undergraduate students in the printed textbook group An independent t-test was done on the mean score of the improvement of all undergraduate students in the e-textbook group and the mean score of the improvement of all undergraduate students in the printed textbook group. The test gave a t-statistical of 0.49 and p-value of With p-value and a significance level of α = 0.05, we fail to reject the null hypothesis. There is not sufficient evidence to conclude that there was a statistically significant difference between the mean improvement of all undergraduate students in the e-textbook group and the mean improvement of all undergraduate students in the printed textbook group with 95% confidence. See Table 5.40 and Figure Null hypothesis 16 states that there is no difference in the improvement mean scores of graduate students in the e-textbook group and graduate students in the printed textbook group. The alternative hypothesis states that the improvement mean score for graduate students in the e-textbook group is greater than the improvement mean score for graduate students in the printed textbook group. H 0 : µ EI = µ P I, H A : µ EI > µ P I EI = improvement mean score of graduate students in the e-textbook group PI = improvement mean score of graduate students in the printed textbook group 68

79 Figure 5.15: Hypothesis 15 Two-sample t-test Assuming Unequal Variances Mean Standard deviation E-textbook Group improvement Printed Textbook Group improvement Table 5.41: Hypothesis 16 Two-sample t-test Assuming Unequal Variances An independent t-test was done on the mean score of the improvement of graduate students in the e-textbook group and the mean score of the improvement of graduate students in the printed textbook group. The test gave a t-statistical of and p-value of With p-value and a significance level of α = 0.05, we fail to reject the null hypothesis. There is not sufficient evidence to conclude that there was a statistically significant difference between the mean improvement of graduate students in the e-textbook group and the mean improvement of graduate students in the printed textbook group with 95% confidence. See Table 5.41 and Figure 5.16 shows individual value plot. These results are summarized and discussed at the end of this chapter. 69
80 Figure 5.16: Hypothesis 16 Two-sample t-test Assuming Unequal Variances User Interface Evaluation Survey Q3. Do students like interacting with the interface of an e-textbook and does it increase a student s engagement with the course material? The students answers to the questions of the user interface evaluation survey are helpful in answering the third research question stated above. It should be noted that these are the answers of all students who used the e-textbook, undergraduate students and graduate students (n = 16). We report on their answers below and discuss them later on. Reaction to the interface: 1. Overall reaction to the interface (terrible - wonderful): see Figure
81 Figure 5.17: Overall reaction to the interface (terrible - wonderful) 2. Overall reaction to the interface (difficult - easy): see Figure
82 Figure 5.18: Overall reaction to the interface (difficult - easy) 3. Overall reaction to the interface (frustrating - satisfying): see Figure
83 Figure 5.19: Overall reaction to the interface (frustrating - satisfying) 4. Overall reaction to the interface (dull - stimulating): see Figure
84 Figure 5.20: Overall reaction to the interface (dull - stimulating) 5. Overall reaction to the interface (rigid - flexible): see Figure
85 Figure 5.21: Overall reaction to the interface (rigid - flexible) Screen: 1. Screen: Overall layout: see Figure
86 Figure 5.22: Screen: Overall layout 2. Screen: The color scheme: see Figure
87 Figure 5.23: Screen: The color scheme 3. Screen: Font style (size, color...): see Figure
88 Figure 5.24: Screen: Font style (size, color...) 4. Screen: Separation/ layout of the information with concept maps on the left and text on the right: see Figure
89 Figure 5.25: Screen: Separation/ layout of the information with concept maps on the left and text on the right 5. Screen: Sequence of screens: see Figure
90 Figure 5.26: Screen: Sequence of screens 6. Screen: Use of terms throughout the system: see Figure
91 Figure 5.27: Screen: Use of terms throughout the system Learning: 1. Learning to use the system: see Figure
92 Figure 5.28: Learning to use the system 2. Exploring features by trial and error: see Figure
93 Figure 5.29: Exploring features by trial and error 3. Navigation is straightforward: see Figure
94 Figure 5.30: Navigation is straightforward 4. Help menu item: see Figure
95 Figure 5.31: Help menu item Content: 1. The concept map is helpful in understanding the relationships between graph concepts: see Figure

96 Figure 5.32: The concept map is helpful in understanding the relationships between graph concepts 2. The concept map is helpful in navigating the system: see Figure
97 Figure 5.33: The concept map is helpful in navigating the system 3. The information presented is useful: see Figure
98 Figure 5.34: The information presented is useful 4. The information presented is interesting: see Figure
99 Figure 5.35: The information presented is interesting 5. The definitions of concepts are clear: see Figure
100 Figure 5.36: The definitions of concepts are clear 6. The examples helped me understand concepts better: see Figure
101 Figure 5.37: The examples helped me understand concepts better 7. The animations helped me understand concepts better: see Figure
102 Figure 5.38: The animations helped me understand concepts better 8. The algorithms helped me understand concepts better: see Figure
103 Figure 5.39: The algorithms helped me understand concepts better 9. I gained new knowledge about graph data structure and algorithms from the system: see Figure
104 Figure 5.40: I gained new knowledge about graph data structure and algorithms from the system 10. I think the system helped me understand the concepts better than a textbook: see Figure
105 Figure 5.41: I think the system helped me understand the concepts better than a textbook These results are summarized and discussed at the end of this chapter Log Files To track the user interactions with the e-textbook, we used Opentracker 1 and Google Analytics 2. While Opentracker provided a separate log file for each user listing the visited pages and the viewed concepts, Google Analytics provided an analysis for all user behaviors with the e-textbook giving a generalized look of the visited pages and the time spent on the e-textbook. The log files show that if pages were ordered from the most visited to the least visited, then the result would be the following list: 1. Home Page
106 2. Graph Types 3. Graph Components 4. Graph Operations 5. Acyclic Graph 6. Graph Representation 7. Edge 8. Tree 9. About 10. Contact 11. Help The list shows that the Help page is the least visited page, which means that not many student needed to view it, and this shows that the interface was easy to use and did not require help or explanation. The log files also show that the average time spent on a page is 49 seconds. Graph Representation is the page that students spent most time on which was on average 1 minute and 46 seconds. In addition, the log files provide the behavior flow of users. Behavior flow shows the path the users go through to navigate from one page to another. One such path starts with the Home Page, then Graph Components, the visiting Edge page, and then going back to Graph Components page. Another path starts with Home Page, then Graph Types, then Acyclic Graph, and the last page is Tree. It should be noted that Opentracker logs only show the last 40 events of a users visit, an issue that we were not able to solve even after contacting the company. See appendix F for Google Analytics complete reports. 96
107 5.3 Discussion Results from the statistical analysis showed that undergraduate students (both who had previous knowledge and who had limited previous knowledge) performed better in the posttest after using the e-textbook. These results meet our expectation and answer our first research question about whether an e-textbook improves students learning. However, these results did not apply to graduate students. The statistical analysis performed on graduate students scores did not show a significance difference between pretest and posttest scores that we could use to generalize the results and claim that e-textbook would improve graduate students performance. One possible reason behind this result is the small number of graduate students who volunteered to participate. We believe that if the sample was greater, then we might have seen a different result. A second reason is the fact that this e- textbook prototype had content at an undergraduate level. Most graduate students had good knowledge of the content and could answer most pretest questions easily prior to using the e-textbook (See figure 5.4 on page 54). This is especially evident from the high pretest score (mean 23.6) of the e-textbook group indicating significant prior knowledge. We recommend conducting further research with graduate students and e-textbooks that have content at the graduate level. As for our second research question, results showed that an e-textbook does not necessarily improve learning better than a traditional printed textbook. Nevertheless, as can be seen from table 5.42, among undergraduate students, the e-textbook groups performed as well or better than the text groups, even though these differences were not statistically significant. The graduate students text group performed better than the e-textbook group, but again it should be noted that the graduate students text group had a lower level of prior knowledge (pretest mean 16.4) compared to the graduate students e-textbook group (pretest mean 23.6) and both received similar posttest scores (posttest means: e-textbook: 25.2 and text: 22.8). We believe the reasons for these results are similar to the reason stated before about graduate students performance. Many of the undergraduate students who participated 97
108 Text Group Improvement Scores E-Text Group Improvement Scores COMP Other UG 4 7 All Undergraduate All Graduate Table 5.42: Improvement scores of all groups on the study had some previous knowledge about graph data structure, which meant that they could answer many of the pretest questions easily. In addition, the sample is relatively small. Performing the study on a larger sample may yield different results. It is also possible that an e-textbook may be beneficial to younger and less knowledgeable undergraduate students, such as freshmen. We recommend conducting further research to answer this question with a larger sample size, undergraduates at various levels, an e-textbook that is richer in interactive contents that really differentiates it from the traditional printed textbook, and for a longer period. Instead of students having 30 minutes to study from the e-textbook, it would be more effective if the study would be conducted on a whole term material where the students would use the e-textbook for the entire duration of a course. The third research question is answered by going through students reaction to the e- textbook. Results from usability testing showed that the rating of the e-textbooks interface and features fell within the range of 6 to 9 (9 is the high end of the scale). All four participants in the usability testing thought that layout of the e-textbook (the separation of the concept map and the text) was very clear. Moreover, all of the usability testing participants said that the e-textbook helped them understand the material better than a printed textbook. The results from the actual testing also showed a positive attitude toward the e-textbook with 88% of the students who used it saying that the e-textbook helped them understand the material better than a traditional textbook. 66% of students said that animations helped understand the concepts better, and 75% said algorithms helped them understand concepts better. Most of the students who used the e-textbook liked navigating the system with the concept map (38% chose Strongly Agree, 44% chose Agree). Furthermore, all of the 98
109 students who used the e-textbook agreed to the fact that the concept map helped them to understand the relationships between the different concepts (69% chose Agree, 31% chose Strongly Agree). The students did not only have a positive reaction to the e-textbook, they also gave insightful thoughts on how to further develop it and make it more interactive and engaging. Some of the comments that students wrote include adding a History feature that keeps track of what concepts the student had already viewed, a full concept map that shows all concepts on one screen, and a guide that suggests what concepts to visit next in order to completely understand the material. Interestingly, this suggestion of a navigation guide corresponds with the finding of Puntambekar and Stylianou[9] that students who were provided with navigation support in CoMPASS performed better. 99
110 Chapter 6 Conclusion and Future Work The work described in this thesis has been concerned with the development of an e- textbook on the subject of graph data structures and algorithms. Our e-textbook works on tablet devices as well as on PCs and laptops because it uses JavaScript for its interactive elements and does not require additional browser plug-ins to be installed, making it platform independent. Our experiments tackled three research questions: does an e-textbook improve a student s learning as measured by his/her performance in a test? Does an e-textbook improve a student s learning and performance better than a printed textbook? Do students like interacting with the interface of an e-textbook and does it increase a student s engagement with the course material? Tests using the developed e-textbook showed an improvement in students performance. While the tests were not sufficient to conclude whether an e-textbook improves performance better than a printed textbook, it showed a clear positive attitude toward the e-textbook and its interactive elements. The positive feedback received from students gives motivation to improve this prototype and develop it more. This improvement can begin with enriching the e-textbook s content and adding more interactive elements. Specifically, interactive exercises that asses students understanding of the material and provide immediate feedback can be included in the e- textbook. In addition, implementing a history feature that keeps track of viewed concepts on each session and storing this history to be viewed on a later session is another improvement. Furthermore, building a backend to the e-textbook that allows instructors to add, delete, and edit concepts, edit content, author new exercises or edit existing ones or delete them is a necessary next step. Also, providing the ability to track students progress with the 100
111 material, grade assignments and tests would be advantageous. Moreover, the e-textbook can provide a platform of communication between instructors and students. Students can post questions about the materials or ask for further explanation on a concept on the e-textbook pages and instructors answers can further extend the e-textbook, allowing instructors to adapt and extend the e-textbook over time to suit their classes. The current prototype of the e-textbook can serve as a basis for further development in this field of research, and this study can serve as a start for studies on the use and effect of e-textbooks inside classrooms over the course of an entire semester. E-textbooks not only affect students performance, but also affect how students perceive new knowledge presented in front of them, how they interact with this knowledge in order for them to apply it, and challenge them to be active learners instead of being passive learners. These effects in turn change the way instructors teach a course and how they communicate with the students. All of this can lead to a better learning environment that benefits from the fast advances of technology. 101
112 Bibliography [1] Christine Alvarado, Briana Morrison, Barbara Ericson, Mark Guzdial, Brad Miller, and David L. Ranum. Performance and use evaluation of an electronic book for introductory python programming. Georgia Institute of Technology Technical Report, (GT-IC-12-02), [2] E. Andres, R. Fleischer, and MinEr Liang. An adaptive theory of computation online course in activemath. In Computer Science and Education (ICCSE), th International Conference on, pages , Aug [3] Ari Korhonen, Thomas Naps, Charles Boisvert, Pilu Crescenzi, Ville Karavirta, Linda Mannila, Bradley Miller, Briana Morrison, Susan H. Rodger, Rocky Ross, and Clifford A. Shaffer. Requirements and design strategies for open source interactive computer science ebooks. In Proceedings of the ITiCSE Working Group Reports Conference on Innovation and Technology in Computer Science Education-working Group Reports, ITiCSE -WGR 13, pages 53 72, New York, NY, USA, ACM. [4] Mikko-Jussi Laakso, Niko Myller, and Ari Korhonen. Comparing learning performance of students using algorithm visualizations collaboratively on different engagement levels. Educational Technology & Society, 12(2): , [5] R.H. Landau, M.J. Paez, and C.C. Bordeianu. A blended, multimodal access etextbook in computational physics. Computing in Science Engineering, 15(3):96 103, May [6] Bradley N. Miller and David L. Ranum. Beyond pdf and epub: Toward an interactive textbook. In Proceedings of the 17th ACM Annual Conference on Innovation and Technology in Computer Science Education, ITiCSE 12, pages , New York, NY, USA, ACM. [7] Joseph D. Novak and Alberto J. Caas. The theory underlying concept maps and how to construct and use them. Technical report, Florida Institute for Human and Machine Cognition, Pensacola Fl, January [8] Sadhana Puntambekar, Agnes Stylianou, and Roland Hübscher. Improving navigation and learning in hypertext environments with navigable concept maps. Hum.-Comput. Interact., 18(4): , December [9] Sadhana Puntambekar and Agni Stylianou. Designing navigation support in hypertext systems based on navigation patterns. Instructional Science, 33(5-6): ,
113 [10] Clifford A. Shaffer, Ville Karavirta, Ari Korhonen, and Thomas L. Naps. Opendsa: beginning a community active-ebook project. In Ari Korhonen and Robert McCartney, editors, Koli Calling, pages ACM, [11] Jenny Preece Yvonne Rogers, Helen Sharp. Interaction Design: Beyond Human - Computer Interaction. Wiley, 3rd edition,
114 Appendices 104
115 Appendix A E-Textbook Screen Shots 105
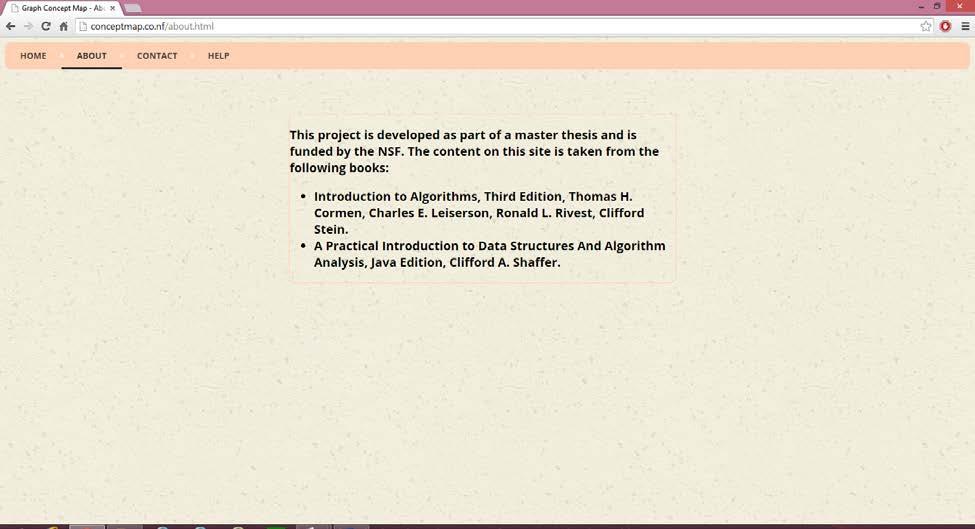
116
117
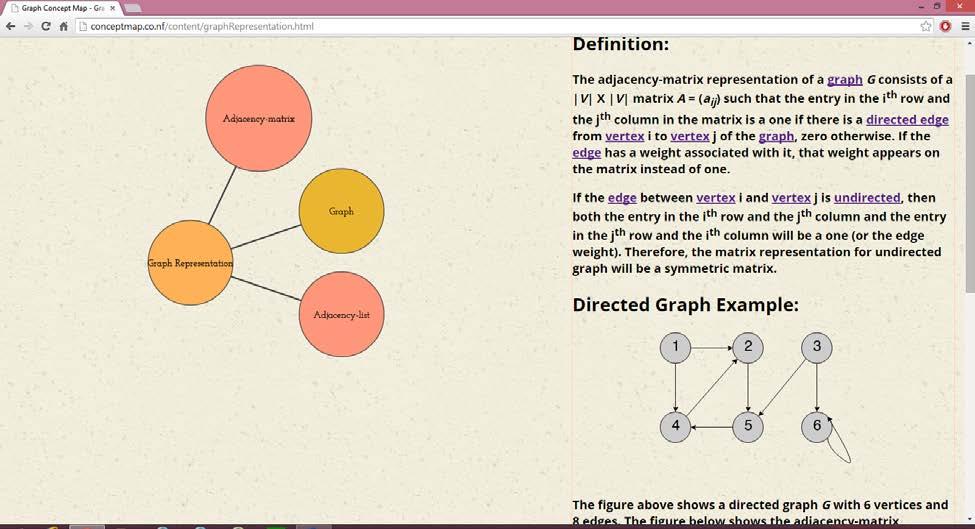
118
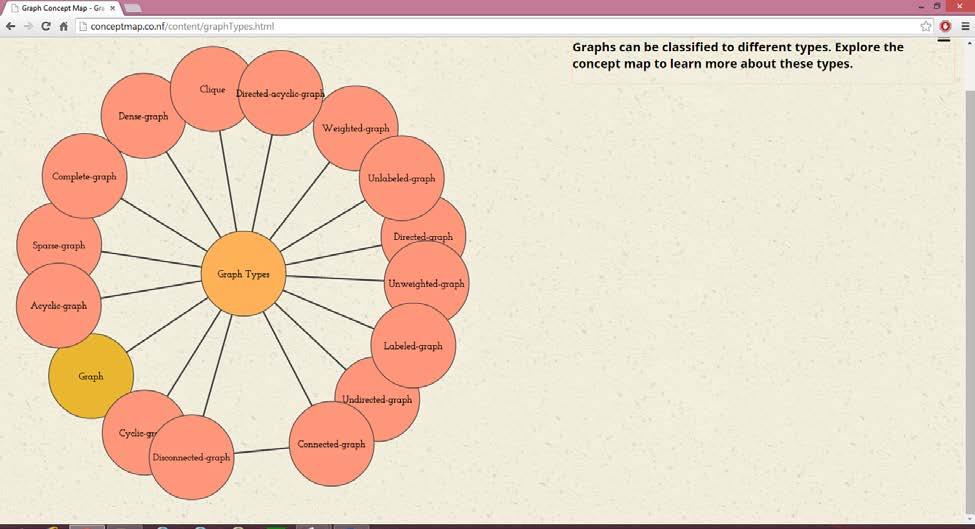
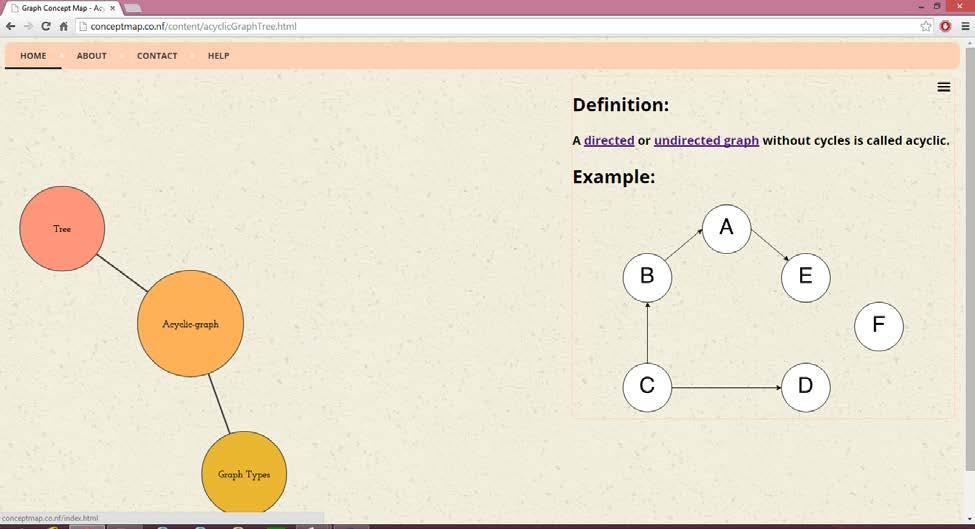
119
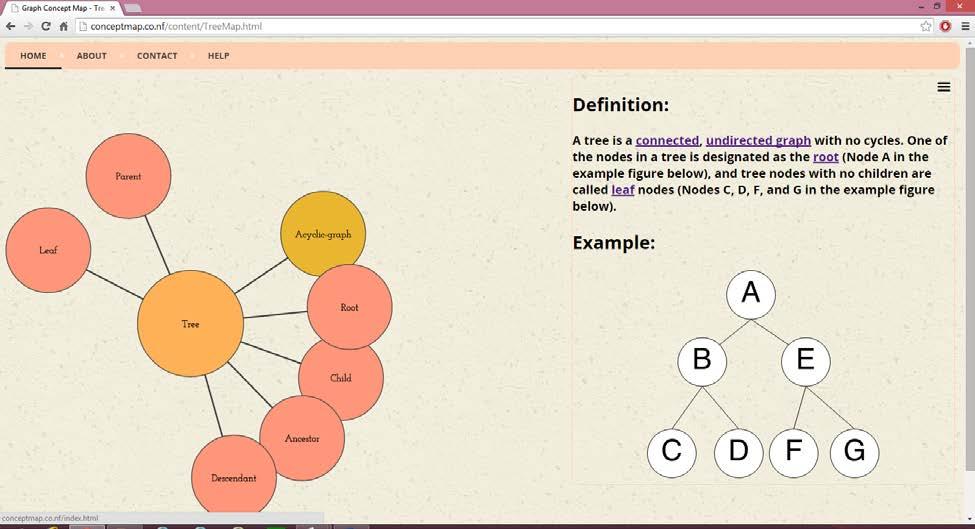
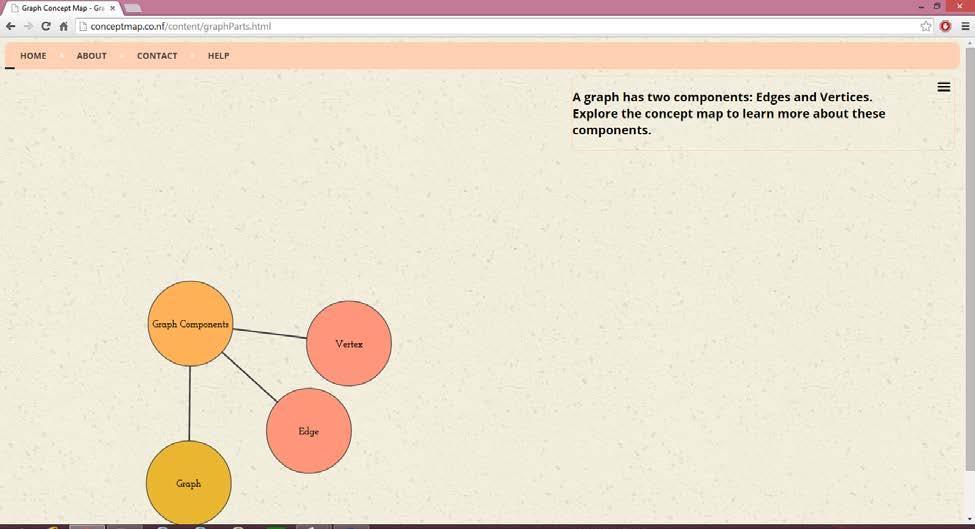
120
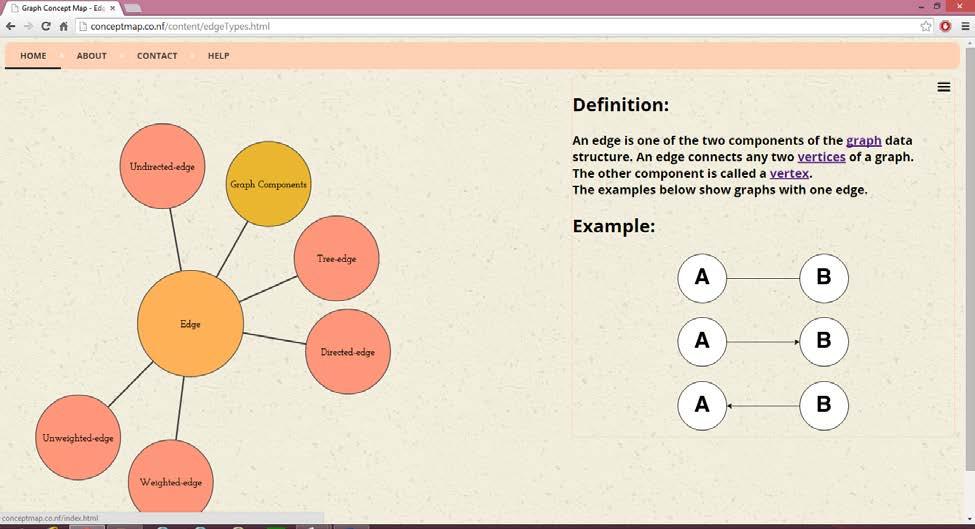
121
122 Appendix B Flyer, Demographic Data Questionnaire, and Consent Form 112
123 Flyer
124 E-Textbook Evaluation Research Study You are invited to participate in a research study to evaluate the efficacy of an interactive electronic textbook (e-textbook) for data structures and algorithms, and to compare it with a traditional textbook. This study will take place in September I am conducting this study as part of my Master's research in the CSSE department under the supervision of Dr. Narayanan. As a student registered in Section 1 of the course COMP 3270, you are eligible to participate in this study. Your participation in the study will require approximately an hour and a half of your time. Your participation would include the following activities: (a) Signing the informed consent form. At this time you will have the opportunity to ask me any questions you have about this study, and decide whether you want to participate. (at most 15 minutes) (b) Providing the demographics information listed below. (c) Taking an online pre-knowledge survey to determine what you already know about the topic of graph data structures and algorithms. (about 15 minutes) (d) Studying either an e-textbook chapter on this topic made available to you on a laptop or desktop (which I will provide) or a traditional textbook chapter (which I will provide). (about 30 minutes) (e) Taking an online post-knowledge survey to determine what you newly learned about the topic of graph data structures and algorithms. (about 15 minutes) (f) Completing a short online questionnaire about your opinions regarding the e-textbook you worked with and about traditional textbooks. (about 10 minutes) Dr. Narayanan has agreed to count participation in this study in lieu of the Problem of the Day. Therefore, you can earn that assignment s 2.5% credit through participation. You may also choose a monetary compensation for your time ($10 per hour rounded up to the next full hour) instead, in which case (or if you choose not to participate) you will not be given the course credit without doing the assignment. Your participation will help me in my graduate work, potentially advance the design of interactive e-textbooks, and may benefit you by increasing your knowledge about graph data structures and algorithms, a topic covered in comp I will not collect any identifiable data. All data will be stored and analyzed anonymously. You cannot be identified individually from any data collected from you, including any demographic information you provide. If you are willing to participate, please cut and paste the following demographic questions into a reply , and your answers to me AS SOON AS POSSIBLE. I will then correspond with you to schedule a time for the study that is convenient to you. It will take place in the HCI Lab (Shelby 2301/2302), Thank you for volunteering!! Fatimah Aldubaisi, MS Student, CSSE Department DEMOGRAPHICS SURVEY 1. Your gender (1: male 2: female): 2. Your level (1:freshman 2: sophomore 3:junior 4:senior): 3. Your GPA range (1: zero to one 2: one to two 3: two to three 4: three to four): 4. Have you taken (or taking now) COMP 1210 FUNDAMENTALS OF COMPUTING I (yes/no)? 5. Have you taken (or taking now) COMP 2210 FUNDAMENTALS OF COMPUTING II (yes/no)? 6. Have you taken (or taking now) COMP 3270 INTRODUCTION TO ALGORITHMS (yes/no)? 7. Do you know how graphs are represented using other, simpler data structures (yes/no)? 8. Do you know the details of at least one graph algorithm (yes/no)? 9. Have you implemented or used a graph data structure in a program you wrote (yes/no)? 10. Have you implemented or used a graph algorithm in a program you wrote (yes/no)? 11. Overall, how much do you know about graph data structures and algorithms (1: no knowledge 2: a little knowledge 3:some knowledge 4: a lot of knowledge):
125 E-Textbook Evaluation Research Study You are invited to participate in a research study to evaluate the efficacy of an interactive electronic textbook (e-textbook) for data structures and algorithms, and to compare it with a traditional textbook. This study will take place in September I am conducting this study as part of my Master's research in the CSSE department under the supervision of Dr. Narayanan. As a graduate/undergraduate student in the CSSE department, you are eligible to participate in this study. Your participation in the study will require approximately an hour and a half of your time. Your participation would include the following activities: (a) Signing the informed consent form. At this time you will have the opportunity to ask me any questions you have about this study, and decide whether you want to participate. (at most 15 minutes) (b) Providing the demographics information listed below. (c) Taking an online pre-knowledge survey to determine what you already know about the topic of graph data structures and algorithms. (about 15 minutes) (d) Studying either an e-textbook chapter on this topic made available to you on a laptop or desktop (which I will provide) or a traditional textbook chapter (which I will provide). (about 30 minutes) (e) Taking an online post-knowledge survey to determine what you newly learned about the topic of graph data structures and algorithms. (about 15 minutes) (f) Completing a short online questionnaire about your opinions regarding the e-textbook you worked with and about traditional textbooks. (about 10 minutes) If you choose to participate in this study, as a "thank you" for your time and effort in helping me conduct this research, you will be offered $10 per hour rounded up to the next full hour Your participation will help me in my graduate work, potentially advance the design of interactive e-textbooks, and may benefit you by increasing your knowledge about graph data structures and algorithms. I will not collect any identifiable data. All data will be stored and analyzed anonymously. You cannot be identified individually from any data collected from you, including any demographic information you provide. If you are willing to participate, please cut and paste the following demographic questions into a reply , and your answers to me AS SOON AS POSSIBLE. I will then correspond with you to schedule a time for the study that is convenient to you. It will take place in the HCI Lab (Shelby 2301/2302), Thank you for volunteering!! Fatimah Aldubaisi, MS Student, CSSE Department UNDERGRADUATE DEMOGRAPHICS SURVEY 1. Your gender (1: male 2: female): 2. Your level (1:freshman 2: sophomore 3:junior 4:senior): 3. Your GPA range (1: zero to one 2: one to two 3: two to three 4: three to four): 4. Have you taken (or taking now) COMP 1210 FUNDAMENTALS OF COMPUTING I (yes/no)? 5. Have you taken (or taking now) COMP 2210 FUNDAMENTALS OF COMPUTING II (yes/no)? 6. Have you taken (or taking now) COMP 3270 INTRODUCTION TO ALGORITHMS (yes/no)? 7. Do you know how graphs are represented using other, simpler data structures (yes/no)? 8. Do you know the details of at least one graph algorithm (yes/no)? 9. Have you implemented or used a graph data structure in a program you wrote (yes/no)? 10. Have you implemented or used a graph algorithm in a program you wrote (yes/no)? 11. Overall, how much do you know about graph data structures and algorithms (1: no knowledge 2: a little knowledge 3:some knowledge 4: a lot of knowledge): GRADUATE DEMOGRAPHICS SURVEY
126 1. Your gender (1: male 2: female): 2. Your level (1:Master s student 2: PhD student): 3. How many years have you been a CSSE graduate student? (1: 1 year or less 2: 2 years or less but more than one 3: 3 years or less but more than two 4: 4 years or less but more than three 5: more than 4 years): 4. Your GPA range (1: zero to one 2: one to two 3: two to three 4: three to four): 5. Have you taken (or taking now) a course on programming (yes/no)? 6. Have you taken (or taking now) a course on data structures (yes/no)? 7. Have you taken (or taking now) a course on algorithms (yes/no)? 8. Do you know how graphs are represented using other, simpler data structures (yes/no)? 9. Do you know the details of at least one graph algorithm (yes/no)? 10. Have you implemented or used a graph data structure in a program you wrote (yes/no)? 11. Have you implemented or used a graph algorithm in a program you wrote (yes/no)? 12. Overall, how much do you know about graph data structures and algorithms (1: no knowledge 2: a little knowledge 3:some knowledge 4: a lot of knowledge):
127 Consent Form


128


129
130 Appendix C Usability Testing Collected Data 120
131 Recorded Notes
132 Usability Student #1: Asked if links on text shows the definition of concepts. Heading for the examples on graph representation (Directed graph example Undirected graph example) Confused about the use of the terms nodes and vertices because test questions said nodes while materials referred to them as vertices. Used home link on the navigation bar at the top to go back to a previous page at first. Later on, student used the concept map to navigate. Suggested writing numbers as 1 and 0 instead of one and zero Suggested adding math formulas and concepts to the content, like the formula for counting the number of edges for linked-list representation and matrix representation. Also, writing that the matrix is symmetric for an undirected graph and mentioning matrix transpose. Student noted that the information is clear and understandable but it might be more helpful if the suggested information is added. Student looked for information related to the graph definition, but did not click on the concept node on the map. Looked through the system and then decided to find it later. Student was confused about tree concept and its position within the navigation. After some thought, student understood the relationships and why it was there. Student suggested editing the examples on the ancestor and parent concepts, saying that stating node B as a parent on one example and as an ancestor on another might confuse students. Student was confused about the label graph operations. Solved some questions without viewing it at first, then clicked on the node and asked why it was named as such and not graph traversals.
133 Usability Student #2: The student commented on the labels of Tree (Graph Type) node and Tree (Edge Type) and suggested that they do not have the same label. Student used the browser s back button to go back or used Home link on the system Student did not notice that nodes change size at first and asked how to know which concept is clicked without looking at the text. Student asked if the nodes on graph types were alphabetically ordered.
134 Usability Student #3: Student did not find the concept clique. Viewed a lot of concepts and pages before asking for help about where to find it. Students commented that the concept map has a lot of concepts and students might not notice or see all of them, and suggested that concepts might be grouped together. Also, student asked if the concepts were ordered or if the order is changing. Student said the concept graph representation is a little confusing and suggested changing it to graph representation with data structure Student suggested adding links for the animation within the text to make them more accessible.
135 Usability Student #4: Student suggested that test questions be more randomized as the current order does not require going back to view the content because each question resembles the previous one. Student commented on the graph types map being jammed and cluttered and it will be better it was less crowded. Student had a problem finding the concept clique and asked for help but when encouraged to look again, student found the concept.
136 User Interface Evaluation Survey Used for the usability testing and the actual testing
137 11/6/2014 Qualtrics Survey Software Please rate your satisfaction with the system Try to respond to all items. For items that are not applicable, use: NA 1. Overall reaction to the interface (terrible - wonderful) 0 (terrible) (wonderful) NA 2. Overall reaction to the interface (difficult - easy) 0 (difficult) (easy) NA 3. Overall reaction to the interface (frustrating - satisfying) 0 (frustrating) (satisfying) NA 1/7
138 11/6/2014 Qualtrics Survey Software 4. Overall reaction to the interface (dull - stimulating) 0 (dull) (stimulating) NA 5. Overall reaction to the interface (rigid - flexible) 0 (rigid) (flexible) NA 1. Screen: Overall layout 0 (bad) (good) NA 2. Screen: The color scheme 0 (bad) (good) NA 3. Screen: Font style (size, color,..) 0 (bad) (good) NA 2/7
139 11/6/2014 Qualtrics Survey Software 4. Screen: Separation/ layout of the information with concept maps on the left and text on the right 0 (confusing) (very clear) NA 5. Screen: Sequence of screens 0 (confusing) (very clear) NA 6. Screen: Use of terms throughout the system 0 (inconsistent) (consistent) NA Learning 3/7
140 11/6/2014 Qualtrics Survey Software 1. Learning to use the system 0 (difficult) (easy) NA 2. Exploring features by trial and error 0 (difficult) (easy) NA 3. Navigation is straight forward 0 (never) (always) NA 4. Help menu item. (Check NA if you did not use it) 0 (Unhelpful) (Helpful) NA Content 4/7
141 11/6/2014 Qualtrics Survey Software 1. The concept map is helpful in understanding the relationships between graph concepts Strongly Disagree Disagree Neutral Agree Strongly Agree 2. The concept map is helpful in navigating the system Strongly Disagree Disagree Neutral Agree Strongly Agree 3. The information presented is useful Strongly Disagree Disagree Neutral Agree Strongly Agree 4. The information presented is interesting Strongly Disagree Disagree Neutral Agree Strongly Agree 5. The definitions of concepts are clear Strongly Disagree Disagree Neutral Agree Strongly Agree 5/7
142 11/6/2014 Qualtrics Survey Software 6. The examples helped me understand concepts better Strongly Disagree Disagree Neutral Agree Strongly Agree 7. The animations helped me understand concepts better (Check NA if you did not look at animations) Strongly Disagree Disagree Neutral Agree Strongly Agree NA 8. The algorithms helped me understand concepts better (Check NA if you did not view the algorithms) Strongly Disagree Disagree Neutral Agree Strongly Agree NA 9. I gained new knowledge about graph data structure and algorithms from the system Strongly Disagree Disagree Neutral Agree Strongly Agree 6/7
143 11/6/2014 Qualtrics Survey Software 10. I think the system helped me understand the concepts better than a textbook Strongly Disagree Disagree Neutral Agree Strongly Agree If you have any other comments or notes, please write them down 7/7
144 Appendix D Demographic Data Summary 134
145 Undergraduate Students Demographic Data Summary Question 1: Female Male 3 18 Question 2: Freshman Sophomore Junior Senior Question 3: Zero to One One to Two Two to Three Three to Four Question 4: Yes No 21 0 Question 5: Yes No 21 0 Question 6: Yes No 15 6 Question 7: Yes No Question 8: Yes No 8 13
146 Question 9: Yes No 6 15 Question 10: Yes No 6 15 Question 11: No Knowledge Little Knowledge Some Knowledge A lot of Knowledge
147 Graduate Students Demographic Data Summary Question 1: Female Male 6 4 Question 2: Master PhD 5 5 Question 3: 1 year or less 2 years or less but more than one 3 years or less but more than two 4 years or less but more than three more than 4 years Question 4: Zero to One One to Two Two to Three Three to Four Question 5: Yes No 9 1 Question 6: Yes No 9 1 Question 7: Yes No 10 0 Question 8: Yes No 7 3
148 Question 9: Yes No 8 2 Question 10: Yes No 7 3 Question 11: Yes No 6 4 Question 12: No Knowledge Little Knowledge Some Knowledge A lot of Knowledge
149 Appendix E Actual Testing Collected Data 139
150 11/6/2014 Qualtrics Survey Software Pretest What is the maximum number of edges an undirected graph with 4 nodes can have? None of the above Which of the graphs below correspond to the adjacency matrix shown below? 1/36
151 11/6/2014 Qualtrics Survey Software None of these graphs corresponds to the adjacency matrix. 2/36

152 11/6/2014 Qualtrics Survey Software Which of the graphs below correspond to the adjacency list shown below? 3/36
153 11/6/2014 Qualtrics Survey Software None of these graphs corresponds to the adjacency list. 4/36
154 11/6/2014 Qualtrics Survey Software Consider a graph with 10 nodes and 50 edges. How many linked lists will its adjacency list representation have? None of the above 10 Consider a graph with 10 nodes and 50 edges. How many total linked list nodes representing edges will its adjacency list representation contain if the graph is undirected? None of the above 10 Consider a graph with 10 nodes and 50 edges. How many total linked list nodes representing edges will its adjacency list representation contain if the graph is directed? None of the above 10 Consider a graph with 10 nodes and 50 edges. How many cells in its 10X10 adjacency matrix will have 1 s in them if the graph is undirected? /36
155 11/6/2014 Qualtrics Survey Software 100 None of the above 10 Consider a graph with 10 nodes and 50 edges. How many cells in its 10X10 adjacency matrix will have 1 s in them if the graph is directed? None of the above 10 Is the graph represented by the adjacency matrix below a directed graph or an undirected graph? Directed graph Undirected graph 6/36

156 11/6/2014 Qualtrics Survey Software I don t know Is the graph represented by the adjacency list below a directed graph or an undirected graph? Directed graph Undirected graph I don t know True or False? 7/36
157 11/6/2014 Qualtrics Survey Software Adjacency matrix A represents a weighted undirected graph Adjacency matrix B represents a unweighted directed graph The graph represented by the adjacency list below is a directed graph. Suppose the directions (arrows) of all edges in this graph are reversed. Which of the adjacency lists below represents this reversed graph? 8/36

158 11/6/2014 Qualtrics Survey Software None of these lists corresponds to the reversed graph. 9/36
159 11/6/2014 Qualtrics Survey Software The graph represented by the adjacency matrix below is a directed graph. Suppose the directions (arrows) of all edges in this graph are reversed. Which of the adjacency matrices below represents this reversed graph? 10/36
160 11/6/2014 Qualtrics Survey Software None of these matrices corresponds to the reversed graph. True or False? 11/36

161 11/6/2014 Qualtrics Survey Software Graph A is a complete graph Graph B is a complete graph Nodes 2, 3 & 4 in Graph A form a clique Graph B is a clique Graph C is a directed acyclic graph True or False? 12/36

162 11/6/2014 Qualtrics Survey Software Node 2 is an ancestor of node 9 Node 7 is a descendant of node 5 Node 3 is a child of node 1 Node 2 is the parent of node 7 Node 8 is a leaf If the Depth-First Search algorithm starts on node C of the graph below, and if the recursive calls on adjacent nodes occur in the alphabetic order of the labels of those nodes, the next node the algorithm will visit is: 13/36
163 11/6/2014 Qualtrics Survey Software node A node B node D node E node C If the Depth-First Search algorithm starts on node C of the graph below, and if the recursive calls on adjacent nodes occur in the alphabetic order of the labels of those nodes, the order in which the algorithm will visit all the nodes is: 14/36
164 11/6/2014 Qualtrics Survey Software C-B-A-E-D C-A-B-D-E C-E-A-D-B None of the above C-A-D-B-E If the Breadth-First Search algorithm starts on node C of the graph below, and if the adjacent nodes are marked and added to the queue in the alphabetic order of the labels of those nodes, the next nodes the algorithm will add to the queue are: 15/36
165 11/6/2014 Qualtrics Survey Software nodes B & D nodes A & B nodes C & B nodes A, B & D nodes A & D If the Breadth-First Search algorithm starts on node C of the graph below, and if the adjacent nodes are marked and added to the queue in the alphabetic order of the labels of those nodes, the order in which the algorithm will visit all the nodes is: 16/36
166 11/6/2014 Qualtrics Survey Software C-B-A-D-E C-D-B-A-E C-A-E-B-D None of the above C-B-D-A-E True or False? 17/36
167 11/6/2014 Qualtrics Survey Software If the Breadth-First Search algorithm starts on node E of the graph above, it will not visit any other nodes. Posttest If the Depth-First Search algorithm starts on node A of the graph below, and if the 18/36
168 11/6/2014 Qualtrics Survey Software recursive calls on adjacent nodes occur in the alphabetic order of the labels of those nodes, the next node the algorithm will visit is: node A node B node D node E node C If the Depth-First Search algorithm starts on node A of the graph below, and if the recursive calls on adjacent nodes occur in the alphabetic order of the labels of those nodes, the order in which the algorithm will visit all the nodes is: 19/36
169 11/6/2014 Qualtrics Survey Software A-B-C-D-E A-C-B-D-E A-E-C-D-B None of the above A-C-D-B-E True or False? 20/36
170 11/6/2014 Qualtrics Survey Software If the Depth-First Search algorithm starts on node E of the graph above, it will not visit any other nodes. If the Breadth-First Search algorithm starts on node A of the graph below, and if the adjacent nodes are marked and added to the queue in the alphabetic order of the labels of those nodes, the next nodes the algorithm will add to the queue are: 21/36
171 11/6/2014 Qualtrics Survey Software nodes A & B nodes B & E nodes C & B nodes B, C & E nodes C & E If the Breadth-First Search algorithm starts on node A of the graph below, and if the adjacent nodes are marked and added to the queue in the alphabetic order of the labels of those nodes, the order in which the algorithm will visit all the nodes is: 22/36

172 11/6/2014 Qualtrics Survey Software A-B-C-D-E A-C-B-D-E A-C-E-B-D None of the above A-C-D-B-E True or False? 23/36

173 11/6/2014 Qualtrics Survey Software Node 2 is an ancestor of node 7 Node 7 is a descendant of node 3 Node 4 is a child of node 1 Node 2 is the parent of node 5 Node 5 is a leaf True or False? 24/36
 of all edges in this graph are reversed.")
174 11/6/2014 Qualtrics Survey Software Graph A is a complete graph Graph B is a complete graph Graph B is a clique Nodes 1, 4 & 5 in Graph B form a clique Graph C is an acyclic graph The graph represented by the adjacency matrix below is a directed graph. Suppose the directions (arrows) of all edges in this graph are reversed. Which of the adjacency matrices below represents this reversed graph? 25/36
175 11/6/2014 Qualtrics Survey Software None of these matrices corresponds to the reversed graph. 26/36
 of all edges in this graph are reversed. Which of the adjacency lists below represents this reversed graph? https://auburn.qualtrics.")
176 11/6/2014 Qualtrics Survey Software The graph represented by the adjacency list below is a directed graph. Suppose the directions (arrows) of all edges in this graph are reversed. Which of the adjacency lists below represents this reversed graph? 27/36
177 11/6/2014 Qualtrics Survey Software None of these lists corresponds to the reversed graph. 28/36
178 11/6/2014 Qualtrics Survey Software True or False? Adjacency matrix A represents an unweighted directed graph Adjacency matrix B represents a weighted undirected graph Is the graph represented by the adjacency list below a directed graph or an undirected graph? 29/36

179 11/6/2014 Qualtrics Survey Software Directed graph Undirected graph I don t know Is the graph represented by the adjacency matrix below a directed graph or an undirected graph? 30/36
180 11/6/2014 Qualtrics Survey Software Directed graph Undirected graph I don t know Consider a graph with 5 nodes and 25 edges. How many cells in its 5X5 adjacency matrix will have 1 s in them if the graph is directed? None of the above 5 Consider a graph with 5 nodes and 25 edges. How many cells in its 5X5 adjacency matrix will have 1 s in them if the graph is undirected? None of the above 5 Consider a graph with 5 nodes and 50 edges. How many linked lists will its adjacency list representation have? None of the above /36
181 11/6/2014 Qualtrics Survey Software Consider a graph with 5 nodes and 25 edges. How many total linked list nodes representing edges will its adjacency list representation contain if the graph is directed? None of the above 5 Consider a graph with 5 nodes and 25 edges. How many total linked list nodes representing edges will its adjacency list representation contain if the graph is undirected? None of the above 5 Which of the graphs below correspond to the adjacency matrix shown below? 32/36

182 11/6/2014 Qualtrics Survey Software None of these graphs corresponds to the adjacency matrix. 33/36

183 11/6/2014 Qualtrics Survey Software Which of the graphs below correspond to the adjacency list shown below? 34/36
On-Line Data Analytics
 International Journal of Computer Applications in Engineering Sciences [VOL I, ISSUE III, SEPTEMBER 2011] [ISSN: 2231-4946] On-Line Data Analytics Yugandhar Vemulapalli #, Devarapalli Raghu *, Raja Jacob
Appendix L: Online Testing Highlights and Script
 Online Testing Highlights and Script for Fall 2017 Ohio s State Tests Administrations Test administrators must use this document when administering Ohio s State Tests online. It includes step-by-step directions,
BSM 2801, Sport Marketing Course Syllabus. Course Description. Course Textbook. Course Learning Outcomes. Credits.
 BSM 2801, Sport Marketing Course Syllabus Course Description Examines the theoretical and practical implications of marketing in the sports industry by presenting a framework to help explain and organize
Case study Norway case 1
 Case study Norway case 1 School : B (primary school) Theme: Science microorganisms Dates of lessons: March 26-27 th 2015 Age of students: 10-11 (grade 5) Data sources: Pre- and post-interview with 1 teacher
Using SAM Central With iread
 Using SAM Central With iread January 1, 2016 For use with iread version 1.2 or later, SAM Central, and Student Achievement Manager version 2.4 or later PDF0868 (PDF) Houghton Mifflin Harcourt Publishing
CHANCERY SMS 5.0 STUDENT SCHEDULING
 CHANCERY SMS 5.0 STUDENT SCHEDULING PARTICIPANT WORKBOOK VERSION: 06/04 CSL - 12148 Student Scheduling Chancery SMS 5.0 : Student Scheduling... 1 Course Objectives... 1 Course Agenda... 1 Topic 1: Overview
Implementing a tool to Support KAOS-Beta Process Model Using EPF
 Implementing a tool to Support KAOS-Beta Process Model Using EPF Malihe Tabatabaie Malihe.Tabatabaie@cs.york.ac.uk Department of Computer Science The University of York United Kingdom Eclipse Process Framework
Experience College- and Career-Ready Assessment User Guide
 Experience College- and Career-Ready Assessment User Guide 2014-2015 Introduction Welcome to Experience College- and Career-Ready Assessment, or Experience CCRA. Experience CCRA is a series of practice
Prototype Development of Integrated Class Assistance Application Using Smart Phone
 Prototype Development of Integrated Class Assistance Application Using Smart Phone Kazuya Murata, Takayuki Fujimoto Graduate School of Engineering, Toyo University Kujirai 2100, Kawagoe-City, Saitama Japan
Field Experience Management 2011 Training Guides
 Field Experience Management 2011 Training Guides Page 1 of 40 Contents Introduction... 3 Helpful Resources Available on the LiveText Conference Visitors Pass... 3 Overview... 5 Development Model for FEM...
Bluetooth mlearning Applications for the Classroom of the Future
 Bluetooth mlearning Applications for the Classroom of the Future Tracey J. Mehigan, Daniel C. Doolan, Sabin Tabirca Department of Computer Science, University College Cork, College Road, Cork, Ireland
Using Virtual Manipulatives to Support Teaching and Learning Mathematics
 Using Virtual Manipulatives to Support Teaching and Learning Mathematics Joel Duffin Abstract The National Library of Virtual Manipulatives (NLVM) is a free website containing over 110 interactive online
Moodle Student User Guide
 Moodle Student User Guide Moodle Student User Guide... 1 Aims and Objectives... 2 Aim... 2 Student Guide Introduction... 2 Entering the Moodle from the website... 2 Entering the course... 3 In the course...
Spring 2015 Achievement Grades 3 to 8 Social Studies and End of Course U.S. History Parent/Teacher Guide to Online Field Test Electronic Practice
 Spring 2015 Achievement Grades 3 to 8 Social Studies and End of Course U.S. History Parent/Teacher Guide to Online Field Test Electronic Practice Assessment Tests (epats) FAQs, Instructions, and Hardware
Using Blackboard.com Software to Reach Beyond the Classroom: Intermediate
 Using Blackboard.com Software to Reach Beyond the Classroom: Intermediate NESA Conference 2007 Presenter: Barbara Dent Educational Technology Training Specialist Thomas Jefferson High School for Science
K5 Math Practice. Free Pilot Proposal Jan -Jun Boost Confidence Increase Scores Get Ahead. Studypad, Inc.
 K5 Math Practice Boost Confidence Increase Scores Get Ahead Free Pilot Proposal Jan -Jun 2017 Studypad, Inc. 100 W El Camino Real, Ste 72 Mountain View, CA 94040 Table of Contents I. Splash Math Pilot
CHALLENGES FACING DEVELOPMENT OF STRATEGIC PLANS IN PUBLIC SECONDARY SCHOOLS IN MWINGI CENTRAL DISTRICT, KENYA
 CHALLENGES FACING DEVELOPMENT OF STRATEGIC PLANS IN PUBLIC SECONDARY SCHOOLS IN MWINGI CENTRAL DISTRICT, KENYA By Koma Timothy Mutua Reg. No. GMB/M/0870/08/11 A Research Project Submitted In Partial Fulfilment
Modeling user preferences and norms in context-aware systems
 Modeling user preferences and norms in context-aware systems Jonas Nilsson, Cecilia Lindmark Jonas Nilsson, Cecilia Lindmark VT 2016 Bachelor's thesis for Computer Science, 15 hp Supervisor: Juan Carlos
Using interactive simulation-based learning objects in introductory course of programming
 Available online at www.sciencedirect.com Procedia - Social and Behavioral Sciences 46 ( 2012 ) 2276 2280 WCES 2012 Using interactive simulation-based learning objects in introductory course of programming
THE INFLUENCE OF COOPERATIVE WRITING TECHNIQUE TO TEACH WRITING SKILL VIEWED FROM STUDENTS CREATIVITY
 THE INFLUENCE OF COOPERATIVE WRITING TECHNIQUE TO TEACH WRITING SKILL VIEWED FROM STUDENTS CREATIVITY (An Experimental Research at the Fourth Semester of English Department of Slamet Riyadi University,
Specification of the Verity Learning Companion and Self-Assessment Tool
 Specification of the Verity Learning Companion and Self-Assessment Tool Sergiu Dascalu* Daniela Saru** Ryan Simpson* Justin Bradley* Eva Sarwar* Joohoon Oh* * Department of Computer Science ** Dept. of
Multimedia Courseware of Road Safety Education for Secondary School Students
 Multimedia Courseware of Road Safety Education for Secondary School Students Hanis Salwani, O 1 and Sobihatun ur, A.S 2 1 Universiti Utara Malaysia, Malaysia, hanisalwani89@hotmail.com 2 Universiti Utara
Shank, Matthew D. (2009). Sports marketing: A strategic perspective (4th ed.). Upper Saddle River, NJ: Pearson/Prentice Hall.
. Sports marketing: A strategic perspective (4th ed.). Upper Saddle River, NJ: Pearson/Prentice Hall.") BSM 2801, Sport Marketing Course Syllabus Course Description Examines the theoretical and practical implications of marketing in the sports industry by presenting a framework to help explain and organize
BSM 2801, Sport Marketing Course Syllabus Course Description Examines the theoretical and practical implications of marketing in the sports industry by presenting a framework to help explain and organize
Android App Development for Beginners
 Description Android App Development for Beginners DEVELOP ANDROID APPLICATIONS Learning basics skills and all you need to know to make successful Android Apps. This course is designed for students who
PSY 1010, General Psychology Course Syllabus. Course Description. Course etextbook. Course Learning Outcomes. Credits.
 Course Syllabus Course Description This course is an introductory survey of the principles, theories, and methods of psychology as a basis for the understanding of human behavior and mental processes.
TA Certification Course Additional Information Sheet
 2016 17 TA Certification Course Additional Information Sheet The Test Administrator (TA) Certification Course is built to provide general information to all state programs that use the AIR Test Delivery
Student Handbook. This handbook was written for the students and participants of the MPI Training Site.
 Student Handbook This handbook was written for the students and participants of the MPI Training Site. Purpose To enable the active participants of this website easier operation and a thorough understanding
Justin Raisner December 2010 EdTech 503
 Justin Raisner December 2010 EdTech 503 INSTRUCTIONAL DESIGN PROJECT: ADOBE INDESIGN LAYOUT SKILLS For teaching basic indesign skills to student journalists who will edit the school newspaper. TABLE OF
Test Administrator User Guide
 Test Administrator User Guide Fall 2017 and Winter 2018 Published October 17, 2017 Prepared by the American Institutes for Research Descriptions of the operation of the Test Information Distribution Engine,
RETURNING TEACHER REQUIRED TRAINING MODULE YE TRANSCRIPT
 RETURNING TEACHER REQUIRED TRAINING MODULE YE Slide 1. The Dynamic Learning Maps Alternate Assessments are designed to measure what students with significant cognitive disabilities know and can do in relation
Lectora a Complete elearning Solution
 Lectora a Complete elearning Solution Irina Ioniţă 1, Liviu Ioniţă 1 (1) University Petroleum-Gas of Ploiesti, Department of Information Technology, Mathematics, Physics, Bd. Bucuresti, No.39, 100680,
Guidelines for Project I Delivery and Assessment Department of Industrial and Mechanical Engineering Lebanese American University
 Guidelines for Project I Delivery and Assessment Department of Industrial and Mechanical Engineering Lebanese American University Approved: July 6, 2009 Amended: July 28, 2009 Amended: October 30, 2009
Your School and You. Guide for Administrators
 Your School and You Guide for Administrators Table of Content SCHOOLSPEAK CONCEPTS AND BUILDING BLOCKS... 1 SchoolSpeak Building Blocks... 3 ACCOUNT... 4 ADMIN... 5 MANAGING SCHOOLSPEAK ACCOUNT ADMINISTRATORS...
Urban Analysis Exercise: GIS, Residential Development and Service Availability in Hillsborough County, Florida
 UNIVERSITY OF NORTH TEXAS Department of Geography GEOG 3100: US and Canada Cities, Economies, and Sustainability Urban Analysis Exercise: GIS, Residential Development and Service Availability in Hillsborough
2 User Guide of Blackboard Mobile Learn for CityU Students (Android) How to download / install Bb Mobile Learn? Downloaded from Google Play Store
 How to download / install Bb Mobile Learn? Downloaded from Google Play Store") 2 User Guide of Blackboard Mobile Learn for CityU Students (Android) Part 1 Part 2 Part 3 Part 4 How to download / install Bb Mobile Learn? Downloaded from Google Play Store How to access e Portal via
2 User Guide of Blackboard Mobile Learn for CityU Students (Android) Part 1 Part 2 Part 3 Part 4 How to download / install Bb Mobile Learn? Downloaded from Google Play Store How to access e Portal via
AGENDA LEARNING THEORIES LEARNING THEORIES. Advanced Learning Theories 2/22/2016
 AGENDA Advanced Learning Theories Alejandra J. Magana, Ph.D. admagana@purdue.edu Introduction to Learning Theories Role of Learning Theories and Frameworks Learning Design Research Design Dual Coding Theory
Houghton Mifflin Online Assessment System Walkthrough Guide
 Houghton Mifflin Online Assessment System Walkthrough Guide Page 1 Copyright 2007 by Houghton Mifflin Company. All Rights Reserved. No part of this document may be reproduced or transmitted in any form
Bitstrips for Schools: A How-To Guide
 Bitstrips for Schools: A How-To Guide By: Sara Belliveau & Kimberly Mertens EDUC 5553: Educational Technologies Bitstrips for Schools Table of Contents I. Introduction II. III. IV. History Required Materials
Longman English Interactive
 Longman English Interactive Level 3 Orientation Quick Start 2 Microphone for Speaking Activities 2 Course Navigation 3 Course Home Page 3 Course Overview 4 Course Outline 5 Navigating the Course Page 6
Introduction to Moodle
 Center for Excellence in Teaching and Learning Mr. Philip Daoud Introduction to Moodle Beginner s guide Center for Excellence in Teaching and Learning / Teaching Resource This manual is part of a serious
Application of Virtual Instruments (VIs) for an enhanced learning environment
 for an enhanced learning environment") Application of Virtual Instruments (VIs) for an enhanced learning environment Philip Smyth, Dermot Brabazon, Eilish McLoughlin Schools of Mechanical and Physical Sciences Dublin City University Ireland
Application of Virtual Instruments (VIs) for an enhanced learning environment Philip Smyth, Dermot Brabazon, Eilish McLoughlin Schools of Mechanical and Physical Sciences Dublin City University Ireland
Different Requirements Gathering Techniques and Issues. Javaria Mushtaq
 835 Different Requirements Gathering Techniques and Issues Javaria Mushtaq Abstract- Project management is now becoming a very important part of our software industries. To handle projects with success
Dowling, P. J., Festing, M., & Engle, A. (2013). International human resource management (6th ed.). Boston, MA: Cengage Learning.
. International human resource management (6th ed.). Boston, MA: Cengage Learning.") BHR 4501, International Human Resource Management Course Syllabus Course Description Examines three broad areas of international human resource management by examining human behavior within organizations
BHR 4501, International Human Resource Management Course Syllabus Course Description Examines three broad areas of international human resource management by examining human behavior within organizations
Evaluation of Usage Patterns for Web-based Educational Systems using Web Mining
 Evaluation of Usage Patterns for Web-based Educational Systems using Web Mining Dave Donnellan, School of Computer Applications Dublin City University Dublin 9 Ireland daviddonnellan@eircom.net Claus Pahl
Evaluation of Usage Patterns for Web-based Educational Systems using Web Mining
 Evaluation of Usage Patterns for Web-based Educational Systems using Web Mining Dave Donnellan, School of Computer Applications Dublin City University Dublin 9 Ireland daviddonnellan@eircom.net Claus Pahl
Education & Training Plan Civil Litigation Specialist Certificate Program with Externship
 C.15.33 (Created 07-17-2017) AUBURN OHICE OF P ROFESSIONAL AND CONTINUING EDUCATION Office of Professional & Continuing Education 301 OD Smith Hall Auburn, AL 36849 http://www.auburn.edu/mycaa Contact:
Star Math Pretest Instructions
 Star Math Pretest Instructions Renaissance Learning P.O. Box 8036 Wisconsin Rapids, WI 54495-8036 (800) 338-4204 www.renaissance.com All logos, designs, and brand names for Renaissance products and services,
CS Machine Learning
 CS 478 - Machine Learning Projects Data Representation Basic testing and evaluation schemes CS 478 Data and Testing 1 Programming Issues l Program in any platform you want l Realize that you will be doing
Session Six: Software Evaluation Rubric Collaborators: Susan Ferdon and Steve Poast
 EDTECH 554 (FA10) Susan Ferdon Session Six: Software Evaluation Rubric Collaborators: Susan Ferdon and Steve Poast Task The principal at your building is aware you are in Boise State's Ed Tech Master's
Enter the World of Polling, Survey &
 Enter the World of Polling, Survey & Mobile Enter the World of MOBILE LEARNING INNOVATION CONTENTS Page 1. Introduction to I.C.O. Europe 3 2. What type of Learning produces the greatest effect? 4-6 3.
Feature-oriented vs. Needs-oriented Product Access for Non-Expert Online Shoppers
 Feature-oriented vs. Needs-oriented Product Access for Non-Expert Online Shoppers Daniel Felix 1, Christoph Niederberger 1, Patrick Steiger 2 & Markus Stolze 3 1 ETH Zurich, Technoparkstrasse 1, CH-8005
A THESIS. By: IRENE BRAINNITA OKTARIN S
 THE EFFECTIVENESS OF BLENDED LEARNING TO TEACH WRITING VIEWED FROM STUDENTS CREATIVITY (An Experimental Study at the English Education Department of Slamet Riyadi University in the Academic Year of 2014/2015)
myperspectives 2017 Click Path to Success myperspectives 2017 Virtual Activation Click Path
 myperspectives 2017 Click Path to Success Click Path Overview Sign in to PearsonRealize.com. Click Sign In. Click to Discover Note that you can also use helpful resources on the PearsonRealize.com home
Distributed Weather Net: Wireless Sensor Network Supported Inquiry-Based Learning
 Distributed Weather Net: Wireless Sensor Network Supported Inquiry-Based Learning Ben Chang, Department of E-Learning Design and Management, National Chiayi University, 85 Wenlong, Mingsuin, Chiayi County
An ICT environment to assess and support students mathematical problem-solving performance in non-routine puzzle-like word problems
 An ICT environment to assess and support students mathematical problem-solving performance in non-routine puzzle-like word problems Angeliki Kolovou* Marja van den Heuvel-Panhuizen*# Arthur Bakker* Iliada
Outreach Connect User Manual
 Outreach Connect A Product of CAA Software, Inc. Outreach Connect User Manual Church Growth Strategies Through Sunday School, Care Groups, & Outreach Involving Members, Guests, & Prospects PREPARED FOR:
On Human Computer Interaction, HCI. Dr. Saif al Zahir Electrical and Computer Engineering Department UBC
 On Human Computer Interaction, HCI Dr. Saif al Zahir Electrical and Computer Engineering Department UBC Human Computer Interaction HCI HCI is the study of people, computer technology, and the ways these
Usability Design Strategies for Children: Developing Children Learning and Knowledge in Decreasing Children Dental Anxiety
 Presentation Title Usability Design Strategies for Children: Developing Child in Primary School Learning and Knowledge in Decreasing Children Dental Anxiety Format Paper Session [ 2.07 ] Sub-theme Teaching
Mathematics Program Assessment Plan
 Mathematics Program Assessment Plan Introduction This assessment plan is tentative and will continue to be refined as needed to best fit the requirements of the Board of Regent s and UAS Program Review
Creating a Test in Eduphoria! Aware
 in Eduphoria! Aware Login to Eduphoria using CHROME!!! 1. LCS Intranet > Portals > Eduphoria From home: LakeCounty.SchoolObjects.com 2. Login with your full email address. First time login password default
Knowledge management styles and performance: a knowledge space model from both theoretical and empirical perspectives
 University of Wollongong Research Online University of Wollongong Thesis Collection University of Wollongong Thesis Collections 2004 Knowledge management styles and performance: a knowledge space model
Computer Organization I (Tietokoneen toiminta)
") 581305-6 Computer Organization I (Tietokoneen toiminta) Teemu Kerola University of Helsinki Department of Computer Science Spring 2010 1 Computer Organization I Course area and goals Course learning methods
581305-6 Computer Organization I (Tietokoneen toiminta) Teemu Kerola University of Helsinki Department of Computer Science Spring 2010 1 Computer Organization I Course area and goals Course learning methods
Renaissance Learning P.O. Box 8036 Wisconsin Rapids, WI (800)
") Pretest Instructions It is extremely important that you follow standard testing procedures when you administer the STAR Early Literacy Enterprise test to your students. Before you begin testing, please
Pretest Instructions It is extremely important that you follow standard testing procedures when you administer the STAR Early Literacy Enterprise test to your students. Before you begin testing, please
MBA 5652, Research Methods Course Syllabus. Course Description. Course Material(s) Course Learning Outcomes. Credits.
 Course Learning Outcomes. Credits.") MBA 5652, Research Methods Course Syllabus Course Description Guides students in advancing their knowledge of different research principles used to embrace organizational opportunities and combat weaknesses
MBA 5652, Research Methods Course Syllabus Course Description Guides students in advancing their knowledge of different research principles used to embrace organizational opportunities and combat weaknesses
A Coding System for Dynamic Topic Analysis: A Computer-Mediated Discourse Analysis Technique
 A Coding System for Dynamic Topic Analysis: A Computer-Mediated Discourse Analysis Technique Hiromi Ishizaki 1, Susan C. Herring 2, Yasuhiro Takishima 1 1 KDDI R&D Laboratories, Inc. 2 Indiana University
A faculty approach -learning tools. Audio Tools Tutorial and Presentation software Video Tools Authoring tools
 A faculty approach -learning tools Audio Tools Tutorial and Presentation software Video Tools Authoring tools Quizz tools Powerpoint 2 Flash Content tools Web 2.0 tools RUFO Project Work visit at Paris
Generating Test Cases From Use Cases
 1 of 13 1/10/2007 10:41 AM Generating Test Cases From Use Cases by Jim Heumann Requirements Management Evangelist Rational Software pdf (155 K) In many organizations, software testing accounts for 30 to
TeacherPlus Gradebook HTML5 Guide LEARN OUR SOFTWARE STEP BY STEP
 TeacherPlus Gradebook HTML5 Guide LEARN OUR SOFTWARE STEP BY STEP Copyright 2017 Rediker Software. All rights reserved. Information in this document is subject to change without notice. The software described
Cambridge NATIONALS. Creative imedia Level 1/2. UNIT R081 - Pre-Production Skills DELIVERY GUIDE
 Cambridge NATIONALS Creative imedia Level 1/2 UNIT R081 - Pre-Production Skills VERSION 1 APRIL 2013 INDEX Introduction Page 3 Unit R081 - Pre-Production Skills Page 4 Learning Outcome 1 - Understand the
Science Olympiad Competition Model This! Event Guidelines
 Science Olympiad Competition Model This! Event Guidelines These guidelines should assist event supervisors in preparing for and setting up the Model This! competition for Divisions B and C. Questions should
Ruggiero, V. R. (2015). The art of thinking: A guide to critical and creative thought (11th ed.). New York, NY: Longman.
. The art of thinking: A guide to critical and creative thought (11th ed.). New York, NY: Longman.") BSL 4080, Creative Thinking and Problem Solving Course Syllabus Course Description An in-depth study of creative thinking and problem solving techniques that are essential for organizational leaders. Causal,
BSL 4080, Creative Thinking and Problem Solving Course Syllabus Course Description An in-depth study of creative thinking and problem solving techniques that are essential for organizational leaders. Causal,
BHA 4053, Financial Management in Health Care Organizations Course Syllabus. Course Description. Course Textbook. Course Learning Outcomes.
 BHA 4053, Financial Management in Health Care Organizations Course Syllabus Course Description Introduces key aspects of financial management for today's healthcare organizations, addressing diverse factors
Student Perceptions of Reflective Learning Activities
 Student Perceptions of Reflective Learning Activities Rosalind Wynne Electrical and Computer Engineering Department Villanova University, PA rosalind.wynne@villanova.edu Abstract It is widely accepted
Home Access Center. Connecting Parents to Fulton County Schools
 Home Access Center Connecting Parents to Fulton County Schools What is Home Access Center? Website available to parents (and at site discretion, students) that is a real-time look at student data The data
Grade 4. Common Core Adoption Process. (Unpacked Standards)
") Grade 4 Common Core Adoption Process (Unpacked Standards) Grade 4 Reading: Literature RL.4.1 Refer to details and examples in a text when explaining what the text says explicitly and when drawing inferences
Grade 4 Common Core Adoption Process (Unpacked Standards) Grade 4 Reading: Literature RL.4.1 Refer to details and examples in a text when explaining what the text says explicitly and when drawing inferences
Automating Outcome Based Assessment
 Automating Outcome Based Assessment Suseel K Pallapu Graduate Student Department of Computing Studies Arizona State University Polytechnic (East) 01 480 449 3861 harryk@asu.edu ABSTRACT In the last decade,
Test How To. Creating a New Test
 Test How To Creating a New Test From the Control Panel of your course, select the Test Manager link from the Assessments box. The Test Manager page lists any tests you have already created. From this screen
Preferences...3 Basic Calculator...5 Math/Graphing Tools...5 Help...6 Run System Check...6 Sign Out...8
 CONTENTS GETTING STARTED.................................... 1 SYSTEM SETUP FOR CENGAGENOW....................... 2 USING THE HEADER LINKS.............................. 2 Preferences....................................................3
Bittinger, M. L., Ellenbogen, D. J., & Johnson, B. L. (2012). Prealgebra (6th ed.). Boston, MA: Addison-Wesley.
. Prealgebra (6th ed.). Boston, MA: Addison-Wesley.") Course Syllabus Course Description Explores the basic fundamentals of college-level mathematics. (Note: This course is for institutional credit only and will not be used in meeting degree requirements.
Course Syllabus Course Description Explores the basic fundamentals of college-level mathematics. (Note: This course is for institutional credit only and will not be used in meeting degree requirements.
TIPS PORTAL TRAINING DOCUMENTATION
 TIPS PORTAL TRAINING DOCUMENTATION 1 TABLE OF CONTENTS General Overview of TIPS. 3, 4 TIPS, Where is it? How do I access it?... 5, 6 Grade Reports.. 7 Grade Reports Demo and Exercise 8 12 Withdrawal Reports.
Fort Lewis College Institutional Review Board Application to Use Human Subjects in Research
 Fort Lewis College Institutional Review Board Application to Use Human Subjects in Research Submit this application by email attachment to IRB@fortlewis.edu I believe this research qualifies for a Full
Bluetooth mlearning Applications for the Classroom of the Future
 Bluetooth mlearning Applications for the Classroom of the Future Tracey J. Mehigan Daniel C. Doolan Sabin Tabirca University College Cork, Ireland 2007 Overview Overview Introduction Mobile Learning Bluetooth
Ministry of Education, Republic of Palau Executive Summary
 Ministry of Education, Republic of Palau Executive Summary Student Consultant, Jasmine Han Community Partner, Edwel Ongrung I. Background Information The Ministry of Education is one of the eight ministries
STUDENT MOODLE ORIENTATION
 BAKER UNIVERSITY SCHOOL OF PROFESSIONAL AND GRADUATE STUDIES STUDENT MOODLE ORIENTATION TABLE OF CONTENTS Introduction to Moodle... 2 Online Aptitude Assessment... 2 Moodle Icons... 6 Logging In... 8 Page
November 17, 2017 ARIZONA STATE UNIVERSITY. ADDENDUM 3 RFP Digital Integrated Enrollment Support for Students
 November 17, 2017 ARIZONA STATE UNIVERSITY ADDENDUM 3 RFP 331801 Digital Integrated Enrollment Support for Students Please note the following answers to questions that were asked prior to the deadline
Writing Research Articles
 Marek J. Druzdzel with minor additions from Peter Brusilovsky University of Pittsburgh School of Information Sciences and Intelligent Systems Program marek@sis.pitt.edu http://www.pitt.edu/~druzdzel Overview
Carolina Course Evaluation Item Bank Last Revised Fall 2009
 Carolina Course Evaluation Item Bank Last Revised Fall 2009 Items Appearing on the Standard Carolina Course Evaluation Instrument Core Items Instructor and Course Characteristics Results are intended for
Software Security: Integrating Secure Software Engineering in Graduate Computer Science Curriculum
 Software Security: Integrating Secure Software Engineering in Graduate Computer Science Curriculum Stephen S. Yau, Fellow, IEEE, and Zhaoji Chen Arizona State University, Tempe, AZ 85287-8809 {yau, zhaoji.chen@asu.edu}
Green Belt Curriculum (This workshop can also be conducted on-site, subject to price change and number of participants)
") Green Belt Curriculum (This workshop can also be conducted on-site, subject to price change and number of participants) Notes: 1. We use Mini-Tab in this workshop. Mini-tab is available for free trail
Green Belt Curriculum (This workshop can also be conducted on-site, subject to price change and number of participants) Notes: 1. We use Mini-Tab in this workshop. Mini-tab is available for free trail
Administrative Services Manager Information Guide
 Administrative Services Manager Information Guide What to Expect on the Structured Interview July 2017 Jefferson County Commission Human Resources Department Recruitment and Selection Division Table of
WiggleWorks Software Manual PDF0049 (PDF) Houghton Mifflin Harcourt Publishing Company
 Houghton Mifflin Harcourt Publishing Company") WiggleWorks Software Manual PDF0049 (PDF) Houghton Mifflin Harcourt Publishing Company Table of Contents Welcome to WiggleWorks... 3 Program Materials... 3 WiggleWorks Teacher Software... 4 Logging In...
WiggleWorks Software Manual PDF0049 (PDF) Houghton Mifflin Harcourt Publishing Company Table of Contents Welcome to WiggleWorks... 3 Program Materials... 3 WiggleWorks Teacher Software... 4 Logging In...
Welcome to California Colleges, Platform Exploration (6.1) Goal: Students will familiarize themselves with the CaliforniaColleges.edu platform.
 Goal: Students will familiarize themselves with the CaliforniaColleges.edu platform.") Welcome to California Colleges, Platform Exploration (6.1) Goal: Students will familiarize themselves with the CaliforniaColleges.edu platform. Lesson Time Options This lesson requires one 45-60 minute
Welcome to California Colleges, Platform Exploration (6.1) Goal: Students will familiarize themselves with the CaliforniaColleges.edu platform. Lesson Time Options This lesson requires one 45-60 minute
Level 1 Mathematics and Statistics, 2015
 91037 910370 1SUPERVISOR S Level 1 Mathematics and Statistics, 2015 91037 Demonstrate understanding of chance and data 9.30 a.m. Monday 9 November 2015 Credits: Four Achievement Achievement with Merit
A 3D SIMULATION GAME TO PRESENT CURTAIN WALL SYSTEMS IN ARCHITECTURAL EDUCATION
 A 3D SIMULATION GAME TO PRESENT CURTAIN WALL SYSTEMS IN ARCHITECTURAL EDUCATION Eray ŞAHBAZ* & Fuat FİDAN** *Eray ŞAHBAZ, PhD, Department of Architecture, Karabuk University, Karabuk, Turkey, E-Mail: eraysahbaz@karabuk.edu.tr
1 Use complex features of a word processing application to a given brief. 2 Create a complex document. 3 Collaborate on a complex document.
 National Unit specification General information Unit code: HA6M 46 Superclass: CD Publication date: May 2016 Source: Scottish Qualifications Authority Version: 02 Unit purpose This Unit is designed to
CWIS 23,3. Nikolaos Avouris Human Computer Interaction Group, University of Patras, Patras, Greece
 The current issue and full text archive of this journal is available at wwwemeraldinsightcom/1065-0741htm CWIS 138 Synchronous support and monitoring in web-based educational systems Christos Fidas, Vasilios
BUSINESS OPERATIONS RESEARCH EVENTS
 BUSINESS OPERATIONS RESEARCH EVENTS BUSINESS SERVICES OPERATIONS RESEARCH BOR BUYING AND MERCHANDISING OPERATIONS RESEARCH BMOR Sponsored by Piper Jaffray FINANCE OPERATIONS RESEARCH FOR HOSPITALITY AND
PROFESSIONAL TREATMENT OF TEACHERS AND STUDENT ACADEMIC ACHIEVEMENT. James B. Chapman. Dissertation submitted to the Faculty of the Virginia
 PROFESSIONAL TREATMENT OF TEACHERS AND STUDENT ACADEMIC ACHIEVEMENT by James B. Chapman Dissertation submitted to the Faculty of the Virginia Polytechnic Institute and State University in partial fulfillment
Guidelines for Writing an Internship Report
 Guidelines for Writing an Internship Report Master of Commerce (MCOM) Program Bahauddin Zakariya University, Multan Table of Contents Table of Contents... 2 1. Introduction.... 3 2. The Required Components