Moving On: Scientific Enquiry Progression Tasks for KS2 and KS3. The North Yorkshire AstraZeneca Science Pedagogy and Progression (NYASPP) Project
|
|
|
- Bryce Harrell
- 6 years ago
- Views:
Transcription

1 Moving On: Scientific Enquiry Progression Tasks for KS2 and KS3 The North Yorkshire AstraZeneca Science Pedagogy and Progression (NYASPP) Project Edited by: Martin Braund, Department of Educational Studies, University of York Tim Greenway, Education Service, North Yorkshire County Council Zoë Crompton, City of York, Key Stage 3 Strategy Team With the assistance of John Crossland and Pam Waite, North Yorkshire County Council. Writing teams: Mouldy Old Dough Gail Taylor (Tadcaster Grammar School); Sally Burgin (Forest of Galtres Anglican/Methodist Primary School): Chelo Brooks (Kirk Fenton Parochial C of E Primary School). Finding a Solution Nicky Adams (Western Primary School); Liz Jackson (Pannal Community Primary School); Maureen Wilkinson (St Aidan s C of E High School). Lighting Up Brian Cowie (Barlby High School); Kath Lawson (Bedale C of E Primary School) Springy Stretchy Things Liz Ives (Nawton County Primary School); Sally Marjoram (Risedale Community College) The project team would like to thank the AstraZeneca Science Teaching Trust who financed the project and the Education Service in North Yorkshire for additional support. Department of Educational Studies, University of York and North Yorkshire County Council, July 2004
2 Contents: Page (1) Teaching with progression and continuity in mind 1 (2) Progression in science process skills 2 (3) How Scientific Enquiry Progression Tasks are organised 4 (4) Mouldy Old Dough 7 (5) Finding a Solution 29 (6) Lighting Up 46 (7) Stretchy Things 62 (8) Using the CD 77 (9) Some useful references and resources 78 (10) Acknowledgements 79
3 (1) UTeaching with progression and continuity in mind An important part of the Key Stage 3 Strategy for Science is to improve transfer from primary to secondary school. There has been mounting evidence in recent years that children do not progress as well as they should in science following the move to secondary school. Many feel that the successes of primary science over the last decade or so have not been built on. Children s motivation and interest in science decline during KS3 partly because previous work is repeated and lessons underestimate what they are capable of and have achieved. The tasks in this booklet have been written with better progression and continuity in mind. They are produced as pairs of lessons: one to be taught in KS2 and the other in KS3. Just using these lessons will not ensure better progression from primary to secondary science but they should help teachers see how children s skills and knowledge can be recognised, built on and progressed. We have found that it is also important to teach with continuity in mind. This does not mean that primary and secondary schools should always teach in the same way, but there are some things that children clearly value and that motivate them, help them settle in their new schools and achieve in science. Some of these things are: Using terms that children are familiar with. Building in opportunities to use new words but recognising that they already know and understand some. Setting scientific enquiries in interesting social, commercial or industrial contexts. Using letters or s to invite children to plan enquiries and solve problems. Helping children plan investigations in consistent ways. Valuing the work children have already done. Using previously collected data and findings as starting points for further enquiries in KS3. Making the best of new equipment and opportunities but without denigrating primary science as inaccurate and worthless. The work in this unit has been thoroughly trialled in project and other schools with classes in Y5, Y6, Y7 and Y8. We have provided the planning, advice and resources that you will need to teach the lessons and tasks successfully. Of course any resource is only brought to life in the classroom by the skills and experience of the individual teacher. We hope that you will feel free to adapt and develop the work as you see fit. The lessons concentrate on the Process Skills of Scientific Enquiry (Sc1). Scientific Enquiry is more than just an area of the National Curriculum for Science. It is the means through which children progressively make sense of their science and test out newly discovered things and the ideas and theories that we teach. On the next page we have provided some insights into how each of the process skills of science progress. We hope you find this useful. 1
4 (2) Progression in science process skills Process skills describe the areas of scientific enquiry in which we want pupils to develop expertise, think and take decisions. Below we show some of the things children might do at KS2 and how these actions and abilities progress in KS3. Observation From.. Describing objects, phenomena and events in some detail. Understanding that human senses sometimes need assistance. Making repeated observations to check results. To.. Justifying why, and saying how, observations are made. Choosing appropriate aids to make observations. Beginning to link the quality and quantity of observations to concepts of evidence. Measurement From.. Making measurements of basic quantities (mass, length, time, volume, temperature). Choosing equipment suitable for the type of measure to be made. Reading major scale divisions. To.. Making repeated and accurate measures of basic and derived quantities (e.g. velocity/rate). Choosing the appropriate measuring range of a piece of equipment. Reading minor scale divisions. Predicting From.. Making a statement of expectation based on limited scientific reasoning. Giving some idea of the sequence, order or magnitude of events or effects. To.. Justifying predictions in terms of science ideas. Using evidence to give reasoned predictions of the sequence, order or magnitude of events or effects. 2
5 Planning From.. Identifying some effect factors and realising that one has to be changed whilst others are controlled. To.. Identifying most of the key factors that might have an effect. Selecting factors to control. Recording and communicating (using graphs) From.. Realising when line graphs and bar graphs should be used. Constructing graphs with some help. Beginning to decide on axes and scales for graphs. To.. Constructing line graphs. Choosing appropriate axes and scales for graphs. Interpreting evidence From.. Recognising simple trends and patterns in results. To.. Describing detailed patterns in results, e.g. changes over time. Evaluating evidence From.. To.. Knowing when some results don t fit the pattern and beginning to wonder why. Realising that single results might not occur again. Beginning to reflect on experimental design. Identifying and explaining anomalous results. Linking reliability of findings to the spread of readings. Linking reliability to experimental design where appropriate. 3
6 (3) How Scientific Enquiry Progression Tasks (SEPTs) are organised To help you appreciate the important lines of progression from KS2 tasks and lessons to KS3, we have provided an introduction for each of the four SEPTs that contains: An overview Position in teaching References Expected progression from KS2 to KS3 Links forward to KS3 Links back to KS2 This summarises what children are asked to do in each Key Stage. This suggests how SEPTs might fit with other teaching. These show how the work relates to the National Curriculum for Science and to the QCA schemes of work for KS2 and KS3. This sets out how the tasks progress children s process skills of scientific enquiry and their knowledge and understanding of science ideas. Here we suggest what teachers might say to children in KS2 to help link forward to work they might do in KS3. Here we suggest what teachers in KS3 might say to children to help them recognise achievements from KS2 and to make links to work they have done before without them seeing the work as merely repetition. The introduction is followed by: lesson plans, teachers notes and pupils materials for the KS2 and then for the KS3 lessons in each SEPT. The lesson plans for KS2 and KS3 are structured in the same way in each SEPT and contain: 1. The title of the lesson; 2. The objectives of the lesson. Written in easy to understand language eg. "This is what we will be learning today"; 3. Setting the scene. Short activities to introduce the work to be done and engage children in thinking about the relevant science and scientific processes; 4. Activities. A brief description of the main activities of the lesson; 5. Plenary. This part of the lesson allows children to consider what they have found out and to consolidate their new learning. Each lesson outline contains key questions to help you challenge and support children's work. These are referenced against the different sections of each lesson. 4
7 Teachers notes contain the following: Equipment and resources Health and safety Details of all the paper and equipment resources you will need. Suggested uses of ICT are also provided. Notes on any risks that should be taken account of. (Teachers must still carry out their own risk assessments before teaching any of these lessons). This section may not appear for some lessons where there are few, if any, potential hazards. Additional notes Background science Common misconceptions Follow-up work Advice on: the progress and sequence of teaching, differentiation, teacher interventions and work for SEN, etc. Brief notes on the important science relevant to the tasks. A summary of the most likely alternative ideas that children may have. Some children, of course, will have their own ideas not listed here! Some suggestions for activities that could be used to follow up or extend the work. Planning Posters Many teachers have found that using a series of post-it planning posters helps children to plan their investigations. They help pupils to identify key factors/variables in investigations that they should change, measure and control. Large posters (A1 size) can be pinned to the wall and used in whole class discussions. Mini versions can be used by pupils. Copies of these posters and notes about using them can be downloaded and printed from the CD. A Professional Development Unit on KS2/3 Transition on the AstraZeneca Science Teaching Trust s website contains a tutorial and worked example of how to use this method for teachers who may not be familiar with it - see: 5
8 The CD Electronic versions of all text and worksheets in this booklet can be found on the accompanying CD. Section 8 on page 77 gives full details on how to use it. SEPTs have PowerPoint slides that can be shown to classes. These contain animated and interactive versions of most of the resources for each SEPT. These are also supplied on the CD. The notes pages of each presentation give a little background for certain slides and show which ones can be used in KS2 and in KS3. 6
9 Scientific Enquiry Progression Tasks MOULDY OLD DOUGH Overview Activities require children to translate observed data from pictures (amount of mould) into numerical forms. In Key Stage 2 children do this by matching percentage cards with pictures showing various moulds growing on bread. In Key Stage 3 children choose a method to work out the numerical value for cover of a specific mould (Penecillium) growing on an agar plate. Children are asked in both Key Stages to select the appropriate type of graph to show the pattern of mould growth over time. Additionally, in Key Stage 3, children construct line graphs and respond to questions about growth rate. Key Stage 2 Key Stage 3 The lesson could take place mid-way through a unit of work (6B: Microorganisms). Alternatively activities could be used as part of a revision programme or as stand-alone, skills-related activities with some prior input on microbes. The lesson could take place early in a unit of work (e.g. 8C: Microbes and disease). The activities could also be used to address limiting factors to population growth (8D: Ecological relationships). NC KS2 PoS: Sc2 5f; Micro-organisms. Sc1, 2i,j; Communicating findings and considering evidence NC KS3 PoS: Sc2 5d; Population sizes and resources. Sc1, 2i-n; Communicating findings, considering evidence including anomalies. QCA unit: 6B: Micro-organisms. QCA units: 8C: Microbes and disease; 8D: Ecological relationships. Expected progression in process skills: At KS2 most children would be expected to: Expected progression in process skills: At KS3 most children would be expected to: Sequence pictures of mould growth and allocate percentage coverage to each Understand that some methods of presenting data are more suitable than others Match pattern statements with shapes of line graphs Convert pictorial evidence into numerical data Draw a line graph with suitable scale, axes and title Use a line graph to predict growth rates. Identify trends and explain an anomalous result Expected progression in science ideas: At KS2 most children would be expected to: Expected progression in science ideas: At KS3 most children would be expected to: Know that different moulds grow on bread over a period of time Realise that mould growth rate varies over time and that it is limited by resources 7
10 The KS2 teacher might: Links forward to KS3: Discuss with children that there are many ways to present results. In KS2 they have used one method to present mould growth as a percentage and have chosen the right graph to show data. In secondary school they will learn how microbes such as mould can be grown and measured more scientifically. The KS3 teacher might: Links back to KS2: Remind children that in their primary schools they were able to match mould growth with a percentage and began to make decisions about the most appropriate graphs to present data. Tell them that now they are in secondary school they will build on these skills to explore how microbes like mould can be independently grown on agar plates so that the rate of their growth can be studied and measured more accurately. 8
11 MOULDY OLD DOUGH KS2 Lesson Plan LEARNING OBJECTIVES Children should learn that: data can be presented in a variety of ways the same results can be presented pictorially and numerically some ways of presenting data are more appropriate than others SETTING THE SCENE Tell a story about finding a forgotten lunch box. What do children think the contents (a sandwich) might look like? Concept cartoon (sheet 1) showing a mouldy sandwich kept in a container used to elicit ideas about mould growth. ACTIVITIES The investigation of mould growth on bread is introduced. Groups then given sets of time-lapse images of bread decaying (Sheet 2). Children sequence images and discuss how photos might be given a numerical value. Whole class feedback. Key Questions What might happen to bread left for a long time? How did the mould get there? Which child do you agree with? Which picture do you think is Day 1/Day 6 etc? Timings 10 mins 40 mins If required groups are given percentage cards (see sheet 3) and asked to match each card to a photo. Children devise a table with a suitable title to present their data. How do you decide which percentage card matches each picture? Groups are given Sheet 4 showing graphing options and asked to choose an appropriate graph type to show mould growth over time. PLENARY Discuss which method of graphing is most suitable to display data on mould growth. After agreeing that a line graph offers more information and shows a pattern of mould growth over time, sheets (5&6) are used to get children to match different line graphs to pattern statements on rate of growth. Which is the best graph to show mould growth? Which pattern statement matches with which graph? 10 mins LEARNING OUTCOMES Sequence pictures of mould growth and allocate a percentage cover to each Devise a table of results with a suitable title Understand that some methods of presenting data are more suitable than others Match pattern statements with shapes of line graphs 9
12 MOULDY OLD DOUGH KS2 Teachers Notes EQUIPMENT AND RESOURCES Worksheets: Concept cartoon (sheet 1), presenting data sheet (sheet 4), line graph shapes (sheet 5), matching statements with line graph shapes (sheets 6). You may also need to provide a pre-drawn blank table for recording results for children with SEN. Cards: Series of mould images (sheet 2) these can be printed from the CD (in colour) and cut into cards; percentage cards (sheet 3). These cards can be laminated if desired. HEALTH AND SAFETY Advise children of the dangers of opening bags etc. containing mouldy food. Large amounts of fungal spores might be inhaled and some children might also have allergenic reactions to these. ADDITIONAL NOTES The story beginning the lesson concerns a lunch box found under a cloakroom bench. Children are invited to think what a sandwich in the lunchbox might look like. A concept cartoon (sheet 1) is used to elicit their ideas on where mould might come from (see misconceptions box on the next page) The teacher discusses how an experiment to investigate mould growth might be set up (drawing attention to safety and potential hazards of touching mould and breathing in large amounts of spores). Children are provided with pictures of mouldy bread which they sequence, showing how they think growth has occurred. Children should be encouraged to think of their own ways in which they could estimate the amount of mould that has grown on each piece of bread. To help them in doing this the teacher could provide cards representing percentages of each piece of bread covered by mould (see sheet 3 on page 14). Make sure that the picture and percentage cards are cut up and randomly sequenced before they are given to children. A number of options for presenting the results as a graph are discussed (sheet 4). Children should be encouraged to justify their choices. The lesson closes by asking children to match statements about the rate of growth of mould with some shapes of line graphs that show each of these patterns. This prepares them for their KS3 work. 10
13 BACKGROUND SCIENCE At both key stages children will learn that mould is a living organism (a fungus) and, as such, requires certain conditions to maintain growth: a supply of food, warmth, moisture. Mould grows when spores from the air, or from other contaminated food, land on bread and these spores germinate and grow according to conditions. Mould grows as a continuous sheet or mycelium. This means that the total cover (as a % of the area it grows on) can be used to measure growth. Most of the body of the mould is made up of tiny tubes or hyphae that grow through the bread sending out enzymes that digest it. What you see on the surface are really the spore bodies of the mould. Different types of mould have different colours, textures and shades of spore bodies. Sheet 4 is used to help children think about which type of graph would be best to show mould growth. This sheet helps children appreciate that: pie charts are a visual aid to show proportionality (e.g. method of transport to school); bar charts are useful for showing comparative numerical data (e.g. shoe size); line graphs are used to show continuous data and reveal relationships and patterns between variables, as in the case of mould growth. CHILDREN S COMMON MISCONCEPTIONS Children often think mould originates from the bread itself rather than from airborne spores landing on the bread and using it as a food source. Some children might think that an airtight container holds no air. FOLLOW UP WORK Children could read or find information about useful and non-useful microbes. 11


14 Sheet 1 Where did the mould come from? I think mould was in the bread to start with. I think mould came from the air. I think mould came from the plastic of the box. What do you think? 12


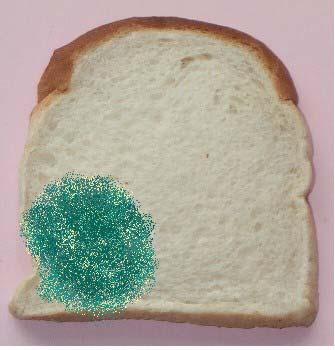
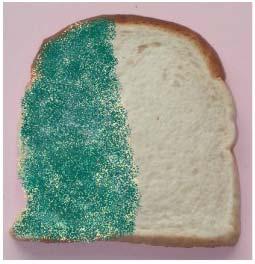
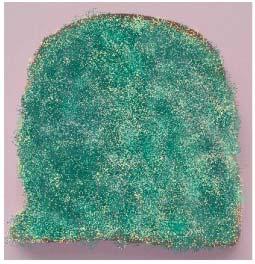
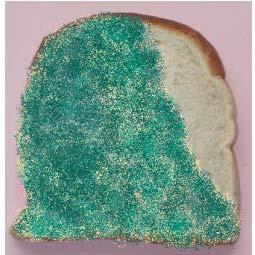
15 Sheet 2 Mould on bread cards 13
16 Sheet 3 Percentage Cards Less than 10% 25% 50% 75% Over 80% 100% 14
17 Sheet 4 Option 1 : Pie chart Growth of Mould on bread (Day) PRESENTING RESULTS 1. The scientists interpreting the results decide to present the data. Which of the following options do you think they should choose? 2. In your groups talk about how you might interpret the results from: Option 1- Pie chart Option 2 - Line graph Option 3 - Bar chart % of bread covered in mould Option 2 Line Graph Day Growth of Mould on bread % of bread covered in mould Option 3 Bar chart Growth of Mould on bread Day 3. Decide on the most useful way of presenting the data. Explain the reasons for your choice. 15
18 Sheet Growth Growth Days Days 3 4 Growth Growth Days Days 16
19 Sheet 6 A I think that nothing happens for a few days, and then the mould starts to grow steadily until it covers the bread. B I think that the mould grows at a steady rate right from the beginning but then stops when it has covered half the bread. I think the mould grows steadily from the beginning and covers the whole piece of bread. C D I think that the mould grows fast at first then slows down as it covers the whole of the bread. 17
20 MOULDY OLD DOUGH KS3 Lesson Plan LEARNING OBJECTIVES Children should learn to: convert qualitative into quantitative data choose the most appropriate method of graph presentation present information as line graphs and comment on patterns in data SETTING THE SCENE Remind children of KS2 context (mouldy sandwich in a lunch box). Show picture of different moulds growing on bread (OHT1). Children use a concept cartoon (sheet 1) to discuss and select predictions for rate of growth of one type of mould (Penecillium). Class discussion of how mould can be grown in a controlled way using an agar plate (OHT2). Key Questions Whose idea of mould growth do you agree with? How can mould growth be investigated in a scientific way? Timings 10 mins ACTIVITIES Groups are given time-lapse images of Penecillium mould grown on agar plates (sheet 2). They discuss and choose ways of recording growth numerically. The teacher can use acetate grids to help children record (sheet 3). Percentage cards can be used with SEN (sheet 4). Each child produces a table of results from the images. In groups, children discuss the best way to present data (sheet 4 from the KS2 can be used as support). Class discussion as to most appropriate method. Children generate a line graph, with correctly labelled axes and title (sheet 5). PLENARY Groups comment on graphs drawn and methods used. They reflect on their predictions using their line graphs. They respond to questions about the pattern of mould growth including an anomalous result (sheet 6). How can we record the amount of mould growth as a number? Which graph type is best to show the pattern of growth over 8 days? What is the pattern of mould growth over 8 days? How does this compare with your prediction? LEARNING OUTCOMES Convert pictorial evidence into numerical data Compile a table with a suitable title Draw a line graph with correct scale, labelled axes and suitable title Use a line graph to predict growth rates and identify trends 40 mins 10 mins 18
21 MOULDY OLD DOUGH KS3 Teachers Notes EQUIPMENT AND RESOURCES OHT: showing a colour picture of a piece of bread covered in mould (print out from CD or use as a PowerPoint slide). Slides of mould growing on bread and on agar plates can be found in the PowerPoint document on the CD. Worksheets: Concept cartoon (sheet 1), time-lapse images of agar plates (sheet 2), sheet to make acetates of overlay grids (sheet 3), % cards for SEN (sheet 4), graph blank (sheet 5), question sheet (sheet 6). ADDITIONAL NOTES The lesson opens with the teacher reminding children of the context used in KS2, a sandwich found in a forgotten lunchbox. A PowerPoint slide or colour OHT can be used to show a piece of bread covered in mould. Children are then asked if they think the different types (colours) of mould growing on bread might all grow at the same speed (rate) and how this might be investigated. The teacher explains how one of the moulds growing on bread (e.g. Penecillium) could be inoculated onto an agar plate and grown in controlled conditions. An agar plate (with mould growing on it) could be demonstrated or shown as a PowerPoint slide (OHT 2). The PowerPoint slides on the CD include a photograph of two types of Aspergillus mould growing on real Petri dishes. Children are shown a concept cartoon (sheet 1) to stimulate predictions as to the rate of mould growth on an agar plate over 8 days. They are then presented with pictures showing dishes with different amounts of a mould growing on them after each of 8 days. They are invited to think of ways in which the pictures of growth can be translated into numbers; e.g.: by estimating/guessing; by measuring the circumference, radius or diameter of the mould or by estimating area of growth using a grid. The teacher can intervene at this point giving out a packet containing an acetate grid to help children translate pictures of mould into a number. Children then estimate/measure the amount of mould at each day (as a number or percentage). Cards with different percentage values can be used to help children with SEN (sheet 4). Children tabulate results and then produce an appropriate graph choosing axes, scales etc. Children s sheet 4 from the KS2 lesson (see page 15) can be used to help children select the right type of graph and sheet 5 can be used to help them produce a graph if needed. The lesson is completed by asking children to reflect on the method chosen for data translation. They think about how accurate this was and whether different graph shapes resulted. They compare graph shapes with their predictions and respond to questions about growth rate of mould and explain why an anomalous result might have arisen (e.g. fluctuation in temperature, contamination of the plate with mould from the air). 19
22 BACKGROUND SCIENCE Moulds are fungi that often grow in concentric colonies when incubated on agar plates. Agar plates are made by pouring a sterile jelly, containing a nutrient broth, onto the base of a sterile Petri dish. Mould spores are transferred from a sample of mould onto the jelly surface of the plate using a sterilised inoculating loop. Mould growth rate is not uniform. The mycelium (body of the mould) spreads out across the plate quickly in the first few days and then growth slows down as nutrients from the jelly are used up and space becomes limited. Excretory products from the mould itself may also inhibit further growth. The graph below shows the typical pattern of growth that pupils might produce from the data available. MOULD GROWTH MOULD GROWTH DIAMETER CMS DAYS CHILDREN S COMMON MISCONCEPTIONS Many children believe that decay is brought about by something in the food itself rather than by micro-organisms. They often think that all micro-organisms, including those that bring about decay, are harmful. Children have difficulty in appreciating that decaying food is consumed by microbes as food, often thinking that material disappears into the ground or air. 20
23 OHT 1 Mouldy Bread 21

24 OHT 2 Mould on Petri dish 22

25 Sheet 1 How quickly does mould grow? I think the mould will grow the same amount each day. I think the mould will grow fastest in the first four days. I think the mould will grow a bit then stop and then grow a lot more. I think the mould will grow fast at first and then slow down. What do you think? 23
26 Sheet 2 Mould growth Day 1 Day 2 Day 3 Day 4 Day 5 Day 6 Day 7 Day 8 24
27 Sheet 3 25
28 Sheet 4 Percentage cards 10% 15% 30% 60% 75% 80% 80% 75% 26
29 Sheet 5 Graph showing mould growth over 8 days Amount of mould on dish Days 27
30 Sheet 6 Questions about the rate of mould growth 1. Describe the pattern of mould growth that your graph shows 2. Between which days was mould growth fastest? 3. Between which days was mould growth slowest? 4. Why did mould growth slow down in the last few days? 5. Look at the diagram below: This diagram shows the amount of mould growing on jelly in a dish on day 3 of a similar experiment. Measure the amount of mould on the jelly as you did before and add this result to your graph. 6. Explain why this result might have come about? 28
31 Scientific Enquiry Progression Tasks FINDING A SOLUTION Overview Tasks at both key Stages are concerned with dissolving. Children are asked to interpret evidence about a sweetener added to a new drink. The company is marketing a low calorie hot chocolate drink for teachers to make quickly and enjoy during a twenty-minute outdoor break duty. In Key Stage 2 children progressively construct a conclusion as to which sweetener is most suitable for the drink as they get more and better evidence. Key Stage 3 work builds on KS2 findings but challenges children to explain why the sweetener chosen at KS2 seems to leave solid behind as the drink cools. This helps them appreciate the concept of saturated solutions. Key Stage 2 Key Stage 3 Builds on Unit 4D: Solids, liquids and how they can be separated and Unit 5C: Gases around us. The task could appear in the final lesson of Unit 6C: More about dissolving and has links to Unit 6D: Reversible and irreversible changes. NC KS2 PoS: Sc 3, 3b; Solubility. Sc1, 2, f,h,i-n : Communicating findings, graph work. QCA Units: 6C More about dissolving Builds on Unit 7G: Particle model of solids, liquids and gases. This task could appear where teachers felt most appropriate in Unit 7H: Solutions, depending on the order of teaching. NC KS3 PoS: Sc3, 2b; Saturated solutions. Sc1, 2d,e,g-p: Communicating findings, graph work, considering and evaluating evidence. QCA Units: 7H Solutions Expected progression in process skills: At KS2 most children would be expected to: Interpret the evidence provided Begin to explain conclusions using scientific knowledge and understanding, i.e.: how temperature, stirring and size of particles affect the rate of dissolving Expected progression in science ideas: At KS2 most children would be expected to: Know that some substances dissolve better than others in a liquid That temperature, stirring and volume of liquid will affect how quickly a substance dissolves in a liquid Expected progression in process skills: At KS2 most children would be expected to: Use and interpret graphs to draw conclusions Explain, using scientific knowledge and understanding, about the solubility of different sweeteners and the concept of solutions becoming saturated, i.e.: which sweetener is now most suitable now for Trim Choc? Expected progression in science ideas: At KS3 most children would be expected to: Understand that there is a limit to the amount of solid that can dissolve in a given volume of liquid That this amount can be affected by temperature but that as a liquid cools excess amounts of solid will come out of solution 29
32 The KS2 teacher might: Links forward to KS3: At Key Stage 3, children will go on to learn about saturated solutions; that only a certain amount of solid will dissolve in a given volume of liquid at a certain temperature but that you can force more to dissolve at higher temperatures. In KS3 you might get a second letter from Fair Foods, asking you to interpret graphs showing solubility for various sweeteners and then to draw conclusions about the suitability of a chosen sweetener, explaining your reasoning. The KS3 teacher might: Links back to KS2: As part of their initial correspondence with Fair Foods children will have had experience of interpreting information from: photographs, text and tables and to help them construct conclusions and give explain which sweetener might be best to use in a new chocolate drink. 30
33 FINDING A SOLUTION KS2 Lesson Plan LEARNING OBJECTIVES Children should learn: to construct conclusions based on increasing amounts and types of evidence SETTING THE SCENE Elicit children s existing ideas about dissolving. Small groups discuss factors affecting dissolving. ACTIVITIES Discuss the use of sweeteners with children. Key Questions What can you tell me about dissolving? How can we speed up dissolving? What types of sweeteners have you come across? Timings 10 mins 40 mins Show copy of letter from Fair Foods on an OHP or as a PowerPoint slide. Class decide what factors would be varied, measured and controlled to test solubility of sweeteners. How would you test which sweetener is easiest to dissolve? In pairs, children look at the photographs of sweeteners (sheet 1) and examine particle size of related samples. Children write first stage of conclusion (really a prediction at this stage) based on this evidence only (see pages 37/38 for differentiated writing frames). What do you notice about the particle size of the different sweeteners? Will this make a difference to how quickly they dissolve? Children (in pairs) look at Table 1 (sheet 2) and compare the amount of sweetener that dissolved and write the second stage of their conclusion based on this evidence. Children now look at Table 2 (sheet 2) and examine how long each drink needs stirring before it is dissolved. Children write third stage of conclusion based on this evidence. Which temperature did you choose? Why did you choose this one? Why might 100 C or 50 C be inappropriate temperatures for the drink? Which stirring time did you choose? Why? PLENARY Children consider all of the evidence and decide which sweetener is most suitable for the Trim Choc drink and justify their final answer. Which sweetener is most suitable for this drink? What are the reasons for your choice? 10 mins LEARNING OUTCOMES Identify a range of factors which might affect how quickly a solid dissolves Identify factors to change, measure and keep the same Make reasoned decisions based on evidence about which sweetener to choose 31
34 FINDING A SOLUTION EQUIPMENT/RESOURCES KS2: KS2 Teachers Notes Copy of letter to Primary School Research Team (plus copy on OHT see page 34) Samples of sweeteners labelled with the names of the three sweeteners against each sample. You could use: A caster or icing sugar, B Demerara sugar, C sea salt crystals. Copies of pictures / photographs of the three sweeteners see sheet 1, page 35 Copies of Tables 1 and 2 (plus copies on OHT) see sheet 2, page 36 Copies of differentiated writing frames for writing conclusions see pages 37/38 HEALTH AND SAFETY Children should not taste any of the sweeteners or drink samples (if provided). ADDITIONAL NOTES It is important that the children receive and interpret each piece of evidence (sheet 1 and tables 1 & 2 on sheet 2) at separate intervals throughout the lesson. They should write each section of their conclusion before receiving the next piece of information. Post-it planning posters could be used to prompt whole-class discussions about the factors that affect dissolving (see page 5 these are also available on the CD) When looking at the pictures (on sheet 1) children will need to focus on particle size rather than sweetener names. They should realise that A has the smallest particles, therefore, they will dissolve quickest. However, sweetener B should not be discounted as the particle size is still rather small. When reading Table 1, guide children to notice that 100 C is an unsuitable temperature for the drink because it is unsafe and too hot. Likewise 50 C will be too cold for a nice taste. Focus on 75 C and see that a greater amount of sweetener B dissolves at this temperature, although this is only 2g more than for sweetener A (29g). When reading Table 2, guide children to notice that 10 min. stirring would be inappropriate. We would want a sweetener that dissolves ASAP. After 0 min. stirring, 5g OF BOTH sweeteners A and B have dissolved, so now we need to look at 1 min. stirring to see that all 25g of B has dissolved (compared to 11g of A). Therefore, sweetener B is most suitable overall. Differentiated writing frames are provided. There is one for children working at the expected level for this work (page 37), and one to guide those children working below the expected level (page 38). More able children are given no writing frame and are expected to structure their conclusions without additional guidance. 32
35 BACKGROUND KNOWLEDGE Children should know that some solids dissolve in water and others do not. They should know some of the factors that might help solids to dissolve more quickly in water, e.g.: higher temperature, smaller particle size, greater volume of water, increased stirring. Children should also be familiar with how to select and interpret information from given texts, pictures and tables and should begin to use these to draw thoughtful and informed conclusions. CHILDREN S COMMON MISCONCEPTIONS Many children confuse dissolving with melting, particularly where hot liquids are involved Children often think that dissolved solid is no longer present in a solution and so solutions have less mass than the liquid and added solute that you started with. Occasionally children think that solid presses down on the bottom of a solution and so its weight is greater than at the beginning. FOLLOW UP WORK Children might go on to carry out a similar investigation of solubility themselves. 33
36 First for Thirst Fair Foods, Hot Drinks Department, Pannal House, Aidan s Road, Western Park. Dear Primary School Research Team, We are writing to you in the hope that you can help our Drinks Department. Our company, First for Thirst, is developing a new hot chocolate drink for teachers to enjoy when they are on their break-time playground duty. Our new drink is made with a pre-prepared powder to which you add hot water and stir. Our feedback from teachers suggests that the drink should be low in calories so we have developed three new sweeteners to use in place of sugar. We tested the sweeteners and would be very grateful for your help in looking at our results. We would like you to advise us on which sweetener is most suitable to use in the drink. There are a number of factors that you must consider very carefully: The drink should be made quickly so that the teacher can go outside immediately. The drink cannot be made with boiling water for safety reasons. We recommend o the water temperature to be approximately 75P PC. The drink must require a minimum amount of stirring so that the teacher can concentrate on supervising the children. Please write back to us to tell us what you find out and advise us on the best action to take. Yours truly, Jack Adamson Product Manager 34


37 Sheet 1 Three types of sweeteners Slimstitute Low n Lite SweetTreat Sweetener A Sweetener B Sweetener C Very fine powder Small crystals Lumps of sweetener 35
38 Sheet 2 Information from Fair Foods: testing of Trim Choc Our experts carried out tests to see how much of each sweetener dissolved at different temperatures. Table 1 Amount of sweetener dissolving in 200ml water Sweetener A (Slimstitute) B (Low n Lite) C (Sweet Treat) C 75 0 C 50 0 C 32 g 29 g 25 g 65 g 31 g 19 g 25 g 21 g 18 g Our experts took 25g of each sample, added 200ml of hot water and observed how many grams had dissolved when stirring for different lengths of time. Table 2 Amount of each sweetener dissolving after different amounts of stirring Time of stirring (min.) A 5 g 11 g 25 g B 5 g 25 g 25 g C 2 g 15 g 20 g 36
39 Sheet 3 Writing conclusions Look at the picture card (sheet 1) The most suitable sweetener(s) based on size (powder, crystals, lumps) is: I think this is because: Look at Table 1 on sheet 2 The most suitable sweetener based on the amount that dissolves at a safe temperature is: I think this because: Look at Table 2 on sheet 2 The most suitable sweetener based on the amount of stirring needed is: I think this because: Based on my findings, I recommend that First for Thirst use sweetener in the final drink. 37
40 Sheet 4 Writing conclusions Size: From the pictures I found that Sweetener is best for the drink. I think this because it has sized lumps and this helps it to dissolve more slowly / quickly*. Dissolving at 75 o C: After looking at Table 1, I did not choose 100 o C because: I did not choose 50 o C because: g of my chosen sweetener dissolved at 75 o C and this was more / less* than the other sweeteners. I think Sweetener is best for the drink. Stirring: Then I looked at Table 2. After 1 minute of stirring, sweetener had dissolved the most. I did not choose 10 minutes of stirring because: I think Sweetener is best for the drink. Based on my findings, I recommend that First for Thirst use Sweetener in the final drink. (*delete one of these) 38
41 FINDING A SOLUTION KS3 Lesson Plan LEARNING OBJECTIVES Children should learn: That conclusions can be changed when more is known To interpret information from graphs of solubility To communicate understanding of saturated solutions by writing a letter SETTING THE SCENE Remind children of previous work at KS2 on the best sweetener to use for the Trim Choc drink. ACTIVITIES Elicit pupils ideas about solubility. Key Questions Which sweetener did you chose for the Trim Choc drink? Why? What affects dissolving of sweeteners? Timings 10 mins 25 mins Present pairs of children with line graphs showing solubility of the three sweeteners tested at KS2 (see page 43). Focus the class on the change in o solubility between P PC. Get class to identify which sweetener shows the smallest change in solubility as temperature increases from 50 O 75P PC. Children discuss in pairs or groups how the problem posed in the letter might be solved. Encourage them to work out how much of this sweetener will remain in the solution o at 50 P PC and then to consider how much additional mass of sweetener B is in o solution at 100 P PC. Children identify the most suitable sweetener based on the new information provided. Discuss why they did not choose that sweetener the first time. What happens to the solubility o of sweetener B between 50P PC o and 75P PC? Which sweetener shows the smallest change in solubility with temperature? Think back to the problems of stirring. What new information has the company provided you with? How much extra of sweetener B dissolves in the drink between o 50 and 100P PC? What might happens to the extra amount as the drink cools down? PLENARY Children write a letter to the drinks company justifying their final recommendation. They read out their letters and ask questions of each other What is the final reason for your new choice of sweetener? 25 mins LEARNING OUTCOMES Reconsider advice to the drinks company in the light of new evidence Explain the appearance of solids as a drink cools Explain what is meant by a saturated solution 39
42 FINDING A SOLUTION KS3 Teachers Notes EQUIPMENT AND RESOURCES Copy of letter for Secondary School Research Team (see page 42). Samples of sweeteners labelled A,B and C. The following could be used to represent these: A caster or icing sugar, B Demerara sugar, C sea salt crystals. Sample of powdered chocolate drink, labelled Trim Choc. (This is optional but it may be helpful for some children to see). Coloured copies of the graph (one for each pair) see page 43. Rulers so that children can read data points from the graph accurately. Photocopies of school notepaper for writing a response to the drinks company (one for each pupil) or you could use a writing frame for a letter such as the one provided on page 45. Writing frame for writing conclusions (see page 44) HEALTH AND SAFETY Children should not taste any of the sweeteners or drink samples. ADDITIONAL NOTES A writing frame is included for use with children working towards the expected level at KS3 (see page 44). Teachers may wish to spend some time exploring children s existing ideas and their experiences and knowledge gained from KS2. This is especially necessary if it has been some time since children have done any work on dissolving. All children should be encouraged to use a ruler to help them read the graph. The slide sequence in PowerPoint allows the teacher to help children to consider key information on the graphs as ruler guides appear against solubility curves for the three sweeteners. An important outcome of this lesson is the letter that forms the response to the drinks company and so 25mins has been allocated to this activity. As many children find letter writing a challenge, a sample letter format was used in the trial and teachers may wish to show an example of this (see page 45). It may add interest to use school-headed notepaper for this task. A PowerPoint presentation is available on the CD. The slide sequence will help children to focus on the appropriate areas of the graph and to allow them to review their findings and learning from KS2. 40
43 BACKGROUND SCIENCE Children should know that there is a limit to the amount of a solid that dissolves in a particular volume of water at a particular temperature, i.e.: the point at which a solution can be said to be saturated. If the temperature of the solution is raised, then more of the solute will be dissolved in the solvent, but as temperature falls again the excess solid that has dissolved beyond the point of saturation will accumulate as solid again. This principle is used in growing crystals where excess mass of a substance, e.g. copper II sulphate, is added to an already saturated solution to make it supersaturated. A seed crystal is then added around which molecules of the copper sulphate come out of solution to grow onto the seed and therefore make it grow into a larger crystal. CHILDREN S COMMON MISCONCEPTIONS Many children may confuse dissolving with melting particularly where hot liquids are involved Children often think that dissolved solid is no longer present in a solution and so solutions have less mass than the liquid and added solute that you started with. Occasionally children think that solid presses down on the bottom of a solution and so its weight is greater than at the beginning. FOLLOW UP WORK Children could progress to investigating the differences in solubility of solutes in different solvents, e.g.: would Trim Choc dissolve in the same way in other liquids, such as milk? 41
44 First for Thirst Fair Foods, Hot Drinks Department, Pannal House, Aidan s Road, Western Park. Dear Secondary School Research Team, Thank-you for the reports you sent from your primary school. We were particularly interested to read your conclusion that sweetener B was the most suitable sugar substitute to use in our Trim Choc drink. Since receiving your advice, we are pleased to report that our engineers were able to adjust the design of the dispensing machine so that it pre-mixes the drink, therefore eliminating the need for stirring. You may have heard of the success of Trim Choc. The drink has been a very popular choice with teachers throughout Yorkshire. However, recent feedback has shown that there are problems when teachers go outside. Small particles of sweetener appear around the rim of the cup and solid material is left at the bottom of the cup when they have finished drinking. We would like you to investigate this further and advise us, once again, on which sweetener is most suitable to use in the Trim Choc drink. We have provided you with a graph showing results of some more tests we carried out. We would like to remind you that, once again, we have used 25g of sweetener in our trials. We look forward to receiving your letter of reply. Yours truly, Jack Adamson Product Manager 42
45 The Solubility of the three sweeteners at different temperatures 70 Solubility of sweeteners A, B and C in water Mass of sweetener dissolving (g) Temperature 0 C = Sweetener A = Sweetener B = Sweetener C 43
46 Sheet 1 Writing Conclusions There are g of sweetener B in the drink when it is made at 75 0 C. From the graph, I can see that g of sweetener B will dissolve at this temperature. This means that all /some/ none *of the sweetener will dissolve when the drink is made. * delete as required When the teachers go out into the playground the drink will From the graph I can see that at 50 0 C g, of sweetener B has dissolved in the drink. From the graph I can see that at C a further g. of sweetener B will be dissolved in the drink I think this will mean that as the drink cools down I think the teachers are finding sweetener particles on the rim of their cup because The most suitable sweetener to use is This is because I recommend that Fair Foods Ltd use Sweetener in Trim Choc. 44
47 Dear Mr. Adamson, Thank you for inviting our class to take part in the Trim Choc Challenge. I think that you are finding small particles of sweetener around the rim of the drink cup because This will mean that. I would suggest you use sweetener instead. This sweetener 45
48 Scientific Enquiry Progression Tasks LIGHTING UP Overview These lessons are designed to give children an opportunity to develop and discuss their planning and predictions. At KS2 children are invited to solve the problem of lighting in a shop window by exploring the type and nature of material needed to make a circuit that lights a bulb. In Key Stage 3 their ideas are explored using measures of current and explained in terms of electron flow. Key Stage 2 Key Stage 3 The lesson could be used after children have had an opportunity to construct simple circuits and to explore the difference between insulators and conductors. The lesson could be taught after a model of electron flow has been introduced and ammeters have been used to measure current. NC PoS: Sc4, 1b; 1c: Changing a circuit to make bulbs dimmer or brighter. Representing circuits using symbols. Sc1, 2a-l: Planning and making predictions, obtaining and evaluating evidence. NC PoS: Sc4, 1a; 1b; 1c: Factors affecting current. Energy transfers from the battery. Sc1, 2a-n: Planning and making predictions, obtaining and evaluating evidence, providing reasoned scientific explanations. QCA unit: 6G: Changing circuits QCA unit: 7J: Electrical circuits Expected progression in process skills: At KS2 most children would be expected to: Expected progression in process skills: At KS3 most children would be expected to: Predict which materials conduct electricity Group materials in terms of their effects on bulb brightness Predict that shorter wires will make bulbs brighter Predict that shorter /thicker wires will make bulbs brighter Explain how the length or thickness of the wire affects current flow Expected progression in science ideas: At KS2 most children would be expected to: Expected progression in science ideas: At KS3 most children would be expected to: Test materials using a complete circuit Sort materials into conductors and insulators of electricity Describe how changing wires affects the brightness of bulbs Describe that some wires are good conductors and let electricity/electrons flow Measure flow of electricity (current) using an ammeter 46
49 The KS2 teacher might: Links back to KS1: During KS1 children will have made simple predictions based on past experiences and basic ideas about electricity. The teacher reminds children that they may have made complete circuits in KS1. The teacher asks children to draw a complete circuit to revise these ideas. Links forward to KS3: In this activity children will have developed their predictions drawing on generalisations and patterns they have experienced. In KS3 children will move on to use new science ideas and knowledge when predicting and planning. The teacher tells children that when they are in KS3 they will learn how to measure electrical flow, and what electricity is. The KS3 teacher might: Links back to KS2: The teacher reminds children that they may know that all metals conduct electricity, and that the length of a wire can affect the brightness of bulbs. The teacher then uses questions (e.g., on OHT/ individual worksheets/whiteboard responses), showing different circuits, as a starter activity to revise this knowledge and children s experiences. 47
50 LIGHTING UP KS2 Lesson Plan LEARNING OBJECTIVES Children should learn: To make predictions To plan how to test ideas about what affects the brightness of bulbs SETTING THE SCENE A battery and bulb are drawn on the board and children asked to draw wires to make a complete circuit. Teacher shows class a complete circuit. Children read the letter from Mr Phil Ament (see page 52). Key Questions How can we make a bulb light? What is the shopkeeper asking you to do? Times 10 mins ACTIVITIES Children use a concept cartoon to discuss factors affecting bulb brightness: type, length and thickness of materials (not voltage,i.e.: no. of batteries, as Phil s mains voltage cannot be changed). Children work in small groups to plan their investigations and so that they can select appropriate equipment (Post-it planning posters or a planning sheet may be used see page 5 and CD). Make sure children s ideas have sufficient challenge. Children predict what they think will happen giving a science idea if possible. They write a draft or text to Mr Ament. Teacher collates predictions, factors selected and reasons on OHT or whiteboard. Children carry out their investigations. Who do you agree with? Why? What factors affect how bright a bulb might be? What question will you investigate? What will you change and measure What will you keep the same? What equipment and materials will you need? What do you think will happen? Why? 40 mins PLENARY Children review their predictions, in the light of their findings and discuss which predictions are best and any difficulties they encountered. They redraft their s or text messages to Mr. Ament. Was your prediction correct? What do you think now? What would you investigate next? 10 mins LEARNING OUTCOMES Predict which materials conduct electricity Group materials in terms of their effect on the brightness of the bulb Test materials using a complete circuit Describe how changing wires affects the brightness of bulbs 48
51 LIGHTING UP KS2 Teachers notes EQUIPMENT AND RESOURCES Equipment 2.5V bulbs, 1.5V batteries, battery holders, connecting wires for each group, some with plugs, some with crocodile clips. Access to a metre rule, wire cutters. Tray of materials to contain: wood, paper, straw, plastic covering from a wire, insulated wire with plastic covering not stripped back, wire with plastic removed, ideally the same length (50cm). If children choose to investigate length of wire and use copper wire they will see very little difference. Instead, use Constantan resistance wire (suggested 125 g wire SWG 28, lengths of 40, 60, 80 and 100cm). Your local secondary school might lend you some. Paper resources: Phil s letter (see page 53), concept cartoon (see page 54) planning sheets (optional see page 55). SAFETY Bulbs and wires can get hot. Children should be warned not to touch them. ADDITIONAL NOTES The lesson starts with the teacher drawing a bulb and battery on the board, inviting a child to add wires to make a complete circuit. In the trails we found that most children could do this if the bulb was drawn in a bulb holder showing two distinct connections rather than a bulb without its holder. Few children seemed to appreciate that a bulb has two connections on it, each of which must be connected to a different terminal of the battery. In the ensuing demonstration, the teacher shows the class how a complete circuit can be constructed using a 1.5V battery, two wires and a bulb (in a holder). Teacher intervention is needed DURING the planning stage to ensure that groups select a suitable factor that might affect bulb brightness (QCA recommends using the term factors at KS2 and variables at KS3). Post-it planning posters could be used to prompt whole-class discussions about the factors involved (see page 5 these are also available on the CD) 49
52 ADDITIONAL NOTES (continued) Although the thickness of a material might be suggested as a factor it is unlikely that primary schools will have enough wires of different thicknesses of the same metal unless these can be borrowed from the secondary school. Ask questions such as: What will you test? ; What materials and equipment will you use? ; How many will you use? This will encourage children to select appropriate equipment and a suitable range of values to test especially if they are investigating the length of wire. Similarly, when groups discuss their predictions, questions such as: Which one do you think will make the bulb the brightest? ; What do you (another pupil) think? ; Do you all agree?, could be asked. Finally, ask children to suggest a scientific reason for their predictions, using similar prompts. NB: In this investigation children should build series circuits. The lesson can be extended using a card sort activity that encourages children to consider a number of possible solutions to Phil Ament s problem, linking these with scientific reasoning. This activity is provided on page
53 CHILDREN S COMMON MISCONCEPTIONS Children might think that putting a bit of plastic in a circuit reduces the flow of current. In fact, good insulators like plastic prevent a complete circuit because no electricity (current) can flow. Children might think that long wires can hold more electricity, whereas, in fact it is harder for the electricity to flow through longer wires and the bulbs will be dimmer. See background science, below, for a fuller explanation. BACKGROUND SCIENCE For electricity to flow along a material the electrons in it must be able to flow freely. In non-metals, electrons cannot move around so electricity cannot flow. They are called insulators. In metals, electrons can move around and so electricity can flow along them. They are called conductors. As electrons flow around a conductor they collide with other particles (atoms). In longer (and thinner) wires there are more collisions thus reducing the flow of electrons and so the energy delivered to bulbs. The bulbs will be dimmer. This is what we call resistance. FOLLOW UP WORK To extend or follow up this lesson, children apply what they have learnt to a new problem. Tell them that a pet shop wants to make their lighting dimmer. The teacher asks children to think about this. A card sort exercise has been developed to help them (see page 55). Cards are provided in sets of three, and this key should be used. I think I could because the reason is (red cards) (yellow cards) (purple cards) The originals of the cards are matched correctly in the teachers version but should be cut up prior to use. It might help if the cards in each column are printed on different coloured card, so that a red, a yellow and a purple card form a set of three. You can adjust your print-out from resources on the CD to make this easier. After the card sort, discuss with pupils which option would be the most practical for the pet shop to use. 51
54 Videos R Us High Street philament@vidrus.com.uk mobile: Dear Primary School I am writing to ask for your help! Business is poor. I think this is because my shop front is not bright enough. Customers can t see the videos and DVDs for rent. I have bought some new lights for the window. I have a cupboard of different materials but I don t have the skills or time to test them out. Please could you suggest the best way for me to light up my shop front? Thanks and best wishes Phil Ament Phil Ament 52
55 What makes a bulb bright? I think it depends on how many bulbs you use I think it depends on the type of material you use I think it depends on how long the material is I think it depends on how thick the material is What do you think? 53
56 Names of people in your group: Lighting Up - Planning Sheet Which factor is your group going to change? Draw a circuit diagram to show what you are going to do. What will you measure or observe to find out which material is best? What will you keep the same to make this a fair test? PREDICTION What do you think you will find out? What are reasons for your prediction? 54
57 Teachers resource sheet. Post-investigation card sort. In a pet shop some lights need to be dimmer. What must you do to get this to happen? Children have to match three different coloured cards. Ask them to decide which action will make bulbs dimmer and which is the most practical one for the pet shop to use. RED CARDS YELLOW CARDS PURPLE CARDS (I think I could..) (because..) (the reason is..) Make the wire out of plastic Plastic doesn t conduct electricity It is an insulator Use rusty metal Rust cuts down the amount of electricity which flows This stops electricity flowing along the surface of a wire Make the wire longer It is harder for the electricity to flow As more electricity is changed to heat Add more bulbs in a line They will all be dim As the electricity is shared between the bulbs Use a metal wire Metals conduct electricity Electricity can flow through metals 55
58 LIGHTING UP KS3 Lesson Plan LEARNING OBJECTIVES Children should learn: To apply their knowledge of electron flow to explain predictions about what affects the brightness of bulbs (and current in a circuit ) SETTING THE SCENE Children draw a complete circuit with: 2 bulbs, one battery and a switch using symbols (on whiteboards). Ask them to draw an ammeter in the circuit. Remind them that an ammeter measures flow of electricity. Show children the from Mr. Ament (see page 59) wanting to know more detail about how to make his shop front lights brighter. ACTIVITIES Children look at the concept cartoon outlining possible variables and discuss (see page 60). Possible variables include: number of bulbs, number of batteries, length and thickness of wires. Children work in small groups to develop a plan of what to test and measure and to give them enough information to select equipment required (Use post-it planning posters or page 61). Make sure their ideas have sufficient challenge. Children predict how the current and brightness will change giving a scientific explanation and draft an or text message to Mr Ament. Children carry out their investigations. PLENARY Each group reports back their findings, including tables or graphs of results and any difficulties encountered. Key Questions What is the symbol for a bulb or battery? What does an ammeter measure? What unit is current measured in? What does Mr Ament want to know? 56 Who do you agree with? Why? What question do you plan to investigate? What are you going to change? What are you going to measure? How will you record your results? What do you think will happen? Why do you think this will happen? Was your prediction correct? What did you find out? How can your prediction be explained in terms of flow of electricity (electrons)? LEARNING OUTCOMES Predict that shorter /thicker wires will make the bulb brighter Predict how the length or thickness of the wire affects current flow Explain predictions in terms of electron flow Measure flow of electricity (current) using an ammeter Timings 10 mins 40 mins 10 mins
59 LIGHTING UP KS3 Teachers notes EQUIPMENT AND RESOURCES Equipment 2.5V bulbs, 1.5V batteries, battery holders, ammeter, switch, connecting wires for each group. If children choose to investigate length of wire and use copper wire they will see very little difference. Instead, use Constantan resistance wire (suggested 125 g wire SWG 28, lengths of 40, 60, 80 and 100cm). If children choose to investigate thickness of wire: the higher the SWG (Standard Wire Gauge) number, the THINNER the wire so provide a range above and below SWG 28. Access to a metre rule, wire cutters. Worksheets Phil s letter (see page 59), concept cartoon (see page 60), planning sheet (see page 61). ADDITIONAL NOTES Remind children how to connect an ammeter into a circuit to measure current. The ammeter should be connected in series, i.e., as part of the circuit. Children will need to be reminded that the positive terminal on the ammeter must be connected so that it can be traced back to the positive terminal on the battery or else it will record a negative value. If analogue ammeters are used, children may need help in reading the scale. Use the from Mr Phil Ament to remind children of their findings from KS2, e.g.: that only metals (and carbon) can conduct electricity and that the thickness and length of material might affect bulb brightness. What Mr Ament now requires is to know more about these variables, e.g. how much wire should be used and/or what thickness and to learn more about the science of what is happening. The concept cartoon (page 60) is used to stimulate thinking as a prelude to children producing their own predictions. After discussion of the concept cartoon, the teacher will need to eliminate the type of circuit and type of material as variables that will be tested. Tell them that Phil is using a series circuit and that type of material was explored in KS2. Teacher intervention may be needed during the planning phase to ensure that children choose a suitable variable over a reasonable range. Ask groups questions like How many batteries or bulbs will you use?, What lengths or thicknesses of wire will you choose, How many tests will you carry out so that you can look for a pattern in your results? Ask pupils to construct their own results table independent variable in first column, dependent variable in second column. Some groups may have time to prepare their feedback to the rest of the class encourage them to draw a graph of results (e.g. of current measured against length varied). They could do this as a quick draft version, e.g. on sugar paper. The teacher should monitor groups so that their scientific explanations can be discussed. 57
60 PUPILS COMMON MISCONCEPTIONS Children often think that electrons set off from the battery around the circuit when the circuit is complete, whereas, electrons are already present in the metal atoms in the wires. When the circuit is complete, charged electrons flow everywhere at once. What the battery does is provide the energy to make them flow. Children often think that current /electricity flows from the battery, but stops when it has lit the bulb. In fact the number of electrons is always the same in the circuit. As one leaves the battery, one enters. Children often think that long wires hold more electricity than short ones. In fact, more collisions take place in a longer wire (especially if it has high resistance). This means that electron flow is reduced, so less current flows, and carries less energy. Long and thin wires have more resistance to flow. See background science notes on the next page. BACKGROUND SCIENCE HOW ELECTRICITY FLOWS a brief guide for nonspecialists Current is the flow of electrons around a circuit. A common misconception is that there are no electrons in a metal wire before the battery is connected they are present, but not flowing. In metal atoms (e.g. in a wire) free electrons (not tied into the structure of atoms) are always present, but do not move much until a potential difference or voltage is applied, e.g. by a battery. In a complete circuit, as the battery pushes more electrons in, the free electrons in the conductor (wire) start moving all at the same time and in all parts of the circuit. For each electron that leaves the battery, one returns, so in a series circuit the current is the same everywhere. Current is measured using an ammeter, which measures the flow of electrons in a certain time and at a certain place in the circuit. The battery transfers energy (from chemical reactions within it) to electrons in the circuit. Moving electrons hit metal atoms on their way around a circuit and some of these hit atoms gain energy. This heats them up. More of these collisions will happen where the electrons find it harder to pass, e.g. at bulbs which have more resistance to flow. In the bulb this energy is transferred as heat and light in the thin wire that makes up the filament of the bulb. The filament of the bulb gets hot enough to glow therefore some of the energy is transferred as light. This resistance also reduces the amount of current able to flow, hence reducing the energy, which can be delivered. Longer wires (and thinner wires) have more resistance, so more collisions happen, reducing current and therefore the energy transferred in bulbs. FOLLOW UP WORK Would Phil be better using a parallel circuit? Children could be asked to compare series and parallel circuits for Phil s shop lights and to list the advantages and disadvantages of each type of circuit. In parallel circuits bulbs are brighter but they drain the battery more quickly as the total energy to maintain an increased flow of electrons has to be maintained. 58
61 To: high.n-yorks.sch.uk From: Subject: Video shop window lights Dear Secondary School I am writing to ask for your help! Business is poor. I think this is because my shop front is not bright enough and my customers can t see the new videos and DVDs for rent. I bought some new lights for the window and I d like to know the best way to make them bright. Last year, some children from the local primary school recommended what I should use. I thought that you might be able to investigate this further and provide more detailed information about this. Please could you suggest the best way for me to light up my shop. I would also like you to explain what you suggest as I d like to learn more about how electricity flows. Thanks and best wishes Phil Ament Phil Ament 59
62 What affects the current in a circuit? I think it depends on the number of bulbs. I think it depends on the thickness of the wire. I think it depends on the type of circuit. I think it depends on the length of the wire. What do you think? 60
63 LIGHTING UP Planning Sheet Which variable is your group going to change? (This is the independent variable) Draw a circuit diagram to show what you are going to do What will you measure or observe to find out which is best? (This is the dependent variable) What will you keep the same to make this a fair test? PREDICTION What do you think you will find out? What are reasons for your predictions? 61
64 Scientific Enquiry Progression Tasks STRETCHY THINGS Overview In KS2 children carry out an investigation to develop basic skills of measuring and recording. A practical activity explores the extension of an elastic band when various forces are applied to it using a force meter. In KS3 children compare how an elastic band and spring stretch. They predict and explain the shape of line graphs that they have produced. Key Stage 2 Key Stage 3 The lesson could take place after children have used force meters and have met vocabulary associated with forces. The lesson could be taught as part of work on stretching materials with reference to elastic or plastic stretching points or as part of a topic on forces. Children could go on to develop and apply their learning in an investigation of bungee ropes. NC KS2 PoS: Sc4, 2e: Direction and measurement of forces. Sc1, 2c-h: Planning investigations, measuring and communicating findings. NC KS3 PoS: Sc4, 2b.:Weight is force due to gravity. Sc1, 2f-n: Planning investigations, obtaining and considering evidence. QCA Units: 6E Forces in action. QCA Units: 7K Forces and their effects. Expected progression in process skills: At KS2 most children would be expected to: Expected progression in process skills: At KS3 most children would be expected to: Know that forces are measured in Newtons (N) Measure accurately in Newtons and cms Draw a graph using given axes Explain the shape of a graph they have drawn Interpret information from their graphs Draw a line graph and make predictions from it Explain the shape of a graph Explain patterns from graphs using science ideas Expected progression in science ideas: At KS2 most children would be expected to: Expected progression in science ideas: At KS3 most children would be expected to: Explain that the stretch of an elastic band depends on the amount of force acting on it Describe how force affects elastic materials Explain the term elastic limit 62
65 The KS2 teacher might: Links forward to KS3: Use the OHT or slide equipment (KS3 sheet 1 page 67) to link primary work to what children can expect at secondary school. Describe how children will continue to develop their measuring and graph skills. Explain that the Key Stage 2 lesson is about elastic bands. At Key Stage 3 children will find out about how other materials stretch. The KS3 teacher might: Links back to KS2: Refer back to when children investigated the stretch of an elastic band at KS2 and how important it was to measure accurately and plot a graph. Remind children that weight is the force due to gravity on an object. Relate the set up of KS3 equipment to the KS2 lesson and tell children they are going to explore further what happens when you stretch another elastic material (this time a spring made of metal). 63
66 STRETCHY THINGS KS2 Lesson Plan LEARNING OBJECTIVES Children should learn to: make accurate measurements of length draw and interpret line graphs SETTING THE SCENE Teacher and children explore how the stretch of an elastic band might be investigated. Introduce the idea of forces as large and small pulls. Re-introduce children to force meters, if they have already used these. Key Questions Are some elastic bands stretchier than others? How could you measure which band is stretchiest? Which force meter should you use? Timings 10 mins ACTIVITIES Divide students into groups of 3/4. Give each group: an elastic band (approx 6 8 cm in length), a 1-10 N. force meter, a metre ruler or tape and a worksheet (Stretching Elastic Bands sheet 1). Demonstrate how to use and read the force meter. Groups collect results and draw line graphs. (Use sheet 3: some pupils will need help to construct the scales for the axes). How will you change the amount of force each time? What will you keep the same each time? How will you measure and record the length of the elastic band? 30 mins PLENARY Come back together as a class and compare results for 1 particular force e.g. 6 Newtons. Give pupils a few minutes to discuss in groups and write down the pattern of their results. Take feedback and exemplarise a good conclusion statement, e.g. the greatueru the force the longueru the elastic band stretches. Why did different groups get different lengths for the same force? What happens to the elastic band as you increase the force? 20 mins LEARNING OUTCOMES Make a series of measurements of length Draw a line graph of results Identify a pattern linking force and length of elastic band 64
67 STRETCHY THINGS KS2 Teachers notes EQUIPMENT AND RESOURCES Equipment/Resources per group of 3/4 : 0-10 N force meters, metre ruler or tape, new elastic bands within the range 6-8 cm, safety goggles, graph paper (1cm or use sheet 3) Worksheets: Sheets 1 and 3 HEALTH AND SAFETY Suggest that children should wear eye protection goggles in case of overstretched elastic bands. ADDITIONAL NOTES The lesson is relatively controlled in terms of the decisions that children are asked to make about the planning of the investigation. This is so that the class can focus on the key process skills of recording and communicating findings. Three worksheets are provided to help this: Sheet 1 gives instructions for the investigation. More able pupils may not need to use the worksheet and can draw their own tables. Sheet 2 this is a pre-prepared set of results, if needed. Sheet 3 A graph with labelled axes some pupils may be able to use graph paper and work independently; others will need help with scales and units for the axes. These sheets are also provided as PowerPoint slides on the CD BACKGROUND SCIENCE Why does the elastic band stretch and return back to its original shape? The pull of the force meter is a contact force, which goes as soon as the force meter is removed. Interestingly there is a spring inside the force meter - this also stretches. Both the elastic band and the force meter return back to their original size and shape afterwards. 65
68 CHILDREN S COMMON MISCONCEPTIONS Many children have difficulty in applying the concept of a force in terms of a quantity (i.e. in Newtons). Some children may have difficulty appreciating that a force only operates when the force meter is in contact with the elastic band. Few children will know that the force meter contains a spring that also stretches when a force is applied to it. FOLLOW UP WORK Children could go on to compare elastic bands and springs of different length and thickness to promote work on predictions and to help children raise what if? questions. This could lead to a discussion of class results including any strange results (or anomalous) results. Extend the idea to look at elastic bands used to power toys e.g. model aeroplane propeller etc. 66
69 Sheet 1 Stretching elastic bands Use a force meter to stretch your elastic band. The length of the elastic band can be measured like this: Use the same size of elastic band each time. Change the amount of force. Measure the length of the elastic band. Choose which force meter to use. 0-1 N 0-10 N 0-50 N N Record your results in a table like this: Force 2N First length (L1) Second length (L2) Average 4N 6N 8N 67
70 Sheet 2 Some results from a Stretching Elastic Bands Investigation. Our elastic band was 6 cm long. Force First length (L1) Second length (L2) Average 2N 8 cm 8 cm 8 cm 4N 10 cm 10 cm 10 cm 6N 13 cm 13 cm 13 cm 8N 16 cm 18 cm 17 cm 68
71 Sheet 3 Graph showing how the length of the stretched elastic band changes Length of elastic band (in cm) Force in Newtons (N) 69
72 STRETCHY THINGS KS3 Lesson Plan LEARNING OBJECTIVES Children should learn to: Interpret graphs to compare how an elastic band and a spring stretch Make predictions about elastic limit SETTING THE SCENE Remind students about measuring elastic bands with force meters at KS 2. Introduce idea of using masses on a spring and show diagram of equipment to use on an OHT or PowerPoint slide (sheet 1). Discuss the shape of the elastic band graph (sheet 2) and predict a graph for a spring (sheet 3). Children justify and debate their choice of graph shape. ACTIVITIES Children set up their equipment (safety goggles!). They add 100g masses (up to 1Kg) to the spring and measure the extension for each 100g added. Plot line graph (sheet 4) and later introduce Hooke s Law as a way of describing the pattern of regular extension. Key Questions Describe the shape of this graph. How does the amount the elastic band stretches change as you apply more force? What shape of graph would you expect if you stretched a spring? What shape of graph have you got? Can you explain the shape of the graph? Why is it so different to the elastic band graph? Timings 10 mins 35 mins PLENARY Now ask pupils to predict the extension if you continue to add mass beyond 1Kg. Demo this at the front with children as assistants (wearing goggles). Stretch the spring beyond it s elastic limit. Introduce the Bungee Jumping scenario collect ideas of what properties the rope should have e.g. stretchy to bounce back up but not to stretch too far. Children could go on to investigate the stretch of suitcase bungees. What will happen to the spring if we continue to add more masses? Why does a spring return to its original shape? Why doesn t a spring stretched beyond its elastic limit return to its original shape? What characteristics must a bungee rope have? LEARNING OUTCOMES To describe Hooke s Law To explain elastic limit Draw a line of best fit and look for/explain any anomalous results 15 mins 70
73 STRETCHY THINGS KS3 Teachers notes EQUIPMENT AND RESOURCES Equipment: Springs (as manufactured or pre-made from wire), clamps, bosses and stands, 1 metre rulers, 5kg masses or G-clamps to prevent stands tipping over, safety goggles. Resources: OHT or PowerPoint slide of sheet 1 and copies of sheets 2 and 3. White board if required. ADDITIONAL NOTES The range and number of masses needed to stretch springs depends on the types of springs used. Packs of springs sold by suppliers to carry out investigations of Hooke s Law may be suitable. Alternatively you could make springs by coiling 1m of 26 SWG copper wire onto a wooden or glass rod or pen. It might be more suitable to add masses of 10g to homemade springs. If children slide a paper clip onto the bottom of their springs, like a pointer, they can measure extension more accurately. Resources for the lesson are also available as PowerPoint slides on the CD. BACKGROUND KNOWLEDGE Teachers will need to have given a brief description of behaviour of elastic materials. Children should have had some experience of looking at graphs /relationships shown by graphs. CHILDREN S COMMON MISCONCEPTIONS Children have difficulty in applying the concept of a force in terms of a quantity (i.e. Newtons). Some children may have difficulty appreciating that a force only operates when it is in contact with the spring force is applied to the spring. 71
74 FOLLOW-UP WORK Having completed the above activity children can then tackle the following Sc1 investigation Bungee Jumping Challenge. An outdoor pursuits centre wants to buy some Bungee Jumping rope. Three companies have sent samples of rope and the outdoor pursuits centre have asked you to decide which is the safest to buy. Use your knowledge to produce a summary brochure of the results of your findings giving reasons for your best choice of rope. Use suitcase bungees or small sections of elastic to represent the 3 samples. First, discuss the important properties needed for a bungee jump rope, then go on to plan a way to test the samples. This may in reality involve such heavy weights that it is not practical for a whole class to carry out. See website Children can model the jump using an excel spreadsheet and increase elasticity of the bungee rope to put less strain on the jumper s ankles. 72

75 Sheet 1 Measuring the stretch of a spring Clamp Spring Ruler Clamp stand 100g masses 73
76 Sheet 2 Extension of an elastic band Force (Newtons) Length of elastic band (cm) Graph to show the extension of an elastic band Length (cm) Force (Newtons) Can you explain the shape of the graph? 74
77 Sheet 3 Which graph do you expect the one for extension of a spring to look like? A B Length Length Force Force C D Length Length Force Force 75
78 Sheet 4 What happens to the length of a spring when you add weight to it? Results Force (Newtons) Extension of spring (cm) Describe and explain the pattern of your graph. 76
79 (8) Using the CD of the booklet The CD should be loaded into your computer s CD drive. You can open it from the explore window by double clicking on the CD drive icon. You will see seven folder icons. The table below shows the contents of each folder. Folder Mouldy Old Dough Contents Word document of the SEPT and associated PowerPoint slides. Finding a Solution Word document of the SEPT and associated PowerPoint slides. Lighting Up Word document of the SEPT and associated PowerPoint slides. Stretchy Things Word document of the SEPT and associated PowerPoint slides. Other resources Word document of the remaining pages from the booklet in case you wish to use any of the text from them, e.g. for CPD sessions in school. Post-it planning posters Word document containing copies of the planning posters which you can print out and have enlarged. There is also a sheet giving some background on how to use them. Moving on booklet Word document containing the whole booklet should you wish to refer to it in its entirety. Note this is a relatively large file to download approx 2.5 MB Technical note: The files on this CD have been written using Microsoft applications for Windows 2000 professional. They should load and run with all applications above windows 98. Windows 95 users may wish to download an appropriate version from their LEAs website (users in North Yorkshire and City of York only) 77
80 (9) Some useful references and resources The North Yorkshire LEA Science Team has developed a comprehensive and detailed scheme of work for use in primary science teaching. This interactive resource, which is used extensively within North Yorkshire schools, contains downloadable resources and extensive planning and assessment guidance designed to enhance the teaching of primary science. This resource, which is only available to North Yorkshire schools (password protected), can be accessed via the North Yorkshire Learning network at: The three sources below give good guidance on teaching scientific enquiry (Sc1). They are based on outcomes of the ASE/Kings College (AKSIS) project and give excellent state-ofthe-art guidance for teachers. They provide INSET materials and text 2 includes software to help children plan and carry out investigations. They can all be used at KS2 or KS3. 1. Goldsworthy A., Watson, R., and Wood-Robinson, V. (2000) Getting to Grips With Graphs. Hatfield: ASE (Association for Science Education) 2. Goldsworthy A., Watson, R., and Wood-Robinson, V. (2000) Developing an Understanding in Scientific Enquiry. Hatfield: ASE (Association for Science Education) 3. Goldsworthy A., Watson, R., and Wood-Robinson, V. (2000) Targeted Learning: using classroom assessment for learning. Hatfield: ASE (Association for Science Education) Sources 4 and 5 below are also excellent resources. Number 4 gives particularly good advice on progression in process skills. Source no. 5, the concept cartoons book, can be used to stimulate children's thinking about science concepts in both Key Stages. 4. Goldsworthy, A and Feasey, R. (1997) Making Sense of Primary Science Investigations. Hatfield: ASE 5. Keough, B and Naylor, S. (2000) Concept Cartoons in Science Education. Millgate Publishers. The Science Transition AstraZeneca York (STAY) project has researched a number of areas of progression from KS2 to KS3 in science. Summaries of this work can be found in the publications section of the project s web site: Some examples of bridging work from the STAY project and interactive training materials that teachers can use can be found in a Professional Development Unit on the AZSTT web site at: 78

81 (10) Acknowledgements The concept cartoons used in some of the lessons in this booklet are based on an idea by Brenda Keough and Stuart Naylor (see source 5 above). Illustrations and worksheets were devised by the writing teams and have been reproduced by the project administrator, Joanna MacDonald. Thanks to all schools who helped to try out the lessons and ideas contained in this booklet. Their efforts have been invaluable in helping produce this resource. The NYASPP project was financed by a grant from the Astra Zeneca Science Teaching Trust. The work of the trust and details of other projects can be viewed on the trust's website: 79
Unit: Human Impact Differentiated (Tiered) Task How Does Human Activity Impact Soil Erosion?
 Task How Does Human Activity Impact Soil Erosion?") The following instructional plan is part of a GaDOE collection of Unit Frameworks, Performance Tasks, examples of Student Work, and Teacher Commentary. Many more GaDOE approved instructional plans are
The following instructional plan is part of a GaDOE collection of Unit Frameworks, Performance Tasks, examples of Student Work, and Teacher Commentary. Many more GaDOE approved instructional plans are
Paper 2. Mathematics test. Calculator allowed. First name. Last name. School KEY STAGE TIER
 259574_P2 5-7_KS3_Ma.qxd 1/4/04 4:14 PM Page 1 Ma KEY STAGE 3 TIER 5 7 2004 Mathematics test Paper 2 Calculator allowed Please read this page, but do not open your booklet until your teacher tells you
Mathematics process categories
 Mathematics process categories All of the UK curricula define multiple categories of mathematical proficiency that require students to be able to use and apply mathematics, beyond simple recall of facts
Creating Coherent Inquiry Projects to Support Student Cognition and Collaboration in Physics
 Creating Coherent Inquiry Projects to Support Student Cognition and Collaboration in Physics 6 Douglas B. Clark, Arizona State University S. Raj Chaudhury, Christopher Newport University As a physics teacher,
LITERACY ACROSS THE CURRICULUM POLICY
 "Pupils should be taught in all subjects to express themselves correctly and appropriately and to read accurately and with understanding." QCA Use of Language across the Curriculum "Thomas Estley Community
Fourth Grade. Reporting Student Progress. Libertyville School District 70. Fourth Grade
 Fourth Grade Libertyville School District 70 Reporting Student Progress Fourth Grade A Message to Parents/Guardians: Libertyville Elementary District 70 teachers of students in kindergarten-5 utilize a
EDEXCEL FUNCTIONAL SKILLS PILOT TEACHER S NOTES. Maths Level 2. Chapter 4. Working with measures
 EDEXCEL FUNCTIONAL SKILLS PILOT TEACHER S NOTES Maths Level 2 Chapter 4 Working with measures SECTION G 1 Time 2 Temperature 3 Length 4 Weight 5 Capacity 6 Conversion between metric units 7 Conversion
Ks3 Sats Papers Maths 2003
 Ks3 Sats Maths 2003 Free PDF ebook Download: Ks3 Sats Maths 2003 Download or Read Online ebook ks3 sats papers maths 2003 in PDF Format From The Best User Guide Database Year 2 SATs. English KS1 English.
Case study Norway case 1
 Case study Norway case 1 School : B (primary school) Theme: Science microorganisms Dates of lessons: March 26-27 th 2015 Age of students: 10-11 (grade 5) Data sources: Pre- and post-interview with 1 teacher
Unit 1: Scientific Investigation-Asking Questions
 Unit 1: Scientific Investigation-Asking Questions Standards: OKC 3 Process Standard 3: Experimental design - Understanding experimental designs requires that students recognize the components of a valid
Physical Features of Humans
 Grade 1 Science, Quarter 1, Unit 1.1 Physical Features of Humans Overview Number of instructional days: 11 (1 day = 20 30 minutes) Content to be learned Observe, identify, and record the external features
Picture It, Dads! Facilitator Activities For. The Mitten
 Picture It, Dads! Facilitator Activities For The Mitten Picture It Dads! The Mitten Goals for Dads: 1. To practice effective read-aloud techniques. 2. To develop strategies to help retell the story. 3.
MADERA SCIENCE FAIR 2013 Grades 4 th 6 th Project due date: Tuesday, April 9, 8:15 am Parent Night: Tuesday, April 16, 6:00 8:00 pm
 MADERA SCIENCE FAIR 2013 Grades 4 th 6 th Project due date: Tuesday, April 9, 8:15 am Parent Night: Tuesday, April 16, 6:00 8:00 pm Why participate in the Science Fair? Science fair projects give students
2016 Warren STEM Fair. Monday and Tuesday, April 18 th and 19 th, 2016 Real-World STEM
 2016 Warren STEM Fair Monday and Tuesday, April 18 th and 19 th, 2016 Real-World STEM Tonight s Goal We will examine the different parts of the STEM Fair process (Scientific Method) in order for you to
Friction Stops Motion
 activity Friction Stops Motion BROWARD COUNTY ELEMENTARY SCIENCE BENCHMARK PLAN Grade Quarter Activity SC.C... The student understands that the motion of an object can be described and measured. SC.H...
Sensory evaluation. Teachers guide (primary)
") Sensory evaluation Teachers guide (primary) Welcome What is sensory evaluation? Sensory evaluation is a scientific discipline that analyses and measures human responses to the composition of food and drink,
Sensory evaluation Teachers guide (primary) Welcome What is sensory evaluation? Sensory evaluation is a scientific discipline that analyses and measures human responses to the composition of food and drink,
Learning Lesson Study Course
 Learning Lesson Study Course Developed originally in Japan and adapted by Developmental Studies Center for use in schools across the United States, lesson study is a model of professional development in
Fire safety in the home
 Fire safety in the home Overview Fire safety in the home comprises a set of five units; Fire safety in the home, Make your home safe, Bedtime safety checks, Fire! and Fire safety in the home - research
This document has been produced by:
 year 9 This document has been produced by: The All Wales ESDGC Officer Group to support schools introducing the National Literacy and Numeracy Framework through ESDGC activities. With support from: Developing
Similar Triangles. Developed by: M. Fahy, J. O Keeffe, J. Cooper
 Similar Triangles Developed by: M. Fahy, J. O Keeffe, J. Cooper For the lesson on 1/3/2016 At Chanel College, Coolock Teacher: M. Fahy Lesson plan developed by: M. Fahy, J. O Keeffe, J. Cooper. 1. Title
Functional Skills Mathematics Level 2 assessment
 Functional Skills Mathematics Level 2 assessment www.cityandguilds.com September 2015 Version 1.0 Marking scheme ONLINE V2 Level 2 Sample Paper 4 Mark Represent Analyse Interpret Open Fixed S1Q1 3 3 0
INSTRUCTIONAL FOCUS DOCUMENT Grade 5/Science
 Exemplar Lesson 01: Comparing Weather and Climate Exemplar Lesson 02: Sun, Ocean, and the Water Cycle State Resources: Connecting to Unifying Concepts through Earth Science Change Over Time RATIONALE:
(I couldn t find a Smartie Book) NEW Grade 5/6 Mathematics: (Number, Statistics and Probability) Title Smartie Mathematics
 NEW Grade 5/6 Mathematics: (Number, Statistics and Probability) Title Smartie Mathematics") (I couldn t find a Smartie Book) NEW Grade 5/6 Mathematics: (Number, Statistics and Probability) Title Smartie Mathematics Lesson/ Unit Description Questions: How many Smarties are in a box? Is it the
(I couldn t find a Smartie Book) NEW Grade 5/6 Mathematics: (Number, Statistics and Probability) Title Smartie Mathematics Lesson/ Unit Description Questions: How many Smarties are in a box? Is it the
PHYSICS 40S - COURSE OUTLINE AND REQUIREMENTS Welcome to Physics 40S for !! Mr. Bryan Doiron
 PHYSICS 40S - COURSE OUTLINE AND REQUIREMENTS Welcome to Physics 40S for 2016-2017!! Mr. Bryan Doiron The course covers the following topics (time permitting): Unit 1 Kinematics: Special Equations, Relative
Lesson 1 Taking chances with the Sun
 P2 Radiation and life Lesson 1 Taking chances with the Sun consider health benefits as well as risks that sunlight presents introduce two ideas: balancing risks and benefits, reducing risks revisit the
Coimisiún na Scrúduithe Stáit State Examinations Commission LEAVING CERTIFICATE 2008 MARKING SCHEME GEOGRAPHY HIGHER LEVEL
 Coimisiún na Scrúduithe Stáit State Examinations Commission LEAVING CERTIFICATE 2008 MARKING SCHEME GEOGRAPHY HIGHER LEVEL LEAVING CERTIFICATE 2008 MARKING SCHEME GEOGRAPHY HIGHER LEVEL PART ONE: SHORT-ANSWER
Teaching Literacy Through Videos
 Teaching Literacy Through Videos Elizabeth Stavis Reading Intervention Specialist RR Teacher Santa Clara Unified Jenny Maehara Elementary Literacy Specialist RR Teacher Santa Clara Unified February 9,
Igneous Rock Formation
 Igneous Rock Formation *adapted from TOPS Learning Systems 1) Lay down a row of saturated salt water drops along the diameter of an aluminum pie tin. 2) Rest the tin on a jar so a candle fits under the
GRADE 2 SUPPLEMENT. Set D4 Measurement: Capacity. Includes. Skills & Concepts. Activity 1: Predict & Fill D4.1
 GRADE 2 SUPPLEMENT Set D4 Measurement: Capacity Includes Activity 1: Predict & Fill D4.1 Skills & Concepts H use non-standard units to measure to determine capacity H compare and order containers according
SCORING KEY AND RATING GUIDE
 FOR TEACHERS ONLY The University of the State of New York Le REGENTS HIGH SCHOOL EXAMINATION LIVING ENVIRONMENT Wednesday, June 19, 2002 9:15 a.m. to 12:15 p.m., only SCORING KEY AND RATING GUIDE Directions
Getting Started with TI-Nspire High School Science
 Getting Started with TI-Nspire High School Science 2012 Texas Instruments Incorporated Materials for Institute Participant * *This material is for the personal use of T3 instructors in delivering a T3
Measurement. When Smaller Is Better. Activity:
 Measurement Activity: TEKS: When Smaller Is Better (6.8) Measurement. The student solves application problems involving estimation and measurement of length, area, time, temperature, volume, weight, and
Cogat Sample Questions Grade 2
 Cogat Grade 2 Free PDF ebook Download: Cogat Grade 2 Download or Read Online ebook cogat sample questions grade 2 in PDF Format From The Best User Guide Database 1st Grade. ITBS Reading and/or ITBS Math
Interpreting Graphs Middle School Science
 Middle School Free PDF ebook Download: Download or Read Online ebook interpreting graphs middle school science in PDF Format From The Best User Guide Database. Rain, Rain, Go Away When the student council
Properties of materials before and after change
 SCIENCE YEARS 1 TO 10 SOURCEBOOK MODULE SCIENCE MIDDLE PRIMARY Level F 1 2 3 4 5 6 B6 Properties of materials before and after change Strand Natural and Processed Materials Key concept Patterns of interactions
Extending Place Value with Whole Numbers to 1,000,000
 Grade 4 Mathematics, Quarter 1, Unit 1.1 Extending Place Value with Whole Numbers to 1,000,000 Overview Number of Instructional Days: 10 (1 day = 45 minutes) Content to Be Learned Recognize that a digit
Paper Reference. Edexcel GCSE Mathematics (Linear) 1380 Paper 1 (Non-Calculator) Foundation Tier. Monday 6 June 2011 Afternoon Time: 1 hour 30 minutes
 1380 Paper 1 (Non-Calculator) Foundation Tier. Monday 6 June 2011 Afternoon Time: 1 hour 30 minutes") Centre No. Candidate No. Paper Reference 1 3 8 0 1 F Paper Reference(s) 1380/1F Edexcel GCSE Mathematics (Linear) 1380 Paper 1 (Non-Calculator) Foundation Tier Monday 6 June 2011 Afternoon Time: 1 hour
Centre No. Candidate No. Paper Reference 1 3 8 0 1 F Paper Reference(s) 1380/1F Edexcel GCSE Mathematics (Linear) 1380 Paper 1 (Non-Calculator) Foundation Tier Monday 6 June 2011 Afternoon Time: 1 hour
ENERGY WORLD: Electricity aro
 ENERGY WORLD: Electricity aro ound us Lesson Plans October December 2008 UNIT 1. WHAT IS ELEC CTRICITY? TEACHING OBJECTIVES - To identify and classify electrical and non electrical appliances. - To know
Ohio s Learning Standards-Clear Learning Targets
 Ohio s Learning Standards-Clear Learning Targets Math Grade 1 Use addition and subtraction within 20 to solve word problems involving situations of 1.OA.1 adding to, taking from, putting together, taking
Characteristics of Functions
 Characteristics of Functions Unit: 01 Lesson: 01 Suggested Duration: 10 days Lesson Synopsis Students will collect and organize data using various representations. They will identify the characteristics
Every curriculum policy starts from this policy and expands the detail in relation to the specific requirements of each policy s field.
 1. WE BELIEVE We believe a successful Teaching and Learning Policy enables all children to be effective learners; to have the confidence to take responsibility for their own learning; understand what it
Curriculum Design Project with Virtual Manipulatives. Gwenanne Salkind. George Mason University EDCI 856. Dr. Patricia Moyer-Packenham
 Curriculum Design Project with Virtual Manipulatives Gwenanne Salkind George Mason University EDCI 856 Dr. Patricia Moyer-Packenham Spring 2006 Curriculum Design Project with Virtual Manipulatives Table
Physics 270: Experimental Physics
 2017 edition Lab Manual Physics 270 3 Physics 270: Experimental Physics Lecture: Lab: Instructor: Office: Email: Tuesdays, 2 3:50 PM Thursdays, 2 4:50 PM Dr. Uttam Manna 313C Moulton Hall umanna@ilstu.edu
Electrical Testing Equipment Performance Rubrics
 Name: Level: Electrical Testing Equipment Performance Rubrics (NOCTI Remediation) Program Of Study Task # Date 11 12 Identify and safely use a multi-meter. Identify and safely use a continuity tester.
Eggs-periments & Eggs-plorations
 Eggs-periments & Eggs-plorations Dear Educator, The American Egg Board, together with the curriculum experts Young Minds Inspired (YMI), have teamed to bring you this Eggs-periments and Eggsplorations
TOPIC VN7 PAINTING AND DECORATING
 TOPIC VN7 PAINTING AND DECORATING THEME: EDUCATION & TRAINING LEVELS 1 & 2 ISSUED 2013 L E V E L 2 ESSENTIAL SKILLS INSTRUCTIONS WHAT DO I DO? L Theme E V E Template L 2 Use this to help you: plan an Action-based
The lab is designed to remind you how to work with scientific data (including dealing with uncertainty) and to review experimental design.
 and to review experimental design.") Name: Partner(s): Lab #1 The Scientific Method Due 6/25 Objective The lab is designed to remind you how to work with scientific data (including dealing with uncertainty) and to review experimental design.
Name: Partner(s): Lab #1 The Scientific Method Due 6/25 Objective The lab is designed to remind you how to work with scientific data (including dealing with uncertainty) and to review experimental design.
Functional Maths Skills Check E3/L x
 Functional Maths Skills Check E3/L1 Name: Date started: The Four Rules of Number + - x May 2017. Kindly contributed by Nicola Smith, Gloucestershire College. Search for Nicola on skillsworkshop.org Page
MULTIPLE CHOICE. Choose the one alternative that best completes the statement or answers the question.
 Ch 2 Test Remediation Work Name MULTIPLE CHOICE. Choose the one alternative that best completes the statement or answers the question. Provide an appropriate response. 1) High temperatures in a certain
This document has been produced by:
 year 6 This document has been produced by: The All Wales ESDGC Officer Group to support schools introducing the National Literacy and Numeracy Framework through ESDGC activities. With support from: Developing
STRETCHING AND CHALLENGING LEARNERS
 STRETCHING AND CHALLENGING LEARNERS Melissa Ling JANUARY 18, 2013 OAKLANDS COLLEGE Contents Introduction... 2 Action Research... 3 Literature Review... 5 Project Hypothesis... 10 Methodology... 11 Data
Ks3 Science 2010 Sats Paper
 Ks3 Science 2010 Sats Paper Free PDF ebook Download: Ks3 Science 2010 Sats Paper Download or Read Online ebook ks3 science 2010 sats paper in PDF Format From The Best User Guide Database QCA is a non-departmental
AGS THE GREAT REVIEW GAME FOR PRE-ALGEBRA (CD) CORRELATED TO CALIFORNIA CONTENT STANDARDS
 CORRELATED TO CALIFORNIA CONTENT STANDARDS") AGS THE GREAT REVIEW GAME FOR PRE-ALGEBRA (CD) CORRELATED TO CALIFORNIA CONTENT STANDARDS 1 CALIFORNIA CONTENT STANDARDS: Chapter 1 ALGEBRA AND WHOLE NUMBERS Algebra and Functions 1.4 Students use algebraic
AGS THE GREAT REVIEW GAME FOR PRE-ALGEBRA (CD) CORRELATED TO CALIFORNIA CONTENT STANDARDS 1 CALIFORNIA CONTENT STANDARDS: Chapter 1 ALGEBRA AND WHOLE NUMBERS Algebra and Functions 1.4 Students use algebraic
Science Fair Rules and Requirements
 Science Fair Rules and Requirements Dear Parents, Soon your child will take part in an exciting school event a science fair. At Forest Park, we believe that this annual event offers our students a rich
Going to School: Measuring Schooling Behaviors in GloFish
 Name Period Date Going to School: Measuring Schooling Behaviors in GloFish Objective The learner will collect data to determine if schooling behaviors are exhibited in GloFish fluorescent fish. The learner
Chapter 9 Banked gap-filling
 Chapter 9 Banked gap-filling This testing technique is known as banked gap-filling, because you have to choose the appropriate word from a bank of alternatives. In a banked gap-filling task, similarly
Measuring physical factors in the environment
 B2 3.1a Student practical sheet Measuring physical factors in the environment Do environmental conditions affect the distriution of plants? Aim To find out whether environmental conditions affect the distriution
Louisiana State Museum
 Louisiana State Museum Raw and Manufactured Goods A crosscurricular lesson linked to the common core state standards. PERFORMANCE TASKS: -Students will be able to identify and describe the difference between
Grade 3 Science Life Unit (3.L.2)
") Grade 3 Science Life Unit (3.L.2) Decision 1: What will students learn in this unit? Standards Addressed: Science 3.L.2 Understand how plants survive in their environments. Ask and answer questions to
Grade 3 Science Life Unit (3.L.2) Decision 1: What will students learn in this unit? Standards Addressed: Science 3.L.2 Understand how plants survive in their environments. Ask and answer questions to
Characteristics of the Text Genre Informational Text Text Structure
 LESSON 4 TEACHER S GUIDE by Taiyo Kobayashi Fountas-Pinnell Level C Informational Text Selection Summary The narrator presents key locations in his town and why each is important to the community: a store,
SOCIAL STUDIES GRADE 1. Clear Learning Targets Office of Teaching and Learning Curriculum Division FAMILIES NOW AND LONG AGO, NEAR AND FAR
 SOCIAL STUDIES FAMILIES NOW AND LONG AGO, NEAR AND FAR GRADE 1 Clear Learning Targets 2015-2016 Aligned with Ohio s Learning Standards for Social Studies Office of Teaching and Learning Curriculum Division
How to make successful presentations in English Part 2
 Young Researchers Seminar 2013 Young Researchers Seminar 2011 Lyon, France, June 5-7, 2013 DTU, Denmark, June 8-10, 2011 How to make successful presentations in English Part 2 Witold Olpiński PRESENTATION
Includes Activities for all ages CHALLENGE LEVEL 1. Explore STEM with
 Take Our Daughters And Sons To Work Foundation Activity Guide Includes Activities for all ages CHALLENGE LEVEL 1 Explore STEM with WARNING: These STEM activities have been known to cause extreme excitement.
EQuIP Review Feedback
 EQuIP Review Feedback Lesson/Unit Name: On the Rainy River and The Red Convertible (Module 4, Unit 1) Content Area: English language arts Grade Level: 11 Dimension I Alignment to the Depth of the CCSS
Science Fair Project Handbook
 Science Fair Project Handbook IDENTIFY THE TESTABLE QUESTION OR PROBLEM: a) Begin by observing your surroundings, making inferences and asking testable questions. b) Look for problems in your life or surroundings
West s Paralegal Today The Legal Team at Work Third Edition
 Study Guide to accompany West s Paralegal Today The Legal Team at Work Third Edition Roger LeRoy Miller Institute for University Studies Mary Meinzinger Urisko Madonna University Prepared by Bradene L.
PREP S SPEAKER LISTENER TECHNIQUE COACHING MANUAL
 1 PREP S SPEAKER LISTENER TECHNIQUE COACHING MANUAL IMPORTANCE OF THE SPEAKER LISTENER TECHNIQUE The Speaker Listener Technique (SLT) is a structured communication strategy that promotes clarity, understanding,
If we want to measure the amount of cereal inside the box, what tool would we use: string, square tiles, or cubes?
 String, Tiles and Cubes: A Hands-On Approach to Understanding Perimeter, Area, and Volume Teaching Notes Teacher-led discussion: 1. Pre-Assessment: Show students the equipment that you have to measure
Function Number 1 Work as part of a team. Thorough knowledge of theoretical procedures and ability to integrate knowledge and performance into
 Function Essential Functions EMT PARAMEDIC 1 Work as part of a team. Thorough knowledge of theoretical procedures and ability to integrate knowledge and performance into practical situations is critical.
Table of Contents. This descriptive guide will assist you in integrating the DVD science and education content into your instructional program.
 Bill Nye the Science Guy Comets & Meteors 1. Implementation Guide........................................ 2 9 This descriptive guide will assist you in integrating the DVD science and education content
Feedback, Marking and Presentation Policy
 Feedback, Marking and Presentation Policy This policy was developed as part of a consultation process involving pupils, staff, parents and Governors of the school. In development of this policy reference
LEGO MINDSTORMS Education EV3 Coding Activities
 LEGO MINDSTORMS Education EV3 Coding Activities s t e e h s k r o W t n e d Stu LEGOeducation.com/MINDSTORMS Contents ACTIVITY 1 Performing a Three Point Turn 3-6 ACTIVITY 2 Written Instructions for a
Creative Media Department Assessment Policy
 Creative Media Department Assessment Policy Policy Aims To develop the outstanding use of assessment to support learning so that: - Teachers plan and teach lessons that enable pupils to learn exceptionally
Lecturing Module
 Lecturing: What, why and when www.facultydevelopment.ca Lecturing Module What is lecturing? Lecturing is the most common and established method of teaching at universities around the world. The traditional
Grade 2: Using a Number Line to Order and Compare Numbers Place Value Horizontal Content Strand
 Grade 2: Using a Number Line to Order and Compare Numbers Place Value Horizontal Content Strand Texas Essential Knowledge and Skills (TEKS): (2.1) Number, operation, and quantitative reasoning. The student
School Experience Reflective Portfolio
 School Experience Reflective Portfolio Primary PGCE Name Year of Entry Organisation of the Reflective Portfolio You will continue to make contributions to the RP throughout all 3 School Experiences. Set
For information only, correct responses are listed in the chart below. Question Number. Correct Response
 THE UNIVERSITY OF THE STATE OF NEW YORK 4GRADE 4 ELEMENTARY-LEVEL SCIENCE TEST JUNE 207 WRITTEN TEST FOR TEACHERS ONLY SCORING KEY AND RATING GUIDE Note: All schools (public, nonpublic, and charter) administering
Build on students informal understanding of sharing and proportionality to develop initial fraction concepts.
 Recommendation 1 Build on students informal understanding of sharing and proportionality to develop initial fraction concepts. Students come to kindergarten with a rudimentary understanding of basic fraction
Functional Skills Mathematics Subject Specifications and Tutor/Assessor Guide SUBJECT SPECIFICATIONS. September 2017 Version 1.7
 Functional Skills Mathematics Subject Specifications and Tutor/Assessor Guide SUBJECT SPECIFICATIONS September 2017 Version 1.7 Qualification at a glance Subject area Functional Skills qualifications in
Exclusions Policy. Policy reviewed: May 2016 Policy review date: May OAT Model Policy
 Exclusions Policy Policy reviewed: May 2016 Policy review date: May 2018 OAT Model Policy 1 Contents Action to be invoked by Senior Staff in Serious Disciplinary Matters 1. When a serious incident occurs,
Fluency YES. an important idea! F.009 Phrases. Objective The student will gain speed and accuracy in reading phrases.
 F.009 Phrases Objective The student will gain speed and accuracy in reading phrases. Materials YES and NO header cards (Activity Master F.001.AM1) Phrase cards (Activity Master F.009.AM1a - F.009.AM1f)
WiggleWorks Software Manual PDF0049 (PDF) Houghton Mifflin Harcourt Publishing Company
 Houghton Mifflin Harcourt Publishing Company") WiggleWorks Software Manual PDF0049 (PDF) Houghton Mifflin Harcourt Publishing Company Table of Contents Welcome to WiggleWorks... 3 Program Materials... 3 WiggleWorks Teacher Software... 4 Logging In...
WiggleWorks Software Manual PDF0049 (PDF) Houghton Mifflin Harcourt Publishing Company Table of Contents Welcome to WiggleWorks... 3 Program Materials... 3 WiggleWorks Teacher Software... 4 Logging In...
been each get other TASK #1 Fry Words TASK #2 Fry Words Write the following words in ABC order: Write the following words in ABC order:
 TASK #1 Fry Words 1-100 been each called down about first TASK #2 Fry Words 1-100 get other long people number into TASK #3 Fry Words 1-100 could part more find now her TASK #4 Fry Words 1-100 for write
Mathematics subject curriculum
 Mathematics subject curriculum Dette er ei omsetjing av den fastsette læreplanteksten. Læreplanen er fastsett på Nynorsk Established as a Regulation by the Ministry of Education and Research on 24 June
Alberta Police Cognitive Ability Test (APCAT) General Information
 General Information") Alberta Police Cognitive Ability Test (APCAT) General Information 1. What does the APCAT measure? The APCAT test measures one s potential to successfully complete police recruit training and to perform
Alberta Police Cognitive Ability Test (APCAT) General Information 1. What does the APCAT measure? The APCAT test measures one s potential to successfully complete police recruit training and to perform
Planting Seeds, Part 1: Can You Design a Fair Test?
 Planting Seeds, Part 1: Can You Design a Fair Test? In this investigation, your team will choose 2 or 3 seeds in order to design an investigation to learn something more about them. First, you will need
FEEDBACK & MARKING POLICY. Little Digmoor Primary School
 FEEDBACK & MARKING POLICY Little Digmoor Primary School This policy complements the Teaching and Learning policy at Little Digmoor Primary School. It is a vital component in maximising the full learning
COVER SHEET. This is the author version of article published as:
 COVER SHEET This is the author version of article published as: Sivapalan, Siva and Cregan, Peter (2005) Value of online resources for learning by distance education. CAL-laborate 14:pp. 23-27. Copyright
Understanding and Supporting Dyslexia Godstone Village School. January 2017
 Understanding and Supporting Dyslexia Godstone Village School January 2017 By then end of the session I will: Have a greater understanding of Dyslexia and the ways in which children can be affected by
Peterborough Eco Framework
 We would expect you to carry out an review at the start of each year to allow you to assess what progress has been made and decide which area or areas you would like to focus on. It is up to you how you
Function Junction. Student Book Achieve Functional Skills in Mathematics
 Sa m pl e Function Junction M AT H E M AT I C S Student Book Achieve Functional Skills in Mathematics Student name: Centre: Contents 1 Introduction 2 2 Functional Skills criteria for Mathematics 4 3 Recording
5.1 Sound & Light Unit Overview
 5.1 Sound & Light Unit Overview Enduring Understanding: Sound and light are forms of energy that travel and interact with objects in various ways. Essential Question: How is sound energy transmitted, absorbed,
Montana Content Standards for Mathematics Grade 3. Montana Content Standards for Mathematical Practices and Mathematics Content Adopted November 2011
 Montana Content Standards for Mathematics Grade 3 Montana Content Standards for Mathematical Practices and Mathematics Content Adopted November 2011 Contents Standards for Mathematical Practice: Grade
FOR TEACHERS ONLY. The University of the State of New York REGENTS HIGH SCHOOL EXAMINATION PHYSICAL SETTING/PHYSICS
 PS P FOR TEACHERS ONLY The University of the State of New York REGENTS HIGH SCHOOL EXAMINATION PHYSICAL SETTING/PHYSICS Thursday, June 21, 2007 9:15 a.m. to 12:15 p.m., only SCORING KEY AND RATING GUIDE
File # for photo
 File #6883458 for photo -------- I got interested in Neuroscience and its applications to learning when I read Norman Doidge s book The Brain that Changes itself. I was reading the book on our family vacation
Sugar And Salt Solutions Phet Simulation Packet
 Sugar And Salt Solutions Phet Simulation Packet Free PDF ebook Download: Sugar And Salt Solutions Phet Simulation Packet Download or Read Online ebook sugar and salt solutions phet simulation packet in
STT 231 Test 1. Fill in the Letter of Your Choice to Each Question in the Scantron. Each question is worth 2 point.
 STT 231 Test 1 Fill in the Letter of Your Choice to Each Question in the Scantron. Each question is worth 2 point. 1. A professor has kept records on grades that students have earned in his class. If he
On Human Computer Interaction, HCI. Dr. Saif al Zahir Electrical and Computer Engineering Department UBC
 On Human Computer Interaction, HCI Dr. Saif al Zahir Electrical and Computer Engineering Department UBC Human Computer Interaction HCI HCI is the study of people, computer technology, and the ways these
D Road Maps 6. A Guide to Learning System Dynamics. System Dynamics in Education Project
 D-4506-5 1 Road Maps 6 A Guide to Learning System Dynamics System Dynamics in Education Project 2 A Guide to Learning System Dynamics D-4506-5 Road Maps 6 System Dynamics in Education Project System Dynamics
BSP !!! Trainer s Manual. Sheldon Loman, Ph.D. Portland State University. M. Kathleen Strickland-Cohen, Ph.D. University of Oregon
 Basic FBA to BSP Trainer s Manual Sheldon Loman, Ph.D. Portland State University M. Kathleen Strickland-Cohen, Ph.D. University of Oregon Chris Borgmeier, Ph.D. Portland State University Robert Horner,