Algebra. Chapter 10: Data Analysis. Name: Teacher: Pd:
|
|
|
- Grant Snow
- 6 years ago
- Views:
Transcription

1 Algebra Chapter 10: Data Analysis Name: Teacher: Pd:
2 Table of Contents o Chapter 10-2 (Day 1): SWBAT: Construct Histograms Pgs: #1 6 HW: Pgs 7-10 o Chapter 10-3 (Day 2): SWBAT: Calculate the Central Tendency of a Data Set. Pgs: #11 15 HW: Pgs o Chapter 10-3 (Day 3): SWBAT: Calculate the Central Tendency of a Grouped Data. Pgs: #19 22 HW: Pgs o Chapter 10-3 (Day 4): SWBAT: Calculate Percentiles Ranks and Create box-and-whisker plots. Pgs: #26 30 HW: Pgs o Half Period Quiz Lessons: 10-1 to 10-3 o Chapter A (Day 5): SWBAT: Distinguish between different types of data Pgs: #34-43 HW: Page 44 o Chapter A (Day 6): SWBAT: Create trend lines to make predictions. Pgs: #45-51 HW: Pgs o Full Period Quiz Lessons: 10-3 to A o Day 7 - REVIEW Pgs: #54-58 o Day 8 - REVIEW Pgs: #59-62 o TEST


3 Day 1 - Frequency Histograms Warm Up Construct a stem-and-leaf plot listing the scores below in order from lowest to highest. 15, 25, 28, 32, 39, 40, 43, 26, 50, 75, 65, 19, 55, 72, 50 The of a data value is the number of times it occurs. A shows the frequency of each data value. If the data is divided into intervals, the table shows the frequency of each interval. A is a bar graph used to display the frequency of data divided into equal intervals. The bars must be of equal width and should touch, but not overlap. 1
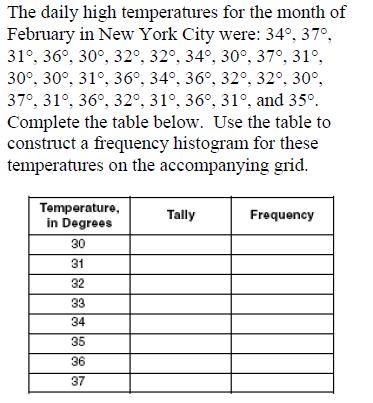
4 1) The Jacksonville High School Varsity Boys basketball team had an excellent season, compiling a record of 15 5 (15 wins and 5 losses). The total points scored by the team for each of the 20 games are listed below in the order in which the games were played: 76, 55, 76, 64, 46, 91, 65, 46, 45, 53, 56, 53, 57, 67, 62, 64, 67, 52, 58, 62 (a) Complete the frequency table below. POINTS SCORED TALLY FREQUENCY (b) On the graph grid provided, create a histogram using the frequency table from above. 2

5 Cumulative Frequency Histograms shows the frequency of all data values less than or equal to a given value. You could just count the number of values, but if the data set has many values, you might lose track. Recording the data in a cumulative frequency table can help you keep track of the data values as you count. Example 2: 3
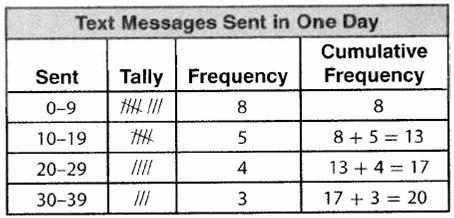
6 Example 3: Twenty students were surveyed about the number of days they played outside in one week. The results of this survey are shown below. {6, 5, 4, 5, 0, 7, 1, 5, 4, 4, 3, 2, 2, 3, 2, 4, 3, 4, 0, 7} Complete the frequency table for these data Number of Days Outside Interval Tally Frequency Complete the cumulative frequency table using these data. Number of Days Outside Cumulative Interval Frequency What must the last entry of the cumulative frequency table always be equal to? Explain. Create a cumulative frequency histogram based on the table you made. 4
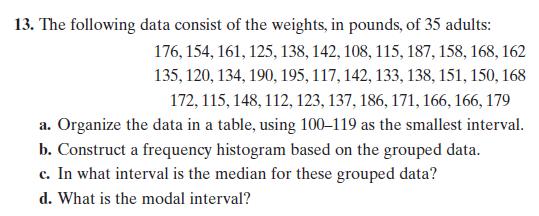
 Determine how many students scored higher than 70. c) State which ten-point interval contains the median. d) State which ten-point interval doubled another ten-point interval.")
7 Example 4: The Cumulative Frequency Histogram below shows test scores from an Algebra Regents Exam. a) Determine the total number of students who took the Algebra Regents Exam. b) Determine how many students scored higher than 70. c) State which ten-point interval contains the median. d) State which ten-point interval doubled another ten-point interval. 5


8 SUMMARY Exit Ticket


9 Day 1 - HW Section 1: Histograms 2) 3) 7

10 4) 5) In which interval is the median? Which two intervals have the same percentages? 8
11 6) Jim Shorts is a star basketball player for the Arlington High School basketball team. The number of points scored by Jim in each of his last 20 games are as follows: 35, 28, 25, 34, 41, 26, 19, 23, 32, 20, 11, 8, 38, 48, 22, 25, 16, 19, 22, 40 (a) Complete the table below to find the number in each interval. Construct a frequency histogram. Interval Tally Frequency 0 to 9 10 to to to to 49 (b) Complete the table below to determine the cumulative frequency. Construct a cumulative frequency histogram. Interval 0 to 9 0 to 19 0 to 29 0 to 39 0 to 49 Cumulative Frequency 9
12 7) The scores on a mathematics test were 70, 55, 61, 80, 85, 72, 65, 40, 74, 68, and 84. Complete the accompanying table, and use the table to construct a frequency histogram for these scores. Score Tally Frequency Complete the table below to determine the cumulative frequency. Construct a cumulative frequency histogram Score Cumulative Frequency 10
13 Chapter 10 2 (Day 2) Warm Up MEAN: the average Steps: 1. add up all the numbers of a set 2. divide the sum by the total number of numbers MEDIAN: middle value when the values are in numerical order or the mean of the two middle values if there is an even number of values MODE: the value or values that occur most often. There may be one mode or more than one mode. If no value occurs more often than another, we say the set has no mode. A measure of central tendency describes how data clusters around a value. 11
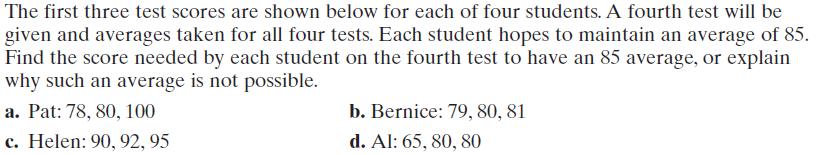
14 1) Lucia took five tests in her English class. The first four test scores are: 88, 85, 90, 94 If she has an average of a 90, what is her 5 th test score? 2) A student had taken six tests and received scores of 88, 73, 81, 83, 79, 94. The seventh test was coming up and the student want to know what was needed on the seventh test to have a mean score of 83. Find the seventh test score. Consider this set of test score values: Normal listing of scores. Scores with the lowest score replaced with outlier. The two sets of scores above are identical except for the first score. The set on the left shows the actual scores. The set on the right shows what would happen if one of the scores was WAY out of range in regard to the other scores. Such a term is called an outlier. With the outlier, the mean changed. With the outlier, the median did NOT change. 3) In Mr. Smith s Advanced Calculus Course, eight students recently took a test. Their grades were as follows: 45, 78, 82, 85, 87, 89, 93, 95 (a) Calculate the mean and median of this data set. (b) What score is an outlier in this data set? (c) Which value, the mean or the median, is a better measure of how well the average student did on Mr. Smith s quiz? 12
15 4) The data below shows the prices of jeans at different department stores around the city. (a) Calculate the mean, median, and mode for this data set. Round to the nearest tenth if necessary. Mean: Median: Mode: (b) Are there any outliers in this data set? If so, what data value? (c) What effect does this outlier have on the mean value? (d) Which statistical measure best represents the prices of jeans at different department stores around the city? 13
16 In Conclusion: If a number c is added to each set of data, then. New mean = New Median = New Mode = It can also be shown to have a similar result holds for multiplicative transformations, that is If a number c is multiplied to each set of data, then. New mean = New Median = New Mode = Example 5: 14

17 Challenge SUMMARY Exit Ticket 15
18 Day 2 - HW

19
20 11. 18

21 Chapter 10 2 (Day 3) SWBAT: Calculate the measure of Central Tendencies when the data is grouped. Warm Up Mean: Median: Mode: 19

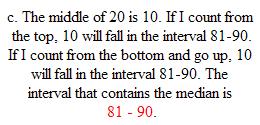
22 For this set of data, find: a. The total frequency b. The interval that contains the median c. The modal interval 20

 Calculate the mean, median and mode income based on this survey.")
 Are there any outliers in this data set? If so, what data value?")
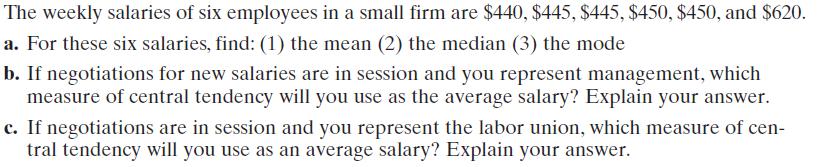
23 Practice Problems 1) A survey was conducted to determine the average income of residents of a particular neighborhood. Twenty people were surveyed outside of a grocery store. The results of this survey are given in the table below. (a) Calculate the mean, median and mode income based on this survey. List the data below in numerical order. Mean: Median: Mode: (b) Are there any outliers in this data set? If so, what data value? (c) What effect does this outlier have on the mean value? 2) For this set of data, find: a. The total frequency b. The interval that contains the median c. The modal interval Challenge 21


24 SUMMARY Exit Ticket ANSWER Exit Ticket
25 Day 3 HW 23
26 24
27 25

28 Percentiles and Box and Whisker Plots Day 4 SWBAT: Calculate Percentiles Ranks and Box and Whisker Plots Warm- Up Example #1: Computing Percentile Rank A percentile rank is the percentage of scores that fall at or below a given score. Percentile ranks are an easy way to convey an individual's standing at graduation relative to other graduates. Example 1: The data below represents the heights of 20 students. 53, 60, 61, 63, 64, 65, 65, 65, 65, 66, 66, 67, 67, 68, 69, 70, 70, 71, 71, 73 a) Find the percentile rank of , 60, 61, 63, 64, 65, 65, 65, 65, 66, 66, 67, 67, 68, 69, 70, 70, 71, 71, 73 b) Find the percentile rank of , 60, 61, 63, 64, 65, 65, 65, 65, 66, 66, 67, 67, 68, 69, 70, 70, 71, 71, 73 26

29 c) Example #2: Computing Percentiles (Quartiles) A percentile is a measure that tells us what percent of the total items in a data set is at of below that measure. Understanding Percentiles On a quiz taken by 30 students, a score of 85 is the 60 th percentile. A. How many students scored 85 or lower? B. How many students scored higher than 85? Quartiles can be thought of as percentile measure. Remember that quartiles break the data set into 4 equal parts. If 100% is broken into four equal parts, we have subdivisions at 25%, 50%, and 75% creating the: First quartile (lower quartile) to be at the 25 th percentile. Median (or second quartile) to be at the 50 th percentile. Third quartile (upper quartile) to be a the 75 th percentile. Example 3: For the table below, find the intervals in which the first, second and third quartiles lie. 27
30 Practice: Computing Percentiles (Quartiles) 4. Box and Whisker Plot Minimum: the smallest value in the set 1 st Quartile: the middle value in the first half of the set 2 nd Quartile: the middle value 3 rd Quartile: the middle value in the second half of the set 5) The average length in inches of the ten longest bones in the human body are listed. Use a graphing calculator to make a box-and-whisker plot to display the data 58, 63, 40, 44, 57, 59, 61, 53, 54, 58, 57, 57, 58, 58, 56 Minimum: 1 st quartile: 2 nd quartile (median): 3 rd quartile: Maximum: 28
31 6) Shown below are the scores 16 students received on a math quiz. Label the Minimum, Q1, Q2, Q3, and Maximum. 52, 60, 66, 66, 68, 72, 72, 73, 74, 75, 80, 82, 84, 91, 92, 98 Minimum: 1 st quartile: 2 nd quartile (median): 3 rd quartile: Maximum: 7) 8) Average Monthly High Temperatures (a) What percent of the time is it above 35? Daily Number of Minutes Seniors Watch TV (a) What percent of seniors watch less than 60 minutes of TV a day? (b) What percent of the time is it below 80? (b) What percent of seniors watch 15 minutes or more of TV a day? 29

32 SUMMARY Exit Ticket According to the box-and-whisker plot shown below, what are the five statistical summary values? 30
33 Day 4 - Homework 1) The Final Exam test scores were: 62, 66, 71, 75, 75, 78, 81, 83, 84, 85, 85, 87, 89, 89, 91, 92, 93, 94, 95, 99. Find the percentile rank for a score of 85 on this test 2) The heights of students in inches in Block 3 math class are 55, 59, 59, 60, 61, 63, 64, 64, 65, 68, 68, 69, 72, 74. Find the percentile rank for a height of 61 inches. 3) 4) 31
34 5) Twenty of Mr. Greco s physics students recently took a quiz. The results of this quiz are shown in the following box-and-whiskers diagram. Assume that all scores are whole numbers (a) What is the median score of the math quizzes? (b) What is the range of the scores on the math quizzes? (c) Mr. Greco regularly sets the passing grade on his quizzes to be the score of the lower quartile. What is the passing grade on this quiz? (d) What is the highest score on Mr. Greco s quiz? 6) 7) 32

 What is the number of itunes at the 25th percentile? d.")
35 8) The number of itunes downloaded by 25 students in one week ranges from 15 to 55. The box-and-whisker plot below depicts this data. For this data: a.) What is the minimum number of itunes downloaded? b.) What is the maximum number of itunes downloaded? c.) What is the number of itunes at the 25th percentile? d.) What is the number of itunes at the 50th percentile? e.) What is the number of itunes at the 75th percentile? 33
36 Chapter A (Day 5) Characterizing Data SWBAT: Distinguish between different types of data Warm Up Example 1: Differentiating Between Qualitative Data and Quantitative Data Qualitative Data: is data that is descriptive but not numeric. For example, if you ask your classmates, how do you feel about studying algebra? you may get qualitative responses like interesting, difficult, and challenging. Quantitative Data: refers to data that is represented by counts or measurements. For example, a list showing the numbers of students taking Mathematics, English, and Social Studies is a quantitative data list. 34


37 Freshman Class Practice For questions 1 4, determine if the data listed is quantitative data or qualitative data. 35


38 Example 2: Differentiating Between Univariate Data and Bivariate Data Data may be used to represent one variable, such as h for the heights of NBA players. Data that represents one concept or variable is called univariate data. Univariate data is often displayed in a frequency table, a histogram, a stem-and-leaf plot, or a box-and-whisker plot. Data that shows a relationship between two quantities is called bivariate data and requires two variables. The number of students in a school (n) and the yearly budget for the school (b) is an example of bivariate data. The data sets are related because the budget for a small school will be less than the budget for a large school. 36


39 Practice For questions 5 9, determine if the problem deals with univariate or bivariate data. 37

40 38

41 Example 3: Possibly Biased Data When viewing statistics, you should consider: Who collected the data? Does the group collecting the data have an interest in how the results turn out? Is the study a recent study, or did it occur decades ago? Could recent developments have changed the findings? What is the sample size of the study? How many people/items were studied? Is the data from a primary source? Or has the data been "condensed" by another group? Do the statistics show any bias? Example: A study on the hazards of cigarette smoking being done by a tobacco company. (may not be reliable findings - conflict of interest) Example: Decades past, second-hand cigarette smoke was found to not be hazardous. More recent findings prove that this is not true. (findings should be current) Example: A study is done on the favorite color of 14 year olds. The sample group for the study is Mrs. Smith's third period class containing 20 students. (too few participants to generalize a finding to all 14 year olds) Example: The US Census Bureau collects data on US populations. A tabloid magazine publishes a synopsis of the findings. (the most reliable information comes from the original source - avoid the "Reader's Digest" condensed version by another publisher who may be interpreting the findings) Example: The study of how many people can walk a balance beam is conducted with students from a gymnastics class. (the results are biased due to the very specific selection of the participants) For questions 10-13, determine if the situation is biased. 39

42 Homework: 40
43 Practice Tell whether each data set is qualitative or quantitative. 1. The number of persons per square mile in each state. 2. An inventory list at a used CD store describing each in-stock item as excellent condition, very good condition, good condition, or poor condition. 3. A restaurant survey rating its food presentation as unique, tasteful, or ordinary. 4. The ages of people who flew from San Francisco to New York City in December Shopping: A survey conducted at an outlet mall asked shoppers to rate the success of their visit as very successful, somewhat successful, or not successful. Tell whether each data set is univariate or bivariate. Then create an appropriate display to represent the data. 6. The ages of the first ten presidents of the United States at their inauguration: {57, 61, 57, 57, 58, 57, 61, 54, 68, 51} 7. The elevations above sea level of the Great Lakes: Erie, 569ft; Huron, 577ft; Michigan, 577ft; Ontario, 243ft; Superior, 600ft. 41

44 8. Meteorology: The heat index is a measure of how hot it feels outside when the humidity changes. The table below gives the heat index for different levels of humidity when the actual temperature is 90 F. Is this data univariate or bivariate? 9. A survey completed at a large university asked 2, 000 students to estimate the average number of hours they spend studying each week. Every tenth student entering the library was surveyed. The data showed that the mean number of hours that students spend studying was 15.7 per week. Which characteristic of the survey could create a bias in the results? 1) The size of the sample 2) The size of the population 3) The method of analyzing the data 4) The method of choosing the students who were surveyed 10. Which of these questions is a biased question? 1) Do you prefer yogurt or pudding for dessert? 2) Do you prefer to sit on the couch and watch TV or do you like to exercise and stay in shape? 3) What sport do you play? 4) What is your favorite food? 42

45 Summary Exit Ticket 43
46 Practice Problems Day 5 - Homework 1) Which situation describes a correlation that is not a causal relationship? (a) The rooster crows, and the Sun rises. (b) The more miles driven, the more gasoline needed. (c) The more powerful the microwave, the faster the food cooks. (d) The faster the pace of a runner, the quicker the runner finishes. 3) Which relationship can best be described as causal? (a) height and intelligence (b) shoe size and running speed (c) number of correct answers on a test and test score (d) number of students in a class and number of students with brown hair 5) Which data set describes a situation that could be classified as qualitative? (a) the ages of the students in Ms. Marshall s Spanish class (b) the test scores of the students in Ms. Fitzgerald s class (c) the favorite ice cream flavor of each of Mr. Hayden s students (d) the heights of the players on the East High School basketball team 7) Which method of collecting data would most likely result in an unbiased random sample? (a) selecting every third teenager leaving a movie theater to answer a survey about entertainment (b) placing a survey in a local newspaper to determine how people voted in the 2004 presidential election (c) selecting students by the last digit of their school ID number to participate in a survey about cafeteria food (d) surveying honor students taking Mathematics B to determine the average amount of time students in a school spend doing homework each night 2) Which situation should be analyzed using bivariate data? (a) Ms. Saleem keeps a list of the amount of time her daughter spends on her social studies homework. (b) Mr. Benjamin tries to see if his students shoe sizes are directly related to their heights. (c) Mr. DeStefan records his customers best video game scores during the summer. (d) Mr. Chan keeps track of his daughter s algebra grades for the quarter. 4) Which data set describes a situation that could be classified as qualitative? (a) the elevations of the five highest mountains in the world (b) the ages of presidents at the time of their inauguration (c) the opinions of students regarding school lunches (d) the shoe sizes of players on the basketball team 6) A school wants to add a coed soccer program. To determine student interest in the program, a survey will be taken. In order to get an unbiased sample, which group should the school survey? (a) every third student entering the building (b) every member of the varsity football team (c) every member in Ms. Zimmer s drama classes (d) every student having a second-period French class 8) A survey is being conducted to determine which types of television programs people watch. Which survey and location combination would likely contain the most bias? (a) surveying 10 people who work in a sporting goods store (b) surveying the first 25 people who enter a grocery store (c) randomly surveying 50 people during the day in a mall (d) randomly surveying 75 people during the day in a clothing store 44
47 Chapter A (Day 6)Trend Lines SWBAT: Create trend lines to make predictions. Warm Up Definition: A scatter plot is a graph with points plotted to show a possible relationship between two sets of data. Describing Correlations from a Scatter Plot Definition A correlation describes a relationship between two data sets. A graph may show the correlation between data. 45
 Choose the scatter plot that best represents the relationship between the age of a car and the amount of money spent")
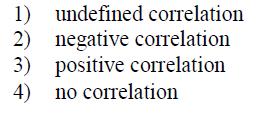
48 Directions: Describe the correlation between the variables as positive, negative, or no correlation. Matching Scatter Plots to Situations 1) Choose the scatter plot that best represents the relationship between the age of a car and the amount of money spent each year on repairs. Explain. GRAPH A GRAPH B GRAPH C 46
 The table shows the percent of people ages 18 24 who report they voted in the presidential elections.")
49 2) Choose the scatter plot that best represents the relationship between the number of minutes since a pie has been taken out of the oven and the temperature of the pie. Explain. GRAPH A GRAPH B GRAPH C Graphing a Scatter Plot from Given Data 1) The table shows the percent of people ages who report they voted in the presidential elections. Graph a scatter plot using the given data. b) Describe the correlation: 47
50 2) The table shows the number of soft drinks sold as a small restaurant from 11:00 am to 1:00 pm. (a) Graph a scatter plot using the given data. (b) Describe the correlation: 3) The table shows the average salary (rounded to the nearest hundred) for one type of worker, listed by decade. (a) Graph a scatter plot using the given data. (b) Describe the correlation: (c) Draw a trend line and determine the equation. (d) Based on the trend line, what is your prediction for the average salary in
51 4) Neal kept track of the number of minutes it took him to assemble sandwiches at his restaurant. The information is in the table below. (a) Create a scatter plot using the table. (b) Describe the correlation: (c) Draw a trend line and determine the equation. (d) Based on the trend line, what is your prediction for the time it will take to assemble 14 sandwiches. 49
52 5) The average number of gallons of coffee per person consumed in the United States is shown in the table below. (a) Create a scatter plot using the table. (b) Describe the correlation: (c) Draw a trend line and determine the equation. (d) Based on the trend line, what is your prediction for the number of gallons of coffee consumed in

53 SUMMARY Exit Ticket 51
54 Day 6 Scatter Plots HW 52
55 53
56 Data and Statistics Review Day 7 Find the mean, median, mode, and range for the following sets of data listed below. 1) 13, 14, 15 2) 5, 6, 7, 7, 8, 9 Mean: Median: Mean: Median: Mode: Range: Mode: Range: 3) 20, 20, 20, 20 4) 15, 6, 2, 8, 5, 10, 16, 12 Mean: Median: Mean: Median: Mode: Range: Mode: Range: 5) Rosario and Enrique are in the same mathematics class. On the first five tests, Rosario received scores of 78, 77, 64, 86, and 70. Enrique received scores of 90, 61, 79, 73, and 87. How much higher was Enrique s average than Rosario s average? 6) From January 3 to January 7, Buffalo recorded the following daily high temperatures: 5, 7, 6, 5, and 7. Which statement about the temperatures is true? (a) 15 points (b) 2 points (c) 3 points (d) 4 points (a) mean = median (b) mean = mode (c) median = mode (d) mean median 54
57 The accompanying box-and-whisker plot represents the scores earned on a science test. 7) According to the diagram shown, what is the median score? (a) 75 (c) 85 (b) 70 (d) 77 8) According to the diagram shown, what score represents the first quartile? (a) 55 (c) 100 (b) 70 (d) 75 9) What statement is not true about the box and whisker plot shown? (a) 75 represents the mean score (b) 100 represents the maximum score (c) 85 represents the 3rd quartile (d) 55 represents the minimum score 10) A score of an 85 on the box-and-whisker plot shown refers to (a) the third quartile (b) the maximum score (c) the median (d) the mean The number of text messages 10 different students sent in 1 day is shown in the box-and-whisker plot below. 11) What is the minimum number of text messages sent according to the plot shown? (a) 0 (c) 2 (b) 20 (d) 8 12) What number is at the 50th percentile according to the plot shown? (a) 12 (c) 8 (b) 14 (d) 10 13) According to the plot shown, between what two numbers does half of the data lie? (a) 10 and 12 (c) 8 and 12 (b) 8 and 14 (d) 2 and 20 14) According to the plot shown, how many text messages are at the 75th percentile (upper quartile)? (a) 15 (c) 12 (b) 13.5 (d) 14 55
58 15) Create a box-and-whisker plot for the following set of data. Label minimum, Q1, median (Q2), Q3, and maximum. 20, 15, 45, 33, 19, 30, 31, 32, 31, 30, 27, 34, 50, 22, 29, 30 16) Make a box-and-whisker plot from the following data sets. Plot A Plot B Plot C Initial weights of 14 women in a weight loss study, in pounds (February): Weights of the same women one month later (March): Weights of the same women two months later (April): Plot A Plot B Plot C Compare the data in A and C. (a) How did the median change? (b) How did the minimum weight change? (c) How did the maximum weight change? (d) How would you judge the effectiveness of the weight loss method used in the study? 56

 25 (c) 57 (b) 50 (d) 20 18) According to the table shown, how many people received a score of 48 or less?")
 5 (c) 9 (b) 14 (d) 41 20) The accompanying histogram shows the heights of the students in Kyra's health class.")

 28 (c) 26 (b) 49 (d) 11 23) The test scores for 10 students in Ms.")
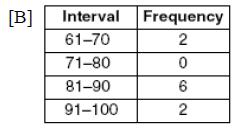
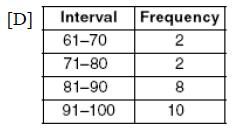
59 In order to pass a driver's safety course, a person must answer at least 45 out 50 questions correctly. The cumulative histogram below gives the scores of a group of people who passed the exam. 17) According to the table shown, how many total people passed the driver's safety exam? (a) 25 (c) 57 (b) 50 (d) 20 18) According to the table shown, how many people received a score of 48 or less? (a) 23 (c) 9 (b) 11 (d) 25 19) According to the table shown, how many people answered 49 questions correctly? (a) 5 (c) 9 (b) 14 (d) 41 20) The accompanying histogram shows the heights of the students in Kyra's health class. 21) The accompanying histogram shows the height distribution for students in a high school mathematics class. What is the total number of students in the class? (a) 15 (c) 209 (b) 16 (d) 5 22) Using the cumulative frequency table, how many students received a test score between a 70-79? What is the total number of students in the class? (a) 28 (c) 26 (b) 49 (d) 11 23) The test scores for 10 students in Ms. Sampson's homeroom were 61, 67, 81, 83, 87, 88, 89, 90, 98, and 100. Which frequency table is accurate for this set of data? (a) 0 (c) 80 (b) 12 (d) 26 (a) (c) (b) (d) 57
60 24) The number of calls from motorists per day for roadside service was recorded for the month of December The results were as follows: Set up a frequency table for this set of data values. Interval Tally Frequency Fill in the cumulative frequency table and create a cumulative histogram for this set of data values. Interval Cumulative Frequency 58

61 Day 8 - Chapter 10A Review Data Analysis SWBAT: Apply Their Knowledge on Data Analysis 1. According to the box-and-whisker plot shown below, what is the third quartile value? [A] 70 [B] 80 [C] 90 [D] Data regarding the students in the senior class: 578 students, 236 honor students, 150 scholarship winners, 51% male. This data can be described as being [A] qualitative [B] quantitative [C] both [D] neither 3. The correlation seen in the graph at the right would be best described as: [A] high positive correlation [B] low positive correlation [C] high negative correlation [D] low negative correlation 4. 59

62 5. 6. What is the total number of children in the families of the students in a ninth grade class? [A] 25 [B] 10 [C] 16 [D] 5 60

63 7. 8. Karen has grades of 90, 80, and 84 on three History exams. What grade must she obtain on the next test to have an average of exactly 88 for the four exams? [A] 60 [B] 88 [C] 98 [D] 95 Part II Show all work! 9. On a math test, 18 students received the following scores: 95, 90, 90, 90, 85, 85, 85, 85, 80, 80, 80, 75, 75, 75, 70, 65, 65, 55 Use the data to make a stem-and-leaf plot. 61
64 10. a. Which interval contains the median? b. Which interval contains the lower quartile? c. Which interval contains the upper quartile? a) Complete the cumulative frequency table above. b) 62
Measures of the Location of the Data
 OpenStax-CNX module m46930 1 Measures of the Location of the Data OpenStax College This work is produced by OpenStax-CNX and licensed under the Creative Commons Attribution License 3.0 The common measures
STT 231 Test 1. Fill in the Letter of Your Choice to Each Question in the Scantron. Each question is worth 2 point.
 STT 231 Test 1 Fill in the Letter of Your Choice to Each Question in the Scantron. Each question is worth 2 point. 1. A professor has kept records on grades that students have earned in his class. If he
Probability and Statistics Curriculum Pacing Guide
 Unit 1 Terms PS.SPMJ.3 PS.SPMJ.5 Plan and conduct a survey to answer a statistical question. Recognize how the plan addresses sampling technique, randomization, measurement of experimental error and methods
AP Statistics Summer Assignment 17-18
 AP Statistics Summer Assignment 17-18 Welcome to AP Statistics. This course will be unlike any other math class you have ever taken before! Before taking this course you will need to be competent in basic
Student s Edition. Grade 6 Unit 6. Statistics. Eureka Math. Eureka Math
 Student s Edition Grade 6 Unit 6 Statistics Eureka Math Eureka Math Lesson 1 Lesson 1: Posing Statistical Questions Statistics is about using data to answer questions. In this module, the following four
Algebra 2- Semester 2 Review
 Name Block Date Algebra 2- Semester 2 Review Non-Calculator 5.4 1. Consider the function f x 1 x 2. a) Describe the transformation of the graph of y 1 x. b) Identify the asymptotes. c) What is the domain
Algebra 1, Quarter 3, Unit 3.1. Line of Best Fit. Overview
 Algebra 1, Quarter 3, Unit 3.1 Line of Best Fit Overview Number of instructional days 6 (1 day assessment) (1 day = 45 minutes) Content to be learned Analyze scatter plots and construct the line of best
Broward County Public Schools G rade 6 FSA Warm-Ups
 Day 1 1. A florist has 40 tulips, 32 roses, 60 daises, and 50 petunias. Draw a line from each comparison to match it to the correct ratio. A. tulips to roses B. daises to petunias C. roses to tulips D.
Edexcel GCSE. Statistics 1389 Paper 1H. June Mark Scheme. Statistics Edexcel GCSE
 Edexcel GCSE Statistics 1389 Paper 1H June 2007 Mark Scheme Edexcel GCSE Statistics 1389 NOTES ON MARKING PRINCIPLES 1 Types of mark M marks: method marks A marks: accuracy marks B marks: unconditional
Chapters 1-5 Cumulative Assessment AP Statistics November 2008 Gillespie, Block 4
 Chapters 1-5 Cumulative Assessment AP Statistics Name: November 2008 Gillespie, Block 4 Part I: Multiple Choice This portion of the test will determine 60% of your overall test grade. Each question is
STA 225: Introductory Statistics (CT)
") Marshall University College of Science Mathematics Department STA 225: Introductory Statistics (CT) Course catalog description A critical thinking course in applied statistical reasoning covering basic
Marshall University College of Science Mathematics Department STA 225: Introductory Statistics (CT) Course catalog description A critical thinking course in applied statistical reasoning covering basic
Math Grade 3 Assessment Anchors and Eligible Content
 Math Grade 3 Assessment Anchors and Eligible Content www.pde.state.pa.us 2007 M3.A Numbers and Operations M3.A.1 Demonstrate an understanding of numbers, ways of representing numbers, relationships among
Mathacle PSet Stats, Concepts in Statistics and Probability Level Number Name: Date:
 1 st Quarterly Exam ~ Sampling, Designs, Exploring Data and Regression Part 1 Review I. SAMPLING MC I-1.) [APSTATSMC2014-6M] Approximately 52 percent of all recent births were boys. In a simple random
Sample Problems for MATH 5001, University of Georgia
 Sample Problems for MATH 5001, University of Georgia 1 Give three different decimals that the bundled toothpicks in Figure 1 could represent In each case, explain why the bundled toothpicks can represent
Paper 2. Mathematics test. Calculator allowed. First name. Last name. School KEY STAGE TIER
 259574_P2 5-7_KS3_Ma.qxd 1/4/04 4:14 PM Page 1 Ma KEY STAGE 3 TIER 5 7 2004 Mathematics test Paper 2 Calculator allowed Please read this page, but do not open your booklet until your teacher tells you
Simple Random Sample (SRS) & Voluntary Response Sample: Examples: A Voluntary Response Sample: Examples: Systematic Sample Best Used When
 & Voluntary Response Sample: Examples: A Voluntary Response Sample: Examples: Systematic Sample Best Used When") Simple Random Sample (SRS) & Voluntary Response Sample: In statistics, a simple random sample is a group of people who have been chosen at random from the general population. A simple random sample is
Simple Random Sample (SRS) & Voluntary Response Sample: In statistics, a simple random sample is a group of people who have been chosen at random from the general population. A simple random sample is
Grade 6: Correlated to AGS Basic Math Skills
 Grade 6: Correlated to AGS Basic Math Skills Grade 6: Standard 1 Number Sense Students compare and order positive and negative integers, decimals, fractions, and mixed numbers. They find multiples and
Lesson M4. page 1 of 2
 Lesson M4 page 1 of 2 Miniature Gulf Coast Project Math TEKS Objectives 111.22 6b.1 (A) apply mathematics to problems arising in everyday life, society, and the workplace; 6b.1 (C) select tools, including
Statistical Studies: Analyzing Data III.B Student Activity Sheet 7: Using Technology
 Suppose data were collected on 25 bags of Spud Potato Chips. The weight (to the nearest gram) of the chips in each bag is listed below. 25 28 23 26 23 25 25 24 24 27 23 24 28 27 24 26 24 25 27 26 25 26
Characteristics of Functions
 Characteristics of Functions Unit: 01 Lesson: 01 Suggested Duration: 10 days Lesson Synopsis Students will collect and organize data using various representations. They will identify the characteristics
Association Between Categorical Variables
 Student Outcomes Students use row relative frequencies or column relative frequencies to informally determine whether there is an association between two categorical variables. Lesson Notes In this lesson,
AGS THE GREAT REVIEW GAME FOR PRE-ALGEBRA (CD) CORRELATED TO CALIFORNIA CONTENT STANDARDS
 CORRELATED TO CALIFORNIA CONTENT STANDARDS") AGS THE GREAT REVIEW GAME FOR PRE-ALGEBRA (CD) CORRELATED TO CALIFORNIA CONTENT STANDARDS 1 CALIFORNIA CONTENT STANDARDS: Chapter 1 ALGEBRA AND WHOLE NUMBERS Algebra and Functions 1.4 Students use algebraic
AGS THE GREAT REVIEW GAME FOR PRE-ALGEBRA (CD) CORRELATED TO CALIFORNIA CONTENT STANDARDS 1 CALIFORNIA CONTENT STANDARDS: Chapter 1 ALGEBRA AND WHOLE NUMBERS Algebra and Functions 1.4 Students use algebraic
May To print or download your own copies of this document visit Name Date Eurovision Numeracy Assignment
 1. An estimated one hundred and twenty five million people across the world watch the Eurovision Song Contest every year. Write this number in figures. 2. Complete the table below. 2004 2005 2006 2007
The following shows how place value and money are related. ones tenths hundredths thousandths
 2-1 The following shows how place value and money are related. ones tenths hundredths thousandths (dollars) (dimes) (pennies) (tenths of a penny) Write each fraction as a decimal and then say it. 1. 349
Shockwheat. Statistics 1, Activity 1
 Statistics 1, Activity 1 Shockwheat Students require real experiences with situations involving data and with situations involving chance. They will best learn about these concepts on an intuitive or informal
OVERVIEW OF CURRICULUM-BASED MEASUREMENT AS A GENERAL OUTCOME MEASURE
 OVERVIEW OF CURRICULUM-BASED MEASUREMENT AS A GENERAL OUTCOME MEASURE Mark R. Shinn, Ph.D. Michelle M. Shinn, Ph.D. Formative Evaluation to Inform Teaching Summative Assessment: Culmination measure. Mastery
Office Hours: Mon & Fri 10:00-12:00. Course Description
 1 State University of New York at Buffalo INTRODUCTION TO STATISTICS PSC 408 4 credits (3 credits lecture, 1 credit lab) Fall 2016 M/W/F 1:00-1:50 O Brian 112 Lecture Dr. Michelle Benson mbenson2@buffalo.edu
Unit 3 Ratios and Rates Math 6
 Number of Days: 20 11/27/17 12/22/17 Unit Goals Stage 1 Unit Description: Students study the concepts and language of ratios and unit rates. They use proportional reasoning to solve problems. In particular,
Quantitative Research Questionnaire
 Quantitative Research Questionnaire Surveys are used in practically all walks of life. Whether it is deciding what is for dinner or determining which Hollywood film will be produced next, questionnaires
The Editor s Corner. The. Articles. Workshops. Editor. Associate Editors. Also In This Issue
 The S tatistics T eacher N etwork www.amstat.org/education/stn Number 73 ASA/NCTM Joint Committee on the Curriculum in Statistics and Probability Fall 2008 The Editor s Corner We hope you enjoy Issue 73
Introduction to the Practice of Statistics
 Chapter 1: Looking at Data Distributions Introduction to the Practice of Statistics Sixth Edition David S. Moore George P. McCabe Bruce A. Craig Statistics is the science of collecting, organizing and
Research Design & Analysis Made Easy! Brainstorming Worksheet
 Brainstorming Worksheet 1) Choose a Topic a) What are you passionate about? b) What are your library s strengths? c) What are your library s weaknesses? d) What is a hot topic in the field right now that
Math-U-See Correlation with the Common Core State Standards for Mathematical Content for Third Grade
 Math-U-See Correlation with the Common Core State Standards for Mathematical Content for Third Grade The third grade standards primarily address multiplication and division, which are covered in Math-U-See
Introducing the New Iowa Assessments Mathematics Levels 12 14
 Introducing the New Iowa Assessments Mathematics Levels 12 14 ITP Assessment Tools Math Interim Assessments: Grades 3 8 Administered online Constructed Response Supplements Reading, Language Arts, Mathematics
Lesson 12. Lesson 12. Suggested Lesson Structure. Round to Different Place Values (6 minutes) Fluency Practice (12 minutes)
 Fluency Practice (12 minutes)") Objective: Solve multi-step word problems using the standard addition reasonableness of answers using rounding. Suggested Lesson Structure Fluency Practice Application Problems Concept Development Student
Objective: Solve multi-step word problems using the standard addition reasonableness of answers using rounding. Suggested Lesson Structure Fluency Practice Application Problems Concept Development Student
Name Class Date. Graphing Proportional Relationships
 Name Class Date Practice 5-1 Graphing Proportional Relationships 5-1 Graphing Proportional Relationships 1. An electronics store has a frequent shopper program. The buyer earns 4 points for every movie
State University of New York at Buffalo INTRODUCTION TO STATISTICS PSC 408 Fall 2015 M,W,F 1-1:50 NSC 210
 1 State University of New York at Buffalo INTRODUCTION TO STATISTICS PSC 408 Fall 2015 M,W,F 1-1:50 NSC 210 Dr. Michelle Benson mbenson2@buffalo.edu Office: 513 Park Hall Office Hours: Mon & Fri 10:30-12:30
About the Mathematics in This Unit
 (PAGE OF 2) About the Mathematics in This Unit Dear Family, Our class is starting a new unit called Puzzles, Clusters, and Towers. In this unit, students focus on gaining fluency with multiplication strategies.
Ohio s Learning Standards-Clear Learning Targets
 Ohio s Learning Standards-Clear Learning Targets Math Grade 1 Use addition and subtraction within 20 to solve word problems involving situations of 1.OA.1 adding to, taking from, putting together, taking
Answer Key For The California Mathematics Standards Grade 1
 Introduction: Summary of Goals GRADE ONE By the end of grade one, students learn to understand and use the concept of ones and tens in the place value number system. Students add and subtract small numbers
What s Different about the CCSS and Our Current Standards?
 The Common Core State Standards and CPM Educational Program The Need for Change in Our Educational System: College and Career Readiness Students are entering into a world that most of us would have found
Diagnostic Test. Middle School Mathematics
 Diagnostic Test Middle School Mathematics Copyright 2010 XAMonline, Inc. All rights reserved. No part of the material protected by this copyright notice may be reproduced or utilized in any form or by
Montana Content Standards for Mathematics Grade 3. Montana Content Standards for Mathematical Practices and Mathematics Content Adopted November 2011
 Montana Content Standards for Mathematics Grade 3 Montana Content Standards for Mathematical Practices and Mathematics Content Adopted November 2011 Contents Standards for Mathematical Practice: Grade
The lab is designed to remind you how to work with scientific data (including dealing with uncertainty) and to review experimental design.
 and to review experimental design.") Name: Partner(s): Lab #1 The Scientific Method Due 6/25 Objective The lab is designed to remind you how to work with scientific data (including dealing with uncertainty) and to review experimental design.
Name: Partner(s): Lab #1 The Scientific Method Due 6/25 Objective The lab is designed to remind you how to work with scientific data (including dealing with uncertainty) and to review experimental design.
MINUTE TO WIN IT: NAMING THE PRESIDENTS OF THE UNITED STATES
 MINUTE TO WIN IT: NAMING THE PRESIDENTS OF THE UNITED STATES THE PRESIDENTS OF THE UNITED STATES Project: Focus on the Presidents of the United States Objective: See how many Presidents of the United States
The New York City Department of Education. Grade 5 Mathematics Benchmark Assessment. Teacher Guide Spring 2013
 The New York City Department of Education Grade 5 Mathematics Benchmark Assessment Teacher Guide Spring 2013 February 11 March 19, 2013 2704324 Table of Contents Test Design and Instructional Purpose...
Introduction to Questionnaire Design
 Introduction to Questionnaire Design Why this seminar is necessary! Bad questions are everywhere! Don t let them happen to you! Fall 2012 Seminar Series University of Illinois www.srl.uic.edu The first
UNIT ONE Tools of Algebra
 UNIT ONE Tools of Algebra Subject: Algebra 1 Grade: 9 th 10 th Standards and Benchmarks: 1 a, b,e; 3 a, b; 4 a, b; Overview My Lessons are following the first unit from Prentice Hall Algebra 1 1. Students
Dublin City Schools Mathematics Graded Course of Study GRADE 4
 I. Content Standard: Number, Number Sense and Operations Standard Students demonstrate number sense, including an understanding of number systems and reasonable estimates using paper and pencil, technology-supported
SOCIAL STUDIES GRADE 1. Clear Learning Targets Office of Teaching and Learning Curriculum Division FAMILIES NOW AND LONG AGO, NEAR AND FAR
 SOCIAL STUDIES FAMILIES NOW AND LONG AGO, NEAR AND FAR GRADE 1 Clear Learning Targets 2015-2016 Aligned with Ohio s Learning Standards for Social Studies Office of Teaching and Learning Curriculum Division
Math 96: Intermediate Algebra in Context
 : Intermediate Algebra in Context Syllabus Spring Quarter 2016 Daily, 9:20 10:30am Instructor: Lauri Lindberg Office Hours@ tutoring: Tutoring Center (CAS-504) 8 9am & 1 2pm daily STEM (Math) Center (RAI-338)
CONSTRUCTION OF AN ACHIEVEMENT TEST Introduction One of the important duties of a teacher is to observe the student in the classroom, laboratory and
 CONSTRUCTION OF AN ACHIEVEMENT TEST Introduction One of the important duties of a teacher is to observe the student in the classroom, laboratory and in other settings. He may also make use of tests in
Functional Maths Skills Check E3/L x
 Functional Maths Skills Check E3/L1 Name: Date started: The Four Rules of Number + - x May 2017. Kindly contributed by Nicola Smith, Gloucestershire College. Search for Nicola on skillsworkshop.org Page
MGF 1106 Final Exam Review / (sections )
") MGF 1106 Final Exam Review / (sections ---------) Time of Common Final Exam: Place of Common Final Exam (Sections ----------- only): --------------- Those students with a final exam conflict (with another
MGF 1106 Final Exam Review / (sections ---------) Time of Common Final Exam: Place of Common Final Exam (Sections ----------- only): --------------- Those students with a final exam conflict (with another
(I couldn t find a Smartie Book) NEW Grade 5/6 Mathematics: (Number, Statistics and Probability) Title Smartie Mathematics
 NEW Grade 5/6 Mathematics: (Number, Statistics and Probability) Title Smartie Mathematics") (I couldn t find a Smartie Book) NEW Grade 5/6 Mathematics: (Number, Statistics and Probability) Title Smartie Mathematics Lesson/ Unit Description Questions: How many Smarties are in a box? Is it the
(I couldn t find a Smartie Book) NEW Grade 5/6 Mathematics: (Number, Statistics and Probability) Title Smartie Mathematics Lesson/ Unit Description Questions: How many Smarties are in a box? Is it the
MATH Study Skills Workshop
 MATH Study Skills Workshop Become an expert math student through understanding your personal learning style, by incorporating practical memory skills, and by becoming proficient in test taking. 11/30/15
Common Core State Standards
 Common Core State Standards Common Core State Standards 7.NS.3 Solve real-world and mathematical problems involving the four operations with rational numbers. Mathematical Practices 1, 3, and 4 are aspects
HWS Colleges' Social Norms Surveys Online. Survey of Student-Athlete Norms
 http://www.hws.edu/alcohol/aodsurvey/hwsath/ Page 1 of 1 HWS Colleges' Social Norms Surveys Online Survey of Student-Athlete Norms Username: Password: Please Login Login http://www.hws.edu/alcohol/aodsurvey/hwsath/index.pl
Pre-AP Geometry Course Syllabus Page 1
 Pre-AP Geometry Course Syllabus 2015-2016 Welcome to my Pre-AP Geometry class. I hope you find this course to be a positive experience and I am certain that you will learn a great deal during the next
Like much of the country, Detroit suffered significant job losses during the Great Recession.
 36 37 POPULATION TRENDS Economy ECONOMY Like much of the country, suffered significant job losses during the Great Recession. Since bottoming out in the first quarter of 2010, however, the city has seen
Grades. From Your Friends at The MAILBOX
 From Your Friends at The MAILBOX Grades 5 6 TEC916 High-Interest Math Problems to Reinforce Your Curriculum Supports NCTM standards Strengthens problem-solving and basic math skills Reinforces key problem-solving
Math 121 Fundamentals of Mathematics I
 I. Course Description: Math 121 Fundamentals of Mathematics I Math 121 is a general course in the fundamentals of mathematics. It includes a study of concepts of numbers and fundamental operations with
Problem of the Month: Movin n Groovin
 : The Problems of the Month (POM) are used in a variety of ways to promote problem solving and to foster the first standard of mathematical practice from the Common Core State Standards: Make sense of
Level 1 Mathematics and Statistics, 2015
 91037 910370 1SUPERVISOR S Level 1 Mathematics and Statistics, 2015 91037 Demonstrate understanding of chance and data 9.30 a.m. Monday 9 November 2015 Credits: Four Achievement Achievement with Merit
Mathematics process categories
 Mathematics process categories All of the UK curricula define multiple categories of mathematical proficiency that require students to be able to use and apply mathematics, beyond simple recall of facts
Mathematics subject curriculum
 Mathematics subject curriculum Dette er ei omsetjing av den fastsette læreplanteksten. Læreplanen er fastsett på Nynorsk Established as a Regulation by the Ministry of Education and Research on 24 June
The Federal Reserve Bank of New York
 The Federal Reserve Bank of New York Teacher s Guide Federal Reserve Bank of New York Public Information Department 33 Liberty Street New York, NY 10045 Econ Explorers is a product of the Federal Reserve
Learning Disability Functional Capacity Evaluation. Dear Doctor,
 Dear Doctor, I have been asked to formulate a vocational opinion regarding NAME s employability in light of his/her learning disability. To assist me with this evaluation I would appreciate if you can
Junior Scheduling Assembly. February 22, 2017
 Junior Scheduling Assembly February 22, 2017 Graduation Requirements State Assessments Assessment Requirements New Jersey Biology Competency Test Taken when enrolled in Biology course PARCC English Language
Missouri Mathematics Grade-Level Expectations
 A Correlation of to the Grades K - 6 G/M-223 Introduction This document demonstrates the high degree of success students will achieve when using Scott Foresman Addison Wesley Mathematics in meeting the
Extending Place Value with Whole Numbers to 1,000,000
 Grade 4 Mathematics, Quarter 1, Unit 1.1 Extending Place Value with Whole Numbers to 1,000,000 Overview Number of Instructional Days: 10 (1 day = 45 minutes) Content to Be Learned Recognize that a digit
Paper Reference. Edexcel GCSE Mathematics (Linear) 1380 Paper 1 (Non-Calculator) Foundation Tier. Monday 6 June 2011 Afternoon Time: 1 hour 30 minutes
 1380 Paper 1 (Non-Calculator) Foundation Tier. Monday 6 June 2011 Afternoon Time: 1 hour 30 minutes") Centre No. Candidate No. Paper Reference 1 3 8 0 1 F Paper Reference(s) 1380/1F Edexcel GCSE Mathematics (Linear) 1380 Paper 1 (Non-Calculator) Foundation Tier Monday 6 June 2011 Afternoon Time: 1 hour
Centre No. Candidate No. Paper Reference 1 3 8 0 1 F Paper Reference(s) 1380/1F Edexcel GCSE Mathematics (Linear) 1380 Paper 1 (Non-Calculator) Foundation Tier Monday 6 June 2011 Afternoon Time: 1 hour
Functional Skills Mathematics Level 2 assessment
 Functional Skills Mathematics Level 2 assessment www.cityandguilds.com September 2015 Version 1.0 Marking scheme ONLINE V2 Level 2 Sample Paper 4 Mark Represent Analyse Interpret Open Fixed S1Q1 3 3 0
Interpreting Graphs Middle School Science
 Middle School Free PDF ebook Download: Download or Read Online ebook interpreting graphs middle school science in PDF Format From The Best User Guide Database. Rain, Rain, Go Away When the student council
Grade Band: High School Unit 1 Unit Target: Government Unit Topic: The Constitution and Me. What Is the Constitution? The United States Government
 The Constitution and Me This unit is based on a Social Studies Government topic. Students are introduced to the basic components of the U.S. Constitution, including the way the U.S. government was started
Left, Left, Left, Right, Left
 Lesson.1 Skills Practice Name Date Left, Left, Left, Right, Left Compound Probability for Data Displayed in Two-Way Tables Vocabulary Write the term that best completes each statement. 1. A two-way table
Science Fair Project Handbook
 Science Fair Project Handbook IDENTIFY THE TESTABLE QUESTION OR PROBLEM: a) Begin by observing your surroundings, making inferences and asking testable questions. b) Look for problems in your life or surroundings
JUNIOR HIGH SPORTS MANUAL GRADES 7 & 8
 JUNIOR HIGH SPORTS MANUAL GRADES 7 & 8 The purpose of this Junior High Sports Manual is to clarify the rules and regulations for seventh and eighth grade girls athletics for the member schools of the Iowa
Unit 3: Lesson 1 Decimals as Equal Divisions
 Unit 3: Lesson 1 Strategy Problem: Each photograph in a series has different dimensions that follow a pattern. The 1 st photo has a length that is half its width and an area of 8 in². The 2 nd is a square
Visit us at:
 White Paper Integrating Six Sigma and Software Testing Process for Removal of Wastage & Optimizing Resource Utilization 24 October 2013 With resources working for extended hours and in a pressurized environment,
Foothill College Summer 2016
 Foothill College Summer 2016 Intermediate Algebra Math 105.04W CRN# 10135 5.0 units Instructor: Yvette Butterworth Text: None; Beoga.net material used Hours: Online Except Final Thurs, 8/4 3:30pm Phone:
MULTIPLE CHOICE. Choose the one alternative that best completes the statement or answers the question.
 Ch 2 Test Remediation Work Name MULTIPLE CHOICE. Choose the one alternative that best completes the statement or answers the question. Provide an appropriate response. 1) High temperatures in a certain
MODULE FRAMEWORK AND ASSESSMENT SHEET
 MODULE FRAMEWORK AND ASSESSMENT SHEET LEARNING OUTCOMES (LOS) ASSESSMENT STANDARDS (ASS) FORMATIVE ASSESSMENT ASs Pages and (mark out of ) LOs (ave. out of ) SUMMATIVE ASSESSMENT Tasks or tests Ave for
A 1,200 B 1,300 C 1,500 D 1,700
 North arolina Testing Program EOG Mathematics Grade Sample Items Goal. There are eighty-six thousand four hundred seconds in a day. How else could this number be written? 80,06. Jenny s vacation money
learning collegiate assessment]
![learning collegiate assessment]](/thumbs/71/66063392.jpg "learning collegiate assessment]") [ collegiate learning assessment] INSTITUTIONAL REPORT 2005 2006 Kalamazoo College council for aid to education 215 lexington avenue floor 21 new york new york 10016-6023 p 212.217.0700 f 212.661.9766
[ collegiate learning assessment] INSTITUTIONAL REPORT 2005 2006 Kalamazoo College council for aid to education 215 lexington avenue floor 21 new york new york 10016-6023 p 212.217.0700 f 212.661.9766
Mathematics Success Level E
 T403 [OBJECTIVE] The student will generate two patterns given two rules and identify the relationship between corresponding terms, generate ordered pairs, and graph the ordered pairs on a coordinate plane.
BENCHMARK MA.8.A.6.1. Reporting Category
 Grade MA..A.. Reporting Category BENCHMARK MA..A.. Number and Operations Standard Supporting Idea Number and Operations Benchmark MA..A.. Use exponents and scientific notation to write large and small
Numeracy Medium term plan: Summer Term Level 2C/2B Year 2 Level 2A/3C
 Numeracy Medium term plan: Summer Term Level 2C/2B Year 2 Level 2A/3C Using and applying mathematics objectives (Problem solving, Communicating and Reasoning) Select the maths to use in some classroom
BAYLOR COLLEGE OF MEDICINE ACADEMY WEEKLY INSTRUCTIONAL AGENDA 8 th Grade 02/20/ /24/2017
 BAYLOR COLLEGE OF MEDICINE ACADEMY WEEKLY INSTRUCTIONAL AGENDA 8 th Grade 02/20/2017 02/24/2017 ANNOUNCEMENTS AND REMINDERS 8 th GRADE END-OF-YEAR ACTIVITIES 8 th Grade Activities Week May 15 to May 18
TCC Jim Bolen Math Competition Rules and Facts. Rules:
 TCC Jim Bolen Math Competition Rules and Facts Rules: The Jim Bolen Math Competition is composed of two one hour multiple choice pre-calculus tests. The first test is scheduled on Friday, November 8, 2013
Grade 2: Using a Number Line to Order and Compare Numbers Place Value Horizontal Content Strand
 Grade 2: Using a Number Line to Order and Compare Numbers Place Value Horizontal Content Strand Texas Essential Knowledge and Skills (TEKS): (2.1) Number, operation, and quantitative reasoning. The student
Preliminary Chapter survey experiment an observational study that is not a survey
 1 Preliminary Chapter P.1 Getting data from Jamie and her friends is convenient, but it does not provide a good snapshot of the opinions held by all young people. In short, Jamie and her friends are not
St Math Teacher Login
 St Math Login Free PDF ebook Download: St Math Login Download or Read Online ebook st math teacher login in PDF Format From The Best User Guide Database Ace Arms. Login Instructions. : karlahill6. Student:
Miami-Dade County Public Schools
 ENGLISH LANGUAGE LEARNERS AND THEIR ACADEMIC PROGRESS: 2010-2011 Author: Aleksandr Shneyderman, Ed.D. January 2012 Research Services Office of Assessment, Research, and Data Analysis 1450 NE Second Avenue,
Trends in College Pricing
 Trends in College Pricing 2009 T R E N D S I N H I G H E R E D U C A T I O N S E R I E S T R E N D S I N H I G H E R E D U C A T I O N S E R I E S Highlights Published Tuition and Fee and Room and Board
Lesson 17: Write Expressions in Which Letters Stand for Numbers
 Write Expressions in Which Letters Stand for Numbers Student Outcomes Students write algebraic expressions that record all operations with numbers and/or letters standing for the numbers. Lesson Notes
A Guide to Adequate Yearly Progress Analyses in Nevada 2007 Nevada Department of Education
 A Guide to Adequate Yearly Progress Analyses in Nevada 2007 Nevada Department of Education Note: Additional information regarding AYP Results from 2003 through 2007 including a listing of each individual
Section 7, Unit 4: Sample Student Book Activities for Teaching Listening
 Section 7, Unit 4: Sample Student Book Activities for Teaching Listening I. ACTIVITIES TO PRACTICE THE SOUND SYSTEM 1. Listen and Repeat for elementary school students. It could be done as a pre-listening
NOT SO FAIR AND BALANCED:
 NOT SO FAIR AND BALANCED: ANALYZING BIAS IN THE MEDIA by Daniella Schmidt, IHE M.Ed. graduate PURPOSE This lesson plan helps high school students take a closer look at prejudices, the biases that media
What's My Value? Using "Manipulatives" and Writing to Explain Place Value. by Amanda Donovan, 2016 CTI Fellow David Cox Road Elementary School
 What's My Value? Using "Manipulatives" and Writing to Explain Place Value by Amanda Donovan, 2016 CTI Fellow David Cox Road Elementary School This curriculum unit is recommended for: Second and Third Grade