Some Things Every Biologist Should Know About Machine Learning
|
|
|
- Loren May
- 6 years ago
- Views:
Transcription


1 Some Things Every Biologist Should Know About Machine Learning Artificial Intelligence is no substitute for the real thing. Robert Gentleman
2 Types of Machine Learning Supervised Learning classification Unsupervised Learning clustering class discovery Feature Selection identification of features associated with good prediction
3 Components of Machine Learning features: which variables or attributes of the samples are going to be used to cluster or classify distance: what method will we use to decide whether two samples are similar or not model: how do we cluster or classify eg: knn, neural nets, hierarchical clustering
4 Components of Machine Learning Once these have been selected (or a set of candidates) we can use cross-validation to: 1. estimate the generalization error 2. perform model selection (could select distance or features as well) 3. feature selection (in a different way to 2)
5 An Experiment to be concrete I will consider a microarray experiment but similar considerations arise for almost all genomic experiments in this experiment Affymetrix chips were used the data consist of N (say 100) samples, associated phenotypic data and expression estimates for G probes (~10,000 genes)
6 An Experiment supervised learning is used to see if the expression estimates can reliably predict phenotype feature selection is the process of determining which genes are the best predictors of a particular phenotype unsupervised machine learning is applied to determine how many different classes or groups there are
7 Getting to Know Your Data statisticians call this EDA (Exploratory Data Analysis) it generally consists of some model free examinations of the data to ensure some general consistency with expectations
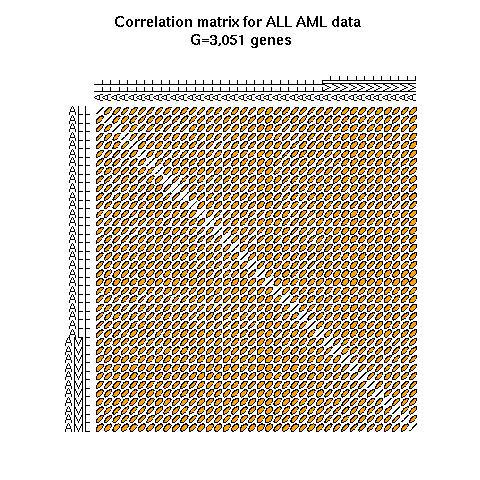
8 Correlation matrices
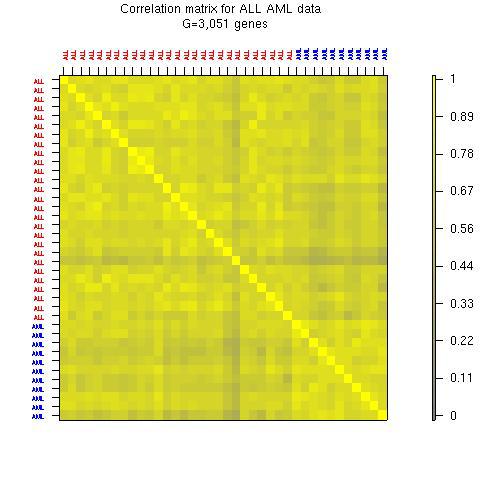
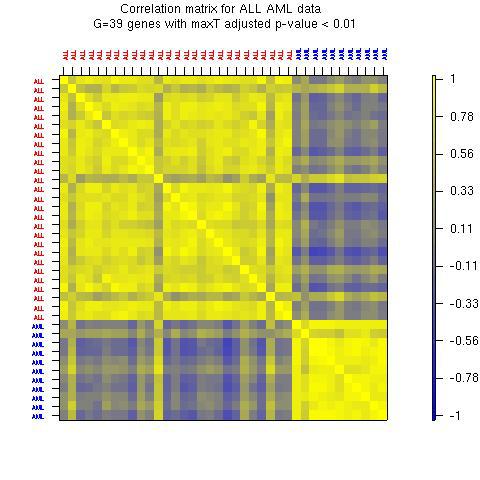
9 Correlation matrices
10 Distances inherent in all machine learning is the notion of distance there are very many different distances (Euclidean, Manhatten, 1-correlation) the choice of distance is important and in general substantially affects the outcome the choice of distance should be made carefully
11 Distances distances can be thought of as matrices where the value in row i column j is the distance between sample i and sample j (or between genes i and j) these matrices are called distance matrices in most cases they are symmetric
12 Distances clustering methods work directly on the distance matrix Nearest-Neighbor classifiers use distance directly Linear Discriminant Analysis uses Mahalanobis distance Support Vector Machines are based on Euclidean distance between observations
13 Distances the Correlation distance red-blue is red-gray is blue-gray is Euclidean distance: red-blue is 9.45 red-gray is Distances blue-gray is
14 Distance it is not simple to select the distance function you should decide what you are looking for patterns of expression in a time course experiment genes related because they are affected by the same transcription factor samples with known phenotypes and related expression profiles
15 Distances: Time-course you might want genes that are correlated anti-correlated lagged 1-correlation is the correct distance only for the first one of these correlation measures linear association and is not resistant (one outlier can ruin it)
16 Correlations gone wrong y corr=0.04 y corr= x x
17 Distances: Transcription Factors suppose that we can induce a specific transcription factor we might want to find all direct targets does anyone know what the pattern of expression should be? use some known targets to help select a distance
18 Distances: Phenotype T-ALL can be classified according to their stage of differentiation (T1,T2,T3,T4) this is done on the basis of the detection of antigens on the surface of the cell these antigens can be directly associated with a gene look at the expression of those genes and use that to help find/select genes like the known ones
19 Multidimensional Scaling distance data is very high dimensional if we have N samples and G genes then distance between sample i and j is in G dimensional space this is very hard to visualize and hence methods that can reduce that dimensionality to two or three dimensions are interesting but only if they provide a reasonable reduction of the data
20 MDS three main ways of doing this classical MDS Sammon mapping places more emphasis on smaller dissimilarities Shepard-Kruskal non-metric scaling based on the order of the distances not their values
21 MDS the quality of the representation in k dimensions will depend on the magnitude of the first k eigenvalues. The data analyst should choose a value for k that is small enough for ease representation but also corresponds to a substantial proportion of the distance matrix explained.
22 Classical MDS
23 Classical MDS λ1 + λ λι 2 = λ1 + λ 2 + λ λι = 0.55
24 MDS N.B. The MDS solution reflects not only the choice of a distance function, but also the features selected. If features were selected to separate the data into two groups (e.g., on the basis of two-sample t- statistics), it should come as no surprise that an MDS plot has two groups. In this instance MDS is not a confirmatory approach.
25 λ1 + λ λι 2 = 0.63 λ1 + λ λι 2 = 0.88
26 Supervised Learning the general problem: Identify mrna expression patterns that reliably predict phenotype.
27 Supervised Learning: 4 Steps 1. feature selection: includes transformation, eg: log(x), x/y, etc 2. model selection: involves distance selection 3. training set: used to determine the model parameters 4. test set: should be independent of the training set and it is used to assess the performance of the classifier from Step 2
28 Supervised Learning: Goal To identify a set of features, a predictor (classifier) and all parameters of the predictor so that if presented (with a new sample we can predict its class with an error rate that is similar to that obtained in Step 4).
29 Supervised Learning: Problems to reliably estimate the error rate will require an enormous sample (if it is small) therefore the test set is wasteful in practice; samples are expensive and valuable if there are lots of features we cannot hope to explore all possible variants there are too many models there are too many distances
30 A Simpler Goal we want some form of generalizability we want to select features and a model that are appropriate for prediction of new cases (not looking for Mr. Right but rather Mr. NotTooWrong) all models are wrong, but some models are useful
31 Supervised Learning training error/prediction error: this is the error rate on the training sample the training error is overly optimistic the test error/generalization error: is the error rate that will occur when a new independent sample is used (randomly chosen from the population of interest)
32 Supervised Learning there is sometimes benefit in considering class specific error rates some classes may be easy to predict and others hard especially if classes are not equally represented in the sample (or if we want to treat the errors differently)
33 Machine Learning: Mathematics Let Y denote the true class and X denote features chosen from the available set X Suppose that Y = f(x) + ε so the true class is some function f of the features plus some random error so we must extract X from X then estimate model parameters to get finally get y ˆ = fˆ( X ) fˆ
34 Machine Learning: Mathematics the training set gives us observations for which we know both y and x the true class and the features we select the parameters of the model so that we minimize (in some way) the errors e.g. we want to find functions that minimize ( ) y fˆ( x ) 2 i i there are an infinite number of functions that make this zero
35 Supervised Learning so we must put some restrictions on the class of models that we will consider it is also worth observing at this time that model complexity is clearly an issue more complex models fit better in any comparison of models it is essential that the complexity be adjusted for Occam s Razor: we prefer simple explanations to complex ones
36 Supervised Learning bias: the difference between what is being predicted and the truth variance: the variability in the estimates generally low bias and low variance are preferred it is difficult to achieve this
37 Model Complexity High Bias Low Variance Low Bias High Variance Prediction Error Test Sample Training Sample Low High Model Complexity
38 Supervised Learning The classifier can make one of three decisions: classify the sample according to one of the phenotypic groups doubt: it cannot decide which group outlier: it does not believe the sample belongs to any group
39 Supervised Learning Suppose that sample i has feature vector x The decision made by the classifier is called f ˆ( x ) and the true class is y We need to measure the cost of identifying the class as f ˆ( x ) when the truth is y this is called the loss function the loss will be zero if the classifier is correct and something positive if it is not
40 Loss Functions loss functions are important concepts because they can put different weights on different errors for example, mistakenly identifying a patient who will not achieve remission as one who will is probably less of problem than the reverse we can make that loss/cost much higher
41 Feature Selection in most of our experiments the features must be selected part of what we want to say is that we have found a certain set of features (genes) that can accurately predict phenotype in this case it is important that feature selection be included in any error estimation process
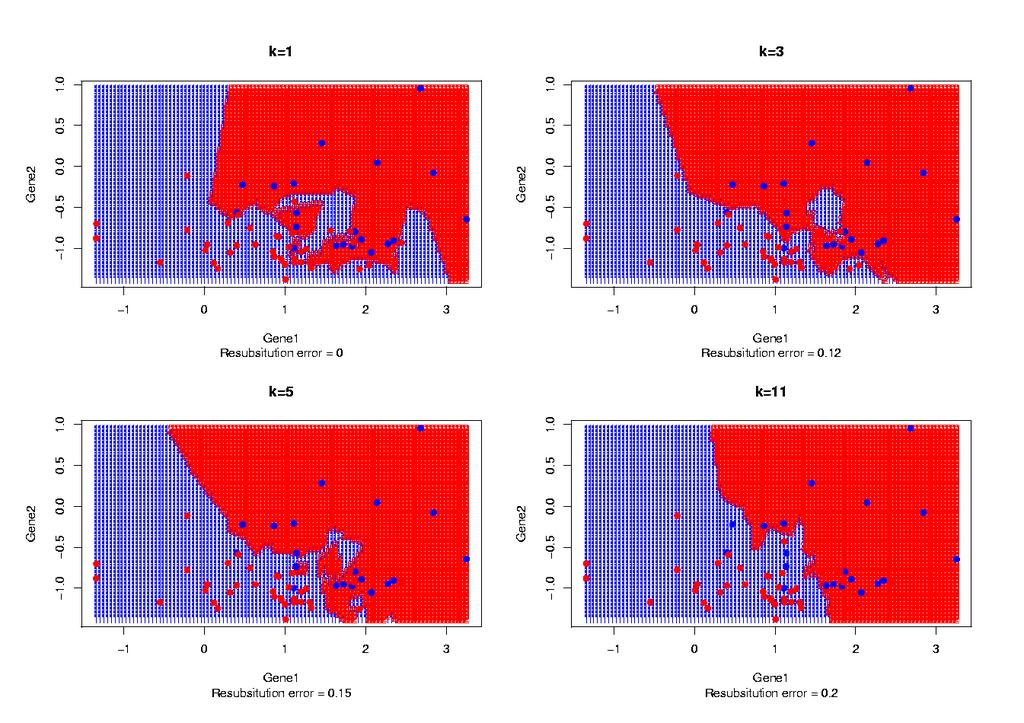
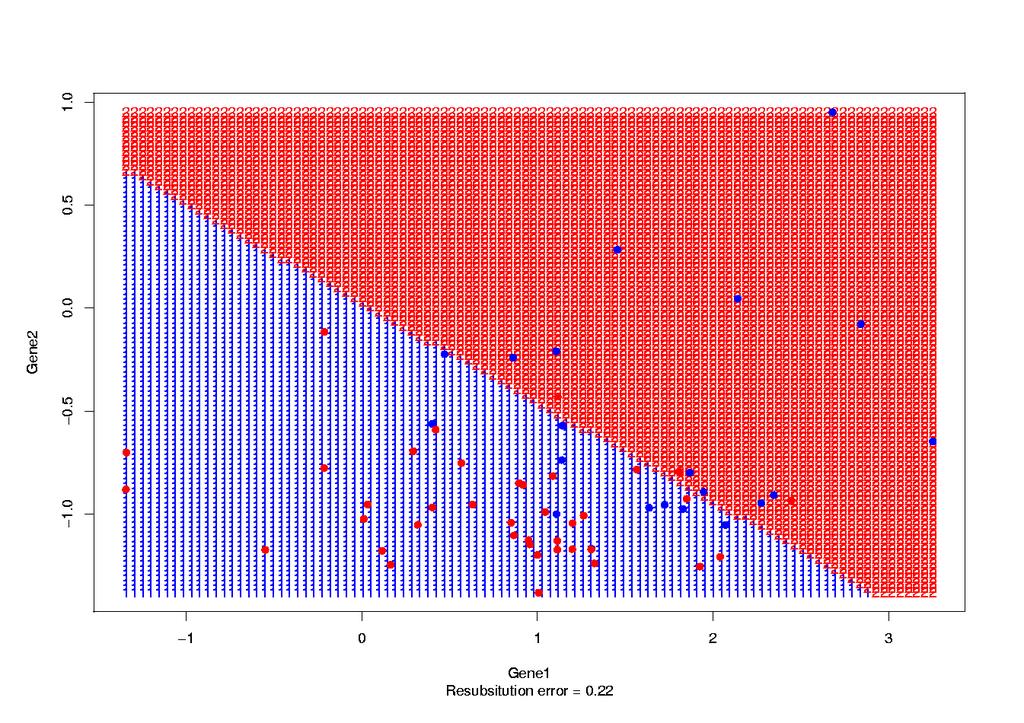
42 Classifiers k-nn classifiers the predicted class for the new sample is that of the k-nns doubt will be declared if there is not a majority (or if the number required is too small) outlier will be declared if the new sample is too far from the original data
43 k-nn Classifier Orange Red Doubt Outlier
44 k-nn larger values of k correspond to less complex models they typically have low variance but high bias small values of k (k=1) are more complex models they typically have high variance but low bias
45
46 Discriminant Analysis we contrast the k-nn approach with linear and quadratic discriminant analysis (lda, qda) lda seeks to find a linear combination of the features which maximizes the ratio of its between-group variance to its within group variance qda seeks a quadratic function (and hence is a more complex model)
47 QDA LDA
48 Cross-validation while keeping a separate test set is conceptually a good idea it is wasteful of data some sample reuse ideas should help us to make the most of our data without unduly biasing the estimates of the predictive capability of the model (if applied correctly)
49 Cross-validation the general principle is quite simple our complete sample is divided into two parts the model is fit on one part and the fit assessed on the other part this can be repeated many times; each time we get an estimate of the error rate the estimates are correlated, but that s ok, we just want to average them
50 Cross-validation leave-one-out is the most popular each sample is left out in turn, then the model fit on the remaining N-1 samples the left out sample is supplied and its class predicted the average of the prediction errors is used to estimate the training error
51 Cross-validation this is a low bias (since N-1 is close to N we are close to the operating characteristics of the test) but high variance there are arguments that suggest leaving out more observations each time would be better the bias increases but may be more than offset but the reduction in variance
52 Cross-validation Uses include estimating the error rate model selection: try a bunch of models choose the one with the lowest crossvalidation error rate feature selection: select features that provide good prediction in most of the subsamples
53 General Comments there is in general no best classifier (there are some theorems in this regard) it is very important to realize that if one classifier works very poorly and you try a different classifier which works very well, then someone has probably made a mistake! the advantages to SVM or k-nn, for example, are not generally so large that one works and the other doesn t
54 Unsupervised Learning in statistics this is known as clustering in some fields it is known as class discovery the basic idea is to determine how many groups there are in your data and which variables seem to define the groupings the number of possible groups is generally huge and so some stochastic component is generally needed
55 What is clustering? Clustering algorithms are methods to divide a set of n observations into g groups so that within group similarities are larger than between group similarities the number of groups, g, is generally unknown and must be selected in some way implicitly we must have already selected both features and a distance!
56 Clustering the application of clustering is very much an art there are interactions between the distance being used and the method one difference between this and classification is that there is no training sample and the groups are unknown before the process begins unlike classification (supervised learning) there is no easy way to use cross-validation
57 Clustering class discovery: we want to find new and interesting groups in our data to do a good job the features, the distance and the clustering algorithm will have to be considered with some care the appropriate choices will depend on the questions being asked and the available data
58 Clustering probably some role for outlier any group that contained an outlier would probably have a large value for any measure of within cluster homogeneity fuzzy clustering plays the role of doubt objects are assigned a weight (or probability of belonging to each cluster)
59 Clustering: QC one of the first things that a data analyst should do with normalized microarray data is to cluster the data the clusters should be compared to all known experimental features when the samples were assayed what reagents were used any batch effects
60 Clustering: QC if the clusters demonstrate a strong association with any of these characteristics it will be difficult to interpret the data it is important, therefore, to design your experiment do not do all the type A samples on day 1 and all the type B on day 2
61 Aside: Experimental Design do not randomly decide which day to do a sample instead you should block (and randomize within blocks) to ensure proper balance across all important factors e.g half of the A s should be done on day 1 and half on day 2, the same as for the B s (but random assignment won t give you that)
62 Clustering Two (and a half) types: hierarchical generate a hierarchy of clusters going from 1 cluster to n partitioning divide the data into g groups using some (re)allocation algorithm fuzzy clustering: each object has a set of weights suggesting the probability of it belonging to each cluster
63 Hierarchical Clustering Two types agglomerative start with n groups, join the two closest, continue divisive start with 1 group, split into 2, then into 3,, into n need both between observation distance and between group/cluster distance
64 Hierarchical Clustering between group distances single linkage distance between two clusters is the smallest distance between an element of each group average linkage distance between the two groups is the average of all pairwise distances complete linkage distance is the maximum
65 Hierarchical Clustering agglomerative clustering is not a good method to detect a few clusters divisive clustering is probably better divisive clustering is not deterministic (as implemented) the space of all possible splits is too large and we cannot explore all so we use some approximations
66 Hierarchical Clustering agglomerative: start with all objects in their own cluster then gradually combine the closest to many ways to do this but there is an exact solution divisive: start with all objects in the same group, split into two, then three, then until n
67 Dendrograms the output of a hierarchical clustering is usually presented as a dendrogram this is a tree structure with the observations at the bottom (the leafs) the height of the join indicates the distance between the left branch and the right branch
68 Dendrograms dendrograms are NOT visualization methods they do not reveal structure in data they impose structure on data the cophenetic correlation can be used to assess the degree to which the dendrogram induced distance agrees with the the distance measure used to compute the dendrogram
69 Cluster Dendrogram Q M V Z U X A I K B J D P E H T G S R W N C L Y F O 3 Groups or 26 N(0,1) rvs Height
70 Dendrograms the cophenetic correlation can help to determine whether the distances represented in the dendrogram reflect those used to construct it even if this correlation is high that is no guarantee that the dendrogram represents real clusters
71 Dendrogram for ALL- data: Coph = ALL T-cell ALL T-cell ALL T-cell ALL T-cell ALL T-cell ALL T-cell ALL T-cell ALL T-cell as.dist(d) Average linkage, correlation matrix, G=101 genes Height
72 the dendrogram was cut to give three groups Group Average Linkage ALL T-cell
73 Dendrogram for ALL- data: Coph = ALL T-cell ALL T-cell ALL T-cell ALL T-cell ALL T-cell ALL T-cell ALL T-cell ALL T-cell as.dist(d) Single linkage, correlation matrix, G= 101 genes Height
74 Single Linkage Group ALL T-cell
75 Dendrogram for ALL- data: Coph = ALL T-cell ALL T-cell ALL T-cell ALL T-cell ALL T-cell ALL T-cell ALL T-cell ALL T-cell as.dist(d) Complete linkage, correlation matrix, G= 101 genes Height
76 Complete Linkage Group ALL T-cell
77 Dendrogram for ALL- data; Coph = ALL T-cell ALL T-cell ALL T-cell ALL T-cell ALL T-cell ALL T-cell ALL T-cell ALL T-cell Divisive Algorithm, correlation matrix, G= 101 genes Height
78 Divisive Clustering Group ALL T-cell
79 Partitioning Methods the other broad class of clustering algorithms are the partitioning methods the user selects some number of groups, g group or cluster centers are determined and objects are assigned to some set of initial clusters some mechanism for moving points and updating cluster centers is used
80 Partitioning Methods many different methods for doing this but the general approach is as follows: select the number of groups, G divide the samples into G different groups (randomly) iteratively select observations and determine whether the overall gof will be improved by moving them to another group
81 Partitioning this algorithm is then applied to the data until some stopping criterion is met the solution is generally a local optimal not necessarily a global optimal the order in which the samples are examined can have an effect on the outcome this order is generally randomly selected
82 Partitioning Methods among the most popular of these methods are k-means PAM self-organizing maps
83 Partitioning Methods pam: partitioning around mediods cluster centers are actual examples we define a distance between samples and how many groups then we apply pam which sequentially moves the samples and updates the centers
84 PAM ALL/ pam was applied to the data from Golub et al. the results (for three groups) were: Group ALL T-cell
85 Bivariate cluster plot for ALL data Correlation matrix, K=3, G=101 genes Component ALL T-cell ALL ALL T-cell T-cell ALL T-cell ALL T-cell ALL T-cell ALL B-cell ALL B-cell ALL T-cell ALL T-cell Component 1 These two components explain % of the point variability.
86 PAM the next plot is called a silhouette plot each observation is represented by a horizontal bar the groups are slightly separated the length of a bar is a measure of how close the observation is to its assigned group (versus the others)
87 Silhouette plot of pam(x = as.dist(d), k = 3, diss = TRUE) ALL B ALL ALL B ALL ALL B ALL B ALL ALL B ALL B ALL ALL B ALL ALL B ALL ALL B ALL B ALL ALL B ALL T ALL ALL T ALL T ALL ALL T ALL T ALL ALL B n = 38 3 clusters C j j : n j ave i Cj s i 1 : : : Average silhouette width : 0.53 Silhouette width s i
88 How Many Groups do I have? this is a hard problem there are no known reliable answers you need to define more carefully what you mean by a group the next two slides ask whether there are four groups in the ALL/ data
89 Bivariate cluster plot for ALL data Correlation matrix, K=4, G=101 genes Component ALL T-cell ALL ALL T-cell T-cell ALL T-cell ALL T-cell ALL T-cell ALL B-cell ALL B-cell ALL T-cell ALL T-cell Component 1 These two components explain % of the point variability.
90 Silhouette plot of pam(x = as.dist(d), k = 4, diss = TRUE) ALL B ALL ALL B ALL ALL B ALL ALL B ALL ALL B ALL ALL T ALL ALL T ALL ALL T ALL ALL T ALL T ALL B ALL ALL B ALL ALL B ALL B ALL ALL B ALL B n = 38 4 clusters C j j : n j ave i Cj s i 1 : : : : Average silhouette width : 0.46 Silhouette width s i
91 How Many Groups for microarray experiments the question has often been stated more in terms of the samples by genes, false color displays there one is interested in finding relatively large blocks of genes with relatively large blocks of samples where the expression level is the same for all this is computationally very hard
92 Clustering Genomic Data in my examples (and in most applications I am aware of) I simply selected genes that looked like they differentiated the two major groups I could also do clustering on all 3,000-odd genes I could select genes according to pathway or GO category or and do a separate clustering for each
93 Clustering Genomic Data it seems to me that there is a lot to be gained from thinking about the features and trying to use some known biology using subsets of the features rather than all of them to see whether there are interesting groups could be quite enlightening this requires collaboration between biologists and statisticians
94 Clustering one of the biggest problems here is a lack of a common interface many different software programs all are slightly different many tools are not yet implemented this is changing as both computational biology and data mining have spurred an interest in this field
95 Feature Selection this is perhaps the hardest part of the machine learning process it is also very little studied and there are few references that can be used for guidance the field of data-mining offers some suggestions
96 Feature Selection in most problems we have far too many features and must do some reduction for our experiment many of the genes may not be expressed in the cell type under examination or they may not be differentially expressed in the phenotype of interest
97 Feature Selection non-specific feature selection is the process of selecting features that show some variation across our samples without regard to phenotype for example we could select genes that show a certain amount of variability
98 Feature Selection specific feature selection is the process of selecting features that align with or predict a particular phenotype for example we may select features that show a large fold change when comparing two groups of interest (patients in remission versus those for whom cancer has returned)
99 Feature Selection most feature selection is done univariately most models are multivariate we know, from the simplest setting, that the best two variable model may not contain the best single variable improved methods of feature selection are badly needed
100 Feature Selection: CV there are two different ways to consider using CV for feature selection have an algorithm for selecting features obtain M different sets of features for each set of features (with the distance and model fixed) compute the CV error select the set of features with the smallest error
101 Feature Selection: CV a different method is to put the feature selection method into the algorithm for each CV subset perform feature selection predict those excluded could select those features that were selected most often
102 Feature Selection: CV a slight twist would be to weight the features according to the subsample prediction error give those features involved in models that had good predictive capabilities higher select the features with the highest combined weight
103 Feature Selection if we want to find those features which best predict the duration of remission we must also use supervised learning (classification) to predict duration of remission then we must use some method for determining which features provide the best prediction we will return to this interesting question a bit later
104 Some References Classification, 2 nd ed., A. D. Gordon, Chapman & Hall (it s about clustering), 1999 Pattern Recognition and Neural Networks, B. D. Ripley, Cambridge Univ. Press, 1996 The Elements of Statistical Learning, T. Hastie, R. Tibshirani, J. Friedman, Springer, 2001 Pattern Classification, 2 nd ed., R. Duda, P. Hart and D. Stork, Wiley, Finding Groups in Data, L. Kaufman and P. J. Rousseeuw, Wiley, 1990.
105 Neural Networks a mechanism for making predictions they can be arbitrarily complex (some caution must be used when comparing to other methods) consist of a set of nodes arranged in layers
106 Neural Network Input Hidden Layer Output
107 Neural Networks each node (unit) sums its inputs, adds a constant to form the total input a node specific function function f k () is then applied to the total input to yield the total output the output then becomes the input for the next layer the output from the final layer constitutes the prediction
108 Neural Networks Linear Sigmoid Output Threshold Input
109 Neural Networks for a unit k we assume the output is given by y k = fk ( α k + w jk f j ( α j + wij xi )) j k i j to be useful we need to obtain values for the w ij this is difficult and is usually based on the use of a training set
110 Neural Networks convergence is difficult to assess: even when you have an independent test set it seems that one seldom needs more than one hidden layer to accommodate the problems we are encountering with microarrays more hidden layers imply a more complex model
111 Thanks Sabina Chiaretti Vincent Carey Sandrine Dudoit Beiying Ding Xiaochun Li Denise Scholtens Jeff Gentry Jianhua Zhang Jerome Ritz Alex Miron J. D. Iglehart A. Richardson
Lecture 1: Machine Learning Basics
 1/69 Lecture 1: Machine Learning Basics Ali Harakeh University of Waterloo WAVE Lab ali.harakeh@uwaterloo.ca May 1, 2017 2/69 Overview 1 Learning Algorithms 2 Capacity, Overfitting, and Underfitting 3
Python Machine Learning
 Python Machine Learning Unlock deeper insights into machine learning with this vital guide to cuttingedge predictive analytics Sebastian Raschka [ PUBLISHING 1 open source I community experience distilled
Module 12. Machine Learning. Version 2 CSE IIT, Kharagpur
 Module 12 Machine Learning 12.1 Instructional Objective The students should understand the concept of learning systems Students should learn about different aspects of a learning system Students should
(Sub)Gradient Descent
Gradient Descent") (Sub)Gradient Descent CMSC 422 MARINE CARPUAT marine@cs.umd.edu Figures credit: Piyush Rai Logistics Midterm is on Thursday 3/24 during class time closed book/internet/etc, one page of notes. will include
(Sub)Gradient Descent CMSC 422 MARINE CARPUAT marine@cs.umd.edu Figures credit: Piyush Rai Logistics Midterm is on Thursday 3/24 during class time closed book/internet/etc, one page of notes. will include
Artificial Neural Networks written examination
 1 (8) Institutionen för informationsteknologi Olle Gällmo Universitetsadjunkt Adress: Lägerhyddsvägen 2 Box 337 751 05 Uppsala Artificial Neural Networks written examination Monday, May 15, 2006 9 00-14
OCR for Arabic using SIFT Descriptors With Online Failure Prediction
 OCR for Arabic using SIFT Descriptors With Online Failure Prediction Andrey Stolyarenko, Nachum Dershowitz The Blavatnik School of Computer Science Tel Aviv University Tel Aviv, Israel Email: stloyare@tau.ac.il,
Introduction to Ensemble Learning Featuring Successes in the Netflix Prize Competition
 Introduction to Ensemble Learning Featuring Successes in the Netflix Prize Competition Todd Holloway Two Lecture Series for B551 November 20 & 27, 2007 Indiana University Outline Introduction Bias and
OPTIMIZATINON OF TRAINING SETS FOR HEBBIAN-LEARNING- BASED CLASSIFIERS
 OPTIMIZATINON OF TRAINING SETS FOR HEBBIAN-LEARNING- BASED CLASSIFIERS Václav Kocian, Eva Volná, Michal Janošek, Martin Kotyrba University of Ostrava Department of Informatics and Computers Dvořákova 7,
CS Machine Learning
 CS 478 - Machine Learning Projects Data Representation Basic testing and evaluation schemes CS 478 Data and Testing 1 Programming Issues l Program in any platform you want l Realize that you will be doing
Machine Learning and Data Mining. Ensembles of Learners. Prof. Alexander Ihler
 Machine Learning and Data Mining Ensembles of Learners Prof. Alexander Ihler Ensemble methods Why learn one classifier when you can learn many? Ensemble: combine many predictors (Weighted) combina
Assignment 1: Predicting Amazon Review Ratings
 Assignment 1: Predicting Amazon Review Ratings 1 Dataset Analysis Richard Park r2park@acsmail.ucsd.edu February 23, 2015 The dataset selected for this assignment comes from the set of Amazon reviews for
Software Maintenance
 1 What is Software Maintenance? Software Maintenance is a very broad activity that includes error corrections, enhancements of capabilities, deletion of obsolete capabilities, and optimization. 2 Categories
Rule Learning With Negation: Issues Regarding Effectiveness
 Rule Learning With Negation: Issues Regarding Effectiveness S. Chua, F. Coenen, G. Malcolm University of Liverpool Department of Computer Science, Ashton Building, Ashton Street, L69 3BX Liverpool, United
Issues in the Mining of Heart Failure Datasets
 International Journal of Automation and Computing 11(2), April 2014, 162-179 DOI: 10.1007/s11633-014-0778-5 Issues in the Mining of Heart Failure Datasets Nongnuch Poolsawad 1 Lisa Moore 1 Chandrasekhar
Australian Journal of Basic and Applied Sciences
 AENSI Journals Australian Journal of Basic and Applied Sciences ISSN:1991-8178 Journal home page: www.ajbasweb.com Feature Selection Technique Using Principal Component Analysis For Improving Fuzzy C-Mean
Twitter Sentiment Classification on Sanders Data using Hybrid Approach
 IOSR Journal of Computer Engineering (IOSR-JCE) e-issn: 2278-0661,p-ISSN: 2278-8727, Volume 17, Issue 4, Ver. I (July Aug. 2015), PP 118-123 www.iosrjournals.org Twitter Sentiment Classification on Sanders
Lecture 1: Basic Concepts of Machine Learning
 Lecture 1: Basic Concepts of Machine Learning Cognitive Systems - Machine Learning Ute Schmid (lecture) Johannes Rabold (practice) Based on slides prepared March 2005 by Maximilian Röglinger, updated 2010
STT 231 Test 1. Fill in the Letter of Your Choice to Each Question in the Scantron. Each question is worth 2 point.
 STT 231 Test 1 Fill in the Letter of Your Choice to Each Question in the Scantron. Each question is worth 2 point. 1. A professor has kept records on grades that students have earned in his class. If he
Softprop: Softmax Neural Network Backpropagation Learning
 Softprop: Softmax Neural Networ Bacpropagation Learning Michael Rimer Computer Science Department Brigham Young University Provo, UT 84602, USA E-mail: mrimer@axon.cs.byu.edu Tony Martinez Computer Science
Word Segmentation of Off-line Handwritten Documents
 Word Segmentation of Off-line Handwritten Documents Chen Huang and Sargur N. Srihari {chuang5, srihari}@cedar.buffalo.edu Center of Excellence for Document Analysis and Recognition (CEDAR), Department
Learning From the Past with Experiment Databases
 Learning From the Past with Experiment Databases Joaquin Vanschoren 1, Bernhard Pfahringer 2, and Geoff Holmes 2 1 Computer Science Dept., K.U.Leuven, Leuven, Belgium 2 Computer Science Dept., University
SARDNET: A Self-Organizing Feature Map for Sequences
 SARDNET: A Self-Organizing Feature Map for Sequences Daniel L. James and Risto Miikkulainen Department of Computer Sciences The University of Texas at Austin Austin, TX 78712 dljames,risto~cs.utexas.edu
Rule Learning with Negation: Issues Regarding Effectiveness
 Rule Learning with Negation: Issues Regarding Effectiveness Stephanie Chua, Frans Coenen, and Grant Malcolm University of Liverpool Department of Computer Science, Ashton Building, Ashton Street, L69 3BX
Mathematics process categories
 Mathematics process categories All of the UK curricula define multiple categories of mathematical proficiency that require students to be able to use and apply mathematics, beyond simple recall of facts
Probability and Statistics Curriculum Pacing Guide
 Unit 1 Terms PS.SPMJ.3 PS.SPMJ.5 Plan and conduct a survey to answer a statistical question. Recognize how the plan addresses sampling technique, randomization, measurement of experimental error and methods
Arizona s College and Career Ready Standards Mathematics
 Arizona s College and Career Ready Mathematics Mathematical Practices Explanations and Examples First Grade ARIZONA DEPARTMENT OF EDUCATION HIGH ACADEMIC STANDARDS FOR STUDENTS State Board Approved June
Math-U-See Correlation with the Common Core State Standards for Mathematical Content for Third Grade
 Math-U-See Correlation with the Common Core State Standards for Mathematical Content for Third Grade The third grade standards primarily address multiplication and division, which are covered in Math-U-See
Analysis of Hybrid Soft and Hard Computing Techniques for Forex Monitoring Systems
 Analysis of Hybrid Soft and Hard Computing Techniques for Forex Monitoring Systems Ajith Abraham School of Business Systems, Monash University, Clayton, Victoria 3800, Australia. Email: ajith.abraham@ieee.org
WHEN THERE IS A mismatch between the acoustic
 808 IEEE TRANSACTIONS ON AUDIO, SPEECH, AND LANGUAGE PROCESSING, VOL. 14, NO. 3, MAY 2006 Optimization of Temporal Filters for Constructing Robust Features in Speech Recognition Jeih-Weih Hung, Member,
Learning Methods for Fuzzy Systems
 Learning Methods for Fuzzy Systems Rudolf Kruse and Andreas Nürnberger Department of Computer Science, University of Magdeburg Universitätsplatz, D-396 Magdeburg, Germany Phone : +49.39.67.876, Fax : +49.39.67.8
Axiom 2013 Team Description Paper
 Axiom 2013 Team Description Paper Mohammad Ghazanfari, S Omid Shirkhorshidi, Farbod Samsamipour, Hossein Rahmatizadeh Zagheli, Mohammad Mahdavi, Payam Mohajeri, S Abbas Alamolhoda Robotics Scientific Association
Evolutive Neural Net Fuzzy Filtering: Basic Description
 Journal of Intelligent Learning Systems and Applications, 2010, 2: 12-18 doi:10.4236/jilsa.2010.21002 Published Online February 2010 (http://www.scirp.org/journal/jilsa) Evolutive Neural Net Fuzzy Filtering:
Knowledge Transfer in Deep Convolutional Neural Nets
 Knowledge Transfer in Deep Convolutional Neural Nets Steven Gutstein, Olac Fuentes and Eric Freudenthal Computer Science Department University of Texas at El Paso El Paso, Texas, 79968, U.S.A. Abstract
The 9 th International Scientific Conference elearning and software for Education Bucharest, April 25-26, / X
 The 9 th International Scientific Conference elearning and software for Education Bucharest, April 25-26, 2013 10.12753/2066-026X-13-154 DATA MINING SOLUTIONS FOR DETERMINING STUDENT'S PROFILE Adela BÂRA,
Why Did My Detector Do That?!
 Why Did My Detector Do That?! Predicting Keystroke-Dynamics Error Rates Kevin Killourhy and Roy Maxion Dependable Systems Laboratory Computer Science Department Carnegie Mellon University 5000 Forbes Ave,
Discriminative Learning of Beam-Search Heuristics for Planning
 Discriminative Learning of Beam-Search Heuristics for Planning Yuehua Xu School of EECS Oregon State University Corvallis,OR 97331 xuyu@eecs.oregonstate.edu Alan Fern School of EECS Oregon State University
A Neural Network GUI Tested on Text-To-Phoneme Mapping
 A Neural Network GUI Tested on Text-To-Phoneme Mapping MAARTEN TROMPPER Universiteit Utrecht m.f.a.trompper@students.uu.nl Abstract Text-to-phoneme (T2P) mapping is a necessary step in any speech synthesis
Grade 2: Using a Number Line to Order and Compare Numbers Place Value Horizontal Content Strand
 Grade 2: Using a Number Line to Order and Compare Numbers Place Value Horizontal Content Strand Texas Essential Knowledge and Skills (TEKS): (2.1) Number, operation, and quantitative reasoning. The student
On-the-Fly Customization of Automated Essay Scoring
 Research Report On-the-Fly Customization of Automated Essay Scoring Yigal Attali Research & Development December 2007 RR-07-42 On-the-Fly Customization of Automated Essay Scoring Yigal Attali ETS, Princeton,
Probabilistic Latent Semantic Analysis
 Probabilistic Latent Semantic Analysis Thomas Hofmann Presentation by Ioannis Pavlopoulos & Andreas Damianou for the course of Data Mining & Exploration 1 Outline Latent Semantic Analysis o Need o Overview
The Good Judgment Project: A large scale test of different methods of combining expert predictions
 The Good Judgment Project: A large scale test of different methods of combining expert predictions Lyle Ungar, Barb Mellors, Jon Baron, Phil Tetlock, Jaime Ramos, Sam Swift The University of Pennsylvania
Reducing Features to Improve Bug Prediction
 Reducing Features to Improve Bug Prediction Shivkumar Shivaji, E. James Whitehead, Jr., Ram Akella University of California Santa Cruz {shiv,ejw,ram}@soe.ucsc.edu Sunghun Kim Hong Kong University of Science
Statewide Framework Document for:
 Statewide Framework Document for: 270301 Standards may be added to this document prior to submission, but may not be removed from the framework to meet state credit equivalency requirements. Performance
Analysis of Emotion Recognition System through Speech Signal Using KNN & GMM Classifier
 IOSR Journal of Electronics and Communication Engineering (IOSR-JECE) e-issn: 2278-2834,p- ISSN: 2278-8735.Volume 10, Issue 2, Ver.1 (Mar - Apr.2015), PP 55-61 www.iosrjournals.org Analysis of Emotion
Comparison of EM and Two-Step Cluster Method for Mixed Data: An Application
 International Journal of Medical Science and Clinical Inventions 4(3): 2768-2773, 2017 DOI:10.18535/ijmsci/ v4i3.8 ICV 2015: 52.82 e-issn: 2348-991X, p-issn: 2454-9576 2017, IJMSCI Research Article Comparison
Class-Discriminative Weighted Distortion Measure for VQ-Based Speaker Identification
 Class-Discriminative Weighted Distortion Measure for VQ-Based Speaker Identification Tomi Kinnunen and Ismo Kärkkäinen University of Joensuu, Department of Computer Science, P.O. Box 111, 80101 JOENSUU,
Algebra 2- Semester 2 Review
 Name Block Date Algebra 2- Semester 2 Review Non-Calculator 5.4 1. Consider the function f x 1 x 2. a) Describe the transformation of the graph of y 1 x. b) Identify the asymptotes. c) What is the domain
Using the Attribute Hierarchy Method to Make Diagnostic Inferences about Examinees Cognitive Skills in Algebra on the SAT
 The Journal of Technology, Learning, and Assessment Volume 6, Number 6 February 2008 Using the Attribute Hierarchy Method to Make Diagnostic Inferences about Examinees Cognitive Skills in Algebra on the
QuickStroke: An Incremental On-line Chinese Handwriting Recognition System
 QuickStroke: An Incremental On-line Chinese Handwriting Recognition System Nada P. Matić John C. Platt Λ Tony Wang y Synaptics, Inc. 2381 Bering Drive San Jose, CA 95131, USA Abstract This paper presents
Unsupervised Learning of Word Semantic Embedding using the Deep Structured Semantic Model
 Unsupervised Learning of Word Semantic Embedding using the Deep Structured Semantic Model Xinying Song, Xiaodong He, Jianfeng Gao, Li Deng Microsoft Research, One Microsoft Way, Redmond, WA 98052, U.S.A.
Generative models and adversarial training
 Day 4 Lecture 1 Generative models and adversarial training Kevin McGuinness kevin.mcguinness@dcu.ie Research Fellow Insight Centre for Data Analytics Dublin City University What is a generative model?
Multivariate k-nearest Neighbor Regression for Time Series data -
 Multivariate k-nearest Neighbor Regression for Time Series data - a novel Algorithm for Forecasting UK Electricity Demand ISF 2013, Seoul, Korea Fahad H. Al-Qahtani Dr. Sven F. Crone Management Science,
A Comparison of Standard and Interval Association Rules
 A Comparison of Standard and Association Rules Choh Man Teng cmteng@ai.uwf.edu Institute for Human and Machine Cognition University of West Florida 4 South Alcaniz Street, Pensacola FL 325, USA Abstract
Disambiguation of Thai Personal Name from Online News Articles
 Disambiguation of Thai Personal Name from Online News Articles Phaisarn Sutheebanjard Graduate School of Information Technology Siam University Bangkok, Thailand mr.phaisarn@gmail.com Abstract Since online
Learning Optimal Dialogue Strategies: A Case Study of a Spoken Dialogue Agent for
 Learning Optimal Dialogue Strategies: A Case Study of a Spoken Dialogue Agent for Email Marilyn A. Walker Jeanne C. Fromer Shrikanth Narayanan walker@research.att.com jeannie@ai.mit.edu shri@research.att.com
AUTOMATIC DETECTION OF PROLONGED FRICATIVE PHONEMES WITH THE HIDDEN MARKOV MODELS APPROACH 1. INTRODUCTION
 JOURNAL OF MEDICAL INFORMATICS & TECHNOLOGIES Vol. 11/2007, ISSN 1642-6037 Marek WIŚNIEWSKI *, Wiesława KUNISZYK-JÓŹKOWIAK *, Elżbieta SMOŁKA *, Waldemar SUSZYŃSKI * HMM, recognition, speech, disorders
INPE São José dos Campos
 INPE-5479 PRE/1778 MONLINEAR ASPECTS OF DATA INTEGRATION FOR LAND COVER CLASSIFICATION IN A NEDRAL NETWORK ENVIRONNENT Maria Suelena S. Barros Valter Rodrigues INPE São José dos Campos 1993 SECRETARIA
CONSTRUCTION OF AN ACHIEVEMENT TEST Introduction One of the important duties of a teacher is to observe the student in the classroom, laboratory and
 CONSTRUCTION OF AN ACHIEVEMENT TEST Introduction One of the important duties of a teacher is to observe the student in the classroom, laboratory and in other settings. He may also make use of tests in
Data Integration through Clustering and Finding Statistical Relations - Validation of Approach
 Data Integration through Clustering and Finding Statistical Relations - Validation of Approach Marek Jaszuk, Teresa Mroczek, and Barbara Fryc University of Information Technology and Management, ul. Sucharskiego
The Method of Immersion the Problem of Comparing Technical Objects in an Expert Shell in the Class of Artificial Intelligence Algorithms
 IOP Conference Series: Materials Science and Engineering PAPER OPEN ACCESS The Method of Immersion the Problem of Comparing Technical Objects in an Expert Shell in the Class of Artificial Intelligence
COMPUTER-ASSISTED INDEPENDENT STUDY IN MULTIVARIATE CALCULUS
 COMPUTER-ASSISTED INDEPENDENT STUDY IN MULTIVARIATE CALCULUS L. Descalço 1, Paula Carvalho 1, J.P. Cruz 1, Paula Oliveira 1, Dina Seabra 2 1 Departamento de Matemática, Universidade de Aveiro (PORTUGAL)
Montana Content Standards for Mathematics Grade 3. Montana Content Standards for Mathematical Practices and Mathematics Content Adopted November 2011
 Montana Content Standards for Mathematics Grade 3 Montana Content Standards for Mathematical Practices and Mathematics Content Adopted November 2011 Contents Standards for Mathematical Practice: Grade
System Implementation for SemEval-2017 Task 4 Subtask A Based on Interpolated Deep Neural Networks
 System Implementation for SemEval-2017 Task 4 Subtask A Based on Interpolated Deep Neural Networks 1 Tzu-Hsuan Yang, 2 Tzu-Hsuan Tseng, and 3 Chia-Ping Chen Department of Computer Science and Engineering
Experiments with SMS Translation and Stochastic Gradient Descent in Spanish Text Author Profiling
 Experiments with SMS Translation and Stochastic Gradient Descent in Spanish Text Author Profiling Notebook for PAN at CLEF 2013 Andrés Alfonso Caurcel Díaz 1 and José María Gómez Hidalgo 2 1 Universidad
Speech Segmentation Using Probabilistic Phonetic Feature Hierarchy and Support Vector Machines
 Speech Segmentation Using Probabilistic Phonetic Feature Hierarchy and Support Vector Machines Amit Juneja and Carol Espy-Wilson Department of Electrical and Computer Engineering University of Maryland,
CSL465/603 - Machine Learning
 CSL465/603 - Machine Learning Fall 2016 Narayanan C Krishnan ckn@iitrpr.ac.in Introduction CSL465/603 - Machine Learning 1 Administrative Trivia Course Structure 3-0-2 Lecture Timings Monday 9.55-10.45am
Comparison of network inference packages and methods for multiple networks inference
 Comparison of network inference packages and methods for multiple networks inference Nathalie Villa-Vialaneix http://www.nathalievilla.org nathalie.villa@univ-paris1.fr 1ères Rencontres R - BoRdeaux, 3
Exploration. CS : Deep Reinforcement Learning Sergey Levine
 Exploration CS 294-112: Deep Reinforcement Learning Sergey Levine Class Notes 1. Homework 4 due on Wednesday 2. Project proposal feedback sent Today s Lecture 1. What is exploration? Why is it a problem?
Edexcel GCSE. Statistics 1389 Paper 1H. June Mark Scheme. Statistics Edexcel GCSE
 Edexcel GCSE Statistics 1389 Paper 1H June 2007 Mark Scheme Edexcel GCSE Statistics 1389 NOTES ON MARKING PRINCIPLES 1 Types of mark M marks: method marks A marks: accuracy marks B marks: unconditional
Truth Inference in Crowdsourcing: Is the Problem Solved?
 Truth Inference in Crowdsourcing: Is the Problem Solved? Yudian Zheng, Guoliang Li #, Yuanbing Li #, Caihua Shan, Reynold Cheng # Department of Computer Science, Tsinghua University Department of Computer
THE PENNSYLVANIA STATE UNIVERSITY SCHREYER HONORS COLLEGE DEPARTMENT OF MATHEMATICS ASSESSING THE EFFECTIVENESS OF MULTIPLE CHOICE MATH TESTS
 THE PENNSYLVANIA STATE UNIVERSITY SCHREYER HONORS COLLEGE DEPARTMENT OF MATHEMATICS ASSESSING THE EFFECTIVENESS OF MULTIPLE CHOICE MATH TESTS ELIZABETH ANNE SOMERS Spring 2011 A thesis submitted in partial
AGS THE GREAT REVIEW GAME FOR PRE-ALGEBRA (CD) CORRELATED TO CALIFORNIA CONTENT STANDARDS
 CORRELATED TO CALIFORNIA CONTENT STANDARDS") AGS THE GREAT REVIEW GAME FOR PRE-ALGEBRA (CD) CORRELATED TO CALIFORNIA CONTENT STANDARDS 1 CALIFORNIA CONTENT STANDARDS: Chapter 1 ALGEBRA AND WHOLE NUMBERS Algebra and Functions 1.4 Students use algebraic
AGS THE GREAT REVIEW GAME FOR PRE-ALGEBRA (CD) CORRELATED TO CALIFORNIA CONTENT STANDARDS 1 CALIFORNIA CONTENT STANDARDS: Chapter 1 ALGEBRA AND WHOLE NUMBERS Algebra and Functions 1.4 Students use algebraic
Learning Structural Correspondences Across Different Linguistic Domains with Synchronous Neural Language Models
 Learning Structural Correspondences Across Different Linguistic Domains with Synchronous Neural Language Models Stephan Gouws and GJ van Rooyen MIH Medialab, Stellenbosch University SOUTH AFRICA {stephan,gvrooyen}@ml.sun.ac.za
Evaluating Interactive Visualization of Multidimensional Data Projection with Feature Transformation
 Multimodal Technologies and Interaction Article Evaluating Interactive Visualization of Multidimensional Data Projection with Feature Transformation Kai Xu 1, *,, Leishi Zhang 1,, Daniel Pérez 2,, Phong
The Strong Minimalist Thesis and Bounded Optimality
 The Strong Minimalist Thesis and Bounded Optimality DRAFT-IN-PROGRESS; SEND COMMENTS TO RICKL@UMICH.EDU Richard L. Lewis Department of Psychology University of Michigan 27 March 2010 1 Purpose of this
12- A whirlwind tour of statistics
 CyLab HT 05-436 / 05-836 / 08-534 / 08-734 / 19-534 / 19-734 Usable Privacy and Security TP :// C DU February 22, 2016 y & Secu rivac rity P le ratory bo La Lujo Bauer, Nicolas Christin, and Abby Marsh
Maximizing Learning Through Course Alignment and Experience with Different Types of Knowledge
 Innov High Educ (2009) 34:93 103 DOI 10.1007/s10755-009-9095-2 Maximizing Learning Through Course Alignment and Experience with Different Types of Knowledge Phyllis Blumberg Published online: 3 February
Chapter 10 APPLYING TOPIC MODELING TO FORENSIC DATA. 1. Introduction. Alta de Waal, Jacobus Venter and Etienne Barnard
 Chapter 10 APPLYING TOPIC MODELING TO FORENSIC DATA Alta de Waal, Jacobus Venter and Etienne Barnard Abstract Most actionable evidence is identified during the analysis phase of digital forensic investigations.
Introduction to the Practice of Statistics
 Chapter 1: Looking at Data Distributions Introduction to the Practice of Statistics Sixth Edition David S. Moore George P. McCabe Bruce A. Craig Statistics is the science of collecting, organizing and
Digital Fabrication and Aunt Sarah: Enabling Quadratic Explorations via Technology. Michael L. Connell University of Houston - Downtown
 Digital Fabrication and Aunt Sarah: Enabling Quadratic Explorations via Technology Michael L. Connell University of Houston - Downtown Sergei Abramovich State University of New York at Potsdam Introduction
Course Outline. Course Grading. Where to go for help. Academic Integrity. EE-589 Introduction to Neural Networks NN 1 EE
 EE-589 Introduction to Neural Assistant Prof. Dr. Turgay IBRIKCI Room # 305 (322) 338 6868 / 139 Wensdays 9:00-12:00 Course Outline The course is divided in two parts: theory and practice. 1. Theory covers
Activities, Exercises, Assignments Copyright 2009 Cem Kaner 1
 Patterns of activities, iti exercises and assignments Workshop on Teaching Software Testing January 31, 2009 Cem Kaner, J.D., Ph.D. kaner@kaner.com Professor of Software Engineering Florida Institute of
Using focal point learning to improve human machine tacit coordination
 DOI 10.1007/s10458-010-9126-5 Using focal point learning to improve human machine tacit coordination InonZuckerman SaritKraus Jeffrey S. Rosenschein The Author(s) 2010 Abstract We consider an automated
Learning Methods in Multilingual Speech Recognition
 Learning Methods in Multilingual Speech Recognition Hui Lin Department of Electrical Engineering University of Washington Seattle, WA 98125 linhui@u.washington.edu Li Deng, Jasha Droppo, Dong Yu, and Alex
ReFresh: Retaining First Year Engineering Students and Retraining for Success
 ReFresh: Retaining First Year Engineering Students and Retraining for Success Neil Shyminsky and Lesley Mak University of Toronto lmak@ecf.utoronto.ca Abstract Student retention and support are key priorities
Build on students informal understanding of sharing and proportionality to develop initial fraction concepts.
 Recommendation 1 Build on students informal understanding of sharing and proportionality to develop initial fraction concepts. Students come to kindergarten with a rudimentary understanding of basic fraction
Historical maintenance relevant information roadmap for a self-learning maintenance prediction procedural approach
 IOP Conference Series: Materials Science and Engineering PAPER OPEN ACCESS Historical maintenance relevant information roadmap for a self-learning maintenance prediction procedural approach To cite this
An Online Handwriting Recognition System For Turkish
 An Online Handwriting Recognition System For Turkish Esra Vural, Hakan Erdogan, Kemal Oflazer, Berrin Yanikoglu Sabanci University, Tuzla, Istanbul, Turkey 34956 ABSTRACT Despite recent developments in
arxiv: v1 [math.at] 10 Jan 2016
![arxiv: v1 [math.at] 10 Jan 2016](/thumbs/72/66271209.jpg "arxiv: v1 [math.at] 10 Jan 2016") THE ALGEBRAIC ATIYAH-HIRZEBRUCH SPECTRAL SEQUENCE OF REAL PROJECTIVE SPECTRA arxiv:1601.02185v1 [math.at] 10 Jan 2016 GUOZHEN WANG AND ZHOULI XU Abstract. In this note, we use Curtis s algorithm and the
THE ALGEBRAIC ATIYAH-HIRZEBRUCH SPECTRAL SEQUENCE OF REAL PROJECTIVE SPECTRA arxiv:1601.02185v1 [math.at] 10 Jan 2016 GUOZHEN WANG AND ZHOULI XU Abstract. In this note, we use Curtis s algorithm and the
WE GAVE A LAWYER BASIC MATH SKILLS, AND YOU WON T BELIEVE WHAT HAPPENED NEXT
 WE GAVE A LAWYER BASIC MATH SKILLS, AND YOU WON T BELIEVE WHAT HAPPENED NEXT PRACTICAL APPLICATIONS OF RANDOM SAMPLING IN ediscovery By Matthew Verga, J.D. INTRODUCTION Anyone who spends ample time working
ACTL5103 Stochastic Modelling For Actuaries. Course Outline Semester 2, 2014
 UNSW Australia Business School School of Risk and Actuarial Studies ACTL5103 Stochastic Modelling For Actuaries Course Outline Semester 2, 2014 Part A: Course-Specific Information Please consult Part B
Essentials of Ability Testing. Joni Lakin Assistant Professor Educational Foundations, Leadership, and Technology
 Essentials of Ability Testing Joni Lakin Assistant Professor Educational Foundations, Leadership, and Technology Basic Topics Why do we administer ability tests? What do ability tests measure? How are
On-Line Data Analytics
 International Journal of Computer Applications in Engineering Sciences [VOL I, ISSUE III, SEPTEMBER 2011] [ISSN: 2231-4946] On-Line Data Analytics Yugandhar Vemulapalli #, Devarapalli Raghu *, Raja Jacob
Physics 270: Experimental Physics
 2017 edition Lab Manual Physics 270 3 Physics 270: Experimental Physics Lecture: Lab: Instructor: Office: Email: Tuesdays, 2 3:50 PM Thursdays, 2 4:50 PM Dr. Uttam Manna 313C Moulton Hall umanna@ilstu.edu
Speech Emotion Recognition Using Support Vector Machine
 Speech Emotion Recognition Using Support Vector Machine Yixiong Pan, Peipei Shen and Liping Shen Department of Computer Technology Shanghai JiaoTong University, Shanghai, China panyixiong@sjtu.edu.cn,
Preprint.
 http://www.diva-portal.org Preprint This is the submitted version of a paper presented at Privacy in Statistical Databases'2006 (PSD'2006), Rome, Italy, 13-15 December, 2006. Citation for the original
CHAPTER 4: REIMBURSEMENT STRATEGIES 24
 CHAPTER 4: REIMBURSEMENT STRATEGIES 24 INTRODUCTION Once state level policymakers have decided to implement and pay for CSR, one issue they face is simply how to calculate the reimbursements to districts
Grade 6: Correlated to AGS Basic Math Skills
 Grade 6: Correlated to AGS Basic Math Skills Grade 6: Standard 1 Number Sense Students compare and order positive and negative integers, decimals, fractions, and mixed numbers. They find multiples and
Genevieve L. Hartman, Ph.D.
 Curriculum Development and the Teaching-Learning Process: The Development of Mathematical Thinking for all children Genevieve L. Hartman, Ph.D. Topics for today Part 1: Background and rationale Current