a. How many cups of peas does she need? b. How many cups of milk does she need?
|
|
|
- Raymond Cameron
- 6 years ago
- Views:
Transcription
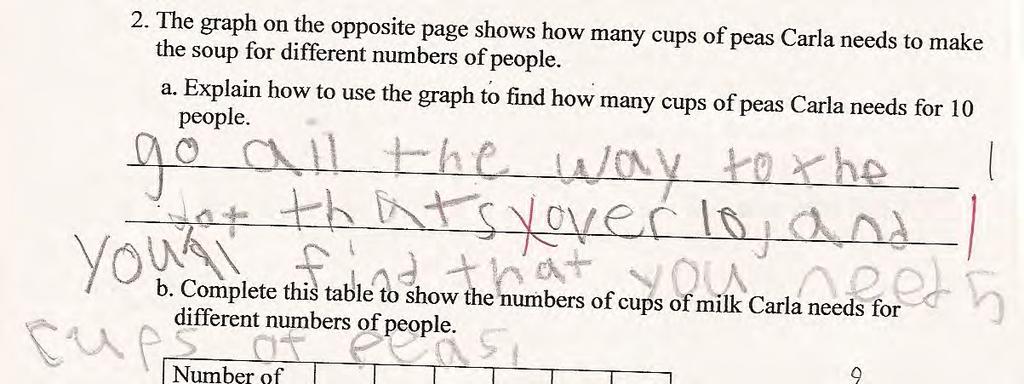
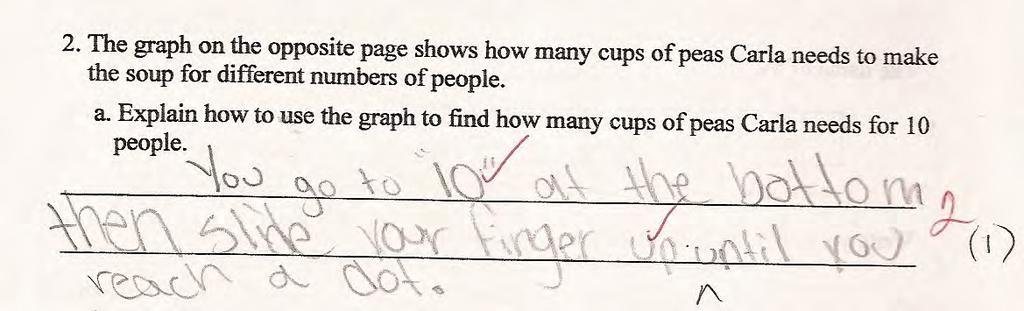
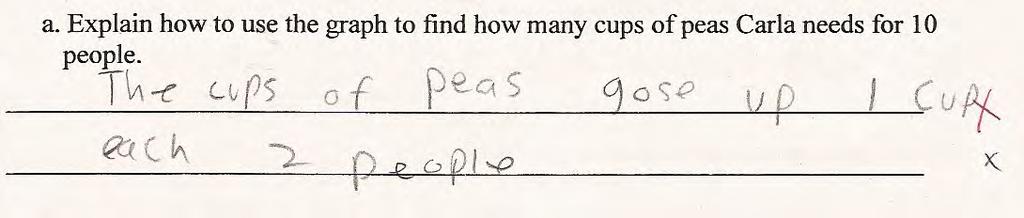
1 Pea Soup This problem gives you the chance to: use proportional reasoning This is a recipe for Pea Soup. Pea Soup For 2 people 1 cup of peas 2 cups of milk 1 onion Seasoning 1. Carla makes pea soup for 6 people. a. How many cups of peas does she need? b. How many cups of milk does she need? 2. The graph on the opposite page shows how many cups of peas Carla needs to make the soup for different numbers of people. a. Explain how to use the graph to find how many cups of peas Carla needs for 10 people. b. Complete this table to show the numbers of cups of milk Carla needs for different numbers of people. Number of people Number of cups of milk c. Mark the points in the table on the graph and join the points with a straight line. 51 Copyright 2008 by Mathematics Assessment Resource Service
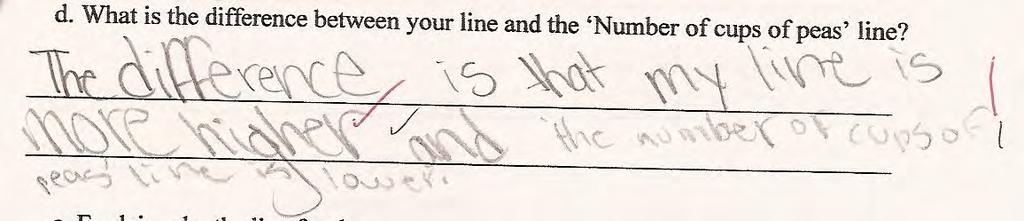
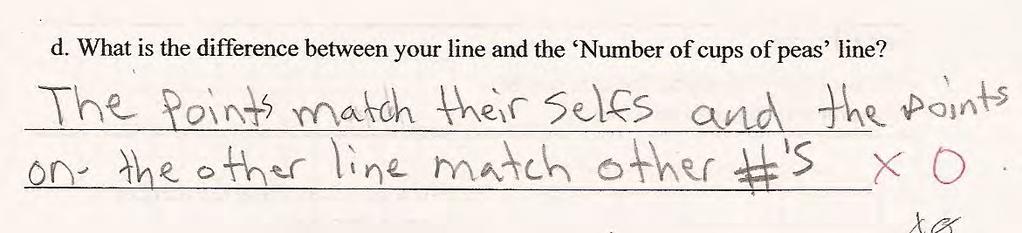
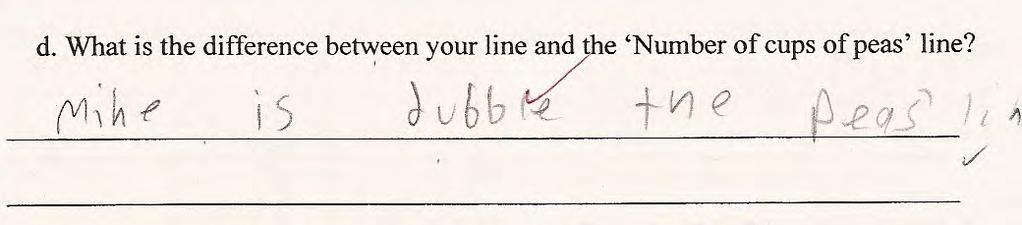
2 d. What is the difference between your line and the Number of cups of peas line? e. Explain why the line for the number of onions Carla needs is the same as the line for the number of cups of peas Quantity needed Number of cups of peas Number of people Copyright 2008 by Mathematics Assessment Resource Service
3 Pea Soup Rubric The core elements of performance required by this task are: use proportional reasoning Based on these, credit for specific aspects of performance should be assigned as follows points section points 1a. Gives correct answer: 3 1 1b. Gives correct answer: a. Gives correct explanation such as: Draw vertical and horizontal lines from point to axes. Partial credit For a partially correct answer. 2b. Table correctly completed. 2 (1) 2 2c. Partial credit For 2-3 correct numbers in table. Points plotted and line drawn correctly. Partial credit For 1 error. 2d. Makes a correct statement such as: My line is steeper. 1 2e. Gives a correct explanation such as: The number of onions needed is always the same as the number of cups of peas. (1) 2ft (1) Total Points Copyright 2008 by Mathematics Assessment Resource Service 53
4 Pea Soup Work the task. Look at the rubric. What are the big mathematical ideas of this task? Look at student work for part 1 of the task. For the amount of peas, how many of your students put: Other For the amount of milk, how many of your students put: Other What is some of the logic behind these errors? What were students thinking? What didn t they understand? Now look at the student work on explaining how to use the graph. How many of your students could: Give an explanation on how to use the graph? Gave an explanation about how to find the answer another way? What other errors or misconceptions did you see? How many of your students did not plot the graph? Made errors in plotting the graph? What opportunities do students have to make their own graphs about functions? Make a list of the types of words students used to describe the difference in the lines on the graph. Which words describe the steepness of the slope? Which words did students use that don t give enough information, like the numbers are different numbers? Which words talk about nonmathematical ideas, like flavor of the soup? How often do students in your class practice making meaningful comparisons? 54

5 Looking at Student Work on Pea Soup Student A shows the thinking for increasing the recipe for part 1 by identify the scale factor. The student alludes to slope in part 2, although doesn t really compare the lines globally. The explanation in part 5 is concise and right on the mathematical point. Student A 55

6 Student A, part 2 56


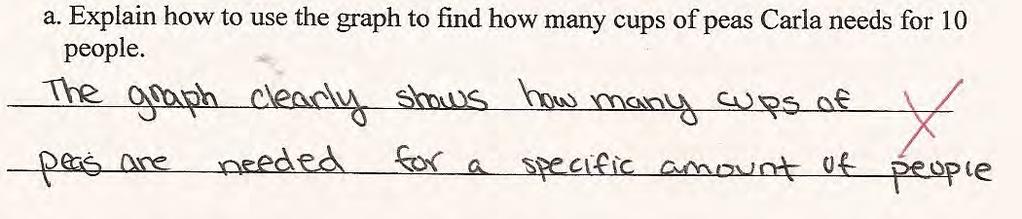
7 Student B dismisses the graph in part 2 and gives a different method. Unfortunately even the alternative method is not relating people to peas. In part 2e, the student talks about the size of an onion compared to a cup rather than thinking about the ration 1 for every 2 people. When doing part 2e, the student changes the labels on the graph from milk to onions. Student B 57


8 Student C is interesting because she appears to learn as she moves through the parts of the task. In part 1 she answers as if the original recipe is for one person. This thinking continues in part 2. However by 2e the student understands that the ingredients are 1 for two people. Some researchers suggest that learning occurs during an activity. What do you think? Student C 58


9 Student D pays attention to the wrong details in the recipe. In part 1 the student seems to think of the milk as 1 more cup than the amount of peas, instead of thinking across measures: 2 cups of milk for 2 people. The student is able to make the graph correctly, but does not understand the information being conveyed. In describing how to use the graph the student only talks about how the number of people grows across, leading to an incorrect statement in 2. Part 2e is scored incorrectly. The explanation for the number of onions should be because the ratio is the same 1 for 2, not because of flavor. Although, maintaining the ratio will contribute to the flavor staying the same. Student D 59

10 Student E has an incomplete explanation of using the graph in part 2. While the student was able to make a correct table of value for milk, the student does not enter the values correctly on the graph. Why might the student have made the line parallel? Student E 60

11 Student E, part 2 61

12 Student F also has difficulty with graphing. The student answers all the questions correctly, including filling out the table of values, but then draws vertical lines for the graph. What might the student have been thinking about? Student F 62


13 Student G does not understand the recipe in part 1, but is still able to complete the table in part 2. In part 2a the student is able to use the correct relationship to find the number of peas, but doesn t go back to fix the answers above. The student appears not to read for details carefully, because in part 2d the student seems to think that the table is for number of peas. The student never notices that the numbers in the table are different from the numbers in the graph. What might help this student?(the student shows no work on the graph.) Student G 63

14 Look at the work for Student H. Do you think the student has identified the correct 2 in the table? Why or why not? What patterns do you see in the table? Can you find a logic for how the student made the graph? What do you think this student understands? Student H 64

15 Student H, part 2 65

16 Look at the work of Student I. Notice that the student has two patterns in the table; one pattern for the first 3 columns and a different pattern for the second 3 columns. What do you think the student doing? Where would you go next with this student? Student I 66

17 Student I, part 2 67
18 5 th Grade Task 4 Pea Soup Student Task Core Idea 3 Patterns, Functions and Algebra Use proportional reasoning to increase the size of a recipe. Explain how to read a line graph and graph data from a table. Compare slopes of lines on a graph. Understand patterns and use mathematical models such as algebraic symbols and graphs to represent and understand quantitative relationships. Express mathematical relationships by graphing them on a coordinate grid. Investigate how a change in one variable relates to a change in a second variable. The mathematics of this task: Reasoning about a proportional relationship to increase a recipe Being able to explain how to read information from a graph Graphing coordinate pairs Comparing slope of lines on a graph Comparing ratios of two ingredients Based on teacher observation, this is what fifth graders know and are able to do: Plot points on a graph Use a ratio to increase a recipe Areas of difficulty for fifth graders: Explaining how to read a graph; many gave alternative strategies to find the same information Writing a comparison about the two lines on the graph, missing the vocabulary about steeper or larger Using comparison language, instead giving information about one or the other Understanding how to compare onions to peas by ratio rather than volume 68
19 The maximum score available for this task is 10 points. The minimum score needed for a level 3 response, meeting standards, is 6 points. Most students, 93%, could complete the table for milk. Many students, 72%, could increase the recipe for peas, fill in the table, and graph the information on the table. More than half the students could also increase the recipe for milk in part 1. Almost half, 43%, could also explain how to read the graph. Almost 18% of the students could meet all the demands of the task including explaining how the ratio for onions and peas was the same and compare the slopes of the two lines on the graph. About 4% of the students scored no points on this task. 66% of the students with this score attempted the task. 69
20 Pea Soup Points Understandings Misunderstandings 0 66% of the students with this Students could not extend the pattern in the score attempted the task. table. 5% put 2,3,4,5. 5% put 6,8,10,12. 2 Students could fill in the table for milk. 4 Students could fill in the table and extend the recipe in part 1. 5 Students could extend the recipe, fill in a table and explain how to read a graph. 6 Students could extend the recipe, fill in a tabl, and explain how to read a graph. Students could also explain that both onions and peas and 5% put 8, 12, 16, 20. Students had difficulty extending the recipe in part 1. Almost 22% of the students thought there would be 6 cups of peas and 12 cups of milk. 8% thought there would be 2 cups of milk. 6% thought there would be 3 cups of milk. And 5% thought there would be 4 cups of milk. Students struggled with explaining how to read the graph. Many tried to explain some other method for finding the number of peas. Students struggled with explaining that the ratio of onions to people is the same as the ratio of peas to people (1 to 2). Students didn t know how to make the graph. 17% of the students did not attempt to plot the points. are 1 for 2 people. 8 Students struggled with comparing the two lines on the graph. They didn t have the vocabulary of steeper or larger. They talked about one line or the other, without using comparative language. 10 Students could extend the recipe, fill in a table and explain how to read a graph. Students could also explain that both onions and peas are 1 for 2 people. They could compare slopes of lines on a graph and the ratios of onions and peas. 70
21 Implications for Instruction Students need to work with simple proportional relationships and extend the pattern. For example if 1 cup of peas is needed for 2 people, then 3 cups is needed for 6 people. Students should be exposed to tools, such as ratio tables and equivalent fractions to help them reason about increasing or decreasing ratios. Some students are paying attention to the wrong information in the ratio, for example, noticing that the milk is one larger than the peas. Students need to look across ratios to see that there are 2 cups of milk for every two people. Modeling good vocabulary for describing these multiplicative relationships help students to develop academic vocabulary and focuses their attention on the essential mathematical relationships. Sometimes we want students to notice a variety of patterns, the more the better. However, in this case, the attention needs to be across the measures. Students at this grade level should have many opportunities to plot data on graphs. Students should be comfortable explaining how to read a graph, using a graph to find solutions, extending a graph to find solutions, and discussing the shape or slope of the graph in general terms. Students should work with a variety of patterns to eliminate false generalizations, such as all graphs go through zero or all graphs go up in a one to one pattern. Ideas for Action Research Investigating Graphs Exploring Multiple Representations Students at the grade level would benefit from investigating graphs and seeing a purpose for using them to solve problems. While it is not important for them to know the academic language of slope, they should be able to notice that some graphs are steeper or flatter than others. Think about some situations, like buying t-shirts where they can combine proportional reasoning and graphing. For example, say Mack s sells t-shirts 2 for $7 and Norwalk s sell the same shirts at 3 for $10. After they compare the two graphs have them look at a third store: Murve s is having a sale on t-shirts: Buy one for $4, each addition is $3. Ask them to notice what is different about this graph. Now think about using graphs to make predictions. Which one do they think would be cheaper for buying 10 shirts or $20 shirts? Have them try to base their arguments by looking at the graph? If they didn t want to make the calculations, how could they find the cost for each store of buying the 10 shirts. The choice of numbers was purposeful to show steeper lines, to show lines that cross or have the same value for some amount of shirts, and to show that not all lines would continue to 0. For this situation a 0 shirt doesn t make sense. It would be good to think of situations where extending the line to zero would make sense. The problem was also designed to help students see that graphs could help them solve problems. They should also notice when one choice is cheaper than another choice. The MARS task 2007 Candies is also a proportional reasoning problem. After you have done some work with graphing, you might have the class work this task, then use graphing to check their results. Functions could also be used to point out some of these ideas without using context. Students don t need to know the rules, but should play with how the numbers effect the shape of the graph. 71
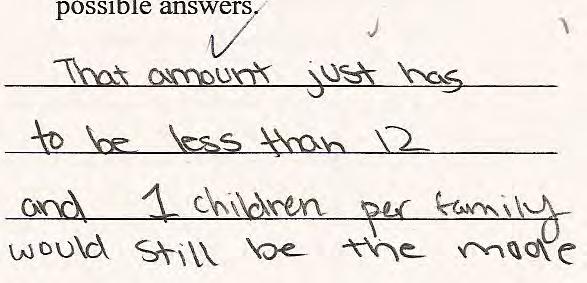
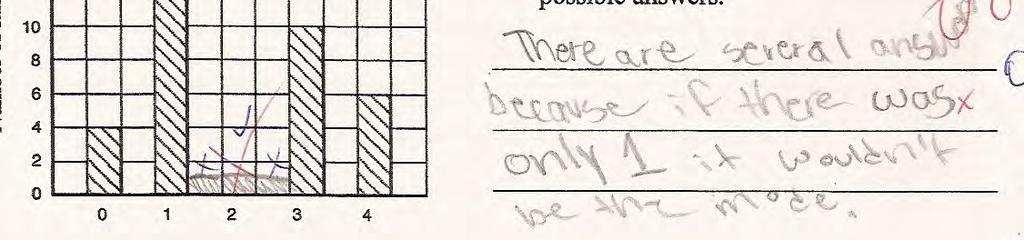
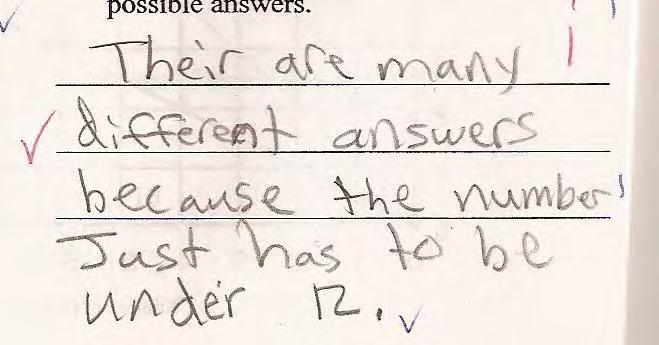
22 Bar Charts This problem gives you the chance to: interpret and construct bar charts Number of families Here is a bar chart about the number of children in families. The bar to show 2 children per family is missing. 1. Draw the missing bar so that the total number of families is 50. Show how you figured it out Number of children per family Number of families Draw the missing bar so that the mode of the number of children per family is 1. Explain why there are several different possible answers Number of children per family 72 Copyright 2008 by Mathematics Assessment Resource Service
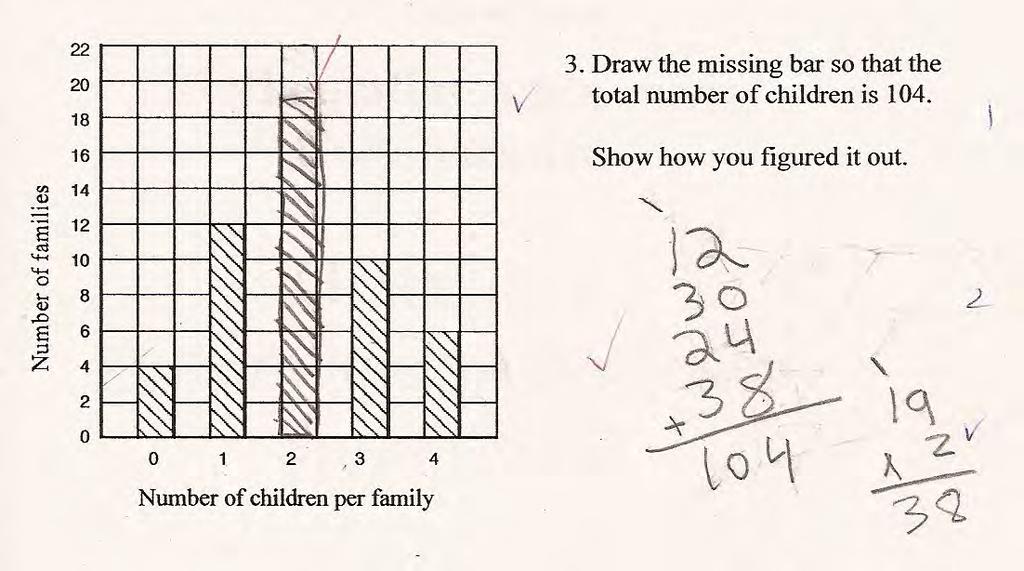
23 Draw the missing bar so that the total number of children is 104. Show how you figured it out Number of children per family 73 Copyright 2008 by Mathematics Assessment Resource Service 8
24 Bar Charts Rubric The core elements of performance required by this task are: interpret and construct bar charts Based on these, credit for specific aspects of performance should be assigned as follows points section points 1. Shows correct answer: Bar of height 18 units Shows work such as: = = 18 Partial credit For 1 error 2. Shows correct answer: Bar of height < 12 units Gives correct explanation such as: Because the bar can be any height less than 12 families. 3.. Gives correct answer: Bar of height 19 units Shows correct work such as: 0 x x x x 6 = = Partial credit For 1 error 1 2 (1) (1) 3 Total Points Copyright 2008 by Mathematics Assessment Resource Service
25 Bar Charts Work the task. Look at the rubric. What are some of the big mathematical concepts that a student needs to understand to be successful on this task? Look at student work for part 1. How many of your students put: Added to more than 1 bar Other What were some of the student misconceptions? Now look at student work for part 2. How many of your students put: bar< 12 No bar Added to more than 1 bar Other Now look at some of the reasons for why there is more than one answer. How many of their answers were: Misunderstanding of mode (e.g. every bar needs to be a different height or things can be divided in half): About life rather than math (e.g. babies are born all the time or different families have different numbers of children): Almost right but forgot scale so omitted 11: Other reasons Make a list of some of the errors: What surprised you about their reasons? Why do you think this was so difficult? Now look at work for part 3. How many students put: 19 No bar Added to all bars 72 Other What types of misconceptions led to these errors? 75

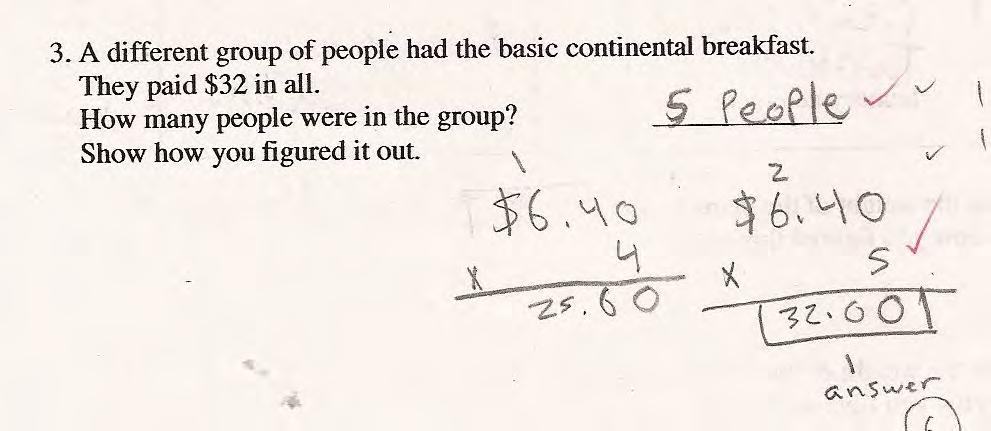
26 Looking at Student Work on Bar Charts Student A is able to find the number of families needed to make the total families equal to 50 in part 1. In part 2 the student lists all the possible answers for the bar height. This is possible because there can t be fractional families. In part 3 the student shows the multiplication of the families times number of children to find the children needed to make 104 and then divides that by 2 because each family in the missing bar has 2 children. Student A 76


27 Student A, part 2 Student B uses the idea that the mode is the highest bar. 77

28 Student C explains the mode by showing the frequency for each value on the bar chart. Notice that the student writes a working definition of mode to go with his work. Also notice the use of labels in part 1. Student C 78


29 Student D has correct work on all parts of the task except the explanation in 2. The student forgets about the scale and doesn t consider that 11 is also a possibility for 2 families. Student D Student E concentrates on the word average and doesn t think about the frequency of each number. How do we help students to distinguish between number as a category, like children in a family, and number as a frequency, like number of this type of family? Student E 79


30 Student F talks about the fact that there are many answers that equal 1. Can you figure out what the student is doing in the work? Student F attempts to calculate the missing number of children but makes arithmetic errors. The student also forgets to divide by 2, but doesn t seem disturbed that her answer is larger than the available room on the graph. Student F 80


31 Student G does not think about the meaning of mode. The student sees that 1 could appear in different places on the graph, because there is more than one bar, so the student is thinking about a frequency of 1, not a mode of 1. Notice how the student copes with the short scale in part 3 for his solution. Student G 81


32 Student H adds more 1 s to the graph to make it the mode. What is the conceptual misunderstanding of this student? Do we overemphasize a short version of the definition? Notice that the student counts the families with 0 children as children. The student does not consider how to apply the scale for the number of children to the height of the bar in part 3. What is the student thinking when subtracting all the 32 s? Student H 82


33 Student I thinks there are multiple answers because the scale allows you to draw bars of several different heights. The student is thinking about scale instead of mode. Notice that the student redrew the graph to conform to his answer. Student I 83


34 Student J seems to have an invented algorithm of just dividing by 2 until the answer will fit on the graph. Again, the explanation in part 2 has nothing to do with mode, but is about the ability to divide and get different answers. Student J 84

35 Student K doesn t count the families with 0 children when adding up the total families. Again the explanation in part 2 has nothing to do with mode. In part 3 the student experiments with several computations until she gets an answer that seems suitable to fit in with the other bars. Can you see in sense-making in the work? Student K 85

36 Student K, part 2 86

37 Student L increases the size of the graphs to fit his interpretations of the questions. In part two the student expresses confusion on mode; maybe it means this or maybe it means something else. Student L 87

38 Student L, part 2 88


39 Student M does not know what the question is asking and answers his own unique question in part 1. What might the student be thinking in part 2?Notice that the student adds to all the bars to try and get 104 families rather than 104 children. What might be the next steps for this student? Where would you start? Student M 89
40 5 th Grade Task 5 Bar Charts Student Task Core Idea 5 Data Analysis Interpret and construct bar charts. Use statistical measures, such as mode, in a problem situation. Display, analyze, compare and interpret different data sets. Use measures of center (mean, median, and mode) and understand what each does and does not indicate about the data set. Represent data using bar graphs. Interpret data to answer questions about a situation. The mathematics of this task: Reading and interpreting a scale that is not going up by ones Understanding that the vertical height is a frequency Understanding the double meaning of numbers on the horizontal scale, both as a label (type of family) and as a value or scale factor (each family represents a number of children per family) Understanding mode in the context of a graph, understanding mode as the most meaning highest bar rather than the number labels on the bottom or side scale Calculating total families and total children from a graph Based on teacher observation, this is what fifth graders knew and were able to do: Create a bar to represent information Create a bar that is less than the modal bar Basic computations Calculate the number of families Areas of difficulty for fifth graders: Explaining mode or most in the context of a graph Understanding that the height of the bar for families with 0 children wouldn t be used to find the number of children represented on the graph Applying the scale for children to the frequency to find the total children on the graph On the final graph remembering that the number of children remaining needed to be divided by 2 because each family on that bar had two children 90
41 The maximum score available for this task is 8 points. The minimum score needed for a level 3 response, meeting standards, is 4 points. Most students, 84%, could draw a bar lower than the mode in part 2. More than half the students could find the total number of families and find and graph the remaining families needed to make the graph represent a total of 50 families. Almost half the students, 46%, could both draw the lower bar in part 2 and do all of part one, finding and graphing the families to make a total of 50 on the graph. About 15% of the students could reason about the number of children on the graph combining frequency and scale to make the graph represent 104 children in part 3. 10% of the students could meet all the demands of the task including explaining why there could be bars of different sizes and still maintain a mode of 1 on graph 2. 16% of the students scored no points on this task. 81% of the students with this score attempted the task. 91
42 Bar Charts Points Understandings Misunderstandings 0 81% of the students with this score attempted the task. Students struggled with the word mode in part 2 and how to draw the graph. 17% of the students did not draw a bar in part 2. 4% drew a bar with a height of 18. 3% added to height of all the bars in part 2. 3% 1 Students could make the height of the new bar in part 2 smaller than the height of the bar for families with 1 child. 3 Students could calculate the number of families on a graph and draw a bar to make the total families equal Students could also draw a bar with a height less than the mode. 7 Students could show the number of children needed to make 104 children on the graph. 8 Students could find the total families, find the total children, and reason about mode in the context of frequency on a graph. Implications for Instruction thought the height should be 12. Students struggled with finding the total families in part 1(32) and then calculating the number of additional families needed to make 50. 5% put a bar of 20, 4% put a bar of 8. 3% put a bar of 22 and 3% put a bar of 16. Some students didn t count the families with no children. Students did not know how to find the number of children. Almost 15% of the students thought the bar should be at 22(highest number on the scale). 3% expanded the graph to 72. 8% added additional squares to all the bars in part 3. Other popular answers were 18, 14, 6, and 12. Students could not explain why there were several answers to make the bar for 2 families and maintain a mode of 1. Students used real life thinking: babies are born all the time. Students thought about doing math problems: there s lots of ways to get an answer of one. Students were confused about what part of the graph needed to be the most : there is more than 1 bar on the graph. Students confused mode with scale: there are other heights that haven t been used 16, 18, 20,
43 Students need more opportunities to think about measures of center in the context of graphing. Students had a very difficult time reasoning about mode. Sometimes students seemed to have a definition that was too short, mode means most ; but they couldn t interpret what about the graph should be the most. In teaching academic language it is important that students get a complete definition, not a short gimmick for quick responses. Oversimplification causes problems in understanding when trying to work with the idea to solve problems. This idea of frequency in the graph is different than frequency in the context of a string of data. It is important for students to be able to connect the two representations. One of the best ways is to give students the opportunities to make their own graphs to see how the two fit together. Making their own graphs also helps students to see that the number on the horizontal scale has two meanings. First the number is a label, the type of family represented by that particular bar, families with 2 children. It is also a scale factor for multiplying enlarging the frequency. Children equal the number of families times the scale. Students had difficulty interpreting the 0 bar on the graph. They might not count the bar when finding the number of families and then add in the bar when calculating the number of children. Students need to be asked a wide variety of questions about graphs to probe their understanding and where see where it breaks down. Students might make graphs of the number of pets per household or the numbers of tables in the cafeteria and children per table to help them think about numbers as labels and as scale. Similar MARS tasks include: 5 th 2000 Chips, 5 th Washington St. and 6 th 2001 Ice Cream. Ideas for Action Research Writing a Re-engagement Lesson One of the effective tools developed by MAC through Action Research is the idea of reengagement, or using student work to plan further lessons. After the initial task the teacher or a group of teachers sits down to examine student work. As teachers read several papers, a story emerges. Sometimes the story is about strategies used by successful students. Sometimes the story is about the different demands in working with a concept in context versus being given the information or data. Other times the story is about a common recurring misconception. Sometimes the story is about the difference in cognitive demand in the task, such as finding derived measurements, i.e. finding the number of families or children represented on a graph or how the mode or frequency seems different than mode in a string of data. Sometimes the story is about recognizing significant digits, understanding remainders, understanding a big mathematical idea, such as what an average does or how to make a comparison. In this part of the tool kit, a larger sample of student work has been provided to give you an opportunity to develop your own re-engagement lesson. Sit down with a group of colleagues to examine the work on Bar Charts or look at your own student work. What are the important mathematical ideas that students are struggling with in this task? What do you think is the story of this task? Now think, what is the minimum that most students in the class can understand and think about a series of 3 to 5 questions to help move student thinking to the more desired goal. What pieces of student work could you use to pose the questions? It helps to personalize the questions by attaching student names (not names from your class, because you don t want to put someone on the spot) or by posing a dilemma to get students intrigued about finding the solution. 93

44 For example: Julie says, I don t understand how graph number one. There isn t room. The scale only goes to 22. Rhonda says, Oh, I solved that by just making all the bars taller. What advice would you offer to these students? Or Ken says, I am confused about the mode. There is more than 1 way to get an answer of one. Melinda adds, Right, there are several answers because 1 can be in different places on the graph. What do you think these students are talking about? Clara says, It wouldn t work if there was only 1 one. Mode means most. Alex says, I am still confused. One could be the most bar lines have 1 family high or most of the families could have one child. What is each of these children thinking? What does mode mean in a graph? 94
45 Hopefully, class discussion will get students to think about the meaning of mode or frequency when represented on a graph. Students or the teacher may then pose further questions to help clarify the ideas. For example: Bennie suggests that the group should make a list of all the 0 s, 1 s, 2 s, etc. What do you think he means? What would that list look like? When using student work, it is important not to show too much or use labels. The purpose is to make all students in the class have a reason to re-think the mathematics from a slightly different perspective. The purpose of the re-engagement lesson is not to give students another worksheet, but provide a forum for the exchange of ideas so that students develop the logic of making convincing arguments, confront their misconceptions explicitly, learn strategies used by others through the feedback of listening to their peers. Now try writing or designing a series of questions that you might pose for your class to develop the important mathematics of this task. Reflecting on the Results for Fifth Grade as a Whole: Think about student work through the collection of tasks and the implications for instruction. What are some of the big misconceptions or difficulties that really hit home for you? If you were to describe one or two big ideas to take away and use for planning for next year, what would they be? What are some of the qualities that you saw in good work or strategies used by good students that you would like to help other students develop? 95
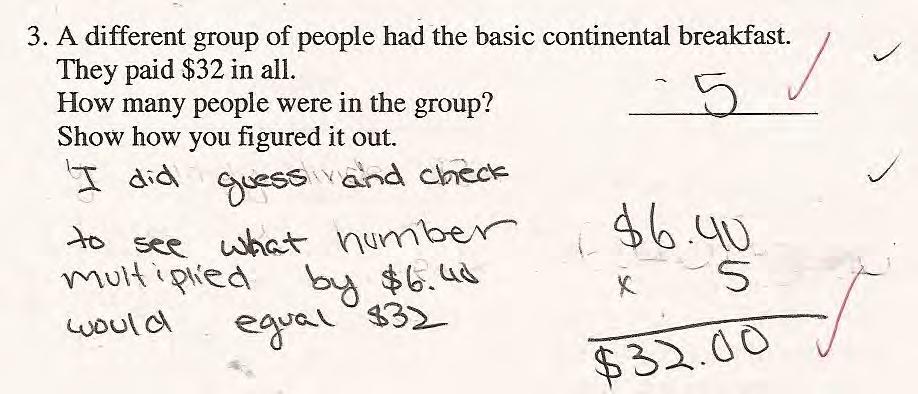
46 Four areas that stand out for the Collaborative as a whole are: 1. Converting between units of measure - Students had difficulty converting between units of measure for ounces and pounds. Students sometimes ignored the ounces or ignored the pounds. Some students added ounces to pounds. Students didn t understand the logic of converting between measures. 2. Decimal place value In Shopping Bags, students converted ounces into decimals. There are 16 ounces in a pound, not 100. This gets at understanding the very structure of decimals as a base 10. Students are treating the decimal as just a graphic organizer. In Breakfast Time students had difficulty with decimal place value in operations. Students didn t know to add zeroes to the $20 before subtracting. Students tried to divide the $32 into the $6.40, because the length of the number was shorter or smaller rather than taking the smaller value. Students were not comparing the quantity represented by the numbers. 3. Proportional Reasoning In Pea Soup the students had difficulty thinking about how to compare ratio of onions to ratio of peas or how to compare the ratios when displayed on a graph. In Bar Charts students couldn t work with the scale factor to find the number of children, they didn t apply the scale factor to the frequency. They also didn t understand that they needed to reverse the scale when converting from children to number of families with 2 children. 4. Understanding Mode Students had inadequate definitions of mode as most. They couldn t understand what part of the graph represented frequency. They didn t know which one was the mode. Students need to see the relationship between mode as a string of data and mode on the graph. Students need to be able to relate between multiple representations of the same information. 96
47 Examining the Ramp: Looking at Responses of the Early 4 s (31-33) The ramps for the fifth grade test: Shopping Bags Part 2 Reasoning about bag 2 o Problem solving to find the which items go in the bag o Interpreting the constraints of the task: every item should be used, items could only be used once o Quantifying the total weight of the items by converting between measures of weight Breakfast Time - Part 3 Dividing with decimals o Understanding and comparing size of decimal numbers o Using multiplication or division to find the number of groups of $6.40 in $32 Fruity Fractions - No ramp Pea Soup Part 2a Explaining how to read a graph Part 2d Comparing lines on a graph o Reasoning about the steepness of the slope Bar Charts - Part 2 Reasoning about mode in the context of a graph Part 3 Applying scale to frequency o Using the scale to find the number of children represented on the graph o Understanding that the 0 bar did not contribute to the number of children o Working backwards from the number of children to the height of bar for a family with 2 children 97
48 With a group of colleagues look at student work around points. Use the papers provided or pick some from your own students. How are students performing on the ramp? What things impressed you about their performance? What are skills or ideas they still need to work on? Are students relying on previous arithmetic skills rather than moving up to more grade level strategies? What was missing that you would hope to see from students working at this level? When you read their words, do you have a sense of understanding from them personally or does it sound more like parroting things they ve heard the teacher say? How do you help students at this level step up their performance or see a standard to aim for in explaining their thinking? Are our expectations high enough to these students? For each response, can you think of some way that it could be improved? How do we provide models to help these students see how their work can be improved or understand what they are striving for? Do you think errors were caused by lack of exposure to ideas or misconceptions? What would a student need to fix or correct their errors? What is missing to make it a top-notch response? What concerns you about their work? What strategies did you see that might be useful to show to the whole class? 98


49 Mindy, total score 31 points 99

50 Mindy, part 2 100


51 Cameron, total score 32 points 101

52 Cameron, part 2 102


53 Cameron, part 3 Calvin, total score 32/33 103

54 Calvin, part 2 104


55 Calvin, part 3 Sally, total score 33 points 105

56 Sally, part 2 106


57 Martin, total score 32/33 107

58 Martin, part 2 108
Mathematics Scoring Guide for Sample Test 2005
 Mathematics Scoring Guide for Sample Test 2005 Grade 4 Contents Strand and Performance Indicator Map with Answer Key...................... 2 Holistic Rubrics.......................................................
Extending Place Value with Whole Numbers to 1,000,000
 Grade 4 Mathematics, Quarter 1, Unit 1.1 Extending Place Value with Whole Numbers to 1,000,000 Overview Number of Instructional Days: 10 (1 day = 45 minutes) Content to Be Learned Recognize that a digit
AGS THE GREAT REVIEW GAME FOR PRE-ALGEBRA (CD) CORRELATED TO CALIFORNIA CONTENT STANDARDS
 CORRELATED TO CALIFORNIA CONTENT STANDARDS") AGS THE GREAT REVIEW GAME FOR PRE-ALGEBRA (CD) CORRELATED TO CALIFORNIA CONTENT STANDARDS 1 CALIFORNIA CONTENT STANDARDS: Chapter 1 ALGEBRA AND WHOLE NUMBERS Algebra and Functions 1.4 Students use algebraic
AGS THE GREAT REVIEW GAME FOR PRE-ALGEBRA (CD) CORRELATED TO CALIFORNIA CONTENT STANDARDS 1 CALIFORNIA CONTENT STANDARDS: Chapter 1 ALGEBRA AND WHOLE NUMBERS Algebra and Functions 1.4 Students use algebraic
South Carolina College- and Career-Ready Standards for Mathematics. Standards Unpacking Documents Grade 5
 South Carolina College- and Career-Ready Standards for Mathematics Standards Unpacking Documents Grade 5 South Carolina College- and Career-Ready Standards for Mathematics Standards Unpacking Documents
Functional Skills Mathematics Level 2 assessment
 Functional Skills Mathematics Level 2 assessment www.cityandguilds.com September 2015 Version 1.0 Marking scheme ONLINE V2 Level 2 Sample Paper 4 Mark Represent Analyse Interpret Open Fixed S1Q1 3 3 0
Grade 6: Correlated to AGS Basic Math Skills
 Grade 6: Correlated to AGS Basic Math Skills Grade 6: Standard 1 Number Sense Students compare and order positive and negative integers, decimals, fractions, and mixed numbers. They find multiples and
Cal s Dinner Card Deals
 Cal s Dinner Card Deals Overview: In this lesson students compare three linear functions in the context of Dinner Card Deals. Students are required to interpret a graph for each Dinner Card Deal to help
Edexcel GCSE. Statistics 1389 Paper 1H. June Mark Scheme. Statistics Edexcel GCSE
 Edexcel GCSE Statistics 1389 Paper 1H June 2007 Mark Scheme Edexcel GCSE Statistics 1389 NOTES ON MARKING PRINCIPLES 1 Types of mark M marks: method marks A marks: accuracy marks B marks: unconditional
2 nd grade Task 5 Half and Half
 2 nd grade Task 5 Half and Half Student Task Core Idea Number Properties Core Idea 4 Geometry and Measurement Draw and represent halves of geometric shapes. Describe how to know when a shape will show
Focus of the Unit: Much of this unit focuses on extending previous skills of multiplication and division to multi-digit whole numbers.
 Approximate Time Frame: 3-4 weeks Connections to Previous Learning: In fourth grade, students fluently multiply (4-digit by 1-digit, 2-digit by 2-digit) and divide (4-digit by 1-digit) using strategies
Dublin City Schools Mathematics Graded Course of Study GRADE 4
 I. Content Standard: Number, Number Sense and Operations Standard Students demonstrate number sense, including an understanding of number systems and reasonable estimates using paper and pencil, technology-supported
Mathematics process categories
 Mathematics process categories All of the UK curricula define multiple categories of mathematical proficiency that require students to be able to use and apply mathematics, beyond simple recall of facts
Using Proportions to Solve Percentage Problems I
 RP7-1 Using Proportions to Solve Percentage Problems I Pages 46 48 Standards: 7.RP.A. Goals: Students will write equivalent statements for proportions by keeping track of the part and the whole, and by
Algebra 1, Quarter 3, Unit 3.1. Line of Best Fit. Overview
 Algebra 1, Quarter 3, Unit 3.1 Line of Best Fit Overview Number of instructional days 6 (1 day assessment) (1 day = 45 minutes) Content to be learned Analyze scatter plots and construct the line of best
Ohio s Learning Standards-Clear Learning Targets
 Ohio s Learning Standards-Clear Learning Targets Math Grade 1 Use addition and subtraction within 20 to solve word problems involving situations of 1.OA.1 adding to, taking from, putting together, taking
Common Core State Standards
 Common Core State Standards Common Core State Standards 7.NS.3 Solve real-world and mathematical problems involving the four operations with rational numbers. Mathematical Practices 1, 3, and 4 are aspects
TOPICS LEARNING OUTCOMES ACTIVITES ASSESSMENT Numbers and the number system
 Curriculum Overview Mathematics 1 st term 5º grade - 2010 TOPICS LEARNING OUTCOMES ACTIVITES ASSESSMENT Numbers and the number system Multiplies and divides decimals by 10 or 100. Multiplies and divide
Mathematics subject curriculum
 Mathematics subject curriculum Dette er ei omsetjing av den fastsette læreplanteksten. Læreplanen er fastsett på Nynorsk Established as a Regulation by the Ministry of Education and Research on 24 June
Arizona s College and Career Ready Standards Mathematics
 Arizona s College and Career Ready Mathematics Mathematical Practices Explanations and Examples First Grade ARIZONA DEPARTMENT OF EDUCATION HIGH ACADEMIC STANDARDS FOR STUDENTS State Board Approved June
Mathematics Success Level E
 T403 [OBJECTIVE] The student will generate two patterns given two rules and identify the relationship between corresponding terms, generate ordered pairs, and graph the ordered pairs on a coordinate plane.
Montana Content Standards for Mathematics Grade 3. Montana Content Standards for Mathematical Practices and Mathematics Content Adopted November 2011
 Montana Content Standards for Mathematics Grade 3 Montana Content Standards for Mathematical Practices and Mathematics Content Adopted November 2011 Contents Standards for Mathematical Practice: Grade
Numeracy Medium term plan: Summer Term Level 2C/2B Year 2 Level 2A/3C
 Numeracy Medium term plan: Summer Term Level 2C/2B Year 2 Level 2A/3C Using and applying mathematics objectives (Problem solving, Communicating and Reasoning) Select the maths to use in some classroom
Diagnostic Test. Middle School Mathematics
 Diagnostic Test Middle School Mathematics Copyright 2010 XAMonline, Inc. All rights reserved. No part of the material protected by this copyright notice may be reproduced or utilized in any form or by
The New York City Department of Education. Grade 5 Mathematics Benchmark Assessment. Teacher Guide Spring 2013
 The New York City Department of Education Grade 5 Mathematics Benchmark Assessment Teacher Guide Spring 2013 February 11 March 19, 2013 2704324 Table of Contents Test Design and Instructional Purpose...
1 3-5 = Subtraction - a binary operation
 High School StuDEnts ConcEPtions of the Minus Sign Lisa L. Lamb, Jessica Pierson Bishop, and Randolph A. Philipp, Bonnie P Schappelle, Ian Whitacre, and Mindy Lewis - describe their research with students
This scope and sequence assumes 160 days for instruction, divided among 15 units.
 In previous grades, students learned strategies for multiplication and division, developed understanding of structure of the place value system, and applied understanding of fractions to addition and subtraction
AP Statistics Summer Assignment 17-18
 AP Statistics Summer Assignment 17-18 Welcome to AP Statistics. This course will be unlike any other math class you have ever taken before! Before taking this course you will need to be competent in basic
Build on students informal understanding of sharing and proportionality to develop initial fraction concepts.
 Recommendation 1 Build on students informal understanding of sharing and proportionality to develop initial fraction concepts. Students come to kindergarten with a rudimentary understanding of basic fraction
Page 1 of 11. Curriculum Map: Grade 4 Math Course: Math 4 Sub-topic: General. Grade(s): None specified
: None specified") Curriculum Map: Grade 4 Math Course: Math 4 Sub-topic: General Grade(s): None specified Unit: Creating a Community of Mathematical Thinkers Timeline: Week 1 The purpose of the Establishing a Community
Curriculum Map: Grade 4 Math Course: Math 4 Sub-topic: General Grade(s): None specified Unit: Creating a Community of Mathematical Thinkers Timeline: Week 1 The purpose of the Establishing a Community
Sample Problems for MATH 5001, University of Georgia
 Sample Problems for MATH 5001, University of Georgia 1 Give three different decimals that the bundled toothpicks in Figure 1 could represent In each case, explain why the bundled toothpicks can represent
Unit 3 Ratios and Rates Math 6
 Number of Days: 20 11/27/17 12/22/17 Unit Goals Stage 1 Unit Description: Students study the concepts and language of ratios and unit rates. They use proportional reasoning to solve problems. In particular,
Physics 270: Experimental Physics
 2017 edition Lab Manual Physics 270 3 Physics 270: Experimental Physics Lecture: Lab: Instructor: Office: Email: Tuesdays, 2 3:50 PM Thursdays, 2 4:50 PM Dr. Uttam Manna 313C Moulton Hall umanna@ilstu.edu
Characteristics of Functions
 Characteristics of Functions Unit: 01 Lesson: 01 Suggested Duration: 10 days Lesson Synopsis Students will collect and organize data using various representations. They will identify the characteristics
Unit 3: Lesson 1 Decimals as Equal Divisions
 Unit 3: Lesson 1 Strategy Problem: Each photograph in a series has different dimensions that follow a pattern. The 1 st photo has a length that is half its width and an area of 8 in². The 2 nd is a square
Grade 5 + DIGITAL. EL Strategies. DOK 1-4 RTI Tiers 1-3. Flexible Supplemental K-8 ELA & Math Online & Print
 Standards PLUS Flexible Supplemental K-8 ELA & Math Online & Print Grade 5 SAMPLER Mathematics EL Strategies DOK 1-4 RTI Tiers 1-3 15-20 Minute Lessons Assessments Consistent with CA Testing Technology
Students Understanding of Graphical Vector Addition in One and Two Dimensions
 Eurasian J. Phys. Chem. Educ., 3(2):102-111, 2011 journal homepage: http://www.eurasianjournals.com/index.php/ejpce Students Understanding of Graphical Vector Addition in One and Two Dimensions Umporn
Developing a concrete-pictorial-abstract model for negative number arithmetic
 Developing a concrete-pictorial-abstract model for negative number arithmetic Jai Sharma and Doreen Connor Nottingham Trent University Research findings and assessment results persistently identify negative
UNIT ONE Tools of Algebra
 UNIT ONE Tools of Algebra Subject: Algebra 1 Grade: 9 th 10 th Standards and Benchmarks: 1 a, b,e; 3 a, b; 4 a, b; Overview My Lessons are following the first unit from Prentice Hall Algebra 1 1. Students
Are You Ready? Simplify Fractions
 SKILL 10 Simplify Fractions Teaching Skill 10 Objective Write a fraction in simplest form. Review the definition of simplest form with students. Ask: Is 3 written in simplest form? Why 7 or why not? (Yes,
STT 231 Test 1. Fill in the Letter of Your Choice to Each Question in the Scantron. Each question is worth 2 point.
 STT 231 Test 1 Fill in the Letter of Your Choice to Each Question in the Scantron. Each question is worth 2 point. 1. A professor has kept records on grades that students have earned in his class. If he
Grade 2: Using a Number Line to Order and Compare Numbers Place Value Horizontal Content Strand
 Grade 2: Using a Number Line to Order and Compare Numbers Place Value Horizontal Content Strand Texas Essential Knowledge and Skills (TEKS): (2.1) Number, operation, and quantitative reasoning. The student
Strategies for Solving Fraction Tasks and Their Link to Algebraic Thinking
 Strategies for Solving Fraction Tasks and Their Link to Algebraic Thinking Catherine Pearn The University of Melbourne Max Stephens The University of Melbourne
Learning Disability Functional Capacity Evaluation. Dear Doctor,
 Dear Doctor, I have been asked to formulate a vocational opinion regarding NAME s employability in light of his/her learning disability. To assist me with this evaluation I would appreciate if you can
Math 121 Fundamentals of Mathematics I
 I. Course Description: Math 121 Fundamentals of Mathematics I Math 121 is a general course in the fundamentals of mathematics. It includes a study of concepts of numbers and fundamental operations with
Chapter 4 - Fractions
 . Fractions Chapter - Fractions 0 Michelle Manes, University of Hawaii Department of Mathematics These materials are intended for use with the University of Hawaii Department of Mathematics Math course
How long did... Who did... Where was... When did... How did... Which did...
 (Past Tense) Who did... Where was... How long did... When did... How did... 1 2 How were... What did... Which did... What time did... Where did... What were... Where were... Why did... Who was... How many
EDEXCEL FUNCTIONAL SKILLS PILOT TEACHER S NOTES. Maths Level 2. Chapter 4. Working with measures
 EDEXCEL FUNCTIONAL SKILLS PILOT TEACHER S NOTES Maths Level 2 Chapter 4 Working with measures SECTION G 1 Time 2 Temperature 3 Length 4 Weight 5 Capacity 6 Conversion between metric units 7 Conversion
Math-U-See Correlation with the Common Core State Standards for Mathematical Content for Third Grade
 Math-U-See Correlation with the Common Core State Standards for Mathematical Content for Third Grade The third grade standards primarily address multiplication and division, which are covered in Math-U-See
Creating a Test in Eduphoria! Aware
 in Eduphoria! Aware Login to Eduphoria using CHROME!!! 1. LCS Intranet > Portals > Eduphoria From home: LakeCounty.SchoolObjects.com 2. Login with your full email address. First time login password default
TABE 9&10. Revised 8/2013- with reference to College and Career Readiness Standards
 TABE 9&10 Revised 8/2013- with reference to College and Career Readiness Standards LEVEL E Test 1: Reading Name Class E01- INTERPRET GRAPHIC INFORMATION Signs Maps Graphs Consumer Materials Forms Dictionary
Let s think about how to multiply and divide fractions by fractions!
 Let s think about how to multiply and divide fractions by fractions! June 25, 2007 (Monday) Takehaya Attached Elementary School, Tokyo Gakugei University Grade 6, Class # 1 (21 boys, 20 girls) Instructor:
Paper 2. Mathematics test. Calculator allowed. First name. Last name. School KEY STAGE TIER
 259574_P2 5-7_KS3_Ma.qxd 1/4/04 4:14 PM Page 1 Ma KEY STAGE 3 TIER 5 7 2004 Mathematics test Paper 2 Calculator allowed Please read this page, but do not open your booklet until your teacher tells you
The Task. A Guide for Tutors in the Rutgers Writing Centers Written and edited by Michael Goeller and Karen Kalteissen
 The Task A Guide for Tutors in the Rutgers Writing Centers Written and edited by Michael Goeller and Karen Kalteissen Reading Tasks As many experienced tutors will tell you, reading the texts and understanding
Objective: Add decimals using place value strategies, and relate those strategies to a written method.
 NYS COMMON CORE MATHEMATICS CURRICULUM Lesson 9 5 1 Lesson 9 Objective: Add decimals using place value strategies, and relate those strategies to a written method. Suggested Lesson Structure Fluency Practice
Pre-Algebra A. Syllabus. Course Overview. Course Goals. General Skills. Credit Value
 Syllabus Pre-Algebra A Course Overview Pre-Algebra is a course designed to prepare you for future work in algebra. In Pre-Algebra, you will strengthen your knowledge of numbers as you look to transition
Full text of O L O W Science As Inquiry conference. Science as Inquiry
 Page 1 of 5 Full text of O L O W Science As Inquiry conference Reception Meeting Room Resources Oceanside Unifying Concepts and Processes Science As Inquiry Physical Science Life Science Earth & Space
Fourth Grade. Reporting Student Progress. Libertyville School District 70. Fourth Grade
 Fourth Grade Libertyville School District 70 Reporting Student Progress Fourth Grade A Message to Parents/Guardians: Libertyville Elementary District 70 teachers of students in kindergarten-5 utilize a
Algebra 1 Summer Packet
 Algebra 1 Summer Packet Name: Solve each problem and place the answer on the line to the left of the problem. Adding Integers A. Steps if both numbers are positive. Example: 3 + 4 Step 1: Add the two numbers.
If we want to measure the amount of cereal inside the box, what tool would we use: string, square tiles, or cubes?
 String, Tiles and Cubes: A Hands-On Approach to Understanding Perimeter, Area, and Volume Teaching Notes Teacher-led discussion: 1. Pre-Assessment: Show students the equipment that you have to measure
GCSE Mathematics B (Linear) Mark Scheme for November Component J567/04: Mathematics Paper 4 (Higher) General Certificate of Secondary Education
 Mark Scheme for November Component J567/04: Mathematics Paper 4 (Higher) General Certificate of Secondary Education") GCSE Mathematics B (Linear) Component J567/04: Mathematics Paper 4 (Higher) General Certificate of Secondary Education Mark Scheme for November 2014 Oxford Cambridge and RSA Examinations OCR (Oxford Cambridge
GCSE Mathematics B (Linear) Component J567/04: Mathematics Paper 4 (Higher) General Certificate of Secondary Education Mark Scheme for November 2014 Oxford Cambridge and RSA Examinations OCR (Oxford Cambridge
Radius STEM Readiness TM
 Curriculum Guide Radius STEM Readiness TM While today s teens are surrounded by technology, we face a stark and imminent shortage of graduates pursuing careers in Science, Technology, Engineering, and
Spinners at the School Carnival (Unequal Sections)
") Spinners at the School Carnival (Unequal Sections) Maryann E. Huey Drake University maryann.huey@drake.edu Published: February 2012 Overview of the Lesson Students are asked to predict the outcomes of
Spinners at the School Carnival (Unequal Sections) Maryann E. Huey Drake University maryann.huey@drake.edu Published: February 2012 Overview of the Lesson Students are asked to predict the outcomes of
The Indices Investigations Teacher s Notes
 The Indices Investigations Teacher s Notes These activities are for students to use independently of the teacher to practise and develop number and algebra properties.. Number Framework domain and stage:
May To print or download your own copies of this document visit Name Date Eurovision Numeracy Assignment
 1. An estimated one hundred and twenty five million people across the world watch the Eurovision Song Contest every year. Write this number in figures. 2. Complete the table below. 2004 2005 2006 2007
Common Core Standards Alignment Chart Grade 5
 Common Core Standards Alignment Chart Grade 5 Units 5.OA.1 5.OA.2 5.OA.3 5.NBT.1 5.NBT.2 5.NBT.3 5.NBT.4 5.NBT.5 5.NBT.6 5.NBT.7 5.NF.1 5.NF.2 5.NF.3 5.NF.4 5.NF.5 5.NF.6 5.NF.7 5.MD.1 5.MD.2 5.MD.3 5.MD.4
Functional Maths Skills Check E3/L x
 Functional Maths Skills Check E3/L1 Name: Date started: The Four Rules of Number + - x May 2017. Kindly contributed by Nicola Smith, Gloucestershire College. Search for Nicola on skillsworkshop.org Page
South Carolina English Language Arts
 South Carolina English Language Arts A S O F J U N E 2 0, 2 0 1 0, T H I S S TAT E H A D A D O P T E D T H E CO M M O N CO R E S TAT E S TA N DA R D S. DOCUMENTS REVIEWED South Carolina Academic Content
MADERA SCIENCE FAIR 2013 Grades 4 th 6 th Project due date: Tuesday, April 9, 8:15 am Parent Night: Tuesday, April 16, 6:00 8:00 pm
 MADERA SCIENCE FAIR 2013 Grades 4 th 6 th Project due date: Tuesday, April 9, 8:15 am Parent Night: Tuesday, April 16, 6:00 8:00 pm Why participate in the Science Fair? Science fair projects give students
Math Grade 3 Assessment Anchors and Eligible Content
 Math Grade 3 Assessment Anchors and Eligible Content www.pde.state.pa.us 2007 M3.A Numbers and Operations M3.A.1 Demonstrate an understanding of numbers, ways of representing numbers, relationships among
Mathematics Success Grade 7
 T894 Mathematics Success Grade 7 [OBJECTIVE] The student will find probabilities of compound events using organized lists, tables, tree diagrams, and simulations. [PREREQUISITE SKILLS] Simple probability,
Thesis-Proposal Outline/Template
 Thesis-Proposal Outline/Template Kevin McGee 1 Overview This document provides a description of the parts of a thesis outline and an example of such an outline. It also indicates which parts should be
Junior Fractions. With reference to the work of Peter Hughes, the late Richard Skemp, Van de Walle and other researchers.
 Junior Fractions With reference to the work of Peter Hughes, the late Richard Skemp, Van de Walle and other researchers. Fraction rope activity Information about teaching fractions Hands on - Bits and
First Grade Standards
 These are the standards for what is taught throughout the year in First Grade. It is the expectation that these skills will be reinforced after they have been taught. Mathematical Practice Standards Taught
P-4: Differentiate your plans to fit your students
 Putting It All Together: Middle School Examples 7 th Grade Math 7 th Grade Science SAM REHEARD, DC 99 7th Grade Math DIFFERENTATION AROUND THE WORLD My first teaching experience was actually not as a Teach
Shockwheat. Statistics 1, Activity 1
 Statistics 1, Activity 1 Shockwheat Students require real experiences with situations involving data and with situations involving chance. They will best learn about these concepts on an intuitive or informal
Lesson 12. Lesson 12. Suggested Lesson Structure. Round to Different Place Values (6 minutes) Fluency Practice (12 minutes)
 Fluency Practice (12 minutes)") Objective: Solve multi-step word problems using the standard addition reasonableness of answers using rounding. Suggested Lesson Structure Fluency Practice Application Problems Concept Development Student
Objective: Solve multi-step word problems using the standard addition reasonableness of answers using rounding. Suggested Lesson Structure Fluency Practice Application Problems Concept Development Student
Contents. Foreword... 5
 Contents Foreword... 5 Chapter 1: Addition Within 0-10 Introduction... 6 Two Groups and a Total... 10 Learn Symbols + and =... 13 Addition Practice... 15 Which is More?... 17 Missing Items... 19 Sums with
Introducing the New Iowa Assessments Mathematics Levels 12 14
 Introducing the New Iowa Assessments Mathematics Levels 12 14 ITP Assessment Tools Math Interim Assessments: Grades 3 8 Administered online Constructed Response Supplements Reading, Language Arts, Mathematics
Pedagogical Content Knowledge for Teaching Primary Mathematics: A Case Study of Two Teachers
 Pedagogical Content Knowledge for Teaching Primary Mathematics: A Case Study of Two Teachers Monica Baker University of Melbourne mbaker@huntingtower.vic.edu.au Helen Chick University of Melbourne h.chick@unimelb.edu.au
P a g e 1. Grade 5. Grant funded by:
 P a g e 1 Grade 5 Grant funded by: P a g e 2 Focus Standard: 5.NF.1, 5.NF.2 Lesson 6: Adding and Subtracting Unlike Fractions Standards for Mathematical Practice: SMP.1, SMP.2, SMP.6, SMP.7, SMP.8 Estimated
The following shows how place value and money are related. ones tenths hundredths thousandths
 2-1 The following shows how place value and money are related. ones tenths hundredths thousandths (dollars) (dimes) (pennies) (tenths of a penny) Write each fraction as a decimal and then say it. 1. 349
Calculators in a Middle School Mathematics Classroom: Helpful or Harmful?
 University of Nebraska - Lincoln DigitalCommons@University of Nebraska - Lincoln Action Research Projects Math in the Middle Institute Partnership 7-2008 Calculators in a Middle School Mathematics Classroom:
FIGURE IT OUT! MIDDLE SCHOOL TASKS. Texas Performance Standards Project
 FIGURE IT OUT! MIDDLE SCHOOL TASKS π 3 cot(πx) a + b = c sinθ MATHEMATICS 8 GRADE 8 This guide links the Figure It Out! unit to the Texas Essential Knowledge and Skills (TEKS) for eighth graders. Figure
Standard 1: Number and Computation
 Standard 1: Number and Computation Standard 1: Number and Computation The student uses numerical and computational concepts and procedures in a variety of situations. Benchmark 1: Number Sense The student
Changing User Attitudes to Reduce Spreadsheet Risk
 Changing User Attitudes to Reduce Spreadsheet Risk Dermot Balson Perth, Australia Dermot.Balson@Gmail.com ABSTRACT A business case study on how three simple guidelines: 1. make it easy to check (and maintain)
St Math Teacher Login
 St Math Login Free PDF ebook Download: St Math Login Download or Read Online ebook st math teacher login in PDF Format From The Best User Guide Database Ace Arms. Login Instructions. : karlahill6. Student:
TIMSS Highlights from the Primary Grades
 TIMSS International Study Center June 1997 BOSTON COLLEGE TIMSS Highlights from the Primary Grades THIRD INTERNATIONAL MATHEMATICS AND SCIENCE STUDY Most Recent Publications International comparative results
What the National Curriculum requires in reading at Y5 and Y6
 What the National Curriculum requires in reading at Y5 and Y6 Word reading apply their growing knowledge of root words, prefixes and suffixes (morphology and etymology), as listed in Appendix 1 of the
ESSENTIAL SKILLS PROFILE BINGO CALLER/CHECKER
 ESSENTIAL SKILLS PROFILE BINGO CALLER/CHECKER WWW.GAMINGCENTREOFEXCELLENCE.CA TABLE OF CONTENTS Essential Skills are the skills people need for work, learning and life. Human Resources and Skills Development
Science Fair Project Handbook
 Science Fair Project Handbook IDENTIFY THE TESTABLE QUESTION OR PROBLEM: a) Begin by observing your surroundings, making inferences and asking testable questions. b) Look for problems in your life or surroundings
OCR for Arabic using SIFT Descriptors With Online Failure Prediction
 OCR for Arabic using SIFT Descriptors With Online Failure Prediction Andrey Stolyarenko, Nachum Dershowitz The Blavatnik School of Computer Science Tel Aviv University Tel Aviv, Israel Email: stloyare@tau.ac.il,
Teaching a Laboratory Section
 Chapter 3 Teaching a Laboratory Section Page I. Cooperative Problem Solving Labs in Operation 57 II. Grading the Labs 75 III. Overview of Teaching a Lab Session 79 IV. Outline for Teaching a Lab Session
Case study Norway case 1
 Case study Norway case 1 School : B (primary school) Theme: Science microorganisms Dates of lessons: March 26-27 th 2015 Age of students: 10-11 (grade 5) Data sources: Pre- and post-interview with 1 teacher
Math 96: Intermediate Algebra in Context
 : Intermediate Algebra in Context Syllabus Spring Quarter 2016 Daily, 9:20 10:30am Instructor: Lauri Lindberg Office Hours@ tutoring: Tutoring Center (CAS-504) 8 9am & 1 2pm daily STEM (Math) Center (RAI-338)
LLD MATH. Student Eligibility: Grades 6-8. Credit Value: Date Approved: 8/24/15
 PUBLIC SCHOOLS OF EDISON TOWNSHIP DIVISION OF CURRICULUM AND INSTRUCTION LLD MATH Length of Course: Elective/Required: School: Full Year Required Middle Schools Student Eligibility: Grades 6-8 Credit Value:
Alignment of Australian Curriculum Year Levels to the Scope and Sequence of Math-U-See Program
 Alignment of s to the Scope and Sequence of Math-U-See Program This table provides guidance to educators when aligning levels/resources to the Australian Curriculum (AC). The Math-U-See levels do not address
learning collegiate assessment]
![learning collegiate assessment]](/thumbs/71/66063392.jpg "learning collegiate assessment]") [ collegiate learning assessment] INSTITUTIONAL REPORT 2005 2006 Kalamazoo College council for aid to education 215 lexington avenue floor 21 new york new york 10016-6023 p 212.217.0700 f 212.661.9766
[ collegiate learning assessment] INSTITUTIONAL REPORT 2005 2006 Kalamazoo College council for aid to education 215 lexington avenue floor 21 new york new york 10016-6023 p 212.217.0700 f 212.661.9766
TabletClass Math Geometry Course Guidebook
 TabletClass Math Geometry Course Guidebook Includes Final Exam/Key, Course Grade Calculation Worksheet and Course Certificate Student Name Parent Name School Name Date Started Course Date Completed Course
Improving Conceptual Understanding of Physics with Technology
 INTRODUCTION Improving Conceptual Understanding of Physics with Technology Heidi Jackman Research Experience for Undergraduates, 1999 Michigan State University Advisors: Edwin Kashy and Michael Thoennessen