Illustration (and the use of HLM) Chapter 4
|
|
|
- Sherman Shepherd
- 6 years ago
- Views:
Transcription
1 Illustration (and the use of HLM) Chapter 4
2 The Illustration Data Now we cover the example. In doing so we does the use of the software HLM. In addition, we will discuss typical questions that can be answered. 2 LTRC HLM Workshop
3 The Illustration Data The data set consists of 7,185 students who are nested in schools (there are 160 schools). Variables that we will use: MATHACH (Math Achievement at student level). CSES (group centered SES at student level). MEANSES (Average School SES, school level). l) SECTOR (Public 0 versus Catholic 1, school level). 3 LTRC HLM Workshop


4 Student Label School Label Level-1 Variables Level-2 Variables 4 LTRC HLM Workshop
5 The Questions 1. How much do U.S. high schools vary in their mean math achievement? 2. Do schools with high MEANSES also have high math achievement? 3. Is the strength of association between student CSES and math achievement similar across schools? Or is CSES a better predictor of student math achievement in some schools than others? 4. How do public and Catholic schools compare in terms of mean math achievement and in terms of the strength of the SES-math achievement relationship, after we control for MEAN SES? 5 LTRC HLM Workshop
6 1 st Question 1. How much do U.S. high schools vary in their mean math achievement? Notice that this question only addresses the variance of the observations, We will use a random effects ANOVA, 6 LTRC HLM Workshop
7 1 st Question We assume that u 0j has a normal distribution with mean 0 and variance τ 00 School j s mean MATHACH β γ + 0 = γ + u 0 j 00 0 j MATHACH β + ij = 0 j r ij Here all we want to know is the amount of variability of the mean math achievement across the schools 7 LTRC HLM Workshop
8 HLM The program does allow one to keep two separate files in the case of a 2 level analysis, SO in our case we could have a file for each examinee and a file for school, You will need to give the ID variable (school) in both files, Here we have it as an SPSS file and so we will just use it. 8 LTRC HLM Workshop


9 HLM To begin using HLM open the program and click on file This will pop-up a question about what format of dt data you are using At this point we want to start a new analysis so click on Make a new MDM file 9 LTRC HLM Workshop

10 HLM This brings up an option window. We only discuss how to do a two level analysis, so click on HLM2 10 LTRC HLM Workshop
11 HLM Pick the SPSS file that you are using 11 LTRC HLM Workshop


12 HLM Pick variables 12 LTRC HLM Workshop
13 HLM Pick the SPSS file that you are using 13 LTRC HLM Workshop


14 HLM Pick variables 14 LTRC HLM Workshop


15 HLM Then save the mdmt file, a control file Add name of data file Finally, click on Make MDM file, completes your set up. Examine basic statistics file Click Done 15 LTRC HLM Workshop


16 HLM That will get you to this part where you define your model. 16 LTRC HLM Workshop
.")

17 HLM Output The output for HLM is given as a text file (.txt). This file can be opened from HLM. Here I will just provide some of the main parts 17 LTRC HLM Workshop
18 Summary Information This gives us the random components 18 LTRC HLM Workshop
19 Fixed Effects Fixed effect for our model (intercept,,γγ 00 ) 19 LTRC HLM Workshop
20 Random Effects Same random components as before only now we have SE and significance tests 20 LTRC HLM Workshop
21 Estimates Think back to the original question. 1. How much do U.S. high schools vary in their mean math achievement? We have a parameter that measured that for us, which was τ 00 =8.61. Also, the average e achievement ement across all school averages (i.e., the grand mean). γ 00 = LTRC HLM Workshop
22 Range of School Averages Given the mean and its variance I can even compute a confidence interval to describe a range that includes 95% of all schools average math achievement. ˆ γ ± 1.96( ˆ τ ) ± 1.96(8.61) 2 = (6.89,18.39) 22 LTRC HLM Workshop
23 CI for Grand Mean We can also put a CI around the our estimate of the grand mean using the same equation. Only now we use the standard error of our estimate for γ ± ± 1.96(.24) = (12.17,13.11) ) 23 LTRC HLM Workshop
24 Interclass Correlation We can also compute the intraclass correlation. ˆ τ 8.61 ˆ τ 00 + σ ρ = = = LTRC HLM Workshop
25 Reliability Lastly we can compute the reliability of our estimate of School j s mean. ˆ λ reliability ( Y ) ˆ00 λ j =. j = ( 2 ˆ τ ) 00 + ( σ / n j ) τ 25 LTRC HLM Workshop
26 Reliability If we compute this value for all schools and average it we will get a summary of reliability which is the same that is given in the HLM output. 26 LTRC HLM Workshop
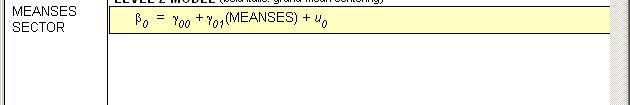
27 2 nd Question 1. Do schools with high MEANSES also have high math achievement? Focus is how a level-2 variable effects math achievement (average math achievement). Means as outcomes model. 27 LTRC HLM Workshop
28 2 nd Question MATHACH β + ij = 0 j r ij β 0 j = γ γ01meanses u0 j 28 LTRC HLM Workshop

29 HLM 29 LTRC HLM Workshop
30 Model Summary Information 30 LTRC HLM Workshop
31 Results (Fixed and Random) The estimate of our effect for MEANSES, γ 01 Hypothesis test Here are our variance This tells us that t there are still components differences across schools and that we 31 LTRC HLM Workshop do need the random effect
32 Additional Results There are other things we can compute. For example, we can compute the expected range of school means adjusted for MEANSES. 1 1 γˆ 1.96 ˆ ± τ00 = ± = ( ) ( ) ( 9.47,15.83) 32 LTRC HLM Workshop
33 Additional Results We can also compute the proportion of variance that can be explained by MEANSES using. τˆ = = ( ANOVA) τˆ ( MEANSES) τˆ00 ( ANOVA) LTRC HLM Workshop
34 Additional Results Lastly we can still compute the intraclass correlation as before. Now it is conditional on MEANSES. A measure of dependence within school given that we are now accounting for MEANSES. τˆ 2.64 ρ = 00 = =.06 τˆ +σ LTRC HLM Workshop
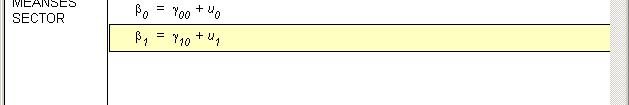
35 3 rd Question 1. Is the strength of association between student CSES and math achievement similar across schools? Or is CSES a better predictor of a students math achievement in some schools than others? Now the focus is on the effect of a level-1 variable on the dependent variable. Also how this effect varies across schools. 35 LTRC HLM Workshop
36 3 rd Question That means that we are interested in: MATHACH = β ( 0 + β1 CSES ) + r β β = γ + u 0 j 00 = γ + u j j i ij oj 1j 10 1j 36 LTRC HLM Workshop

37 HLM 37 LTRC HLM Workshop
38 HLM Output Notice now that we have two level-2 random effects we can estimate each variance and their covariance, this is their covariance matrix 38 LTRC HLM Workshop
39 HLM Output 39 LTRC HLM Workshop
40 Average Regression Line Can determine the average regression line across school based on the level-2 fixed effects. β β = γ + u 0j 00 = γ + u oj 1 j 10 1 j So the average line is: MATHACH = ( CSES) 40 LTRC HLM Workshop
41 Variability of Line Can determine variability of the regression lines across schools. Based on variance components (or random effects) τ 00 and τ ± 1.96(8.68) = 6.87, ( ) (0.68) 68) 0.57,3.81 ± 2 = ( ) 41 LTRC HLM Workshop
42 Relationships of Coefficients Can interpret the relationship between average math achievement with in a school and the relationship between CSES and MATHACH. Looking at τ LTRC HLM Workshop
43 Additional Results Lastly, we could look at the proportion of error, at level 1, that can be explained by CSES. Because we are at level-1 we use σ 2 σ 2 ( ) 2 ANOVA σ ( CSES ) 2 σ ( ANOVA) = = Remember that the school MEANSES accounted for 60% 43 LTRC HLM Workshop
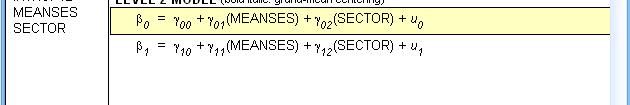
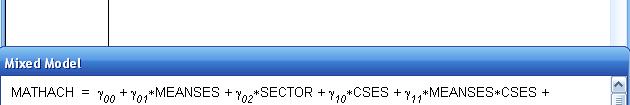
44 4 th Question 4. How do public and Catholic schools compare in terms of mean math achievement and in terms of the strength of the SES-math achievement relationship, after we control for MEAN SES? 44 LTRC HLM Workshop
45 4 th Question Do MEANSES and SECTOR significantly predict the intercept. Do MEANSES and SECTOR significantly predict the slope. How much variation in the intercept and slope is explained by MEANSES and SECTOR. 45 LTRC HLM Workshop

46 HLM 46 LTRC HLM Workshop
47 HLM Output 47 LTRC HLM Workshop
48 Fixed Effects 48 LTRC HLM Workshop
49 Random Effects 49 LTRC HLM Workshop
50 Summary The purpose this morning was to get you familiar with terminology, notation, and the types of tests and conclusions we can make with HLM. Are there any questions? Lunch Time 50 LTRC HLM Workshop
Comparing Teachers Adaptations of an Inquiry-Oriented Curriculum Unit with Student Learning. Jay Fogleman and Katherine L. McNeill
 Comparing Teachers Adaptations of an Inquiry-Oriented Curriculum Unit with Student Learning Jay Fogleman and Katherine L. McNeill University of Michigan contact info: Center for Highly Interactive Computing
Gender and socioeconomic differences in science achievement in Australia: From SISS to TIMSS
 Gender and socioeconomic differences in science achievement in Australia: From SISS to TIMSS, Australian Council for Educational Research, thomson@acer.edu.au Abstract Gender differences in science amongst
Hierarchical Linear Models I: Introduction ICPSR 2015
 Hierarchical Linear Models I: Introduction ICPSR 2015 Instructor: Teaching Assistant: Aline G. Sayer, University of Massachusetts Amherst sayer@psych.umass.edu Holly Laws, Yale University holly.laws@yale.edu
Universityy. The content of
 WORKING PAPER #31 An Evaluation of Empirical Bayes Estimation of Value Added Teacher Performance Measuress Cassandra M. Guarino, Indianaa Universityy Michelle Maxfield, Michigan State Universityy Mark
Hierarchical Linear Modeling with Maximum Likelihood, Restricted Maximum Likelihood, and Fully Bayesian Estimation
 A peer-reviewed electronic journal. Copyright is retained by the first or sole author, who grants right of first publication to Practical Assessment, Research & Evaluation. Permission is granted to distribute
Understanding Games for Teaching Reflections on Empirical Approaches in Team Sports Research
 Prof. Dr. Stefan König Understanding Games for Teaching Reflections on Empirical Approaches in Team Sports Research Lecture on the 10 th dvs Sportspiel- Symposium meets 6 th International TGfU Conference
On-the-Fly Customization of Automated Essay Scoring
 Research Report On-the-Fly Customization of Automated Essay Scoring Yigal Attali Research & Development December 2007 RR-07-42 On-the-Fly Customization of Automated Essay Scoring Yigal Attali ETS, Princeton,
The Relationship of Grade Span in 9 th Grade to Math Achievement in High School
 Administrative Issues Journal: Connecting Education, Practice, and Research (Winter 2015), Vol. 5, No. 2: 64-81, DOI: 10.5929/2015.5.2.6 The Relationship of Grade Span in 9 th Grade to Math Achievement
Probability and Statistics Curriculum Pacing Guide
 Unit 1 Terms PS.SPMJ.3 PS.SPMJ.5 Plan and conduct a survey to answer a statistical question. Recognize how the plan addresses sampling technique, randomization, measurement of experimental error and methods
Multi-Dimensional, Multi-Level, and Multi-Timepoint Item Response Modeling.
 Multi-Dimensional, Multi-Level, and Multi-Timepoint Item Response Modeling. Bengt Muthén & Tihomir Asparouhov In van der Linden, W. J., Handbook of Item Response Theory. Volume One. Models, pp. 527-539.
STA 225: Introductory Statistics (CT)
") Marshall University College of Science Mathematics Department STA 225: Introductory Statistics (CT) Course catalog description A critical thinking course in applied statistical reasoning covering basic
Marshall University College of Science Mathematics Department STA 225: Introductory Statistics (CT) Course catalog description A critical thinking course in applied statistical reasoning covering basic
A Comparison of Charter Schools and Traditional Public Schools in Idaho
 A Comparison of Charter Schools and Traditional Public Schools in Idaho Dale Ballou Bettie Teasley Tim Zeidner Vanderbilt University August, 2006 Abstract We investigate the effectiveness of Idaho charter
PROMOTING QUALITY AND EQUITY IN EDUCATION: THE IMPACT OF SCHOOL LEARNING ENVIRONMENT
 Fourth Meeting of the EARLI SIG Educational Effectiveness "Marrying rigour and relevance: Towards effective education for all University of Southampton, UK 27-29 August, 2014 PROMOTING QUALITY AND EQUITY
An Empirical Analysis of the Effects of Mexican American Studies Participation on Student Achievement within Tucson Unified School District
 An Empirical Analysis of the Effects of Mexican American Studies Participation on Student Achievement within Tucson Unified School District Report Submitted June 20, 2012, to Willis D. Hawley, Ph.D., Special
The elimination of social loafing behavior (i.e., the tendency for individuals
 Preference for Group Work, Winning Orientation, and Social Loafing Behavior in Groups Eric M. Stark James Madison University Jason D. Shaw Michelle K. Duffy University of Minnesota Group & Organization
Individual Differences & Item Effects: How to test them, & how to test them well
 Individual Differences & Item Effects: How to test them, & how to test them well Individual Differences & Item Effects Properties of subjects Cognitive abilities (WM task scores, inhibition) Gender Age
TIMSS ADVANCED 2015 USER GUIDE FOR THE INTERNATIONAL DATABASE. Pierre Foy
 TIMSS ADVANCED 2015 USER GUIDE FOR THE INTERNATIONAL DATABASE Pierre Foy TIMSS Advanced 2015 orks User Guide for the International Database Pierre Foy Contributors: Victoria A.S. Centurino, Kerry E. Cotter,
VOL. 3, NO. 5, May 2012 ISSN Journal of Emerging Trends in Computing and Information Sciences CIS Journal. All rights reserved.
 Exploratory Study on Factors that Impact / Influence Success and failure of Students in the Foundation Computer Studies Course at the National University of Samoa 1 2 Elisapeta Mauai, Edna Temese 1 Computing
Cal s Dinner Card Deals
 Cal s Dinner Card Deals Overview: In this lesson students compare three linear functions in the context of Dinner Card Deals. Students are required to interpret a graph for each Dinner Card Deal to help
Cross-Year Stability in Measures of Teachers and Teaching. Heather C. Hill Mark Chin Harvard Graduate School of Education
 CROSS-YEAR STABILITY 1 Cross-Year Stability in Measures of Teachers and Teaching Heather C. Hill Mark Chin Harvard Graduate School of Education In recent years, more stringent teacher evaluation requirements
Standards-based Mathematics Curricula and Middle-Grades Students Performance on Standardized Achievement Tests
 Journal for Research in Mathematics Education 2008, Vol. 39, No. 2, 184 212 Standards-based Mathematics Curricula and Middle-Grades Students Performance on Standardized Achievement Tests Thomas R. Post
PROFESSIONAL TREATMENT OF TEACHERS AND STUDENT ACADEMIC ACHIEVEMENT. James B. Chapman. Dissertation submitted to the Faculty of the Virginia
 PROFESSIONAL TREATMENT OF TEACHERS AND STUDENT ACADEMIC ACHIEVEMENT by James B. Chapman Dissertation submitted to the Faculty of the Virginia Polytechnic Institute and State University in partial fulfillment
Examining the Earnings Trajectories of Community College Students Using a Piecewise Growth Curve Modeling Approach
 Examining the Earnings Trajectories of Community College Students Using a Piecewise Growth Curve Modeling Approach A CAPSEE Working Paper Shanna Smith Jaggars Di Xu Community College Research Center Teachers
Algebra 1, Quarter 3, Unit 3.1. Line of Best Fit. Overview
 Algebra 1, Quarter 3, Unit 3.1 Line of Best Fit Overview Number of instructional days 6 (1 day assessment) (1 day = 45 minutes) Content to be learned Analyze scatter plots and construct the line of best
Chapters 1-5 Cumulative Assessment AP Statistics November 2008 Gillespie, Block 4
 Chapters 1-5 Cumulative Assessment AP Statistics Name: November 2008 Gillespie, Block 4 Part I: Multiple Choice This portion of the test will determine 60% of your overall test grade. Each question is
GDP Falls as MBA Rises?
 Applied Mathematics, 2013, 4, 1455-1459 http://dx.doi.org/10.4236/am.2013.410196 Published Online October 2013 (http://www.scirp.org/journal/am) GDP Falls as MBA Rises? T. N. Cummins EconomicGPS, Aurora,
A Model to Predict 24-Hour Urinary Creatinine Level Using Repeated Measurements
 Virginia Commonwealth University VCU Scholars Compass Theses and Dissertations Graduate School 2006 A Model to Predict 24-Hour Urinary Creatinine Level Using Repeated Measurements Donna S. Kroos Virginia
Multiple regression as a practical tool for teacher preparation program evaluation
 Multiple regression as a practical tool for teacher preparation program evaluation ABSTRACT Cynthia Williams Texas Christian University In response to No Child Left Behind mandates, budget cuts and various
Sociology 521: Social Statistics and Quantitative Methods I Spring Wed. 2 5, Kap 305 Computer Lab. Course Website
 Sociology 521: Social Statistics and Quantitative Methods I Spring 2012 Wed. 2 5, Kap 305 Computer Lab Instructor: Tim Biblarz Office hours (Kap 352): W, 5 6pm, F, 10 11, and by appointment (213) 740 3547;
NIH Public Access Author Manuscript J Prim Prev. Author manuscript; available in PMC 2009 December 14.
 NIH Public Access Author Manuscript Published in final edited form as: J Prim Prev. 2009 September ; 30(5): 497 512. doi:10.1007/s10935-009-0191-y. Using a Nonparametric Bootstrap to Obtain a Confidence
Assignment 1: Predicting Amazon Review Ratings
 Assignment 1: Predicting Amazon Review Ratings 1 Dataset Analysis Richard Park r2park@acsmail.ucsd.edu February 23, 2015 The dataset selected for this assignment comes from the set of Amazon reviews for
Erkki Mäkinen State change languages as homomorphic images of Szilard languages
 Erkki Mäkinen State change languages as homomorphic images of Szilard languages UNIVERSITY OF TAMPERE SCHOOL OF INFORMATION SCIENCES REPORTS IN INFORMATION SCIENCES 48 TAMPERE 2016 UNIVERSITY OF TAMPERE
Instructor: Mario D. Garrett, Ph.D. Phone: Office: Hepner Hall (HH) 100
 100") San Diego State University School of Social Work 610 COMPUTER APPLICATIONS FOR SOCIAL WORK PRACTICE Statistical Package for the Social Sciences Office: Hepner Hall (HH) 100 Instructor: Mario D. Garrett,
San Diego State University School of Social Work 610 COMPUTER APPLICATIONS FOR SOCIAL WORK PRACTICE Statistical Package for the Social Sciences Office: Hepner Hall (HH) 100 Instructor: Mario D. Garrett,
Truth Inference in Crowdsourcing: Is the Problem Solved?
 Truth Inference in Crowdsourcing: Is the Problem Solved? Yudian Zheng, Guoliang Li #, Yuanbing Li #, Caihua Shan, Reynold Cheng # Department of Computer Science, Tsinghua University Department of Computer
Understanding and Interpreting the NRC s Data-Based Assessment of Research-Doctorate Programs in the United States (2010)
") Understanding and Interpreting the NRC s Data-Based Assessment of Research-Doctorate Programs in the United States (2010) Jaxk Reeves, SCC Director Kim Love-Myers, SCC Associate Director Presented at UGA
Understanding and Interpreting the NRC s Data-Based Assessment of Research-Doctorate Programs in the United States (2010) Jaxk Reeves, SCC Director Kim Love-Myers, SCC Associate Director Presented at UGA
Empowering Students Learning Achievement Through Project-Based Learning As Perceived By Electrical Instructors And Students
 Edith Cowan University Research Online EDU-COM International Conference Conferences, Symposia and Campus Events 2006 Empowering Students Learning Achievement Through Project-Based Learning As Perceived
12- A whirlwind tour of statistics
 CyLab HT 05-436 / 05-836 / 08-534 / 08-734 / 19-534 / 19-734 Usable Privacy and Security TP :// C DU February 22, 2016 y & Secu rivac rity P le ratory bo La Lujo Bauer, Nicolas Christin, and Abby Marsh
Peer Influence on Academic Achievement: Mean, Variance, and Network Effects under School Choice
 Megan Andrew Cheng Wang Peer Influence on Academic Achievement: Mean, Variance, and Network Effects under School Choice Background Many states and municipalities now allow parents to choose their children
Match Quality, Worker Productivity, and Worker Mobility: Direct Evidence From Teachers
 Match Quality, Worker Productivity, and Worker Mobility: Direct Evidence From Teachers C. Kirabo Jackson 1 Draft Date: September 13, 2010 Northwestern University, IPR, and NBER I investigate the importance
Mathematics. Mathematics
 Mathematics Program Description Successful completion of this major will assure competence in mathematics through differential and integral calculus, providing an adequate background for employment in
NBER WORKING PAPER SERIES USING STUDENT TEST SCORES TO MEASURE PRINCIPAL PERFORMANCE. Jason A. Grissom Demetra Kalogrides Susanna Loeb
 NBER WORKING PAPER SERIES USING STUDENT TEST SCORES TO MEASURE PRINCIPAL PERFORMANCE Jason A. Grissom Demetra Kalogrides Susanna Loeb Working Paper 18568 http://www.nber.org/papers/w18568 NATIONAL BUREAU
Python Machine Learning
 Python Machine Learning Unlock deeper insights into machine learning with this vital guide to cuttingedge predictive analytics Sebastian Raschka [ PUBLISHING 1 open source I community experience distilled
The relationship between national development and the effect of school and student characteristics on educational achievement.
 The relationship between national development and the effect of school and student characteristics on educational achievement. A crosscountry exploration. Abstract Since the publication of two controversial
Sociology 521: Social Statistics and Quantitative Methods I Spring 2013 Mondays 2 5pm Kap 305 Computer Lab. Course Website
 Sociology 521: Social Statistics and Quantitative Methods I Spring 2013 Mondays 2 5pm Kap 305 Computer Lab Instructor: Tim Biblarz Office: Hazel Stanley Hall (HSH) Room 210 Office hours: Mon, 5 6pm, F,
SOCIO-ECONOMIC FACTORS FOR READING PERFORMANCE IN PIRLS: INCOME INEQUALITY AND SEGREGATION BY ACHIEVEMENTS
 Tamara I. Petrova, Daniel A. Alexandrov SOCIO-ECONOMIC FACTORS FOR READING PERFORMANCE IN PIRLS: INCOME INEQUALITY AND SEGREGATION BY ACHIEVEMENTS BASIC RESEARCH PROGRAM WORKING PAPERS SERIES: EDUCATION
Travis Park, Assoc Prof, Cornell University Donna Pearson, Assoc Prof, University of Louisville. NACTEI National Conference Portland, OR May 16, 2012
 Travis Park, Assoc Prof, Cornell University Donna Pearson, Assoc Prof, University of Louisville NACTEI National Conference Portland, OR May 16, 2012 NRCCTE Partners Four Main Ac5vi5es Research (Scientifically-based)!!
TABLE OF CONTENTS TABLE OF CONTENTS COVER PAGE HALAMAN PENGESAHAN PERNYATAAN NASKAH SOAL TUGAS AKHIR ACKNOWLEDGEMENT FOREWORD
 TABLE OF CONTENTS TABLE OF CONTENTS COVER PAGE HALAMAN PENGESAHAN PERNYATAAN NASKAH SOAL TUGAS AKHIR ACKNOWLEDGEMENT FOREWORD TABLE OF CONTENTS LIST OF FIGURES LIST OF TABLES LIST OF APPENDICES LIST OF
ROA Technical Report. Jaap Dronkers ROA-TR-2014/1. Research Centre for Education and the Labour Market ROA
 Research Centre for Education and the Labour Market ROA Parental background, early scholastic ability, the allocation into secondary tracks and language skills at the age of 15 years in a highly differentiated
w o r k i n g p a p e r s
 w o r k i n g p a p e r s 2 0 0 9 Assessing the Potential of Using Value-Added Estimates of Teacher Job Performance for Making Tenure Decisions Dan Goldhaber Michael Hansen crpe working paper # 2009_2
Evaluation of Teach For America:
 EA15-536-2 Evaluation of Teach For America: 2014-2015 Department of Evaluation and Assessment Mike Miles Superintendent of Schools This page is intentionally left blank. ii Evaluation of Teach For America:
CS/SE 3341 Spring 2012
 CS/SE 3341 Spring 2012 Probability and Statistics in Computer Science & Software Engineering (Section 001) Instructor: Dr. Pankaj Choudhary Meetings: TuTh 11 30-12 45 p.m. in ECSS 2.412 Office: FO 2.408-B
State University of New York at Buffalo INTRODUCTION TO STATISTICS PSC 408 Fall 2015 M,W,F 1-1:50 NSC 210
 1 State University of New York at Buffalo INTRODUCTION TO STATISTICS PSC 408 Fall 2015 M,W,F 1-1:50 NSC 210 Dr. Michelle Benson mbenson2@buffalo.edu Office: 513 Park Hall Office Hours: Mon & Fri 10:30-12:30
Investment in e- journals, use and research outcomes
 Investment in e- journals, use and research outcomes David Nicholas CIBER Research Limited, UK Ian Rowlands University of Leicester, UK Library Return on Investment seminar Universite de Lyon, 20-21 February
Certified Six Sigma Professionals International Certification Courses in Six Sigma Green Belt
 Certification Singapore Institute Certified Six Sigma Professionals Certification Courses in Six Sigma Green Belt ly Licensed Course for Process Improvement/ Assurance Managers and Engineers Leading the
EDCI 699 Statistics: Content, Process, Application COURSE SYLLABUS: SPRING 2016
 EDCI 699 Statistics: Content, Process, Application COURSE SYLLABUS: SPRING 2016 Instructor: Dr. Katy Denson, Ph.D. Office Hours: Because I live in Albuquerque, New Mexico, I won t have office hours. But
Statewide Framework Document for:
 Statewide Framework Document for: 270301 Standards may be added to this document prior to submission, but may not be removed from the framework to meet state credit equivalency requirements. Performance
Evaluation of ecodriving performances and teaching method: comparing training and simple advice
 EJTIR Issue 14(3), 014 pp. 01-13 ISSN: 1567-7141 www.ejtir.tbm.tudelft.nl Evaluation of ecodriving performances and teaching method: comparing training and simple advice Cindie Andrieu 1, Guillaume Saint
Educational Leadership and Policy Studies Doctoral Programs (Ed.D. and Ph.D.)
") Contact: Susan Korach susan.korach@du.edu Morgridge Office of Admissions mce@du.edu http://morgridge.du.edu/ Educational Leadership and Policy Studies Doctoral Programs (Ed.D. and Ph.D.) Doctoral (Ed.D.
Contact: Susan Korach susan.korach@du.edu Morgridge Office of Admissions mce@du.edu http://morgridge.du.edu/ Educational Leadership and Policy Studies Doctoral Programs (Ed.D. and Ph.D.) Doctoral (Ed.D.
PHD COURSE INTERMEDIATE STATISTICS USING SPSS, 2018
 1 PHD COURSE INTERMEDIATE STATISTICS USING SPSS, 2018 Department Of Psychology and Behavioural Sciences AARHUS UNIVERSITY Course coordinator: Anne Scharling Rasmussen Lectures: Ali Amidi (AA), Kaare Bro
Reduce the Failure Rate of the Screwing Process with Six Sigma Approach
 Proceedings of the 2014 International Conference on Industrial Engineering and Operations Management Bali, Indonesia, January 7 9, 2014 Reduce the Failure Rate of the Screwing Process with Six Sigma Approach
Lecture 1: Machine Learning Basics
 1/69 Lecture 1: Machine Learning Basics Ali Harakeh University of Waterloo WAVE Lab ali.harakeh@uwaterloo.ca May 1, 2017 2/69 Overview 1 Learning Algorithms 2 Capacity, Overfitting, and Underfitting 3
School Size and the Quality of Teaching and Learning
 School Size and the Quality of Teaching and Learning An Analysis of Relationships between School Size and Assessments of Factors Related to the Quality of Teaching and Learning in Primary Schools Undertaken
Professional Development and Incentives for Teacher Performance in Schools in Mexico. Gladys Lopez-Acevedo (LCSPP)*
*") Public Disclosure Authorized Professional Development and Incentives for Teacher Performance in Schools in Mexico Gladys Lopez-Acevedo (LCSPP)* Gacevedo@worldbank.org Public Disclosure Authorized Latin
Public Disclosure Authorized Professional Development and Incentives for Teacher Performance in Schools in Mexico Gladys Lopez-Acevedo (LCSPP)* Gacevedo@worldbank.org Public Disclosure Authorized Latin
STUDENT SATISFACTION IN PROFESSIONAL EDUCATION IN GWALIOR
 International Journal of Human Resource Management and Research (IJHRMR) ISSN 2249-6874 Vol. 3, Issue 2, Jun 2013, 71-76 TJPRC Pvt. Ltd. STUDENT SATISFACTION IN PROFESSIONAL EDUCATION IN GWALIOR DIVYA
Unraveling symbolic number processing and the implications for its association with mathematics. Delphine Sasanguie
 Unraveling symbolic number processing and the implications for its association with mathematics Delphine Sasanguie 1. Introduction Mapping hypothesis Innate approximate representation of number (ANS) Symbols
Discovering Statistics
 School of Psychology Module Handbook 2015/2016 Discovering Statistics Module Convenor: Professor Andy Field NOTE: Most of the questions you need answers to about this module are in this document. Please
Do First Impressions Matter? Predicting Early Career Teacher Effectiveness
 607834EROXXX10.1177/2332858415607834Atteberry et al.do First Impressions Matter? research-article2015 AERA Open October-December 2015, Vol. 1, No. 4, pp. 1 23 DOI: 10.1177/2332858415607834 The Author(s)
Analysis of Enzyme Kinetic Data
 Analysis of Enzyme Kinetic Data To Marilú Analysis of Enzyme Kinetic Data ATHEL CORNISH-BOWDEN Directeur de Recherche Émérite, Centre National de la Recherche Scientifique, Marseilles OXFORD UNIVERSITY
School Competition and Efficiency with Publicly Funded Catholic Schools David Card, Martin D. Dooley, and A. Abigail Payne
 School Competition and Efficiency with Publicly Funded Catholic Schools David Card, Martin D. Dooley, and A. Abigail Payne Web Appendix See paper for references to Appendix Appendix 1: Multiple Schools
PREDISPOSING FACTORS TOWARDS EXAMINATION MALPRACTICE AMONG STUDENTS IN LAGOS UNIVERSITIES: IMPLICATIONS FOR COUNSELLING
 PREDISPOSING FACTORS TOWARDS EXAMINATION MALPRACTICE AMONG STUDENTS IN LAGOS UNIVERSITIES: IMPLICATIONS FOR COUNSELLING BADEJO, A. O. PhD Department of Educational Foundations and Counselling Psychology,
Quantitative analysis with statistics (and ponies) (Some slides, pony-based examples from Blase Ur)
 (Some slides, pony-based examples from Blase Ur)") Quantitative analysis with statistics (and ponies) (Some slides, pony-based examples from Blase Ur) 1 Interviews, diary studies Start stats Thursday: Ethics/IRB Tuesday: More stats New homework is available
Quantitative analysis with statistics (and ponies) (Some slides, pony-based examples from Blase Ur) 1 Interviews, diary studies Start stats Thursday: Ethics/IRB Tuesday: More stats New homework is available
Generating Test Cases From Use Cases
 1 of 13 1/10/2007 10:41 AM Generating Test Cases From Use Cases by Jim Heumann Requirements Management Evangelist Rational Software pdf (155 K) In many organizations, software testing accounts for 30 to
Analyzing the Usage of IT in SMEs
 IBIMA Publishing Communications of the IBIMA http://www.ibimapublishing.com/journals/cibima/cibima.html Vol. 2010 (2010), Article ID 208609, 10 pages DOI: 10.5171/2010.208609 Analyzing the Usage of IT
A Bootstrapping Model of Frequency and Context Effects in Word Learning
 Cognitive Science 41 (2017) 590 622 Copyright 2016 Cognitive Science Society, Inc. All rights reserved. ISSN: 0364-0213 print / 1551-6709 online DOI: 10.1111/cogs.12353 A Bootstrapping Model of Frequency
The Impact of The Leader in Me on Student Engagement and Social Emotional Skills
 Running head: IMPACT OF THE LEADER IN ME PROGRAM 1 The Impact of The Leader in Me on Student Engagement and Social Emotional Skills Brant Goble, Jie Zhang, Komako Suzuki, Tony Norman, Gary Houchens, Jenni
Comparison of network inference packages and methods for multiple networks inference
 Comparison of network inference packages and methods for multiple networks inference Nathalie Villa-Vialaneix http://www.nathalievilla.org nathalie.villa@univ-paris1.fr 1ères Rencontres R - BoRdeaux, 3
Discovering Statistics
 School of Psychology Module Handbook 2013/2014 Discovering Statistics Module Convenor: Professor Andy Field NOTE: Most of the questions you need answers to about this module are in this document. Please
Accessing Higher Education in Developing Countries: panel data analysis from India, Peru and Vietnam
 Accessing Higher Education in Developing Countries: panel data analysis from India, Peru and Vietnam Alan Sanchez (GRADE) y Abhijeet Singh (UCL) 12 de Agosto, 2017 Introduction Higher education in developing
Corpus Linguistics (L615)
") (L615) Basics of Markus Dickinson Department of, Indiana University Spring 2013 1 / 23 : the extent to which a sample includes the full range of variability in a population distinguishes corpora from archives
(L615) Basics of Markus Dickinson Department of, Indiana University Spring 2013 1 / 23 : the extent to which a sample includes the full range of variability in a population distinguishes corpora from archives
Evaluating Interactive Visualization of Multidimensional Data Projection with Feature Transformation
 Multimodal Technologies and Interaction Article Evaluating Interactive Visualization of Multidimensional Data Projection with Feature Transformation Kai Xu 1, *,, Leishi Zhang 1,, Daniel Pérez 2,, Phong
Foothill College Fall 2014 Math My Way Math 230/235 MTWThF 10:00-11:50 (click on Math My Way tab) Math My Way Instructors:
 Math My Way Instructors:") This is a team taught directed study course. Foothill College Fall 2014 Math My Way Math 230/235 MTWThF 10:00-11:50 www.psme.foothill.edu (click on Math My Way tab) Math My Way Instructors: Instructor:
This is a team taught directed study course. Foothill College Fall 2014 Math My Way Math 230/235 MTWThF 10:00-11:50 www.psme.foothill.edu (click on Math My Way tab) Math My Way Instructors: Instructor:
Greek Teachers Attitudes toward the Inclusion of Students with Special Educational Needs
 American Journal of Educational Research, 2014, Vol. 2, No. 4, 208-218 Available online at http://pubs.sciepub.com/education/2/4/6 Science and Education Publishing DOI:10.12691/education-2-4-6 Greek Teachers
How the Guppy Got its Spots:
 This fall I reviewed the Evobeaker labs from Simbiotic Software and considered their potential use for future Evolution 4974 courses. Simbiotic had seven labs available for review. I chose to review the
How Effective is Anti-Phishing Training for Children?
 How Effective is Anti-Phishing Training for Children? Elmer Lastdrager and Inés Carvajal Gallardo, University of Twente; Pieter Hartel, University of Twente; Delft University of Technology; Marianne Junger,
Spring 2014 SYLLABUS Michigan State University STT 430: Probability and Statistics for Engineering
 Spring 2014 SYLLABUS Michigan State University STT 430: Probability and Statistics for Engineering Time and Place: MW 3:00-4:20pm, A126 Wells Hall Instructor: Dr. Marianne Huebner Office: A-432 Wells Hall
Office Hours: Mon & Fri 10:00-12:00. Course Description
 1 State University of New York at Buffalo INTRODUCTION TO STATISTICS PSC 408 4 credits (3 credits lecture, 1 credit lab) Fall 2016 M/W/F 1:00-1:50 O Brian 112 Lecture Dr. Michelle Benson mbenson2@buffalo.edu
Continual Curiosity-Driven Skill Acquisition from High-Dimensional Video Inputs for Humanoid Robots
 Continual Curiosity-Driven Skill Acquisition from High-Dimensional Video Inputs for Humanoid Robots Varun Raj Kompella, Marijn Stollenga, Matthew Luciw, Juergen Schmidhuber The Swiss AI Lab IDSIA, USI
Working Paper: Do First Impressions Matter? Improvement in Early Career Teacher Effectiveness Allison Atteberry 1, Susanna Loeb 2, James Wyckoff 1
 Center on Education Policy and Workforce Competitiveness Working Paper: Do First Impressions Matter? Improvement in Early Career Teacher Effectiveness Allison Atteberry 1, Susanna Loeb 2, James Wyckoff
ATW 202. Business Research Methods
 ATW 202 Business Research Methods Course Outline SYNOPSIS This course is designed to introduce students to the research methods that can be used in most business research and other research related to
APPENDIX A: Process Sigma Table (I)
") APPENDIX A: Process Sigma Table (I) 305 APPENDIX A: Process Sigma Table (II) 306 APPENDIX B: Kinds of variables This summary could be useful for the correct selection of indicators during the implementation
APPENDIX A: Process Sigma Table (I) 305 APPENDIX A: Process Sigma Table (II) 306 APPENDIX B: Kinds of variables This summary could be useful for the correct selection of indicators during the implementation
Syntax Parsing 1. Grammars and parsing 2. Top-down and bottom-up parsing 3. Chart parsers 4. Bottom-up chart parsing 5. The Earley Algorithm
 Syntax Parsing 1. Grammars and parsing 2. Top-down and bottom-up parsing 3. Chart parsers 4. Bottom-up chart parsing 5. The Earley Algorithm syntax: from the Greek syntaxis, meaning setting out together
On the Distribution of Worker Productivity: The Case of Teacher Effectiveness and Student Achievement. Dan Goldhaber Richard Startz * August 2016
 On the Distribution of Worker Productivity: The Case of Teacher Effectiveness and Student Achievement Dan Goldhaber Richard Startz * August 2016 Abstract It is common to assume that worker productivity
Teacher Quality and Value-added Measurement
 Teacher Quality and Value-added Measurement Dan Goldhaber University of Washington and The Urban Institute dgoldhab@u.washington.edu April 28-29, 2009 Prepared for the TQ Center and REL Midwest Technical
STAT 220 Midterm Exam, Friday, Feb. 24
 STAT 220 Midterm Exam, Friday, Feb. 24 Name Please show all of your work on the exam itself. If you need more space, use the back of the page. Remember that partial credit will be awarded when appropriate.
AGS THE GREAT REVIEW GAME FOR PRE-ALGEBRA (CD) CORRELATED TO CALIFORNIA CONTENT STANDARDS
 CORRELATED TO CALIFORNIA CONTENT STANDARDS") AGS THE GREAT REVIEW GAME FOR PRE-ALGEBRA (CD) CORRELATED TO CALIFORNIA CONTENT STANDARDS 1 CALIFORNIA CONTENT STANDARDS: Chapter 1 ALGEBRA AND WHOLE NUMBERS Algebra and Functions 1.4 Students use algebraic
AGS THE GREAT REVIEW GAME FOR PRE-ALGEBRA (CD) CORRELATED TO CALIFORNIA CONTENT STANDARDS 1 CALIFORNIA CONTENT STANDARDS: Chapter 1 ALGEBRA AND WHOLE NUMBERS Algebra and Functions 1.4 Students use algebraic
PREDICTING SPEECH RECOGNITION CONFIDENCE USING DEEP LEARNING WITH WORD IDENTITY AND SCORE FEATURES
 PREDICTING SPEECH RECOGNITION CONFIDENCE USING DEEP LEARNING WITH WORD IDENTITY AND SCORE FEATURES Po-Sen Huang, Kshitiz Kumar, Chaojun Liu, Yifan Gong, Li Deng Department of Electrical and Computer Engineering,
Likelihood-Maximizing Beamforming for Robust Hands-Free Speech Recognition
 MITSUBISHI ELECTRIC RESEARCH LABORATORIES http://www.merl.com Likelihood-Maximizing Beamforming for Robust Hands-Free Speech Recognition Seltzer, M.L.; Raj, B.; Stern, R.M. TR2004-088 December 2004 Abstract
Improving Conceptual Understanding of Physics with Technology
 INTRODUCTION Improving Conceptual Understanding of Physics with Technology Heidi Jackman Research Experience for Undergraduates, 1999 Michigan State University Advisors: Edwin Kashy and Michael Thoennessen
The Impact of Formative Assessment and Remedial Teaching on EFL Learners Listening Comprehension N A H I D Z A R E I N A S TA R A N YA S A M I
 The Impact of Formative Assessment and Remedial Teaching on EFL Learners Listening Comprehension N A H I D Z A R E I N A S TA R A N YA S A M I Formative Assessment The process of seeking and interpreting