Educational Initiatives Pvt. Ltd.
|
|
|
- Herbert Neal
- 6 years ago
- Views:
Transcription
1 0
2 FOREWORD School education is a very important part of progress in society. We need to provide our children quality education in an equitable manner. This is one important path towards a just, equitable and humane society. Wipro is committed to this cause and has been working for more than a decade on various projects to help improve school education in India through Wipro Applying Thought in Schools program. Wipro has also been working with engineering colleges to help improve quality of education. This is through our Mission 10X program. In my personal capacity, through the Azim Premji Foundation (and the University founded by it), we have been working in collaboration with various state governments to help improve quality and equity in the government schooling system. There are many dimensions on which we need to work in a sustained manner to bring about quality & equity in education. One of these dimensions is the understanding of what is happening in different kinds of schools. Wipro and Educational Initiatives have partnered in the Quality Education Study to understand popular schools in India better. Five years ago we had undertaken the Student Learning in Metros study. From that study, we had learnt that there were serious gaps in the way children learn even in popular schools. Our education system seemed to mainly encourage rote learning and memorization. We undertook the current study to re-assess the situation and also to throw light on other aspects that contribute to quality in education e.g. organizational issues of the school, student attitude and values. The study has taken a year of hard work by the team that has worked on it. However we should treat this study as a beginning. Many of these findings require deeper research before we generalize. We hope that this study will trigger more debate and further research and help in expanding our understanding of quality education. - Azim H. Premji Chairman, Wipro Limited 1

3 ACKNOWLEDGEMENT From the Authors: The Quality Education Study would not have been possible without the help and support of a large number of people. We would like to specifically thank the School Principals for giving permissions to freely conduct the study in the schools for classes 4, 6 and 8. We would also like to acknowledge the support and guidance of experts who helped in finalisation of the instruments and various aspects of the study. We would like to express our gratitude to the Wipro team for their continued support throughout the study. Lastly, we are also thankful to the students, teachers of the schools who participated in the assessments. MR. SRIDHAR RAJAGOPALAN, (Managing Director) MS. VYJAYANTHI SANKAR, (VP Large Scale Assessment) Mr. VISHNUTEERTH AGNIHOTRI (VP Test Development) MR. SREEKANTH SREEDHARAN Manager - Wipro Applying Thought in Schools MR. PRAKASH IYER, Consultant - Wipro Applying Thought in Schools 2
4 THE TEAM Wipro Mr. Anurag Behar, Chief Sustainability Officer, Wipro Ltd. Mr. Sreekanth Sreedharan, Manager Wipro Applying Thought in Schools Mr. Prakash Iyer, Consultant Wipro Applying Thought in Schools Ms. Shaheen Shasa, Consultant Wipro Applying Thought in Schools Educational Initiatives Mr. Sridhar Rajagopalan, Managing Director Ms. Vyjayanthi Sankar, Vice - President, Large Scale Assessments Mr. Vishnuteerth Agnihotri, Vice - President, Test Development Ms. Gauri Sharma, Project Manager Mr. Alex Rios, Data Analyst Ms. Archana Dwivedi, Research Fellow Mr. Arpit Metaliya, Software Specialist Mr. Ashtamurthy Killimangalam, Educational Specialist Ms. Asmi Arul, Educational Fellow Ms. Bharti Porwal, Educational Specialist Mr. Devpal Shah, Manager - Design and Printing Ms. Diana Romany, Educational Specialist Ms. Jayasree T. Subramanian, Educational Specialist Mr. Ketan Beherawala, Asst Manager - Accounts Mr. M.S. Sudarshan, Process Coordinator for LSA Mr. Maulik Shah, Educational Specialist Ms. Meghna Kumar, Educational Specialist Ms. N.V.N.S.S. Durga, Junior Graphic Designer Mr. Nishchal Shukla, Educational Specialist Mr. Raghav Rohatgi, Project Manager Mr. Rajendra Soyantar, Graphic Designer Ms. Sailaja Ravi, Research Fellow Ms. Sowmya N, Junior Graphic Designer Ms. Swara Pandya, Educational Specialist Dr. Zoola Kapasi, Research Associate - Data Analysis and Public Policy City Co-coordinators Ms. Jasmeet Anand (Mumbai) Ms. Madhumita Chakravarti (Kolkata) Ms. Mary Backianathan (Bangalore) Ms. Shivani Khatri (Delhi) Mr. Sudeep Chaudhuri (Kolkata) Mr. Sudhakar Simon (Chennai) Ms. Swathi Sathish (Bangalore) 3
5 External Experts Dr. Amita Chudgar, Educational Researcher Prof. Arvind Gupta, Academic and Pedagogy Expert Ms. Devi Kar, School Principal Mr. Jim Tharu, Educational Researcher Mr. Dhananjay Karopady, Azim Premji Foundation Mr. Rohit Dhankar, Digantar Ms. Sandhya Siddharth, School Principal Ms. Shaheen Mistri, Educationist Mr. Shekhar Seshadri, Child Psychologist 4
6 CONTENTS EXECUTIVE SUMMARY 7 1. DESIGN OF THE STUDY 1.1. Need For The Study About The Study Salient Features Of The Study Study Coverage And Sample Design How The Study Was Carried Out Question Paper Design Background Questionnaires Design Focus Group Discussions and Principal Interviews OVERALL LEARNINGS: STUDENT OUTCOMES 2.1. Student s Learning Outcomes Students Attitudes toward Gender Equality, Diversity and Sensitivity Students Awareness and Attitudes toward Civic/Citizenship Issues Students Awareness and Attitudes toward Ecological Issues Students Values and Interpersonal Skills Students Participation in Co-scholastic Activities LEARNING ENVIRONMENTS: SITUATIONAL FACTS 3.1. Description of School Background Description of Principal and Teachers Background Description of Student Background LEARNING ENVIRONMENTS: PRACTICES AND PERCEPTIONS 4.1. The School Context - Leadership and Management Parameters The Classroom Context - Teacher Beliefs, Practices, Classroom Climate, Students' Self Concept LEARNING ENVIRONMENTS: LINKAGES 5.1. Leadership Styles versus School Climate Teachers Teaching-Learning Beliefs versus Job satisfaction and Self Efficacy Teachers Teaching-Learning Beliefs versus Student Performance Teachers Teaching-Learning Beliefs versus Academic Pressure Principal and Teacher Beliefs on Student Discipline versus Student Performance Classroom Climate versus Principal and Teacher Beliefs on Student Discipline Classroom Climate versus Student Performance Classroom Climate versus Student Values and Interpersonal Skills Students Self Perception about their Learning and their Performance Students Self Perception about their learning and their Performance versus Academic Pressure Students Self Perception about Co-Scholastic Abilities and their Participation Student Background Factors and their Performance 81 5
7 6. RECOMMENDATIONS 6.1. Overall Recommendations Limitations 94 BIBLIOGRAPHY 95 APPENDIX Appendix A: List of Competencies Tested 98 Appendix B: List of Parameter, Dimension and Sub-dimension covered in Principal, Teacher and School Questionnaire 101 Appendix C: Samples of Writing Task 113 Appendix D: Overall Summary For All Papers 116 Appendix E: City-wise Statistics For All Papers 117 Appendix F: Board-wise Statistics For All Papers 119 Appendix G: Invitation Letter to Schools 121 Appendix H: Note on Test Equating Method 123 Appendix I: Principal Questionnaire 124 Appendix J: Teacher Questionnaire 129 Appendix K: Student Questionnaire Class Appendix L: Student Questionnaire Class Appendix M: Student Questionnaire Class Appendix N: Question Papers 145 6
8 EXECUTIVE SUMMARY Quality Education Study (QES) aims to find answers to what constitutes Quality education. This study has been conceptualized and managed jointly by the Wipro and Educational Initiatives (EI) and the execution was carried out by EI. This was planned as a multi-year study to expand the meaning of quality in education to include educational outcomes beyond student performance in subjects and study the attributes of quality learning environments. Although myriad views exist on what constitutes Quality education, majority of them relate it to be a reflection of the scholastic, co-scholastic and affective (specifically values and attitude) outcomes. Quality education is often closely linked with what experts refer to as, first, quality learning environments and second, holistic development of students (UNESCO, 2002). This report covers the findings of year 1 based on the large scale study of the scholastic, co-scholastic and affective outcomes and the different aspects of the learning environments found in India s top schools (identified through a survey of popular and expert opinion). Salient Features of the Study: Feature Expert Panel Coverage Background Questionnaires Questions to Understand Students Values and Attitudes Focus Group Discussions Principal Interviews Specially Assembled Test Paper A Secondary Study A Writing Task Completely Invigilated Tests Analysis Details Experts included professors from premier research institutions in India and USA, educationists from different NGOs working hands on in the field of education, academic and pedagogy experts, child psychologists and school principals. Overall, about 23,000 students, 790 teachers and 54 Principals from 89 schools participated in the study including 6 schools recommended by experts as schools providing different learning environments. Three different background questionnaires one each for student, teacher and school principal were developed based on detailed secondary research. A section to gather information on students perception and their attitude towards various social issues was also included. A sub sample of 16 schools was selected for further collection of qualitative information through Focus group discussions (FGD). In these schools, FGDs were carried out with students of classes 4, 6 and 8 as well as teachers handling these classes. The Principals in the sub sample of 16 schools were also interviewed to gather their views on education, their own school, teachers and other staff. The test consisted of questions carefully selected from a pool of ASSET items which have already been extensively tested with thousands of students. These questions checked if students are learning with understanding and are able to carry out higher order cognitive tasks. e.g., critical thinking. Few questions were also selected from international studies such as Trends in Mathematics and Science Study (TIMSS), Progress in Reading Literacy Study (PIRLS) and national studies by EI such as Student Learning in Metros (SLIM) Study. A Secondary study to track progress in student learning was also carried out with some classrooms (sections) in the participating schools. An essay writing task was included in the secondary survey to reveal insights about the writing competencies of students in these top schools. All the tests were invigilated by EI trained representatives Different types of advanced analysis were carried out on the collected data to extract patterns related to different aspects of the study. 7
9 Key Messages Emerging from the Study: 1. Students in the Top schools of our country exhibit rote learning. Performance of class 4 found to be below international average. Students seem to perform on par with international average in class 8, mainly due to their higher achievement in procedural questions (i.e., questions that require straightforward use of techniques or learnt procedures to arrive at the answers). Misconceptions acquired in lower classes continue in higher classes without any correction in their learning. Performance of top schools here means the number of students who give the correct answer to a question. 2. Students exhibited diverse thinking on questions on gender equality, acceptance of cultural and religious diversity, civic, citizenship and ecological responsibilities. Some of them indicate a bias which might over time grow into prejudices. It is possible that children are not getting exposed to different perspectives on these issues and thus that their thinking is not well-informed. 3. Different aspects of learning environments such as Principal s instructional leadership (leadership and support to teachers in academic areas), teacher beliefs in constructivist teaching learning practices, Principals feelings of self efficacy are associated with better student achievement. Classrooms where teachers and principals do not believe in physical punishment, where students feel involved in the classroom practices and believe that their teachers treat everyone equally also seem to be linked to greater student performance. 4. A majority of Principals think that co-scholastic areas are relevant for building students self-confidence, selfcontrol, sportsmanship, solidarity, teamwork, competitiveness and health. Data reflects that there is no major emphasis in the school curriculum on these areas. Among co-scholastic areas, sports, art and craft are given higher emphasis than music, dance drama and debates. 5. A few background factors - such as students spending at least 60 minutes each day reading material other than textbooks, students being able to read as well as do their homework independently, being taught by maths teachers with a masters degree in education, students being able to share their school problems with their parents - are associated with greater student achievement. MAIN FINDINGS STUDENT OUTCOMES STUDENT PERFORMANCE IN ENGLISH, MATHS, SCIENCE AND SOCIAL STUDIES 1. Performance is lower when compared to International standards: Students in top schools of India performed lower than the international average on questions used from studies such as Trends in International Maths and Science Study (TIMSS) and Progress in Reading Literacy Study (PIRLS) at class 4 level, while they performed on par at class 8 level. The improvement in class 8 level was due to the higher performance observed on procedural questions. 2. Drop in learning levels from a previous (SLIMS 2006 India Today cover story) study in 2006: In all the papers tested and on common questions from the previous SLIMS study, students performed lower in the Quality Education Study, and the fall was higher in Maths 4, Maths 6, and English 8. The SLIMS study (carried out by EI and Wipro in 2006) assessed students in India s top schools for their conceptual understanding and found that our top schools don t promote conceptual learning in students. QES results show that there has been a further drop from the already unsatisfactory levels of
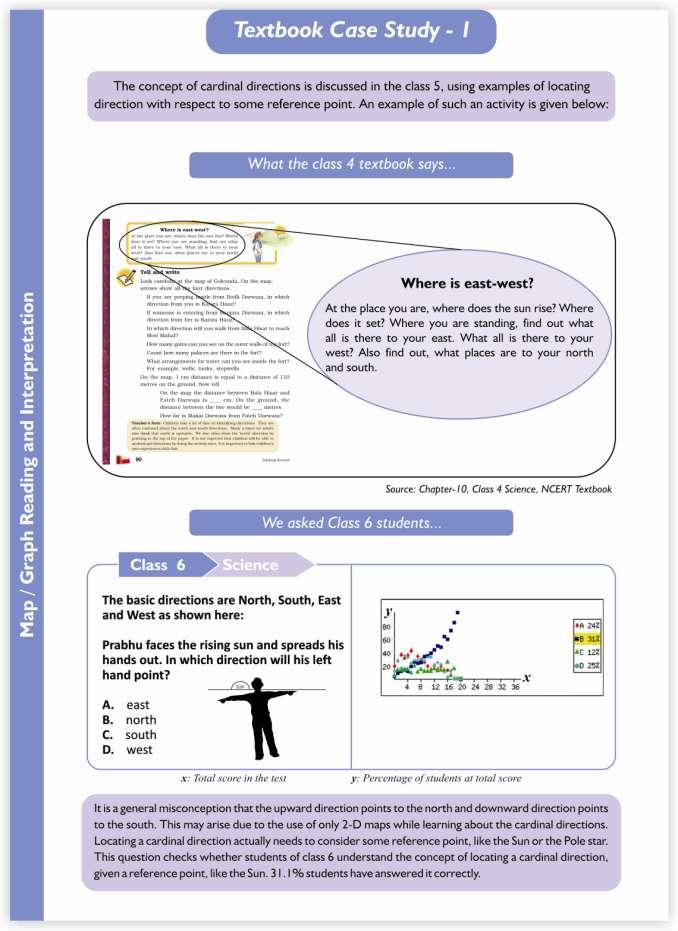
10 Class 4 EVS Class 4, 6, 8 Maths Adi goes to Rainbow Public School, which is near his house. Given below is a map which shows both his house and his school. Look at it carefully to answer the question. Afzal has made a square on his computer screen. He now turns the shape as shown. What is the change in the shape? A. The square changes into some other shape and its side lengths also change. While going to school, Adi passes by the temple every day. In which direction is the temple located, with reference to Adi's house? A. North B. North East C. North West D. West Sample Question: Only 30% of students could answer this question correctly (option B). 23% of students selected the wrong option A. Students probably think that any place which is located above in a map is located north. 17% of students selected the wrong option C. These students probably got confused between northwest and northeast. 12% of students chose the wrong option D. These students probably do not have clear idea about cardinal and intermediate directions. B. The square changes into some other shape but its side lengths don t change. C. The figure remains a square, but its side lengths change. D. The figure remains a square, and there is no change in its side lengths. Sample Question: Students seem to identify shapes based on visual images that they have been familiar with and not by their properties. They seem to have a misconception that by changing the orientation (rotating) of a shape, its dimensions like length would also change. It is observed that the percentage of students choosing the correct answer D is increasing as we move to the higher classes (16%, 32%, 49% in classes 4, 6 and 8). However it is important to note that the extent of the students choosing option B (the most common wrong answer) is not decreasing much (47%, 49%, 42% in classes 4, 6 and 8 respectively). 3. Significant differences in schools affiliated to different boards and in different cities: The findings from board-wise comparison reveals that schools from Council for the Indian School Certificate Examinations (CISCE) and Central Board of Secondary Education (CBSE) performed among the top 2 and the differences with other boards were statistically significant. CISCE also performed significantly better than CBSE. The comparison of scores reveals that students from Kolkata and Delhi performed signicantly better than Mumbai, Chennai and Bangalore. Mumbai performed at par with overall average of these 5 metros. Bangalore performed significantly lower than other metro cities. Kolkata had a large number of ICSE schools whil Delhi had mostly CBSE schools which could be the reason for their higher performance. 4. Students exhibit rote learning and perform comparatively better in questions that are procedural or do not involve deeper understanding or application of concepts. 5. Practical competencies such as map reading, using good language while writing, measurement, general awareness of well known facts, etc are not developed well. 6. Students seem to harbour a number of misconceptions in the different subjects. As students move to higher classes, although the overall performance improves, the number of students holding on to same misconception continues, which indicates that if a student develops a misconception in a lower class, then it is more likely to continue in higher classes too without getting corrected. 7. Boys were seen to perform better than girls in Maths and Science at class 8 level, while no such significant differences were found in other classes or subjects such as English and Social Studies. 9
11 Class 4, 6 and 8 Amrita is a ten-year-old girl. Her mother works as a maid and her father is a farm labourer. Amrita has two sisters and one brother. They are all younger than her. Her parents say that she doesn t need to go to school because she will marry and leave the family when she becomes an adult. What do you think about this? E. All girls must go to school, even if the family is poor. F. It's better if she stays at home and takes care of the younger children. G. If they are poor and they can send only one child to school, they should send the boy. H. Girls don't help their parents after they are married, so they don't need to go to school. A-D: Answer Options, E: Not Attempted, F: Invalid Entries STUDENTS ATTITUDES TOWARD GENDER EQUALITY, DIVERSITY AND SENSITIVITY 1. Gender Equality: About 40-43% of students in classes 4, 6 and 8 felt that education for a girl is not as important as responsibility towards the family, if a choice has to be made between a boy or girl child in providing education, boys are to be preferred over girls. Some of them also felt that in the long run, educating a girl is a waste of resources. While 35% of class 4 students and 47% of class 8 students felt that both boys and girls are equally capable, about 15-20% of students in both classes believe that abilities are determined by gender. About 15% of class 8 students believe that females are more likely to be burdensome to their parents. The results indicate the deep rooted bias against the girl child even in students from families which probably belong to the educated and higher socio economic strata of the society. 2. Acceptance of Diversity: Nearly half the students surveyed believed that people come closer to each other due to mutual respect and understanding, and not due to religion. However, the other half had preconceived beliefs about people from other religions and that religious differences matter and need to be defended by violence if necessary. While 29% of students believe that Indians can live and work freely in any state of India, nearly 60% students showed less acceptance towards immigrants from other states as they felt that immigrants have to conform to the state s traditions, they take away jobs from natives of the state and also are a source of communal disagreements. 3. Sensitivity towards Others: A large majority (70-80%) of students across different classes think of differently abled people as either burdensome, unhappy or not able to do well in studies. However acceptance of differently-abled peers as capable people is slightly higher among older students (21.0% in class 4 to 29.0% in class 8). 60% of students show lesser sensitivity towards HIV affected people and a lack of awareness about the nature of HIV. This could be because the awareness creation efforts are not effectively reaching out to the children. 10
12 STUDENTS AWARENESS AND ATTITUDES TOWARD CIVIC/CITIZENSHIP ISSUES 4. Students in class 4 seem to have a stronger sense of civic responsibility than students of class 8 with regard to disposal of garbage. Older students seem to have less personal responsibility and repeat undesirable practices if they see everybody's doing it, or if there is extra work involved in doing the desirable thing. A large majority of 67% of students think that it is ok not to consider others convenience if done only once in a while is or if they do not complain or one is clear that laws are not being broken. About 45% of students in classes 4 to 8, generally show an extremely positive attitude of trust towards the police and believes that police will try their best to help people. Nearly 20% of students think that it is ok to bend traffic rules in an emergency or as long as there is no personal harm. Nearly 20% of students also would vote based on their community affiliation. STUDENTS AWARENESS AND ATTITUDES TOWARD ECOLOGICAL ISSUES % of students at all three class levels think that ecological/environmental issues are the responsibility of a higher institution e.g. government, while 32-44% of students at all three class levels understand that personal use can make a difference to the environment. STUDENTS VALUES AND INTERPERSONAL SKILLS 6. 30% of students said that they did not think how their actions would affect others, wanted to have the last word in an argument, felt uncomfortable if people disagreed with them, and were aggressive in arguments. CO-SCHOLASTIC CURRICULUM 7. A large number of Principals (more than 70%) say that co-scholastic areas is definitely very relevant to curriculum and for building students self-confidence, self-control, sportsmanship, solidarity, teamwork, competitiveness, health, etc. However, less than half of who said so mentioned that their school places no major emphasis in curriculum for these areas, indicating that what is being said is not often practiced. Schools on an average spend 9% and 10% each of time respectively on physical education/sports and co-scholastic activities like music/art/dance/ elocution/dramatics. About 60% of class time is spent on learning academic subjects. Around 40-60% of students reported having sessions for sports, art/craft and music once a week or more. Almost all the schools tested, rated themselves as good or excellent (average scale score of 4 or above) in the quality of the services (instrument/ material, room/auditorium, and availability of instructor) in the coscholastic areas. Dance, sport, debates and art had slightly higher facilities (such as equipment/material, room/auditorium and instructor) than dramatics or music. 11
13 MAIN FINDINGS LEARNING ENVIRONMENTS LEADERSHIP AND MANAGEMENT STYLES 1. Decision Making: Principals are the main decision makers on the courses offered, student disciplinary policies, assessment policies, student admissions and teacher recruitment in these schools. The management controls and mainly decides on the school budgets, its allocations, teacher salaries, increments and teacher recruitments. The teachers decide mostly on the textbook and course content. Locus of Control Decision Making School Management Principal Teachers Central Authority CURRICULUM AND CONTENTS Choosing which textbooks are to be used. - Determining the course content. - Deciding which courses are to be offered. - STUDENT POLICIES Establishing student disciplinary policies. - - Establishing student assessment policies. - - Approving students for admission to the school. - BUDGET Formulating the school budget. - - Deciding on budget allocations within the school. - - TEACHER POLICIES Selecting teachers for hire. - - Dismissal of teachers. - - Establishing teachers starting salaries. - Determining teachers salary increases. - - Main decision maker Decides in consultation with main decision maker Central Authority refers to a school board or Ministry of education. Contributes to decisions 2. Instructional and Administrative Leadership: QES looked into the different styles of leadership such as instructional leadership (Instructional leadership included framing of school goals, communicating school goals, coordinating the curriculum, supervision of instruction, monitoring school progress and promoting professional development of teachers) and administrative leadership (Administrative leadership included accountability and upholding bureaucratic rules) followed by the Principals of India s top schools. Principals who have a Master s degree in education were seen to embrace significantly higher instructional leadership style than their counterparts who had only a Bachelor s degree in education. There was no such significant difference for administrative leadership style. For schools, where the Principals were found to have a higher instructional leadership, performance of students was found to be higher in Language (15.17 points), Maths (22.54 points) and Science (10.96 points). Principals who have higher instructional leadership also tend to delegate and distribute leadership more and ensure involvement of staff who may have various viewpoints. Such Principals also support a committee structure for decision making and facilitate effective communication among the staff. 3. Almost all Principals and Teachers reported being highly satisfied with their job and had perceptions of self-efficacy. Analysis of Principal and teacher responses showed that they felt that there is a high degree of trusting and collaborative climate among teachers and principal, there is distribution of leadership, and effective communication among stakeholders in their schools. However, majority of teachers (55%) felt that they are not involved in important policy decisions of their schools. 12
14 TEACHER APPRAISAL, FEEDBACK AND MENTORING 4. Nearly 25% of schools did not have teacher appraisal methods or carried them out only once every 2 or three years. 75% of schools said that they did teacher appraisals once or more in a year. While Student Assessment, Teacher Peer Review and Principal observation were often the methods of teacher appraisal, using an external inspector was the least followed method of appraisal. While 95.6% of Principals said that they gave feedback after appraisal, only 68.7% of Teachers said that they received feedback from appraisal. Both Principals and Teachers felt that the ability of the teacher to manage a classroom, their innovative teaching practices, teaching methodology and knowledge of a subject were more important aspects of a teacher appraisal. Teachers felt that the appraisals were more useful in improving their subject knowledge and teaching methodology but less useful in improving student outcomes or their relationship with other teachers, While Principals also felt that the appraisals were useful in improving teachers subject knowledge they also felt that these were less useful in improving teachers teaching methodology. TEACHER AND PRINCIPAL BELIEFS ABOUT TEACHING - LEARNING 5. QES used items from the OECD conducted Teaching and Learning International Survey ( TALIS) for collecting information on teaching-learning beliefs, which can be understood as direct transmission beliefs and constructivist beliefs. It was found that Principals in India s top schools endorse higher constructivist beliefs than teachers. In contrast, teachers tend to believe that both constructivist and direct transmission beliefs are equally necessary in the teaching learning process. However, Principal beliefs in constructivism actually were associated with lower performance in all subjects: Maths ( points), Language ( points), and Science ( points) while Teacher beliefs in constructivism were associated with higher performance in Language (7.32 points) and Maths (7.74 points) respectively. The direct transmission view of student learning implies that a teachers role is to communicate knowledge in a clear and structured way, to explain correct solutions, to give students clear and resolvable problems, and to ensure calm and concentration in the classroom. In contrast, a constructivist view focuses on students, not as passive recipients but as active participants in the process of acquiring knowledge. Teachers holding this view emphasize facilitating student inquiry, prefer to give students the chance to develop solutions to problems on their own, and allow students to play active role in instructional activities (OECD, 2009:92). Teachers following constructivist approach also tend to be slightly more satisfied in their jobs and have higher perception of self efficacy. India s top schools when compared on an international scale showed that they are among the countries which have a lower constructivist and higher direct transmission beliefs. TEACHER PRACTICES FOR INSTRUCTIONAL QUALITY 6. QES, using items from TALIS, found that structuring practices, such as stating learning goals, summarizing former lessons, homework review, checking the exercise book, and checking student understanding are the most frequently employed instructional practices across all the schools. Student oriented practices such as group work, student participation in planning class activities and their self evaluation, and enhanced activities such as student participation in long and independent projects were less frequently used. 13
15 CLASSROOM CLIMATE 7. Results showed that majority of students perceived the classroom climate as positive in their schools. Cohesiveness (where students knew and like each other, are friendly) and Task orientation (where student pays attention in class, gets work done, knows the goals, purpose of being in class and what they need to accomplish) are the 2 most important characteristics of classrooms mentioned by students. In contrast, the aspect that was chosen the least by students to describe their classroom climate was investigation. Apparently, students do not carry out investigations or they are not asked about evidence or use of diagrams or graphs. It could also be related to the low level of enhanced activities teachers practices in the classroom. Student performance when correlated with student s perception of different aspects of their classroom climate, showed that all aspects such as feelings of classroom being cohesive, having teacher support, being involved, oriented on tasks, having cooperation, and being treated equitably were positively correlated with student performance. Student performance is most correlated (r=0.5) with the teachers asking questions and encouraging students to ask questions, considering students ideas and suggestions and discussing the same in classroom. Similarly students performing well is correlated with (r=0.3) students feeling that that they are treated alike, and getting the same attention, opportunities, help and encouragement as other students get. Better Classroom climate was also very positively correlated with students values and interpersonal skills. Students who perceive a better classroom climate are more likely to say that they will not use stolen property, will report unidentified wallets to the police, will speak out for their beliefs, will feel bad about bullying others, will be kind to others, will feel sorry for injured people, will be protective towards weaker people, will be a friend to lonely people, will learn from mistakes, like to work in teams, have strategies for handling anger, not let feelings influence their behavior, have a sense of responsibility towards others and serve others, will think how their actions would affect others, and will feel comfortable even if people disagreed with them. TEACHER AND PRINCIPAL BELIEFS ABOUT STUDENT DISCIPLINE 8. Principals (30%) and Teachers (40%) surveyed, believed that (i) strict discipline is necessary for proper teaching; (ii) the teacher s control over students is a must for discipline, (iii) there can be no discipline without fear of the teacher in students, (iv) students not paying attention to studies should be physically punished, (v) and undisciplined students in class should be physically punished. A comparison of beliefs in student discipline showed that the more the Principals and Teachers believe that strict discipline is important, the lower was their student performance. This suggest that there can be no meaningful learning in a classroom that is filled with fear, as; in such classrooms the student may not be open to asking doubts, learning by discussion, etc. 14
16 The analysis of relationship between students perception of classroom climate and principal, teacher beliefs on discipline revealed that beliefs of strict discipline (such as inculcating fear and doling out physical punishment) are negatively correlated with student s perceptions of all aspects of a classroom climate. Student s involvement in class and perceptions of equity had the highest negative correlation (r=-0.4 each). This suggest that when teachers believe in strict discipline approach, then they do not ask questions in class or involve the student s ideas and suggestions; nor do they encourage students to ask questions and discuss ideas in the classroom. Students in such classrooms also feel that they are not treated alike, and do not get the same attention, opportunities, help and encouragement as other students get. A snapshot of the different profiles Principal Teacher Parent/Home 92% of Teachers were females. Average age of Teachers was 41 years. 77% of Teachers were permanent teachers 52% of Teachers had master s degree 77% had a B.Ed Average experience as a teacher was 12 years While 34% of Teachers did not have any training in last 12 months, 35% of Teachers was trained on teaching methodologies. 65% of Principals were females. Average age of Principals was 55 years. 85% of Principals had a masters degree While 56% of female Principals had a M.Ed, only 44% of male Principals had a M.Ed The average experience of a Principal as a teacher was 25 years, and as a Principal 13 years and in the specific school currently employed 8 years. While 78% of Female Principals had attended training in the last 12 months only 44% of Male Principals had done so. 63% of parents are graduates or above, 3.3% had less than class X qualification 62% of mothers are home makers, 41% of fathers are business men 16% of parents were in private sector while 13 % of were in government. 75% of students get newspapers at home, 84% of students have computer 61% have Internet at home 39% of students have more than 30 books while 5.6% do not have books available for reading at home 55% have mothers help in homework while 43% have fathers help in homework. ACADEMIC PRESSURE 9. QES also collected the information about what students believed about their learning capabilities, their actual performance and their perceptions of academic pressure. There is a moderate correlation about how students perceive their own scholastic abilities and the amount of pressure they feel (r=0.4). However, this is not reflected in actual performance. The correlation between academic pressure and performance is negative and low (r =-0.3). When students express that they are under a lot of pressure to perform academically, they also seem to display a HIGHER degree of confidence in their scholastic abilities, but actually PERFORM LOWER in the scholastic assessment. STUDENTS, TEACHER AND PRINCIPAL BACKGROUND 10. A few background factors - such as students spending at least 60 minutes each day reading material other than textbooks, students being able to read as well as do their homework independently, being taught by maths teachers with a masters degree in education, students being able to share their school problems with their parents - all of which are associated with greater student achievement. 15
17 RECOMMENDATIONS 1. Large scale awareness campaign among schools on notions of quality: While there may be many notions on what all constitutes quality education, there is likely to be unanimous agreement in that schools should be places where students develop holistically and maximise their potential. How well students understand what they learn will be important for building individuals who are capable thinkers. Schools are also places where many of the society notions on issues such as poverty, religious and cultural intolerance, biases against gender and differently-abled persons, disregard for civic and citizenship responsibilities and many others can be challenged and overturned by building awareness among students. Large awareness campaigns involving schools and school heads should be rolled out where there is discussion and elaborating the understanding of what a good school and quality education means. Schools should be encouraged to use the outputs of the study that highlights the gaps in student learning and the misconceptions students have in different subject areas. 2. Wide ranging debate on alternative models that question widely held beliefs on learning environments (structure, decision making, processes etc) and emphasises learning in co-scholastic areas: Wide ranging debate is to be initiated on alternate models of education where schools could specialise in different areas of learning academic or co-scholastic. This would enable the system to provide scope and stream students according to their interests. Many schools adopting such alternate models also tend to empower teachers more and have flatter structures and consultative decision making. Positive correlation of some such factors to student s attitudes and values and performance indicates a need to bring these into debates on school quality improvement. 3. Student interviews on different social and ecological issues: There is a need to understand the reasons or thinking behind student responses to the different social, cultural, civic and ecological issues. Why could 25% of the children in class 6 say that they can include immigrants only if they conform? Or an even larger percentage feels that the need to educate girls is less that the need to educate boys? These answers can be obtained through a structured process of speaking to children and carefully listening to their answers. This process can be video-recorded and used in teacher training and research to help understand how students think and the reasons for their attitudes towards different social issues. 4. Periodic benchmarking on all aspects of educational quality: Regular and periodic study can focus improvement efforts on all dimensions of system quality related to learners and learning environments. While benchmarking, a holistic approach to student outcomes that looks into what students learn in academic areas, their attitudes and values, the approach and attainment in co-scholastic areas should also be looked into to give a complete profile of student education. 5. Providing effective teacher support: Understanding the learning gaps and misconceptions among students can provide an opportunity for teacher capacity building. Inputs regarding learning gaps and misconceptions can be built into an effective teacher training and support system to move the system towards better quality learning. Student interviews 1 and group discussions to understand student thinking on various concepts could be included in pre-service teacher training, and also as an activity that practising teachers could be encouraged to do. Practices which make a teacher more reflective and research-oriented in a classroom context could be analysed and considered. 6. Studies to further unpack the notions of quality: Definitions of quality must be open to change and evolve based on information, changing contexts, and new understandings of the nature of education s challenges. Studies that will explore quality in education and the role of different learning environments in providing quality will need to be undertaken at classroom and school level to further unpack the factors influencing quality. 1 Why could 60% of the students in class 8 not identify an angle with the greatest degree measure? Why could students not know that all insects have 6 legs even at class 8 level? These answers can be obtained through a structured process of speaking to students and carefully listening to their answers. This process can be video-recorded and used in teacher training to help teachers understand how students think and what misconceptions they have. The skill of actually conducting these student interviews trains teachers to listen to students - something that usually gets missed in the rush to complete the syllabus. 16
18 1. DESIGN OF THE STUDY 1.1 NEED FOR THE STUDY There are probably a number of views on what constitutes good education and quality learning environments. It does appear that society at large has a particular view of quality school education, which focuses on the marks achieved in the core subjects taught in schools and other immediately measurable outcomes. There is also a certain popular notion of the quality of schools and the ability of the school to create a good educational experience. The National Curriculum Framework of India (2005) emphasizes art, health, physical education and peace education apart from cognitive learning outcomes (for eg. math, science, language). It draws attention to the factors or parameters that contribute to schooling outcomes (e.g. infrastructure, libraries and other media, school organization and culture) and also emphasizes the importance of learning experiences beyond outcomes. So what constitutes good education? Are there a set of parameters that constitute quality learning environments and which can be studied or measured? Can the holistic development of students - not just their marks in tests - be studied and in some cases measured somehow? Although there is not much consensus on what quality education is, many studies on the purpose of quality education more often measure scholastic, co-scholastic and affective (values and attitudes) outcomes. International organizations such as UNESCO, UNICEF and Asian Development Bank have attempted to develop quality education frameworks in the past in order to provide a more holistic definition of quality education and to study the factors or parameter that contribute to the quality of education. This research study tried to find answers to the above questions. The Quality Education Study (QES) has been conceptualised and managed jointly by the Wipro and Educational Initiatives (EI) and the execution was carried out by EI. This was planned as a multi-year study to expand the meaning of quality in education to include educational outcomes beyond student performance in subjects and study the attributes of different learning environments (schools) which are considered good quality. This report covers the findings of year 1 based on the large scale study of the scholastic, co-scholastic and affective outcomes and the different aspects of the learning environments found in India s top schools (identified through a survey of popular and expert opinion). 1.2 ABOUT THE STUDY The main objective of the study was to expand the understanding of quality in school education and the attributes of good learning environments. These could be further specified as follows: To identify, study and where possible measure some of the factors or parameters that are seen to occur in different learning environments. Provide information on different approaches and practices and their contexts Provide information on student learning levels Comparisons on student achievement as seen in schools of different types, boards and regions Provide information on some values and attitudes students seem to hold Provide information on participation of students in the areas of learning not considered part of the core curriculum like sports, music, arts etc. and the supportive environments provided by schools for the same 17
19 It is important to note that this study did not aim to rank schools based on the various types of student schooling outcomes that were measured in this study. Moreover, the study does NOT aim to publish a list of good schools, to make comments on the school systems or to release data on individual schools. The study also does not claim that all possible factors that influence learning have been looked into. Some of the specific findings need to be explored and understood further through more detailed studies. 1.3 SALIENT FEATURES OF THE STUDY Expert Panel: An expert panel of 9 members was constituted to provide feedback on the research idea, plan and methodology, to provide inputs on the process design, and to provide comments on the analysis and review of the report. Experts included professors from premier research institutions in India and USA, educationists from different NGOs working hands on in the field of education, academic and pedagogy experts, child psychologists and school principals. Coverage: The study has been carried out in English medium schools, specifically those which are perceived as top 2 schools based on a public opinion survey carried out in Bangalore, Chennai, Delhi, Kolkata and Mumbai. In addition, the study also covered 6 schools recommended by experts as schools providing different learning environments. These schools were not restricted to the 5 metro cities. Overall, about 23,000 students, 790 teachers and 54 Principals from 89 schools participated in the study. Background Questionnaires: Three different background questionnaires one each for student, teacher and school principal were developed based on detailed secondary research and covered various aspects such as school context, leadership and management practices, principal and teacher beliefs related to teaching-learning, beliefs related to importance of co-curricular areas, classroom practices, classroom climate, basic background information of schools, principals, teachers and home background of students was also collected. The questionnaires were fine tuned after pilot testing. The questionnaires were administered to all the 89 schools that participated in the study. Focus Group Discussions: A sub sample of 16 schools was selected for further collection of qualitative information through Focus group discussions (FGD). In these schools, FGDs were carried out with students of classes 4, 6 and 8 as well as teachers handling these classes. These FGDs collected qualitative information on topics such as concept of a good school, school climate, co-curricular activities and freedom to purse non academic interests in schools. The focus group discussions were carried out by trained experts and the questions and methods fine tuned based on pilot runs. Principal Interviews: The Principals in the sub sample of 16 schools were also interviewed to gather their views as hands-on practitioners on what they believe as quality education and good schools, key areas that schools should aspire for, leadership, decision making process and challenges they face in providing quality education. Specially Assembled Test Paper: Students of classes 4, 6 and 8 were assessed through a test. The test consisted of objective, multiple-choice questions in English, Mathematics, Environmental Science and Social Studies. The questions were carefully selected from a pool of ASSET 3 items which have already been extensively tested with thousands of students. Few questions were also selected from international studies such as Trends in Mathematics and Science Study (TIMSS), Progress in Reading Literacy Study (PIRLS) and national studies by EI such as Student Learning in Metros (SLIM) Study. 2 Top schools are schools identified on a public opinion survey carried out as a part of the previous Student learning in Metros study by EI and Wipro in Full details of this study are available at 3 ASSET is a national benchmarking diagnostic test conducted twice a year by Educational Initiatives Pvt. Ltd. For more information visit 18
20 Questions to Understand Students Values and Attitudes: A section was included in the papers for all the 3 classes that had questions designed on various social issues. This was meant to gather information on students perception and their attitude towards these issues. A Secondary Study: A Secondary study to track progress in student learning was also carried out with some classrooms (sections) in the participating schools. Here, a common paper with questions of class 4 level in Maths and Science was administered to students of classes 4, 6 and 8. This was done to gather insights on how well students retain the concepts learnt and if there is a change in misconceptions acquired in lower classes. A few questions from the international test, TIMSS, were also included to provide a comparison with the performance of international students. A Writing Task: All students of classes 4, 6 and 8 were administered a writing task in the secondary study paper, where they had to write an essay. This were analysed to reveal insights about the writing competencies of students in these top schools. Completely Invigilated Tests: All the tests were invigilated by EI trained representatives to ensure that the test administration processes were standardised. Analysis: Different types of analysis were carried out on the collected data to extract patterns related to student learning; students values and attitudes towards various social issues; background factors related to learning, teacher and principal beliefs and their practices that shape the learning environments. 1.4 STUDY COVERAGE AND SAMPLE DESIGN The study covered 83 schools selected from the list of top schools identified through a public opinion survey carried out in Bangalore, Chennai, Delhi, Kolkata and Mumbai in 2006 (as part of the earlier Wipro-EI s Student Learning in Metros study). In addition, 6 more schools were included in the study based on recommendations from experts as learning environments that are different from most schools. All the 89 schools were administered the scholastic tests as well the background questionnaires. A sub sample of 16 schools were administered the focus group discussion and principal interviews. 1.5 HOW THE STUDY WAS CARRIED OUT A total of 255 schools were approached for permissions and 89 schools agreed and participated in the study. The final field administration was carried out between November 2010 and February EI recruited 5 city coordinators and 110 invigilators across the 5 metros to carry out the field administration. The invigilators were further trained to ensure standardisation of data collection procedures. The invigilators visited the schools and carried out the scholastic tests. The students also filled the background questionnaires. Teachers handling classes 4, 6 and 8 as well the Principals in these schools were provided the background questionnaires which they filled and returned to the field team. FGDs were carried out in 16 schools by trained experts. The school Principals in these schools were met and interviewed by senior members of EI. 1.6 QUESTION PAPER DESIGN Test papers were developed for English, Maths, Science and Social Studies for classes 4, 6 and 8. In order to increase the number of concepts that can be tested across the student population, rotated sets (2 sets) of papers were made for each class- subject combination. A few questions were kept common between the papers, so that the performance in those questions could be used to calibrate the difficulty level of the two papers. Each classroom had both the rotated papers administered with every alternate student getting tested with the same paper. 19
21 In addition to the above, a sub study was also carried out, in which a common paper with questions of class 4 level in English, Maths and Science was administered to students of classes 4, 6 and 8. The number of questions in each paper and the duration is reported in the table below: Class Duration (min) Version English Maths Science Number of Questions Social Studies Citizenship/ Social Attitude* Total 4,6,8 (Sub study) A writing task * The questions related to student attitudes and values were included in the paper after the subject/scholastic questions and the duration was stipulated for the whole paper. However, these questions were not expected to have a correct answer as the scholastic questions. The questions were carefully assembled from a pool of ASSET items which have already been extensively tested with thousands of students. Few questions were also selected from international Studies such as Trends in Mathematics and Science Study (TIMSS), Progress in Reading Literacy Study (PIRLS), Civic Education Study (CIVED) and national studies by EI such as Student Learning in Metros (SLIM) Study. Papers included a set of questions to approach to Citizenship/Social attitude that are not based on scholastic competencies and do not have a single correct answer. It is often a challenge when designing such tests to calibrate them accurately - both the overall difficulty of the test (pitched at around 50% in this case) as well as the difficulty levels of individual questions which should range from easy to difficult. Since this test was assembled using past ASSET questions that have previously been tested on over 3-4 lakhs students, the difficulty level of each question was accurately known beforehand. Competencies Tested: The study sought to assess students understanding and ability to apply what they had learnt. The questions were not based simply on the ability to recall information or use formulae or procedures, as most school exams are, but also tried to check if the students have understood and internalised the concepts. Each question was assigned a specific competency. The list of competencies tested in each paper is listed in Appendix A. A description of these is outlined below: I. Language: Language is important as a means of communication, learning, advanced expression and appreciation. It also defines one s identity and is a vehicle of culture. The test papers assessed 5 competencies on various aspects of reading and comprehension. The competencies are across classes but aspects like the level of vocabulary and complexity of the reading passages increase from class 4 to 8. The writing task in sub study paper is designed to gauge the quality of expression, felicity with the language and knowledge of correct usage by students. II. Mathematics: Maths should help develop the child s resources to think and reason mathematically, to pursue assumptions to their logical conclusion and to handle abstraction. The key areas in primary and middle school Maths - numbers and operations, fractions, decimals, ratios, percentages, measurement and estimation, data interpretation, algebra, geometry and problem solving were covered. A few items from the international Trends in Maths and Science Study (TIMSS) for class 4 and 8 were included in the papers to provide a relative understanding of the performance we find in the private English medium schools in India. 20
22 III. Science: In Science, mastery of content (topics like density or the chemical reactions or photosynthesis), as well as competencies (like observation and classification) are important to develop a scientific temperament. For example, the competency of classification is used with different content in Biology, Physics and Chemistry. Hence, the items in science were balanced both with respect to content and competencies. 4 basic competencies tested were recalling known facts, understanding/applying, analyzing/reasoning and designing/generating. The content covered the environmental sciences, physics, chemistry, biology and the earth sciences. Since the relative percentage for these components is not standardised in India, standards documents of various countries and the frameworks of tests like the PISA and the TIMSS were referred to finalise the percentage break-ups for classes 4, 6 and 8. IV. Social Studies: Analysing historical ideas and chronological sequence, Understanding citizenship and governance, recognizing places and understanding human/environment interaction, map/graph reading and interpretation were covered in Social Studies. The sub section on student attitudes and values covered aspects related to student gender equality, diversity, sensitivity, awareness and attitudes towards civic and citizenship issues and ecological issues. Types of Questions Used in the Tests: The types of questions used in the tests are illustrated below: A. Questions that check for deeper understanding of concepts Class 4 Maths Class 4 Language 7 x 37 = What should be added to 7 37 to get 9 37? (Note: You need not calculate the answers of 7 37 and 9 x 37) A. 2 B. 7 x 9 C. 2 x 37 D. 7 x 37 Sample Question: This question checks the concept of multiplication as repeated addition. Which word best describe this story? A. serious and sad B. scary and exciting C. funny and clever D. thrilling and mysterious Sample Question: This question primarily expects the reader to integrate the information present in the text about the characters and draw conclusions about them. B. Questions that check for learning that is straightforward or text-bookish It is sometimes argued that while students may not be learning with proper understanding, they can do extremely well on question types they are familiar with. In order to check this, the test also contained some questions which can be best described as typical, text-bookish or straightforward. Class 6 Science Class 6 Maths What is the chemical formula of water? A. H 2 O B. HO 2 C. HO D. H 2 O 2 Sample Question: This question is a straightforward or text-bookish question, and asks about the formula of water which the students might be familiar with. Which of the following if equal to ? A B C D Sample Question: This is a straightforward question of division for a class 6 student. 21
23 Class 8 Science The cross section of a flower is shown below. Which letter correctly represents the part of the flower where the pollen grains are transferred? Sample Question: This question is a straightforward or text-bookish, and expects students to identify the part of the flower. C. Questions that check for application of concepts Class 8 Maths Four friends Apara, Binnie, Chitra and Dilpreet live in four consecutive houses, F-10 to f-13, on a street. Apara has Dilpreet as her next-door neighbour on one side and Chirta on the other. Binnie s house number is the smallest of all four. Who stays in house number F-12? A. Apara B. Binnie C. Chitra D. Dilpreet Sample Question: This question checks the application skill of the students and checks if the student. D. Questions that check for reasoning ability Class 4 Maths Look at the weighing scales shown below. Which statement about the weight of BOX 2 is true? A. It is equal to 1kg B. It is more than 1kg C. It is less than 1kg D. It is equal to 500 g Sample Question: The question tests if the child is able to understand the concept of weights and then reason out based on the information given. E. Passage Questions Most questions in the Language papers are based on unseen passages that are not from textbook and authentic material seen in daily life such as tables, labels, notices, etc. 22

24 Class 4 Language According to the passage, why are the claws of the lemur curved and sharp? According to the passage, why are the claws of the lemur curved and sharp? A. to dig its feet into the ground B. to hold on to its babies C. to hold the branches firmly D. to tear the leaves it eats Sample Question: This is a straightforward inference question which tests if students are able to identify any information in the given passage when worded differently. F. Questions that checked for student attitudes and values Class 6 Social Studies The political party leader of your state says the following things about people from another state: They are taking away the jobs that rightfully belong to the people of your state. They are influenced by Western culture and will spoil the traditions of your state. What is your response? A. Anyone can live freely wherever they want in my state. B. They can live in my state but they should not be given jobs. C. Anyone can live in my state but they must follow the traditions of my state. D. It is better they stay in their own state because otherwise there will be fights in my state. Sample Question: This question is constructed such that option A identifies student s openness to the idea of diversity; while B checks for student s reluctance towards immigrants and the perception that their inclusion will be at the cost of people already in the state. Option C is designed to check if students think immigrants can be included but only if they conform. Option D identifies students with low tolerance to diversity, perception that it results in communal disagreements. 23

25 PRINCIPAL AND TEACHER QUESTIONNAIRE 24
26 1.7 BACKGROUND QUESTIONNAIRES DESIGN Extensive secondary research on what constitutes quality in education was carried out to understand the parameters that characterize learning environment in schools. Based on this, the EI-Wipro team identified 17 key parameters in areas related to students, teachers and management of a school. These parameters were: 1. Leadership/management approach, school autonomy and parent teacher association 2. Curriculum development and achievement process in school 3. Teacher professional development 4. Principal and teacher s perceptions of school climate, democratic environment, job satisfaction and selfefficacy 5. Principal and teacher s beliefs about teaching-learning and discipline 6. Teacher appraisal, feedback and mentoring 7. Student appraisal feedback and mentoring 8. Student s attitudes toward gender equality, diversity and sensitivity 9. Student's perceptions of classroom climate 10. Student's awareness and attitudes toward civic/citizenship issues 11. Student's self-concept related to studies, learning, scholastic and co-scholastic areas 12. Student's perceptions about teaching-learning and academic pressure 13. Student's awareness and attitudes toward ecology issues 14. Student s attitudes, values and interpersonal skills 15. Basic data related to school resources 16. Basic data related to teacher, principal and student background 17. Co-scholastic areas: Principal s perception; student s interest, opportunities and participation; allocated time for these areas in school and curriculum. The identified parameters were discussed with the expert panel and it was then decided to study fewer parameters but cover them in-depth. As a result, student appraisal, feedback and mentoring was not covered in this study, while the parameters curriculum development and achievement process in school and teacher professional development were covered indirectly and not studied in-depth. As the parameters selected to be included in the QES were broad and abstract constructs, dimensions and subdimensions are required to anchor these theoretical parameters in more tangible and measurable items plausible to be collected through questionnaires. For example, the leadership parameter was divided into dimensions such as instructional leadership, administrative leadership and locus of control. The instructional leadership dimension was comprised of six sub-dimensions such as communicating the school goals, coordinating the curriculum and so on. The communicating the school goals sub-dimension was operationalized as 4 items in the Principal Questionnaire. 25
, Teaching and Learning International Survey (TALIS), and Leadership for Organizational Learning and Improved Student Outcomes (LOLSO)")
27 The items/questions that operationalise the sub-dimensions (scales) were largely borrowed from rigorous international research studies carried out by reputed institutions. Trends in International Mathematics and Science Study (TIMSS), Teaching and Learning International Survey (TALIS), and Leadership for Organizational Learning and Improved Student Outcomes (LOLSO) have also been the main sources for selection of scales and questions. The items covered under each sub dimension are provided in Appendix B. Student Questionnaire The items were distributed into 3 background questionnaires - one for student, teacher and school principal. The questionnaires were fine tuned after pilot testing. Certain items related to student perception of classroom climate were asked to class 8 students only as it was felt that children from class 4 and 6 may not be able to engage with these higher order questions and concepts. Student questionnaires were administered to students as a paper pencil tool after the scholastic tests. Students from all 89 schools participating in the study responded to this questionnaire. Teacher questionnaires and Principal questionnaires were given to the schools for the teachers and principals to complete. These were collected back by the study coordinators. 790 teachers teaching English, Maths, Science and Social Studies in classes 4, 6 and 8 of the participating schools and 54 principals completed the questionnaires. 26
28 Additional background information on issues like class size, fees and school facilities were also collected from the participating schools during the test administration through a school form. The number of questions in each background questionnaire and the school form is as below. Questionnaires Duration (min) Number of Questions Class 4 Student Questionnaire Class 6 Student Questionnaire Class 8 Student Questionnaire Teacher Questionnaire Principal Questionnaire School Form Not specified FOCUS GROUP DISCUSSION AND PRINCIPAL INTERVIEWS Focus group Discussion: The focus group discussions for students and teachers were planned and carried out by experts in each of the 16 participating schools. Students from classes 4, 6 and 8 participated in the FGDs. Each class FGD was done separately with students randomly selected from the class. Teachers teaching these classes were met separately for the FGD. The same topics were covered in both the student and teacher FGDs. These included questions related to: the school experience/climate likes and dislikes in school perception about and opportunities in co-curricular activities freedom to pursue their interests in non academic areas in schools students /teacher s idea of a good school The questions and methods were decided after detailed consultation with the Wipro-EI core project team and fine tuned based on pilot runs. Principal Interviews: As Principals were the leaders of schools and were hands-on practitioners who are responsible for providing leadership to the school, influence practices in their schools, it was important to meet the Principals and understand their views on quality in education. The interviews were carried out in 16 schools by EI s Senior Team members. The interviews did not necessarily have questions asked in the same sequence as below, but covered the following topics during the discussion. What is your philosophy of education? How is this philosophy transacted in the classroom? In your view, do teachers need to have some aims of education in mind to be able to teach well? Or just a textbook in hand is enough? Is it necessary that the teacher should have a background in teaching? Why is certification pertinent? As an experienced educator and leader, when you walk into a new school would you be able to judge the school as good or bad? If so, what will be your parameters to identify a good school? Most schools may mention some constraints in providing certain aspects of quality education, if a school has such constraints, then what are the key areas that a school should still aspire to provide for? What are the key aspects of providing leadership in a school? What are the key decisions that you need to make or be part of in your school and what is your decision making process? Can you provide us examples of 2-3 kinds of decisions and how you went about it? What are the key challenges a Principal faces? Do you have any comments on the Right to Education Act? Do you have any comments on salary provided to teachers? Is there any other comment/question you will like to share with the research team or would like to ask other school Principals on quality in education? 27
29 28
 and Progress in Reading")

30 2. OVERALL LEARNINGS: STUDENT OUTCOMES 2.1 STUDENTS LEARNING OUTCOMES 1. Students in top schools of India performed lower than the international average on questions used from studies such as Trends in International Maths and Science Study (TIMSS) and Progress in Reading Literacy Study (PIRLS) at class 4 level, while they performed on par at class 8 level. The improvement in class 8 level was due to the higher performance observed on procedural questions (i.e., questions that require straightforward use of techniques or learnt procedures to arrive at the answers). At class 4 level, students from top schools of India performed lower than the international average in all the 3 subjects tested English, Maths and Science. 7 questions in English from PIRLS and 7 questions each in Maths and Science from TIMSS were included for comparison in the class 4 tests. Students performed lower than the international average in all the questions included from the international tests. However, at class 8 level, students performed on par with their average international counterparts. 9 questions in Maths and 8 questions in Science from TIMSS were included for comparison in the class 8 papers. As PIRLS is carried out only for class 4 age groups, common questions from international tests were not available for comparison. A closer look at performance on each question showed that the Indian students were doing better than the average international students in 4 out of 9 Maths questions and 4 out of 8 Science questions. The better performing questions were found to be procedural in nature in class 8. Class 4 Maths Class 8 Maths Which shows a correct procedure for finding 1 1? 5 3 One table can seat 4 people. How would you find out how many tables are needed to seat 28 people? A. Multiply 28 by 4. B. Divide 28 by 4. C. Subtract 4 from 28. D. Add 4 to 28. Sample Question: This is a question checking understanding of appropriate procedure/whole number operation that is to be applied to find the answer. 47.1% of Indian students answered this question correctly, compared to 57.0% of international students who got this correct. A. B. C. D Sample Question: This procedural question was answered correctly by 39.6% of Indian students compared to 29.8% of students internationally. 29
31 It was found in the previous Student Learning in Metros study carried out by EI in 2006 and released in public domain, that students in India s top schools were underperforming compared to their international counterparts at class 4 level. While the condition of underperformance is still observed in class 4 in the present study, it is also evident that students in these schools are catching up at class 8 level and are performing similar to the international average overall. This is not surprising, considering that as a culture we value hard work and also consider Maths and Science as 2 important areas that our children should excel in. This in turn also results in a lot of attention and practice given to maths and science learning. Despite this premium the society places on Maths and Science learning, it is also important to recognise that the students from KG or standard 1 onwards are learning in English, as the medium of instruction. Research indicates that having a strong foundation in a first language (mother tongue), especially during the early years of school, is crucial to a child s educational success. (UNESCO, 2008; K.Heugh et al., 2007; H.Alidou et al., 2006; N.Dutcher, 2004; A.Fafunwa et al., 1989). As English is not the mother tongue or language spoken at home for students in these schools, but the medium of instruction, students are learning other subjects in a language where they will not have a natural advantage to absorb the learning more deeply. This lack of mastery in the language which is the medium of instruction could also be one the reasons that students are underperforming their international counterparts at class 4 level. At class 8 level, students may have picked up adequate mastery in English which in turn could possibly aid the acquisition of learning in other subjects too. 2. There are significant differences among the schools affiliated to different boards and schools in different metro cities. Schools that participated in the study were affiliated to two all India boards The Central Board of Secondary Education (CBSE) and Council for the Indian School Certificate Examinations (CISCE); one International board - IGCSE (Cambridge); and different State Boards of Maharashtra, Karnataka, Tamil Nadu (Matriculation) and West Bengal. The findings from board-wise comparison reveals that schools from Council for the Indian School Certificate Examinations (CISCE) and Central Board of Secondary Education (CBSE) performed among the top 2 and the differences with other boards were statistically significant. CISCE showed significantly better performance than CBSE. Among the state Boards, schools from Tamil Nadu Matriculation showed the least performance. School Affiliations Schools CBSE 37 CISCE 25 West Bengal State Board 4 Karnataka State Board 6 Maharashtra State Board 7 Tamil Nadu Matriculation 6 IGCSE 4 Total 89 The IGCSE (Cambridge) was not included in the comparison, as the number of students was less than 0.5% of overall sample. The performance of 5 metros cities were also compared and shown below as composite performance index. The comparison of scores reveals that students from Delhi and Kolkata performed signicantly better than Mumbai, Chennai and Bangalore. Mumbai performed at par with overall average of these 5 metros. Bangalore performed significantly lower than other metro cities. 30

32 Kolkata Delhi Mumbai Chennai Bangalore % of Schools In Different Boards CBSE CISCE Karnataka State Board Tamil Nadu Matriculation West Bengal State Board Maharashtra State Board IGCSE The performance of Kolkata and Delhi could also be linked to the higher number of CISCE schools and CBSE schools in both the cities respectively. 3. Learning levels were found to be significantly lower than what was observed in 2006 in the same schools tested and on same questions. The previous EI-Wipro study, Student Learning in Metros (SLIMS) carried out in 2006 and published in India Today as a cover story brought into attention the status of student learning in the top schools of the 5 metros. Out of the 89 schools tested in year 2010 in the Quality Education Study (QES), 64 schools were common to both studies. In all the papers tested, students performed lower in the Quality Education Study (2010), and the fall was higher in Maths 4, Maths 6, and English 8 Class Subject SLIMS QES T N Avg SD N Avg SD Critic value sig at 95% (1.96) Cohen's d Effect Sizeinterpretation 4 EVS Yes Small 6 EVS Yes Small 8 Science Yes Small 4 Maths Yes Medium 6 Maths Yes Medium 8 Maths Yes Small 4 English Yes Small 6 English Yes English Yes Medium N-Number of students tested; Avg-Average score in the test; SD-Standard Deviation; Statistical Significance at 95%; Cohen s d Large: >0.8, Medium:>0.5, Small >0.2; Cohen s d is the effect size calculated and is usually carried out to understand the meaningfulness or magnitude of the statistical significance observed. 31

33 The results were further analysed at question level to check if there is any pattern in the performance. 54 questions (about 5 per class and subject) were kept common between SLIMS and QES. It was observed that students performed lower in 48 out of the 54 questions. The 6 questions in which QES showed comparatively higher performance tested students understanding on measurement of the length of a pencil (M4), perimeter of a rectangular sheet of paper if a small square is cut out from one of its sides (M8), the subtraction of a positive number from a negative number (M8), importance of binocular vision (S8), the placement of a solid in a liquid of same density (S8) and the opposite of the word incessant (E8). 4. Students exhibit rote learning and perform comparatively better in questions that are procedural or do not involve deeper understanding or application of concepts. It is often observed (in many countries, especially where there is a cultural emphasis on rote that learning sometimes is reduced to a mechanical process. What is Learning with Understanding? The answer, when one ponders over this, is not so obvious. Students can acquire knowledge and recall reams of facts and demonstrate routine skills without understanding their basis or when to use them. However, understanding seems to go beyond knowing something. Knowing and recalling draws largely on memory while understanding seems to go deeper. A student can be said to have learnt with understanding when she/he is able to restate learning in own words; is able to answer questions phrased in a slightly different form; is able to apply what is learnt in a different situation in real-life context; is able to solve real-life problems; and is able to integrate learning from different sources/subjects as needed. Absence of learning with understanding is evident, when in language, students are able to extract explicitly stated information, but not interpret. In Maths, students follow a procedure without completely understanding the concept. In Science, students may know a definition but is unable to use that to reason and apply. Why is Learning with Understanding important? The world is changing at a tremendous pace in the last 2 decades. Inventions and discoveries are happening so fast that it is altering the day to day life of people. Traditionally education may have equipped students with information and facts, leading to a curriculum that is focused on rote and recall. However, in the world that is increasingly populated with search engines, information that can be recalled at a click of a button. In such a scenario, the key differentiation that education should provide is to equip students with higher order skills such as critical thinking, creativity, learning to learn, etc. Students with such higher order skills are in a better position to adapt in a rapidly progressing world. 32
34 In educational systems, where some amount of basic learning is apparent but not one with understanding, it is more dangerous as it gives a false sense of security that children are learning. However, this apparent learning is not real learning, as the students do not internalise the concepts and often fail dismally when confronted with questions that require thinking and application. Knowledge versus Understanding Knowing the facts and doing well on tests of knowledge do not mean that we understand. Bloom (1956) and his collegues remind us to be specific about how undestanding differs from merely accurate knowledge when they recount a famous John Dewey Story: Almost everyone has had the experience of being unable to answer a question involving recall when the question is stated in one form, and then having little difficulty when the question is stated in another form. This is well illustrated by John Dewey s story in which he asked a class, What would you find if you dug a hole in the earth? Getting no response, he repeated the question; again he obtained nothing but silence. The teacher chided Dr.Dewey, You re asking the wrong question. Turning to the class, she asked, What is the state of the center of the earth? The class replied in unison. igneous fusion. Dewey s story also illustrates the rote recall nature of some knowledge learning. The emphasis on knowledge as involving little more than remembering or recall distinguishes it from conceptions of knowledge that involve understanding or insight, or that are phrased as really know or true knowledge. Source: Wiggins.G, and McTighe. J, (1998), Understanding by Design, Page 39. The results of the QES show that students were finding it difficult to answer conceptual questions. Class 6 Maths Jill had a rectangular piece of paper. y She cut her paper along the dotted line and made an L shape like this. x Total Score; y % of students x Which of these statements is true? A. The area of the L shape is greater than the area of the rectangle. B. The area of the L shape is equal to the area of the rectangle. C. The area of the L shape is less than the area of the rectangle. D. We cannot work out which area is greater without measuring. Sample Question: The question is testing the basic concept/ idea of conservation of area. 45% of students chose the correct option B, while 24% of students chose option A showing that students think that the area changes if a shape is changes even though it is just rearrangement of the shape without any addition or deletion to its area. 33

35 Class 6 Science Anupam takes papers P and Q, which are exactly the same. y He crumples P as shown in the figure. x x Total Score; y % of students Which of the following statements about P and Q is true? A. P has more weight than Q. B. Q has more weight than P. C. P and Q have equal weight. D. P and Q both have no weight. Sample Question: Only 22% of the students chose the correct option C. 41% of the students chose option A P has more weight than Q. They probably chose this option as they have not considered the fact that addition or removal of matter is required for the weight to increase or decrease. 15% of the students chose option B Q has more weight than P. They are probably choosing this option just by seeing the size of the paper. In language, passages used in the papers were unseen passages that the students would not have had a chance to be familiar with as they were not from the textbook. The passages were graded in terms of difficulty and included short stories, poems, short descriptive texts and authentic material such as posters for different type of contests for students. Students were found to retrieve explicitly stated information if it is asked verbatim from the text they read. However, they found it difficult to make straightforward inferences from explicit information, or interpret and integrate ideas and information given in the passage/story. In the sample questions given below, which are based on an unseen passage from the PIRLS study, it was seen that while 47% of students were able to extract explicit information that Labon placed the mice traps on the ceiling, only 29% could connect and understand that the conversation between the mice offer the textual clues as to what the mice thought of the happenings. 34
36 Class 4 Language Passage Excerpt: Once upon a time there lived an old man of 87 whose name was Labon. All his life he had been a quiet and peaceful person. He was very poor and very happy when he got home, he put the glue on the underneath of the mousetraps and stuck them to the ceiling... Good gracious me! cried one. Look up there! There s the floor! Heavens above! shouted another. We must be standing on the ceiling! I m beginning to feel a little giddy, said another. All the blood s going to my head, said another. This is terrible! said a very senior mouse with long whiskers. This is really terrible! We must do something about it at once! I shall faint if I have to stand on my head any longer! shouted a young mouse. Me too! I can t stand it! Save us! Do something somebody, quick!... Where did Labon put the mousetraps? A. in a basket B. near the mouse holes C. under the chairs D. on the ceiling How does the story show you what the mice thought was happening? A. by telling you what Labon thought of the mice B. by describing where the mice lived C. by telling you what the mice said to one another D. by describing what the mice were like Sample Question: This question requires the student to extract explicitly stated information from the passage and 47.0% of students answered this correctly. Sample Question: This question which requires students to look for textual clues and construct meaning on what the mice could be thinking was answered by 29.2% of students correctly. 5. Practical competencies such as map reading, using good language while writing, measurement, general awareness of well known facts, etc are not developed well. Many competencies that are of practical importance in real world, although in the curriculum are not acquired well by the students. These include understanding measurement, problem solving, map reading, using good language while writing etc. Reading maps is an important not only academically, but is also a life skill that each one of us at sometime or the other need to use in day to day life. Maps combine reading and math skills and helps build spatial sense and visual literacy. Knowledge of cardinal directions also aids in effective interpretation of maps. In QES, the question below was asked in class 4, to test if students understand geographical directions and use of the compass sign on the map to locate a place on the map. Students see maps at various places. They also learn about the different directions and how to relate to them on a map. However, only 30% of students could answer the direction in which the temple was located in reference to Adi s house. The most common wrong answer also revealed the general misconception often found in public that any place located upwards in a map is north, while those located in the lower part of a map is south. They also do not perceive directions as something to their left, right, before or behind while navigating a place. 35
37 Class 4 EVS Adi goes to Rainbow Public School, which is near his house. Given below is a map which shows both his house and his school. Look at it carefully to answer the question. y x x Total Score; y % of students While going to school, Adi passes by the temple every day. In which direction is the temple located, with reference to Adi's house? A. North B. North East C. North West D. West Sample Question: Only 30% of students could answer this question correctly (option B). 23% of students selected the wrong option A. Students probably think that any place which is located upwards is located north. 17% of students selected the wrong option C. These students probably got confused between northwest and northeast. 12% of students chose the wrong option D. These students probably do not have clear idea about cardinal and intermediate directions. In the case of competencies such as measurement, as reported in the earlier SLIMS 2006 study, a large number of students were not able to measure the length of a pencil correctly. However, compared to the previous study, the percentage of students choosing the wrong answer C has decreased from the earlier 77% to 67% in this study. The students choosing C were seen to measure length by counting the points on the scale rather than the distance between 2 points. The percentage of students getting the answer correct option B increased from 11% in 2006 to 16% in Class 4 Maths The length of this pencil is about. y x A. 4 cm B. 5 cm C. 6 cm D. 7 cm x Total Score; y % of students Sample Question: 67% of students chose the wrong answer option C (6 cm). Student interviews carried out in classrooms in 2006 study revealed that students do not conceptualise length as the distance to be read between two points. In EVS, students found it difficult to answer the question on general awareness of simple, well known facts. Class 4 EVS Among these people, who is alive today? y A. Mahatma Gandhi B. Indira Gandhi C. Rajiv Gandhi D. Sonia Gandhi x Total Score; y % of students x Sample Question: 34% of students chose options B and C, which are common wrong answers. 9% of students chose Mahatma Gandhi as the answer. It is surprising that only 38% of students could answer a question that checks factual knowledge based on general awareness. 36
38 % Percentage of students The importance of language as a basis for all learning does not need to be emphasized. It is often found that student learning levels in Maths, Science and other subjects fall due to weakness in language. Language is also a process for development and expression of thoughts and ideas and thus developing critical thinking skills. Apart from the objective type English test, a writing task of reporting a telephonic conversation was also given to the students in the sub study paper. This was done as it was felt that an objective, multiple-choice questions test would not give a complete picture of students ability to write in English. Students of all classes 4, 6 and 8 performed this writing task. A sample of the answer responses received was carefully analyzed to get a picture of students writing levels. The analysis showed that Class 4 students showed a poor sense of structuring a story while Class 8 and some of the Class 6 students show a better understanding of putting the thoughts together and in sequence. Apart from this students showed inability to express their own ideas coherently and meaningfully using good and appropriate language. The detailed analysis of writing task is available in point 8 of section Students seem to harbour a number of misconceptions in the different subjects. As students move to higher classes, although the overall performance improves, the number of students holding on to same misconception continues, which indicates that if a student develops a misconception in a lower class, then it is more likely to continue in higher classes too without getting corrected. Often, logically one would expect that misconceptions of students from earlier classes are cleared as students move to higher classes and learn more advanced concepts in the same topics. When distractor (options) analysis is carried out on individual questions to observe patterns of misconceptions and learning gaps, one finds that the percentage of students choosing the most common wrong answer is fairly large on certain questions revealing the existence of strong misconceptions. One also finds that in such questions when they are repeated across classes, the percentage of students having the same misconception (i.e., choosing the same wrong answer) is fairly consistent from lower to higher classes. The given example, in Maths, shows that students seem to identify shapes based on their visual appeal only and not by their properties. Students seem to have a misconception that by changing the orientation (rotating) of a shape, its dimensions like length would also change. As students progress from class 4 to class 8, they are expected to identify shape using its properties. It is observed that the percentage of students choosing the correct answer increased as we move to the higher classes (Class 4-16%, Class 6-32%, Class 8-49%). however it is important to note that the extent of the students choosing option B, the most common wrong answer, did not decrease much as students moved from class 4 to 8 (Class 4-47%, Class 6-49%, Class 8-42%). Class 4, 6, 8 Maths Afzal has made a square on his computer screen. He now turns the shape as shown. Which of these statements is true? A. The square changes into some other shape and its side lengths also change. B. The square changes into some other shape but its side lengths don t change. C. The figure remains a square, but its side lengths change. D. The figure remains a square, and there is no change in its side lengths Performance Across Classes Class 4 Class 6 Class 8 Sample Question: It is observed that the percentage of students choosing the correct answer D is increasing as we move to the higher classes, however it is important to note that the extent of the students choosing option B (most common wrong answer chosen) is not decreasing much across classes. Nearly 40-50% of students from classes 4 to 8 think that a shape changes if its orientation changes, even though its properties may not change. A B C D 37
39 Analysis of the results of QES suggests that most students who hold a certain type of misconception continue to hold the same or a variant of it as they move to higher classes. This was observed in many concepts such as conservation of area, understanding closed shapes such as quadrilaterals in geometry based on their properties, concept of equivalent fractions, application of BODMAS, characteristics of insects, properties and classification of food items, concepts related to temperature, etc. Class 4, 6, 8 Science An animal has six legs. What is it most likely to be? Class 4 y Science A. a spider B. a fly C. a lizard D. a centipede x Total Score; y % of students x Class 6 Science Class 8 Science y y x x x Total Score; y % of students x Total Score; y % of students Sample Question: Only 23.2% of the students in class 4, 31.1% of the students in class 6 and 35.6% of the students in class 8 answered this question correctly. Around 45.0% of the students in all three classes have chosen the wrong option A. These students seem to have a misconception that a spider has six legs. Classification of animals based on its characteristics is a fundamental idea that students learn in Biology. The question asks about an animal with six legs, which is a basic characteristic for classifying an animal as an insect. For example, a fly that has 6 legs is classified as an insect, while a spider which has 8 jointed legs is classified as an arthropod. Spiders are also named as animals with 8 legs in many Indian languages which the students may be familiar with. A large and consistent majority of 45% of students across all the 3 classes 4, 6 and 8 chose option A - spider to be an animal with six legs, while ignoring the correct option B, the Fly. This indicates that either students do not have observation or students are possibly thinking that anything small and moves on the ground is an insect rather than understanding an insect scientifically based on its characteristics. The results of QES also bring forth the importance of learning the concepts deeply and with understanding at the appropriate class level itself, and the implication of concepts not well learnt as students move up the classes. 7. Boys were seen to perform better than girls in Maths and Science at class 8 level, while no such significant differences were found in other classes or subjects such as English and Social Studies. Over 8067 girls and 9949 boys participated in the study and an analysis was done to find out if there was a noticeable difference between their performances in the study. 38

40 The table below indicates the performance of boys and girls in the different classes and subjects: Class Subject Number of Boys Number of Girls Boys (%) correct Girls (%) correct T Critic value Sig Cohen's d Effect Size - Interpretation 4 Language Yes Language Yes Language No Maths No Maths Yes Maths Yes Small 4 EVS No EVS No Science Yes Small 8 Social Studies Yes N - Number of students; AVG - Average Score; SD - Standard deviation; Statistical Significance (Sig) at 95%; Cohen s d - Large: >0.8, Medium: >0.5, Small: >0.2 Statistical analysis indicated that, in Language, girls performed significantly better than boys in Class 4 and 6. Boys performed significantly better than girls in Class 6 Maths, Class 8 Maths, Class 8 Science and Class 8 Social Science. However, as the number of students tested is very large and may by itself influence the statistical significance, Cohen s d was carried out further to check for the meaningfulness of the differences observed. This showed that the differences were meaningful with a small magnitude (effect size) only in 2 classes and subjects. As can be seen in the picture below, boys are doing better than girls in Maths 8 and Science 8. Legend: Boys and girls are performing at the same level. Boys are performing significantly better than girls with small effect size. 8. Writing Task Performance Introduction One of the components of language testing was a controlled writing task where the responses were free responses but they had to fit in meaningfully with the given context a picture. This task was included to test students ability to use English as against their ability to understand it, evaluated through objective, multiple choice questions. The students of classes 4, 6 and 8 were asked to write a short story based on a picture provided as part of the task. The writing task revealed the students ability to creatively engage with the language and successfully communicate their ideas. The results indicate, broadly, that students on an average have inadequate grammatical and mechanical skills; while children on the whole seemed to have good creative ideas they struggled to articulate them through 39

41 sentences that conveyed their meaning to the readers. The ability to construct meaningful and grammatical sentences is so lacking that readers are often unable to understand what the child is trying to say. There is a clear trend indicating improvement as we go up in the levels. Class 8 students perform better overall than Class 6 students, who in turn write better than Class 4 students. Testing and Correction Procedure An identical writing task (See Exibit1) a story based on a given picture was assigned to students of classes 4, 6 and 8. The students were provided with detailed instructions about how to construct the story. These included adding a title, having an introduction and mentioning all the characters. A random representative sample of 250 answer sheets was selected from all the classes for evaluation and was rated by a group of teachers and experts. The responses were evaluated on four aspects: content and organisation of the story, creativity and use of relevant details from the picture, development of the characters and accuracy and effectiveness in the use of language. The following is the exercise given to the student. An ideal response is provided below. Class 4, 6, 8 Language Look at the picture given below carefully. Keeping the following points in mind, create a short story of your own in NOT MORE THAN 200 words. Using the hints given below, use your imagination to make your story interesting. I. Think of a suitable title and add it. II. Add an introduction to your story. III. Describe the place where the story takes place and talk about the characters in the story. IV. Describe, in sequence, what happened in the story. V. End the story with an interesting sentence, message etc. Punished for Another s Sins [Sample Ideal Response] Ganik was 18 years old. It was summer and he had a lot of time on his hands. He wanted the new cell phone. When he asked his father, he had asked him to earn the money for it himself. He had finally got a job painting walls. He was up on the ladder dreaming about his new cell phone, when some of his friends joined him. He felt like Tom Sawyer but couldn t quite convince them to do his job for him. They started making fun of him. He tried to ignore them as best as he could when he suddenly heard a crash. He was thrown from his ladder and fell badly. He looked around to see a car had crashed into the wall and a small elephant staring curiously at him. He fainted. Later, at the hospital, his mother told him what had happened. A man was talking on his cell phone and driving at the same time. The elephant had wandered into his path. He was so startled that he crashed into the wall. His father told him he couldn t get a phone as it just caused more trouble than it was worth. He told his father, I agree, maybe you could buy me a car instead. 40

42 Key Observations and Insights i. A trend of improvement seen across classes Students of class 8 write better than students of class 6 who in turn display better writing skills than class 4 students. However larger improvements are seen from class 6 to class 8 than from class 4 to class 6. An additional fact that supports this is the number of students who have not attempted the question in each class. In class 4 about 22% of the students did not attempt the question while in class 6 only 13% did not attempt and in class 8, about 7% of the students did not attempt the question. ii. Low sense of cohesion and structure In general, Class 4 students are unable to structure a cohesive story. Class 8 students and some class 6 students show a better understanding of how to put together a series of sentences to form a cohesive paragraph. Their stories are also broken up into different paragraphs, which is an aspect conspicuous by its absence in the writing of class 4 students. Many class 6 students and most class 4 students tend to write a series of disconnected sentences rather than a single paragraph. The above is an example of a class 4 student s writing. The sentences are disconnected and while there seems to be an underlying framework to the story, the lack of cohesion in the sentences makes it difficult to comprehend the story idea fully. 41

43 iii. Inability to express their own ideas correctly and meaningfully In general, children across classes tended to do better on the creativity measure than the accuracy measure. In other words, their imagination easily outstripped their ability to express those thoughts in English. A striking feature of the writing across classes was the amount of background that was provided by the children. Since the term story was used, most students seem to have felt a need to go beyond the picture and create a back story. (Samples of student writing are provided in the Appendix C). In the lower classes, this inability to express their thoughts in their own language has led to an over-reliance on formulaic language. For instance, many class 4 students have begun their story, with the phrases One day, One fine morning etc. Given below is one such sample of formulaic responses that begins as One day... iv. Grammatical and mechanical errors Most of the papers in all the classes are replete with grammatical and mechanical errors. Some of the most common mistakes are: lack of subject-verb agreement, missing punctuation and capitalization, and word order. Sentences that run on expressing multiple ideas are also an issue. The spelling mistakes show that students tend to make a guess based on what they hear. Spelling conventions followed in English are not well understood. So, for instance puncture becomes puncher and window is written as windo. Another issue seems to be that students are not been able to relate words with the words from which they are derived (or morphologically related). For instance, while see is spelt correctly, seeing is spelt seaing. Students need enough exposure to the language, so that they understand spelling conventions and are able to relate the correct words with each other. 42
44 Class Spelling Errors Windo, puncher, aesident,eghlipant Mechanical Errors (punctuation, capitalization, Grammatical Errors syntax, etc.). so elephant One day the elephant was walking Herible Mr Sharma The labourers that had painted Stugle Out of the circus. then the circus There was a there a school Canfeused, seaing scared! because A girl seaing the car Traviling, hotal, tire Our jumbo, tusked friends - the But this causes this much damage. elephants do share the world with us; Dengerious What a fat elephant. The broght a elephant Now for know It was a monday morning Telling to Pinted The fight was becoming tenser So the care crashed a building and tenser beside them there was a painter painting a building Belevied And as the car crashed people all Car of a man rushed in my shop around Electritians. he was standing down It was ranned Wre instead of were CRK!!!! Taked the driver Seen for scene And of course; not to overspeed Thinking of amazing things to be happened the car Rupee: rupe, rupy Subject-verb inversion in questions: Why you are asking me Something: some thing Some Recommendations For students to start thinking in a language exposure to the language is a must. Immersion in the language will also take care of grammatical and spelling errors. Spellings are less often learnt by rote; they are best remembered when a student has encountered the word many, many times in various contexts and is able to form a mental image of the word. In addition, students should be encouraged to use the language orally as much as possible. They could be encouraged to use the language creatively. In the lower classes they can be asked to write or talk about various things that they see or witness. It is essential that children learn to have fun with the language. If they are encouraged to communicate freely and more importantly in contexts where they are not judged, they are likely to develop a closer affinity to the language. This will help achieve the larger goal of greater proficiency in the language. Once they start thinking in English, learning will happen much more effectively and speedily. They can be given short, easily comprehensible paragraphs (or even visuals) and could be asked to repeat these in their own words without looking at the text. Even if they use language from the original, they will use it with understanding to describe their impression of the text. They will also internalize correct English if they use textual language. Discussions around texts, creative analyses of texts and even noticing minute details in a text are ways of making the child think about the text, become curious about it, and enjoy it. All of this will bring the language home to the child. Limitations of the Analysis 1. The interpretation of student responses is based on the evaluation of only one kind of writing task, which may not offer sufficient scope to analyse the development and ability to use written English effectively. It could also be affected by the reviewers preconceived ideas about how language works. Knowledge of students first language would help detect typical error patterns to suggest suitable remedies better. 2. Despite efforts to control subjectivity through a second rating by evaluators, one cannot completely rule it out. 43
45 2.2. STUDENTS ATTITUDES TOWARD GENDER EQUALITY, DIVERSITY AND SENSITIVITY In order to study student attitudes, values and interpersonal skills, questions were administered to students of classes 4, 6 and 8 as part of the Social Studies section in the scholastic papers. These questions checked for student awareness, attitude and values related to 3 major areas - i) social issues like gender equality, acceptance and respect for diversity, and sensitivity to others; ii) civic/citizenship issues and trust in institutions; iii) ecology, environmental issues Gender Equality About 40-43% of students in classes 4, 6 and 8 felt that education for a girl is not as important as responsibility towards the family, if a choice has to be made between a boy or girl child in providing education, boys are to be preferred over girls. Some of them also felt that in the long run, educating a girl is a waste of resources. While 35% of class 4 students and 47% of class 8 students felt that both boys and girls are equally capable, about 15-20% of students in both classes believe that abilities are determined by gender. About 15% of class 8 students believe that females are more likely to be burdensome to their parents. The results indicate the deep rooted bias against the girl child even in students from families which probably belong to the educated and higher socio economic strata of the society. Gender inequality has an adverse impact on development goals, as women do not get equal opportunities to participate in the economic, social and political activities of the country which in turn hampers the overall well being of the nation. India has witnessed gender inequality from its early history due to its socio-economic and religious practices that resulted in a wide gap between the position of men and women in the society. This is visible in the in-equal status of women in health, education, employment and political participation. Educating the girl child is the significant step in moving towards a more equitable society in future. Statistics show that India accounts for 30% of the world s total illiterate population and around 70% of these illiterates are women. Class 4, 6 and 8 Amrita is a ten-year-old girl. Her mother works as a maid and her father is a farm labourer. Amrita has two sisters and one brother. They are all younger than her. Her parents say that she doesn t need to go to school because she will marry and leave the family when she becomes an adult. What do you think about this? A. All girls must go to school, even if the family is poor. B. It's better if she stays at home and takes care of the younger children. C. If they are poor and they can send only one child to school, they should send the boy. D. Girls don't help their parents after they are married, so they don't need to go to school. A-D: Answer Options, E: Not Attempted, F: Invalid Entries 44

46 QES included few questions to understand children's attitude towards gender equality with questions related to providing equal opportunity for education, and exploring mental models of gender stereo typing. The question below explored the different stances that students take with respect to girl education. It was found that about 40-43% of students in classes 4, 6 and 8 felt that education for a girl is not as important as responsibility towards the family, and if a choice has to be made between a boy or girl child in providing education, boys are to be preferred over girls. They also felt that in the long run, educating a girl is a waste of resources. As children move to higher classes, there is no remarkably larger change in percentage of students changing their attitude towards educating a girl child. Apart from their belief about gender education, questions were also included on beliefs that stereo type girls/women. A significant number of class 4 students (A-22%) think that outwardly visible gendered traits, such as Boys having short hair and girls having long hair are not likely to be acceptable when changed. They also think that abilities such as soldiering in the army or doing better in Maths are determined by gender (B-11.8%, C-11.2%). Class 4 Which of the following would you agree with? A. Boys should always have short hair and girls should have long hair. B. Girls can't join the army and become soldiers, only boys become soldiers. C. Boys are likely to be better at maths than girls. D. Boys and girls can be equally good at anything. A-D: Answer Options, E: Not Attempted, F: Invalid Entries A similar trend was also seen in class 8, where 15.1% of students think that in fields such as politics, men have more natural abilities (B), and 14.6% believe that females are more likely to be burdensome for their parents(c). Class 8 Which of the following statements would you agree with the most? A. Men and women are equally good at jobs like doctor, teacher, and cook. B. Men have more natural abilities than women to perform in politics. C. For parents it is better to have male babies than female babies. D. The main role of men is to earn money to support the family. A-D: Answer Options, E: Not Attempted, F: Invalid Entries The results indicate the deep rooted bias towards the girl child even in students from families which probably belong to the educated and higher socio economic strata of the society Acceptance of Diversity Nearly half the students surveyed believed that people come closer to each other due to mutual respect and understanding, and not due to religion. However, the other half had preconceived beliefs about people from other religions and that religious differences matter and need to be defended by violence if necessary. While 29% of students believe that Indians can live and work freely in any state of India, nearly 60% students showed less acceptance towards immigrants from other states as they felt that immigrants have to conform to the state s traditions, they take away jobs from natives of the state and also are a source of communal disagreements. 45

47 Today we live in an increasingly interdependent world, where the actions of ordinary citizens are likely to have an impact on other s lives across the globe. In turn our lives, our jobs, the food we eat and the development of our communities are being influenced by global developments. It is important that young people are informed about the world in which they live. Education for living together, having acceptance in diverse multi-cultural society is an essential foundation for a global world as well for India. India is a place of cultural diversity where most of the major religions of the world are to be found. Young people of India should be encouraged to learn universal and cultural values and practices, global inter-connections, present world wide concerns and conditions, origins and patterns of world wide affairs. In response to questions related to tolerance of diversity, while many students (46.7%) believed that people become close to one another due to mutual respect and not religion, nearly 1/5 th (17.6%) of students had preconceived beliefs about people from other religions (B- People belonging to some religions are more violent than people of other religions), and 14.0% believed that religious differences matter (A- People from different religions should not marry, even if they like each other). It is important to note that 11.5% of students feel that religion needs to be defended by violence if necessary (D- People sometimes have no choice but to fight and kill others, to defend their own religion). Class 8 Which of the following statements would you agree with the most? A. People from different religions should not marry, even if they like each other. B. People belonging to some religions are more violent than people of other religions. C. People come closer to each other because of understanding and respect, not religion. D. People sometimes have no choice but to fight and kill others, to defend their own religion. A-D: Answer Options, E: Not Attempted, F: Invalid Entries It is surprising to see a large number of students show less tolerance towards diversity and felt that immigrants from other states can be included but only if they conform (C-24.7%), and believed that it results in communal disagreements (D-17.0%). 18.3% (B) are reluctant towards immigrants for they believe that it will be at the cost of people already in the state. Class 6 The political party leader of your state says the following things about people from another state: They are taking away the jobs that rightfully belong to the people of your state. They are influenced by Western culture and will spoil the traditions of your state. What is your response? A. Anyone can live freely wherever they want in my state. B. They can live in my state but they should not be given jobs. C. Anyone can live in my state but they must follow the traditions of my state. D. It is better they stay in their own state because otherwise there will be fights in my state. A-D: Answer Options, E: Not Attempted, F: Invalid Entries 46
.")

48 2.2.3 Sensitivity towards Others A large majority (70-80%) of students across different classes think of differently abled people as either burdensome, unhappy or not able to do well in studies. However acceptance of differently abled peers as capable people is slightly higher among older students (21.0% in class 4 to 29.0% in class 8). 60% of students show lesser sensitivity towards HIV affected people and a lack of awareness about the nature of HIV. This could be because the awareness creation efforts are not effectively reaching out to the children. Sensitivity to the circumstances and feelings of others is the cornerstone of human relationships. It is important to note that sensitivity is not just an emotion; it must express itself in actions as well, especially when people we know are experiencing pain and difficulties. Students should be encouraged to be aware of their own prejudices, and be more sensitive to others. Class 4, 6, 8 Maya is a new girl who has joined the school. She uses a wheelchair to get around. The other students are curious about Maya. What do you feel will they think about Maya? A. She seems to be interesting - let s make friends with her. B. She s in a wheelchair so she s always going to ask for help. C. She will probably not do very well in studies. D. She s probably going to be sad all the time because she can t walk. A-D: Answer Options, E: Not Attempted, F: Invalid Entries About 20.0% of students think differently abled people can be burdensome (B - She s in a wheelchair so she s always going to ask for help), while about 14.0% think that different abled people also lack mental ability (C - She will probably not do very well in studies). 28.0% of students also think that differently abled people will not be happy people (D - She s probably going to be sad all the time because she can t walk). 47

49 It seems that tolerance and acceptance of differently abled peers slightly increases from 21.0% in class 4 to 29.0% in class 8 (A She seems to be interesting - let s make friends with her). With regard to HIV afflicted people, 38% of students in class 8 think they are capable of participating in everyday life like others, while about 50% of students think that HIV afflicted persons should not be allowed to use public facilities, should be avoided by others lest they too get the infection and they are solely to blame for their disease. Class 8 HIV (Human Immunodeficiency Virus) is the virus that causes AIDS (Acquired Immune Deficiency Syndrome). A person can live a relatively normal life for many years if they are diagnosed with HIV, but they are said to have AIDS when they develop an HIV related illness. Which of the following statements about HIV do you agree with? A. We should avoid going near HIV positive people because we might catch it by being near them. B. HIV positive people are capable of participating in everyday life like people with any other disease. C. HIV positive people should not be allowed to use public facilities like toilets and water pumps. D. People with AIDS are solely to blame for catching the disease. A-D: Answer Options, E: Not Attempted, F: Invalid Entries 2.3 STUDENTS AWARENESS AND ATTITUDES TOWARD CIVIC/CITIZENSHIP ISSUES Students in class 4 seem to have a stronger sense of civic responsibility than students of class 8 with regard to disposal of garbage. Older students seem to have less personal responsibility and repeat undesirable practices if they see everybody's doing it, or if there is extra work involved in doing the desirable thing. Nearly 20% of students think that it is ok to bend traffic rules in an emergency or as long as there is no personal harm. Nearly 20% of students also would vote based on their community affiliation. A large majority of 67% of students think that it is ok not to consider others convenience if done only once in a while is or if they do not complain or one is clear that laws are not being broken. About 45% of students in classes 4 to 8, generally show an extremely positive attitude of trust towards the police and believes that police will try their best to help people. Civic responsibility is comprised of actions and attitudes associated with social participation and democratic governance. Some attitudes related to civic responsibility include the intention to serve others, the belief that helping others is one s social responsibility, and the tolerance and appreciation of human differences (Markus, King, & Howard, 1993). Schools teach civic responsibility to students with the goal to produce responsible citizens and active participants in community and government. 48

 with regard to disposal of garbage.")
 or as long as there is no personal harm (C-21.2% at Class4, 24.")

50 Class 4, 8 See the picture below and answer questions 55 and 56. People throw garbage out in the street, from the bus or train, in the river, in empty buildings, in the theatre, in parks and canals. When do you think people could throw out garbage in the street, from the bus or in the canals? A. when there are no garbage bins B. when others do the same C. never A-D: Answer Options, E: Not Attempted, F: Invalid Entries Students in class 4 seem to have a stronger sense of civic responsibility than students of class 8 (C-34.0% at Class4, 28.4% at Class 8) with regard to disposal of garbage. Older students are more likely to have the idea that if everybody's doing it, or if extra work involved in doing something, it decreases personal responsibility. A significant number are likely to think that it is ok to bend traffic rules in an emergency (B-15.9% at Class4, 16.7% at Class 6) or as long as there is no personal harm (C-21.2% at Class4, 24.9% at Class 6) Class 4, 8 See the picture alongside and answer questions 55 and 56. There are zebra crossings on the roads. People can use these to avoid being hit by fast moving vehicles. However, many children and adults cross the roads without using these zebra crossings. When do you believe it is okay not to use these zebra crossings? A. people should always follow rules and use zebra crossings B. if people are late for meetings, it's ok not to use them C. it is ok not to use them if people are always careful About 18.6% of students would vote if someone is from their own community. In class 6, almost as many as 67% are likely to think that "bad" action if done only once in a while is ok or that if there isn t much reaction (if not too many people complain), or any laws are not being broken it is fine. A-D: Answer Options, E: Not Attempted, F: Invalid Entries 49

51 Class 8 Elections are being held to choose Members of the Legislative Assembly (MLAs). Wazirpur is not a very developed village and people have difficulty accessing roads, drainage etc. Four politicians from Wazirpur have stood for the election and are saying the following things. Whom would you vote for? A. Ahmed says he will develop the village by building parks, roads and hospitals. B. Rajiv belongs to your caste and he tells you that he will work to further the interests of your cast. C. Rani is a social worker who has been working for the development of the underprivileged and she says she will continue to do that work. D. Anita says that she will develop the village by building cinema halls and organize fairs. A-D: Answer Options, E: Not Attempted, F: Invalid Entries 2.4 STUDENTS AWARENESS AND ATTITUDES TOWARD ECOLOGICAL ISSUES A significant number of students (19-23%) at all three class levels think that ecological/environmental issues are the responsibility of a higher institution e.g. government. Environment education is crucially needed to prepare students who would play an active role in protecting the environment through making informed decisions and taking environmental friendly behaviour (UNESCO-UNEP, 1991). One of the objectives of environment education was working towards the resolution of environmental problems. A goal of environment education is to make people more sensitive about environment and environmental protection by helping them to develop positive attitudes emotions, thoughts and behaviours about the environment (Simseki, 2001; Erten at al., 2003; Ozmen et al, 2005; Erol & Gezer, 2006). In response to the question related to environment, while 32-44% of students at all three class levels understand that personal use can make a difference to the environment. It is also important to note that a significant number (19-23%) at all three class levels think that ecological/environmental issues are the responsibility of a higher institution e.g. government. Class 4, 6, 8 Some items we commonly use like batteries and bulbs often contain poisonous substances. If we dispose them carelessly, they can be dangerous. It can cause death or injury to living creatures. What is the best thing to do in this case? A. dispose them in another country B. bury them deep in deserts or oceans C. avoid or reduce the use of such items D. the government should take care of this problem 50

 who have effective personal and interpersonal skills are better able to apply these skills in everyday life to make informed decisions")
 developed by Australian Council for")
52 A-D: Answer Options, E: Not Attempted, F: Invalid Entries 2.5 STUDENTS VALUES AND INTERPERSONAL SKILLS 30% of students said that they did not think how their actions would affect others, wanted to have the last word in an argument, felt uncomfortable if people disagreed with them, were aggressive in arguments. Personal and interpersonal skills development is a critical component in addressing student health and wellbeing issues. Research illustrates that students (or people for that matter) who have effective personal and interpersonal skills are better able to apply these skills in everyday life to make informed decisions about their behaviours. In addition to the questions administered in the SS section of the scholastic papers, few released items from the Attitudes and Values Questionnaire (AVQ) developed by Australian Council for Educational Research were included in the student questionnaire for class 8 students. Scales were constructed using 5 items each selected from five dimensions (Conscience, Compassion, Emotional Growth, Social Growth and Service of Others), and their reliability checked by measure of internal consistency (Cronbach s alpha) in the pilot carried out before the main study. Majority of students (70-80%) of students reported that they will not use stolen property, will report unidentified wallets to the police, will speak out for their beliefs, will feel bad about bullying others, will be kind to others, will feel sorry for injured people, will be protective towards weaker people, will be a friend to lonely people, will learn from mistakes, like to work in teams, have strategies for handling anger, not letting feelings influence their behavior, having a sense of responsibility towards others and serve others. 30% of students said that they did not think how their actions would affect others, wanted to have the last word in an argument, felt uncomfortable if people disagreed with them, and were aggressive in arguments. Scale 1: Citizenship and conscience of corruption problem I would feel bad if I had stolen something. If I found a wallet with money but no identification, I would take it to the police. If I believe in something I will speak out, even if it makes me unpopular. I would feel bad if I had been involved in bullying another person. Scale 2: Compassion and social empathy I try to be kind to people even if they are not kind to me. If I see injured people on the television news, I feel upset. I feel protective towards people who are weaker than I am. If I see someone who is looking lonely, I try to be friend them. Scale 3: Emotional growth If I have made a mistake, I try to learn from it. I feel comfortable working with a group. I have strategies for dealing with my anger. I don't let my feelings dictate my behaviour. Scale 4: Social growth and communication skills I think about how my actions will affect others. I don't have to have the last say in an argument. If people disagree with me, I feel comfortable. I try not to be aggressive in an argument. Scale 5: Service of others I feel a sense of responsibility towards others. I try to see how my strengths can be used to serve others. I watch for opportunities to help other people. I would be willing to join a service group to help others. 51


53 It is possible that students may to some extent have reported doing things that appear to be desirable and correct, however, it is still a useful measure due to large sample size and the patterns of responses do reveal larger agreements and disagreements STUDENTS PARTICIPATION IN CO-SCHOLASTIC ACTIVITIES For a well-rounded development of the child, it is desirable that schools follow a holistic approach to education a development that stresses on the physical, mental, moral and social aspects. NCF 2005 mentions co-scholastic activities also to be an integral part of the school curriculum. Schools try to provide facilities to the students for various activities that provide for a more rounded development of the student. Data about co-scholastic activities reveals that students participate at least once a school week in various activities such as sports, arts & craft, dance, music, drama and debates. All activities had at least 30% or more students participating, with participation being highest in sports compared to other activities. More than 60% students also said that they participate in sports and art competitions. 52
54 3. LEARNING ENVIRONMENTS: SITUATIONAL FACTS This chapter focuses on the description of background information collected from School, Principals, and Teachers and Students family. Details such as the type of board school belongs to, number of teachers, number of students, time allocated for different activities, availability of library, science laboratory, computers and internet, admission process, fees, and an estimate of the number of students from economically affluent/disadvantaged families were collected to build an understanding of basic information about the schools. These questions were included in the school details form and the information was provided by the school administrators. Additionally, Principals also provided information on the frequency of co scholastic activities, availability of a coach or guide for co scholastic activities in the schools. Information were collected through principal and teacher questionnaires on age, gender, academic qualification, teacher training qualification, teaching experience and the last training attended through Principal and Teacher questionnaire respectively. Students background details such as gender, age, time spent on homework, parents qualification, parents occupation, availability of computer and internet at home, parents help in homework, frequency with which students share their problems at home, availability of news papers at home, habit of parents reading out newspapers at home, number of books at home, books students like to read other than text books were collected through the student questionnaire. 3.1 DESCRIPTION OF SCHOOL BACKGROUND Only 76 out of the 89 schools tested filled the school details form. This form collected the following information. School Resources: All the schools (100%) confirmed the presence of a library and science lab, and 93% of schools confirmed having internet connection. While more than 37% of the schools had more than 50 computers, 34% schools had 21 to 50 computers and 29% had 1 to 20 computers. This shows that schools had the basic facilities/tools for information, search and investigation that students would require in their quest for knowledge. School Resources Library Science Laboratory Internet Number of Computers >50 % of Schools 100% 100% 93% 0% 29% 34% 37% School strength, Teacher strength and Class size: Majority of the schools that participated in the study had anywhere between 1000 to 3000 students and up to 150 teachers. Number of Students In School % of Schools 8% 8% 21% 16% 18% 12% 8% 5% > 4001 Number of Teachers In School % of Schools 25% 37% 26% 7% 1% 53
55 The average class size was between 40 to 50 students per class or teacher. Number of Students In Class >50 % of Schools 9% 32% 42% 14% Admission Methods: The most common procedure for admission was a written test and interview of students. Nearly 1/5 th of the schools also had parent interviews as a method of selection for admission. Admission procedure % of Schools Admission tests, Student s interviews 29% Admission tests, Student s interviews, Parent s interviews 22% Admission tests 21% Fees: Only 24 schools provided information on their fees. Due to this small size of the sample, this information is not included in the report. Extent of Students from different economic backgrounds: The schools were asked to provide the likely percentage of students coming from different socio- economic backgrounds. Predominantly, more than 42% of the schools tested, reported that they had more than 50% of their students from economically affluent homes, while 38% of schools had less than 10% of students from economically disadvantages homes. Distribution of time (hours) in School per week: QES collected information through the Principal Questionnaire about the distribution of class time in terms of number of hours per week spent on academic/regular classes, intervals/breaks, free time, physical education and sports, music, art/craft, dance, debates/elocution, dramatics, other activities. Schools on an average spend 9% and 10% each of time respectively on physical education/sports and coscholastic activities like music/art/dance/ elocution/dramatics. About 60% of class time is spent on learning academic subjects. 54


56 Frequency of sessions for practicing co scholastic activity in School: Students were asked about the frequency of school sessions that they spend on different co-scholastic activities. The chart shows that the 3 areas of Sports, Art/Craft and Music are often provided to students through sessions once a week or more. It is also important to notice that about 16-21% of students reported that they never get to practise Dramatics, Dance, Debates or Music, while 6.5% and 9.0% said they never practise Art/craft and Sports respectively. School Resources for Co-Scholastic Activities: Principal questionnaire included items that brought out information on sports offered in their schools and their perception of the quality of service in terms of equipment, ground/room, instructor/coach and competitions. The following are the principal responses: The 9 most popularly offered sports in schools included Basketball, Cricket, Football, Volleyball, Athletics, Table Tennis, Badminton, Throw ball and Hand ball. Hockey, our national sport, was offered in only 4 of the 89 schools that participated in the study. Almost all the schools tested rated themselves as good or excellent (average scale score of 4 or above) in the quality of the services (instrument/ material, room/auditorium, and availability of instructor) in the co-scholastic areas. Dance, sport, debates and art had slightly higher facilities than dramatics or music. Students were also participating slightly more in interschool competitions than intra-school competitions. 55
57 3.2 DESCRIPTION OF PRINCIPAL AND TEACHER S BACKGROUND Principal Background Information on Principal background was collected on gender, age, academic qualification, teacher training qualification, and experience as a teacher and principal, and training attended in last 12 months. Only 54 Principals out of 89 schools responded to the Principal questionnaire. This revealed the following: Variable Description Female Male All % % % Gender Average age Academic qualification Bachelor Post graduate Diploma Master PhD Other Teacher training qualification No teacher training Diploma/PTC B. Ed M. Ed Other Average years of experience as a teacher Average years of experience as a principal at this school Average years of experience as principal Training in last 12 months Men are under-represented in school leadership positions in primary education (35%). There are no meaningful differences between male and female Principals in terms of age, education background and years of experience as a teacher or Principal. Both female and male Principals were aged around 54 years. They have around 25 years of experience as a teacher and almost 13 years as a principal, out of which 8 years have been in the current school they are serving. Most of them have a Master s degree (85%). However, differences are found in pre-service and in-service teacher training. Although most of Principals have a Bachelor or Master s degree in Education, 11% of male Principals had a PTC/diploma while all female Principals had a training qualification higher than a diploma in education. 56% of female Principals had an M.Ed. compared to 44% of male Principals who had an M.Ed. Also, 78% of female Principals received training in the last year while barely 44% of the male Principals received in-service training Teacher s Background A total of 790 teachers from 89 schools participated in quality education study. Information on teachers background was collected on their gender, age, employment status, academic and teacher training qualification, teaching experience, training attended in the last year etc. It was found that 92% of the teachers were female and 8% male. This reveals that the teaching force in the schools is represented to a very large extent by females. The average age of teachers is around 41 years. 77% of teachers have a permanent employment status in the school, 52% had a master s degree, 77% had a bachelor degree in education. The teachers had an average 12 years of teaching experience with 7 years from the current school in which they were employed. While 34% of Teachers did not have any training in last 12 months, 35% of Teachers had trained on teaching methodologies in last 12 months. 56
58 Teacher Background Female Male All (Total Teachers 790) % % % Female/Male Average age 41 Employment status Permanent Contract full time Contract part time Other Highest level education Bachelor Post graduate Diploma Master PhD Other Teacher Background Female Male All Highest teacher training No teacher training Diploma/PTC B. Ed M. Ed Other Average years of experience as a teacher 12 Average years of experience at this school 7 Training in last 12 months None Subject Content Teaching methodologies Classroom management Interpersonal skills Any other DESCRIPTION OF STUDENT BACKGROUND 22,966 students responded to the background questionnaire and gave details such as gender, age, time spent on homework, parents qualification, parents occupation, availability of computer and internet at home, parents help in homework, frequency with which students share their problems at home, availability of newspapers at home, habit of parents reading out newspapers at home, number of books at home and the books other than text books that students like to read. Student Background Mother Father All Parents Education (%) Less than Class X Class X Class XII Graduate Master s Ph.D Other Parents Occupation (%) Own Business Employee in Private Company Employee in Govt. / Public Sector Housewife/husband Other Talking at Home about Problems in School (%) Yes 66.0 No 34.0 Talking about Studies at home (%) Never 10.5 Once a week 13.1 More than once a week, but not every day 25.0 Every day 51.4 Time spent on homework (%) Less than 30 minutes per day minutes to 2 hours per day 46.2 More than 2 hours but less than 4 hours per day 19.0 More than 4 hours per day 7.5 Getting Parents help in Homework (%) Mother (yes) 54.8 Father (yes) 42.5 As per the data collected, 45% of the students tested were girls and approximately 55% students were boys. Parental Education: About 63% of parents have a degree, a post graduate degree or a Ph.D. 57
59 Parental Occupation: Majority of students reported that mothers stay at home/are home makers (61.7%) and fathers are into business (41.4%). 15.8% of students had their parents employed in the private sector while 13.0% had parents working for the government. Talking at home about Problems faced in School: 66.0% of students talk at home about the problems they face in School, 23.0 % students do not talk and 11.0 % did not respond to this question. Talking about Studies at Home: Students were also asked how often they discuss the things studied in school with someone in family. About 51.0 % of students reported discussing everyday, 25.0 % said that they do it more than once a week but not every day. 13.1% and 10.5% respectively reported doing so once a week or not discussing at all. Time Spent on Homework and Getting Parents help in homework: Majority of students (46.2%) spent between 30 minutes to 2 hours per day on homework, while 27.3% spent less than 30 minutes per day. 54.8% of students reported that their mothers help in homework while 42.5% said that their fathers helped in their homework. Books available to read at home (%) None More than Type of books student likes to read (%) None 3.1 Storybooks 35.7 Comic or graphic books 14.2 Books of poems 3.0 Textbooks related to studies 6.0 Encyclopaedias 12.6 Magazines 5.4 Other 20.0 Time spent on reading other material (%) Not read at all 5.8 Less than 30 minutes per day to 60 minutes per day 34.2 More than 60 minutes per day 21.0 Getting daily newspaper at home (%) Yes 74.7 No 9.1 Don t Know 16.2 Frequency of reading newspaper (%) Never 11.3 Once a week 30.0 More than once a week, but not every day 19.0 Every day 39.7 Frequency of parents reading out (%) Never 39.7 Once a week 24.3 More than once a week, but not every day 14.5 Every day 21.5 Having computer at home (yes %) 84.4 Having internet at home (%) Yes 60.8 No 26.7 Don t Know 12.5 Familiarity with internet (yes %) 73.3 Books available to read at home: 39.3% of students reported having more than 30 books while 5.6% said that they did not have books available for reading at home. Types of Books students like to read: 35.7% of students liked reading story books while 14.2% said that they liked Comics or graphic books. 12.6% liked to read encyclopaedias and 20% reported reading material other than what was listed. Less than 6% or below reported liking to read magazines, book of poems or textbooks. 3.0% did not like to read. 58
60 Time spent on reading other materials: When asked about the time spent on reading material other than text books, 39.0% students responded less than 30 minutes per day, 34.2% between 30 to 60 minutes per day and 21.0% spent more than 60 minutes per day. On an average, students spent 30 to 60 minutes on reading materials other than text books. Getting daily newspaper at home: A large number of students (74.7%) get newspapers at home. Frequency of reading newspaper: While 39.7% of students read newspapers every day, 19% read more than once a week but not every day, 24.3% reads once a week and 11.3% never reads newspapers. Frequency of parents reading out newspapers or storybooks for students: Students were asked how frequently parents read out newspapers or story books for them. 39.7% students said never, 24.3% said once a week, 14.5% responded more than once a week but not every day while 21.5% said every day. Having Computer and Internet at home: Majority of students have computer (84.4%) and Internet at home (60.8%). 73% of students are familiar with using internet. 59
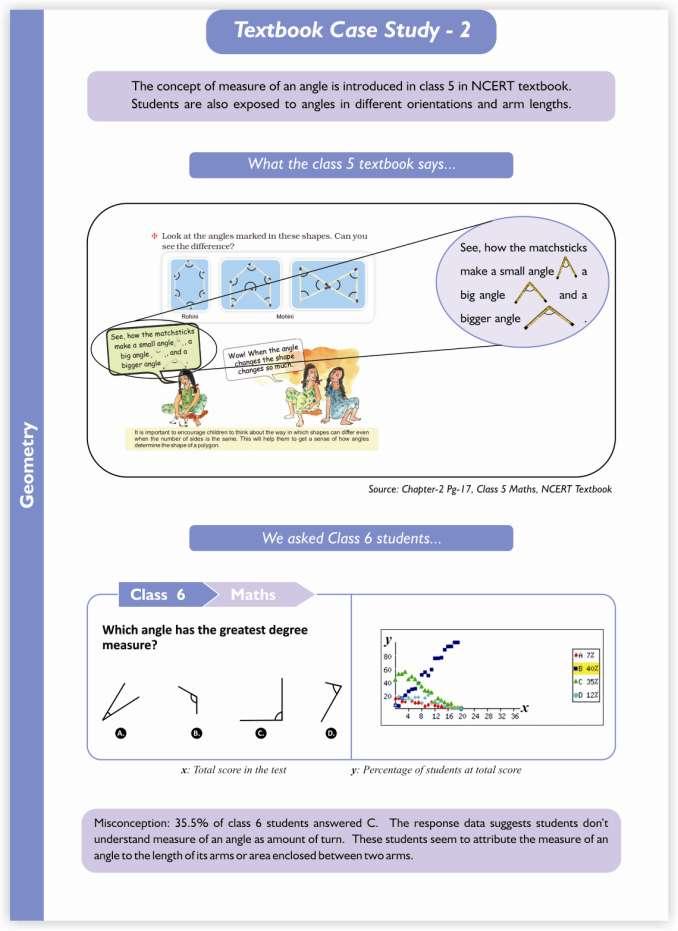
61 60
62 4. LEARNING ENVIRONMENT: PRACTICES AND PERCEPTIONS Ever since the Coleman report (1966) concluded that schools do not have an important effect on student learning, across the world, diverse studies have been conducted to rescue the role of the schools and determine how schools impacts learning and how even under relatively poor conditions, some schools achieve success in student outcomes. QES explored the school and classroom contexts to understand aspects of learning environments seen in India s top schools. Parameters covered under the school context looked into the role of the principal as a leader and manager of the school context and its staff, the autonomy principal has for decision making, leadership styles and its influence, school climate, principal beliefs related to teaching and learning and teacher appraisals. For the purposes of triangulation of information, teacher and principal s perception were collected and contrasted on the same parameters, where necessary. Parameters such as the teacher beliefs on teaching and learning, classroom discipline, teaching practices for instructional quality, and student perception of classroom climate were covered under the exploration of the classroom context. 4.1 THE SCHOOL CONTEXT - LEADERSHIP AND MANAGEMENT PARAMETERS Leadership and Management Styles 5 dimensions such as decision making in a school, instructional and administrative leadership styles, communication with parents through parent teacher association (PTA) and allocation of the Principal s time to various activities were researched under this parameter. a. Decision Making: The closer the school management is to its clients, the more likely it is to be responsive to their demands and interest (Gaziel, 1998; Smylie et al, 1996; Long, 2001). The rationality for this would be that the principal, teacher and parents probably know the problems related to providing quality education better than the school management or board, and hence have possible solutions for the same. QES analysed the loci of control in a school, in order to know who has the final authority for taking important decisions in a school. Questions were included in the Principal questionnaire on different decision making aspects related to curriculum, student policies, budget and policies related to teacher recruitments, dismissals and remuneration. Locus of Control Decision Making School Management Principal Teachers Central Authority CURRICULUM AND CONTENTS Choosing which textbooks are to be used. - Determining the course content. - Deciding which courses are to be offered. - STUDENT POLICIES Establishing student disciplinary policies. - - Establishing student assessment policies. - - Approving students for admission to the school. - BUDGET Formulating the school budget. - - Deciding on budget allocations within the school. - - TEACHER POLICIES Selecting teachers for hire. - - Dismissal of teachers. - - Establishing teachers starting salaries. - Determining teachers salary increases. - - Main decision maker Decides in consultation with main decision maker Central Authority refers to a school board or Ministry of education. Contributes to decisions 61
63 It was found that the Principals are the main decision makers on the courses offered, student disciplinary policies, assessment policies, student admissions and teacher recruitment in these schools. The management controls and mainly decides on the school budgets, its allocations, teacher salaries, increments and teacher recruitments. The teachers decide mostly on the textbook and course content. This trend of decision making was found to be largely the same in both high performing and low performing schools. (The exception was one of the schools included in the study based on expert recommendations, where the school did not have a designated principal or management and the functions of management, principal and teachers were all managed by a collective group of teachers who ran the school and took all the decisions based on consensus). b. Instructional and Administrative Leadership: Principals have been widely acknowledged as the agent of change in creating effective schools (Gamage, 2006). In fact, direct and indirect relationship between Principal s leadership in school and student achievement has been established in several research studies. The acknowledgement of Principal as a factor on the student learning also opened the discussion on the style of management and leadership. Although many theories of leadership have been influential in guiding school leaders such as transformational and transactional leadership, total quality management, servant leadership, situational leadership, and instructional leadership (Clark, 2009; Brown, 2001), the last one obtained great popularity in the last two decades (Clark, 2009; Grissom & Loeb, 2009). QES looked into the different styles of leadership such as instructional leadership (Instructional leadership included framing of school goals, communicating school goals, coordinating the curriculum, supervision of instruction, monitoring school progress and promoting professional development of teachers) and administrative leadership (Administrative leadership included accountability and upholding bureaucratic rules) followed by the Principals of India s top schools. Instructional leadership is recognised as a major factor contributing to higher student achievement in schools (Clark, 2009). The three main functions of instructional leaders have been identified as defining the school s mission, managing the curriculum and instruction, and promoting a positive school climate (Clark, 2009; Brown, 2001; Hallinger & Murphy, 1985, 1987). This definition also forms the basis of the framework for the Principal Instructional Management Rating Scale (PIMRS) by Hallinger et al. The Teaching and Learning International Survey (TALIS), conducted by OECD in 24 countries around the world, elaborated the 3 main functions of instructional leaders through question items organised into 3 scales that measured instructional leadership in schools. In Quality Education Study (QES), information about instructional leadership was collected through a combination of 31 items organised into 6 scales. The items and scales were an adaptation of PIMRS and TALIS 4 study. All the items had four options: Never, Seldom, Quite Often and Very often that were scored as 1, 2, 3 and 4 respectively. The 6 scales were: Framing the school goals 6 items, Communicating the schools goals 5 items, Coordinating the curriculum 5 items, Supervision of instruction 4 items, Monitoring student progress 5 items and Promoting instructional improvements and professional development 6 items. Items were included in both Principal and teacher questionnaires to ensure a more reliable measure. In addition to the instructional leadership, two scales were included from TALIS to measure Principal s administrative leadership, which is defined as a management style that focuses on administrative tasks, accountability and enforcement of rules and procedures. The 2 scales used here were: Accountability role 4 items and Bureaucratic rule follower 5 items. These items on administrative leadership were included in the 4 Teaching and Learning International Survey programme (TALIS) is an international programme organised by OECD to focus on the learning environment and the working conditions of teachers in schools. 62

64 Principal questionnaire only as the teachers were not expected to be aware of administrative aspects. Each of the item had 4 options Strongly disagree, Disagree, Agree and Strongly agree and were scored as 1, 2, 3 and 4 respectively. To obtain an index for each type of leadership, simple average of all item scores was calculated for each scale. A simple average of the all the scales was further computed to get an overall index of instructional leadership and an overall index for administrative leadership. Once the instructional and administrative leadership indices for each school were calculated, the scores were transformed to an international metric of mean zero and standard deviation one. The indices were seen to range from +3 to -3 where +3 means a higher leadership style and -3 a lower leadership style. These two indices were then compared across various schools having the intersection of the whole sample equal to zero. It is important to note that the analysis is not based on the practice or non-practice of the leadership index. In other words, lower scores do not mean absence of the attribute; rather it means that the score for that leadership attribute is below the average score obtained by all principals. Also, the two leadership styles are not necessarily mutually exclusive, even though they are sometimes portrayed as such in the research literature on school leadership (e.g. Hallinger and Murphy, 1986 in TALIS, 2009:196). Effective school management generally comes from engagement in instructional leadership but at the same time, effective leadership also involves administrative accountability and a workable bureaucracy (TALIS, 2009:196). Management Styles of School Principals Each point in the graph represents a school Principal, and the x axis is instructional leadership and y-axis is administrative leadership. Zero in the graph represents the average score of all Principals in instructional as well as administrative leadership. As can be seen, the Principals are spread across the graph and have varying degrees of both leadership styles. However, as can be noted by the upwardly slanting line, most principals who were found to have higher instructional leadership, also had higher administrative leadership which implies a positive and intermediate association between the two leadership styles (r=.42). Leadership indices were also further crossed by principal s background. The reason for these comparisons was to distinguish if any of the characteristics of the principal s background influence their leadership style. Multiple linear regressions (MLR) were performed for this analysis. Principal s gender, age, years of experience as a teacher, years of experience as a principal, in-service training or academic qualification did not make any difference to their management style. However, Principal s who have a Master s degree in education were seen to embrace significantly higher instructional leadership style than their counterparts who had only a Bachelor s degree in education. There was no such significant difference for administrative leadership style. 63
 on instructional leadership tasks such as developing curriculum and pedagogy.")
65 c. Principal s Time Allocation: Principals reported spending nearly a quarter of their time ((23%) on administrative tasks such as recruitment, budgeting, scheduling and internal meetings and little lesser (20%) on instructional leadership tasks such as developing curriculum and pedagogy. Principals also mentioned that one-tenth (10%) of their time was spent on other activities such as ensuring campus cleanliness; carrying out case studies; entertaining visitors, attending and conducting workshops, interacting with NGOs and foreign universities. What do school Principals in these top schools say about their ideas of quality in education and challenges they face? Principals of about 16 schools that participated in the study were interviewed to gather their views as hands-on practitioners on what they believe as quality education and good schools, key areas that schools should aspire for, leadership, decision making process and challenges they face in providing quality education. Most Principals mentioned holistic education as their philosophy of education and described this as teaching for life, being humane, imbibing values, taking ownership, ability to take decision of good and bad, having a goal of giving back to society, and aspiring for integrity. They felt that education should help students build up a set of skills and capabilities that will allow them to be of use in one culture or other..a few of them said that they specially focused on facilitating girl education, in providing a happy environment, teaching students what they wanted to learn with the school playing the role of being an opportunity provider and teachers as enablers. Principals felt that key aspects of being leaders in schools means enjoying the confidence of teachers, being open to feedback, and leading by example. Principals did not mention that they were constrained by their management in their decision making. Most Principals mentioned hiring passionate and knowledgeable staff, training of teachers, student teacher ratio, mindset of teachers and parents, students indiscriminate access to technology (such as mobile phones, social networking sites, etc) as key issues they face. They also felt that upholding social and moral values in changing times was a challenge. While a majority of Principals considered B.Ed as the essential criterion for a teaching job, some of them said they looked into it more due to govt. requirements. Passion to teach and subject knowledge were considered critical during teacher recruitment. A few Principals also felt that experts from different fields were suitable to teach their subjects. For eg., doctors, engineers, lawyers and writers could teach well and their schools were open to recruiting them. Principals also said that teachers should be regularly mentored by experienced experts & in house trainings provided for updating their skills. All Principals felt that teachers should get good salary, and it was also critical to attract good talent to teaching profession. They mentioned that even after 6 th pay commission salaries were not comparable to corporate or teaching salaries worldwide. A few schools did mention that RTE was difficult to implement and it created more issues than answers due to the idea of 25% reservation in classrooms When Principals were asked what are the factors that they will take into account to come to quick judgements about a school, when one walks into a new school, they said they will use varied inferences such as check if the faces of children show happiness, see how they receive you in the school reception, look at the infrastructure that is apparent, and see how quiet or noisy the school environment is. Principals also felt that academic success should not be the sole motto of schools and schools should attempt to integrate the CCA more tightly into the curriculum. Principals expressed that their above average students were often the most successful students in real life and not the academic toppers. Some also said that schools should not publicize their achievements based on marks. 64
66 4.1.2 School Climate What exactly is school climate or school environment? School climate and elements that comprise a school s climate have been largely researched (Tubbs & Garner, 2008, p. 7; Andersen, 1982, p:368; Marshall). There is not much agreement in research literature on the components of school climate (Tableman, 2004, p.1). However, most authors mention the following four components i) physical environment (physical and material aspects such as the school building and school library) ii) social environment (characteristics of principal, teachers and students) iii) social system or affective environment (formal and informal structures or rules that govern individuals and groups' interactions in school, such as principal-teacher communication, participation of staff in decision making, students' involvement in decision-making, collegiality, and teacher-student relationships) and iv) culture (norms, belief system, values) (Tableman, 2004, p: 3; Tagiuri in Anderson, 1982, p: 369; Hanna, 1998 in Tubbs & Garner, 2008, p: 7). Most of the studies on school climate focused on culture and social dimensions of school climate (Anderson, 1982; Tubbs & Garner, 2008). In the Quality Education Study, school climate was selected as a relevant parameter that shapes quality education. This parameter looked into 4 dimensions such as - Job Satisfaction and Self efficacy perceptions of the Principal and Teacher Structure, which included Principal s delegation and distribution of leadership, and effective communication among staff for decision making. Shared and monitored mission, which included teachers working with a shared sense of direction, and partnership with parents and community, and teaching effectiveness monitored regularly. Trusting and collaborative climate, where there is discussion among colleagues that are honest and candid; there is mutual support among teachers; staff is tolerant of each other s opinion and actively seek information to improve the work; colleagues are looked upon as resources; and there is ongoing professional dialogue among teachers. Job satisfaction is an organizational concept that allows explaining why a person performs satisfactorily and feels identified with an organization. It is expected if a teacher is satisfied with his/her work and school; the teaching learning process will improved. Self-efficacy is perceived as beliefs in one s capabilities to organize and execute the courses of action required to manage prospective situations (Bandura, 1997). In education sector, Tschannen- Moran and Woolfolk Hoy defined teacher efficacy as a teacher s judgment of his or her capabilities to bring about desired outcomes of student engagement and learning, even among those students who may be difficult or unmotivated (in Henson, 2001, p.4). TALIS based its scale on the work of Bandura and it was included for QES. Information on job satisfaction was collected through one direct question while self-efficacy had a group of four questions that looked for perception of being successful, making significant contribution, being able to get through to students/staff and progress with even with the most unmotivated students/staff. 5 questions related to structure were included only in teacher questionnaire while the rest were asked in both teacher and principal questionnaires. Both Principals and Teachers had a very high extent of job satisfaction and self efficacy. 65
, a large-scale research project in Australia.")

67 The two scales trusting and collaborative school climate and shared and monitored mission - related to social environment component of school climate were borrowed from the Leadership for Organizational Learning and Improved Student Outcomes (LOLSO), a large-scale research project in Australia. Specifically, twelve questions were included in the principal and teacher questionnaires for these 2 scales. As can be seen from the accompanying graph above, 80% of both Principals and Teachers agreed that they had a positive collaborative climate. The perception of a trusting and collaborative school climate could be a good indicator of democratic environment. Analysis of teacher responses to questions that describe the democratic environment in the school (in the graph below) revealed that 80% or more teachers said that sharing of information with parents and community and communication among staff are the aspects that characterized their schools. This was followed by delegation and distribution of leadership with more than 70% teachers agreeing to these as aspects of their school. However, barely 45% of teachers said that they are involved in most significant school level policy decisions with 55% saying that they were not involved. This lack of participation of teachers in the decisions of important school policies was also confirmed by principals. This shows that schools apparently are spaces where there is a high degree of trusting and collaborative climate, communication among stakeholders, and distribution of leadership but not necessarily power for decision making for teachers Teacher Appraisal, Feedback and Mentoring Teacher appraisal is about documenting the quality of teacher performance; and helping teachers improve their performance and in consequence, increasing student achievement (Morelock, 2008: 14; Stronge, 2002:1). The two most frequently cited purposes of teacher appraisal are accountability and professional growth (Danielson & McGreal, 2000:8; Stronge, 2002:4; Morelock, 2008:16). The accountability component assures quality and 66

.")
.")
68 contributes to the school s mission. It relates to the summative assessment of teacher performance, which influences high-stakes decisions of employment. The professional growth component addresses the professional development needs of the teacher and relates to overall school improvement. Historically, in many countries principals have been the primary evaluators of teachers. Under this model, teacher appraisal system usually includes a meeting between principal and teacher, a formal observation, and a postobservation meeting (Morelock, 2008:29). Initially it was with accountability purposes, but then it shifted to being a tool for professional development. Principals were called upon to be instructional leaders guiding teachers in curriculum and instruction (Gregoire, 2009:1). However, with increasing administrative and managerial responsibilities, principals do not have the time to do teacher evaluation with the frequency and depth that is required (K. Peterson & C. Peterson, 2006 in Gregoire, 2009:6; Escamilla, 2000:2). Soon, teacher peer review has become more common in recent years as part of performance assessment and school improvement plans (Kumrow & Dahlen, 2002 in Morelock, 2008:33). However, the most widely contested component of alternative evaluation systems is the use of student-achievement data to determine teacher effectiveness (Hershbergberg & Lea-Kruger, 2007 in Morelock, 2008:36). Implicit is the relationship between teaching and learning process: if teachers have the responsibility to enhance student learning, then success should be demonstrated using student tests. Although it is a very common practice, opponents argue that this method promotes competition among teachers and tests usually do not accomplish requirements of standardization or adaptation to local situations. Teacher appraisal -including feedback and mentoring- was selected by QES as one of the important components to guarantee quality education. A set of closed questions were included in principal and teacher questionnaires to collect information on teacher appraisal on 4 dimensions related to type and frequency of appraisal, aspects considered in the appraisal and their relevance, presence of feedback and perception of its usefulness. a. Type and Frequency of Appraisal: Principals were asked on the type of teacher appraisal in the school and the frequency of the same. Teachers were asked if in the last year any type of teacher appraisal was used to monitor their practice as teacher in the school. The objectives of these questions were to see if teacher appraisal is an external or internal common practice and the frequency of them. Results are displayed in the graphs below. Nearly 25% of schools did not have teacher appraisal methods or carried them out only once every 2 or three years. 75% of schools said that they did teacher appraisals once or more in a year. While Student Assessment, Teacher Peer Review and Principal observation were often the methods of teacher appraisal, using an external inspector was the least followed method of appraisal. b. Presence of Feedback: While 95.6% of Principals said that they gave feedback after appraisal, only 68.7% of Teachers said that they received feedback from appraisal. c. Aspects considered in the Appraisal and their Relevance: Both principal and teachers were asked to rate the importance given in the teacher appraisal to six important components of teacher appraisal such as teacher s knowledge, teacher s teaching practices, teacher s management and relationship with students, teacher s professional development, stakeholders/ parents feedback, and student s outcomes. 14 items were included in the questionnaires under the six components. 67


69 Both Principals and Teachers felt that the ability of the teacher to manage a classroom, their innovative teaching practices, teaching methodology and knowledge of a subject were more important aspects of a teacher appraisal. d. Perception of its Usefulness: Given that teacher appraisal is an extended practice in the schools and covers very important topics to improve quality of teaching-learning process, is it perceived as useful by principals and teachers? QES explored this aspect, where principals and teachers gave their opinion on the utility of teacher appraisal in six different aspects: student learning outcomes, teacher s knowledge, teacher s methodology, teacher s classroom management, teacher s professional development and teacher s relationship with others. 68


70 Teachers felt that the appraisals were more useful in improving their subject knowledge and teaching methodology but less useful in improving student outcomes or their relationship with other teachers, While Principals also felt that the appraisals were useful in improving teachers subject knowledge they also felt that these were less useful in improving teachers teaching methodology. To recapitulate, student tests are the most common practice to assess teachers during teacher appraisal. Both principals and teachers felt that the most important aspect considered in the teacher appraisal is the teacher s knowledge of the subject; it was also the aspect that was perceived to benefit the most. Although considered important for student learning, in relative terms, teacher appraisal is perceived to ensure the quality of teaching more than the quality of learning Principals' Perception on Co-scholastic Skills & Curriculum The principal questionnaire included questions that checked the principals perception on the relevance, emphasis and importance of co-scholastic activities in the curriculum. A large number of Principals say that co-scholastic areas is definitely very relevant to curriculum and for building students self confidence, self control, sportsmanship, solidarity, teamwork, competitiveness, health, etc. However, less than half of who said so mentioned that their school places major emphasis in curriculum for these areas, indicating that what is being said is not often practiced. This was also corroborated by the fact that nearly 30% of students who took the student questionnaire said that their school does not have sessions for Sports or has very infrequently while a similar situation was seen for Music (45%), Art (30%), Dance (50%) and Drama 57%) and Debates (60%). The lack of actual emphasis in curriculum may need attention, if students are to develop skills in these areas. 4.2 THE CLASSROOM CONTEXT-TEACHER BELIEFS, PRACTICES, CLASSROOM CLIMATE, STUDENTS' SELF CONCEPT Teacher and Principal Beliefs about Teaching-Learning Teaching-learning process is the considered the key arena to improve the student learning. Everything around the school is focused on creating conditions that benefit an effective teaching-learning process, and thereby students academic outcomes. It is here that the impact of curricula, that teacher methods work well or not and that learners are motivated to participate and learn how to learn, is felt (UNESCO, 2005:37). It is also here that the leadership of principal focuses on. However, historically teaching-learning has been influenced by different epistemological perspectives. Under the umbrella of positivism and behaviorism, direct transmission of knowledge has traditionally been the privileged teaching-learning method in school classrooms. Under this perspective, the teacher directs learning, as the expert who controls stimuli and responses. Deductive and didactic pedagogies, such as graded tasks, rote learning and memorization are considered to be useful under this approach. Later in the 69


71 history, under a humanistic view, educational thinkers argued that the knowledge is not attained but constructed by students experience. This perspective -Constructivism- holds that a child constructs knowledge based on its own experience, and a student is more of an active than a passive actor and teacher is more of a facilitator than an instructor. TALIS refers to the beliefs about teaching that are influenced by behaviorist, (traditional or teacher-oriented perspective) as Direct Transmission view. The direct transmission view of student learning implies that a teachers role is to communicate knowledge in a clear and structured way, to explain correct solutions, to give students clear and resolvable problems, and to ensure calm and concentration in the classroom. In contrast, a constructivist view focuses on students, not as passive recipients but as active participants in the process of acquiring knowledge. Teachers holding this view emphasize facilitating student inquiry, prefer to give students the chance to develop solutions to problems on their own, and allow students to play active role in instructional activities (OECD, 2009:92). In QES, two scales created by TALIS were used to measure each individual teacher s and principal s teaching and learning beliefs for direct transmission and constructivist views. The response scale for each item on teaching and learning beliefs was a Likert-like scale with four options: Strongly disagree, Disagree, Agree, Strongly agree that were scored as 1, 2, 3 and 4 respectively. To obtain the index scores, ipsative scores were computed as was carried out in TALIS analysis. Calculating ipsative scores is an approach to standardizing individual responses to express them as preferences between two or more options and thus helps reduce the effects of response bias (Fischer, 2004). Ipsative scores were computed by subtracting the individual mean across all of the eight items measuring teachers beliefs from the individual mean across the four items belonging to the index direct transmission beliefs about instruction and also from the four items measuring constructivist beliefs about instruction. Thus, mean scores were calculated for both indices. The means across both indices average zero for each teacher/principal, and therefore the school means across both indices also equal zero. The resulting score of an individual teacher/principal is the relative endorsement of this index or the relative position of the individual on one index in relation to the other index. Positive score values indicate that one set of beliefs receives a relatively stronger support than the other. (TALIS, 2009:94). Below graphs plot the relative endorsement scores of principals and teachers beliefs for each school. As can be seen, in most of the schools the principal endorsement of constructivist beliefs is stronger than that of direct transmission beliefs. Only in 6 schools, principals endorsed higher scores for direct transmission. In most schools, therefore, principals believe that teachers should not simply present facts and give students the opportunity to practice, but rather that they should support students in their active construction of knowledge. Similar trend can be observed for teacher s beliefs; however, the number of schools that endorse direct transmission is higher when compared to principal s graph. In more than 10 schools, the teacher endorsement of direct transmission beliefs is clearly stronger than that of constructivist belief. However, the lines between 70


72 teacher s constructivist and direct transmission beliefs are narrower if compared to principal s beliefs. In other words, principals endorse higher constructivist beliefs than teachers do. In contrast, teachers tend to believe that both are necessary in the teaching learning process. They believe -for example- a good teacher demonstrates the correct way to resolve a problem but also in other circumstances of teaching-learning process, a good teacher facilitates student s own inquiry. That for example, students learn best by finding solutions to problems on their own but also providing problems with clear, correct answers and around ideas that most students can grasp quickly. However, placing India s top schools on an international scale from TALIS shows that India s top schools are among the countries which have a lower constructivist and higher direct transmission beliefs Teacher Practices for Instructional Quality Although it is expected that teachers would behave based on their beliefs, it need not always be the case. In QES, the three scales for rating teachers classroom practices were borrowed from TALIS, which implemented a basic model of three indices of instructional quality: a) Structuring practices which include key components of direct transmission and comprise items such as stating the learning goals, summarizing former lessons, homework review, checking the exercise book, and checking student understanding by making questions. b) Student-oriented practices that include a supportive climate and individualised instruction. Items refer to ability grouping, student participation on planning class, work in small groups and student self evaluation; and c) Enhanced activities which were measured with items such as participation in long projects, making a product, writing an essay, and debating arguments. These items were included only in the teacher questionnaire. The response scale for each item in the ratings of classroom practices was a Likert-like scale with four options: Never, Sometimes, Often, Almost always that were scored as 1, 2, 3 and 4 respectively. To obtain the index scores, ipsative scores were computed as was carried out in TALIS analysis. The graph presents the ipsative average scores of these three practices for each school. The relative averages for structuring practices were found to be higher than those for student-oriented 71

73 practices and enhanced activities in all of the countries. This means that structuring practices, such as stating learning goals, summarizing former lessons, homework review, checking the exercise book, and checking student understanding are the most frequently employed practices across all the schools. In the school profiles of classroom teaching practices graph, schools are also sorted and arranged by the relative frequency with which they engage in structuring practices during teaching. In consequence, schools placed on the left adopt the three different practices to a fairly similar degree, while teachers on the right use structuring practices much more than they do either student oriented practices or enhanced activities. Enhanced activities are less frequent than student-oriented practices in most schools. This means that teachers allow student co-determination of the lesson, employ ability grouping and give students individually adapted tasks more often than they assign their student projects, debates, essays and the creation of products. However, India s top schools are among the countries which moderately are high on structuring practice and low on enhanced activities on an international scale from TALIS. A detailed analysis at subject level was also carried out to look for the extent with which the different subject teachers followed the 3 activities. (Refer graph above). Schools followed higher structuring practices in Maths and Science and to a lower extent enhanced activities. English and EVS teachers followed to a higher extent enhanced activities' in their classrooms compared to other subject teachers. Maths and English included classes 4, 6 and 8; EVS included Science and Social Studies topics in classes 4 and 6; Science and Social Studies included class 8. 72


74 4.2.3 Teacher and Principal Beliefs on Student Discipline Principals (30%) and Teachers (40%) believed the following with regard to Student Discipline Strict discipline is necessary for proper teaching. The teacher s control over students is a must for discipline. There can be no discipline without fear of the teacher in students. Students not paying attention to studies should be physically punished. Undisciplined students in class should be physically punished. This brings to attention that a high degree of punitive and student repressive measures for maintaining discipline may be common even in the country s top schools Teachers Time in a Classroom Distribution of teacher time in class and per week was also collected by teacher questionnaires. Graphs below show how an average teacher allocated his/her time during a week and in class. If a week has 100 hours, around 57 hours are spent in classes, 25 in planning lessons, 11 in administrative duties and 8 in other activities. If one academic hour has 45 minutes, the net time that is spent in teaching learning process is around 29 minutes Students' Perceptions of Classroom Climate Improving learning not only requires effective teaching practices but also comfortable relationship of teachers with students, and among students themselves. Learning environment, also referred to as classroom climate, is generally defined in terms of the psychosocial characteristics of the classroom environment usually from student s perspectives. These psychosocial characteristics include interpersonal relationships amongst students, relationships 73
75 What did Focus Group Discussions with students and teachers reveal about school environments and practices? Common Patterns in schools: The characteristics of responses across the schools remain mostly uniform. Most of the schools studied had spacious and well equipped infrastructure. The student teacher ratio was often high (in the range of 40-50:1). Students of higher classes often mention being loaded with work/classes and appear stressed with academics. Students hate exams and long teaching hours they even don t mind cheating to avoid them. However, most schools say they don t have exams till class 8. Most of the younger kids aspire want to be in business, arts or sports, while the older ones want to be in business or technical jobs (like engineers). Most of the time spent by kids in homes is on video games, TV and similar things but not on constructive hobbies. Schools usually mean arts or sports when they refer to co-curricular activity (CCA). No teacher/student/principal said that they lack it, or they need more of it. However, anyone being given sufficient exposure to excel in his/her area of is not seen. Exposure to the social dynamics of general public, especially the middle and lower classes, are conspicuous in their absence. The teachers and the students talk usually about skills like mathematical thinking, soft skills, logical approach, problem solving etc. but rarely on emotional intelligence and moral values like empathy, honesty, etc. No social leader is quoted by children or teachers as their role model. Some of the specific methods, these schools adopt to realize the concept of a good school are Intensive parent orientation, regular teacher training programs and teachers workshops, ensuring synergy between Teacher s mindset and school s philosophy, ensure adequate Principal participation is all activities, not following a specific text book, but creating own text books / work sheets, student s grading/relative position in class based on class average marks, provide for internship of students for practical exposure to real life environments, create ability groups to stream /support them more effectively, provide for student participation in inter-school and intra-school competitions. Atypical schools/classrooms: Sample 1: In contrast to response of students of most other schools, the students of school code 128 had somewhat different experiences to share. They found their environment more close to nature (feed birds, go for nature walk, climb trees etc), unlike concrete structures, which helped them to relax and experience things. The environment in the school offered much more freedom to the children. They are neither forced nor punished. They can take breaks at will and the issues are resolved through discussions. Learning happens as the teachers pay individual attention till the child understands, contrasted by passive blackboard teaching. No of students per class was very small, and it was seen to encourage close relationship with teacher, and the children are appreciative of this value. Teachers are also found to be more open to all type of questions and don't hesitate to take time to answer. In this school, everyone knows everybody and this might have helped in building real strong relations for mutual growth. No exam till 10th must have relieved the pressure on the students. Equal importance to co-curricular activities like arts, pottery, music etc., has added to the child's perspective of development. Teachers of this school also enjoy self controlled freedom without any top management. They seem to have a process of detailed weekly deliberation (4hrs) amongst themselves to continuously understand and set direction for future. Connection across teachers looks good. The general philosophy for them is to focus on overall and larger perspective of process oriented life.in summary, some of the unique attributes of this school make it a better school among the lot, the feeling shared by its own children and teachers. Sample 2: The students of 604 enjoy coming to school most of the times. They prefer alternative professions. They also like extra-curricular classes which are around 2-3 sessions out of 7 every-day, along with good nature around the campus. They get opportunities to develop skills in areas like farming, mattress making, wood work, fire wood, cheese making, tree planting. They enjoy and learn the activity based classes like assembling parts of machine, manure preparation through earth-worms etc. They also appreciate the responsibility of hot water preparation in the morning. Resources seem to be plenty in the school and children have no complaints. They also like music. With no punishment and lesser exam pressure, they seem to be open and relieved. Being a small school with 100 acre campus and good facilities, teachers are quite happy. They seem to be convinced about the philosophy of the school and are happy with their job. 74
76 between students and their teacher, relationships between students and subject studied, methods of learning, and finally, students perceptions of the structural characteristics of the classroom. Although there are many inventories, What Is Happening in the Classroom (WIHIC) student questionnaire is used in the current study since it is the most modern and updated inventory validated in several studies in various countries. Compared to other inventories, WIHIC combines modified version of salient scales from a wide range of existing questionnaires with additional scales that accommodate for contemporary educational concerns such as equity and constructivism (Fraser, 2002). For QES, the seven original scales from WIHIC (cohesiveness, teacher support, students involvement, investigation, task orientation, cooperation and equity) were included in the class 8 student questionnaire. In the WIHIC questionnaire, there are 8 items on each of the 7 scales. However in QES, only 4 or 5 items were used from each scale in order to keep the student questionnaire length manageable and at the same time ensuring content coverage for each scale. The response scale for each item on classroom climate was a Likert-like scale with five options: Almost never, Seldom, Sometimes, Often and Almost always that were scored as 1, 2, 3, 4 and 5 respectively. To obtain an index for each scale, simple average of all item scores for each teacher was calculated, and then simple average of all the teachers for each scale was calculated. Results showed that majority of students perceived the classroom climate as positive in their schools. Cohesiveness is the most important characteristics mentioned by students. It means student knew each other, are friendly and like each other. Task orientation is another important characteristic where student pays attention in class, gets work done, knows the goals, purpose and what they need to accomplish. In contrast, the aspect that gets lower scores was investigation. Apparently, students do not carry out investigations or they are not asked about evidence or use of diagrams or graphs. It could be related to the low level of enhanced activities teachers practice in the classroom. 75
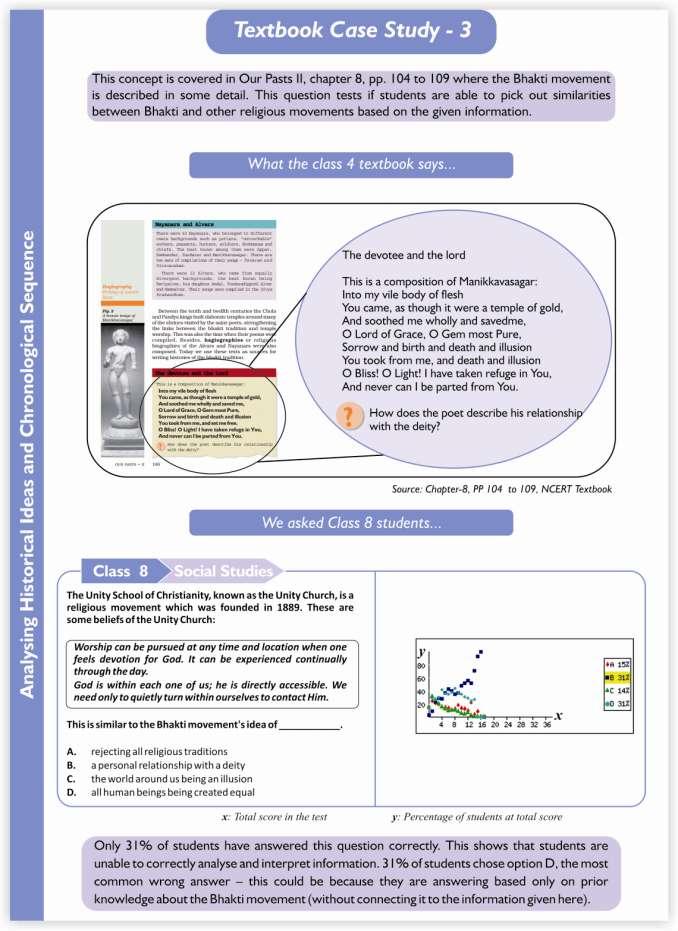
77 76


78 5. LEARNING ENVIRONMENTS: LINKAGES The present chapter describes the linkages among different parameters collected in QES, to understand the different aspects of learning environments and how they influence each other. While multiple comparisons of different parameters were carried out, only the relationships that were evident are described in this chapter. 5.1 LEADERSHIP STYLES VERSUS SCHOOL CLIMATE As discussed in the chapter 4, leadership can be understood as the confluence of two styles: administrative that pursues operative and bureaucratic activities, and instructional that spends more in improving and supervising teaching instruction. School climate could be understood as structure (that includes Principal s delegation and distribution of leadership and effective communication among staff for decision making); shared and monitored mission (that includes teachers working with a shared sense of direction, and partnership with parents and community, and teaching effectiveness monitored regularly) trusting and collaborative climate ( that has discussion among colleagues that are honest and candid; there is mutual support among teachers; staff is tolerant of each other s opinion; personnel actively seek information to improve the work; colleagues are looked upon as resources; and there is ongoing professional dialogue among teachers). Analysis was carried out to study if leadership styles of school principals had any relationship with the school climate seen in their schools. Correlation results show that higher the instructional leadership followed by Principals, the higher was the school climate and a similar relationship was seen between structure and instructional leadership. When read together, it means that Principals who spends more time in improving and supervising teaching instruction also tend to delegate and distribute leadership more among her staff with diverse viewpoints, and ensure their involvement. Such Principals also support a committee structure for decision making and facilitates effective communication among the staff. 5.2 TEACHERS TEACHING-LEARNING BELIEFS VERSUS JOB SATISFACTION AND SELF EFFICACY Teacher s job satisfaction and teacher s perception of self-efficacy are some of the key organizational components to understanding the teacher performance. Job satisfaction is an organizational concept that allows explaining why a person performs satisfactorily and feels identified with an organization. Self Efficacy can be defined as beliefs in one s capabilities to organize and execute the courses of action required to manage prospective situations. Teachers teaching-learning beliefs can be understood as direct transmission beliefs (to communicate knowledge in a clear and structured way, to explain correct solutions, to give students clear and resolvable problems, and to ensure calm and concentration in the classroom) and constructivist beliefs (deal with students not as passive recipients but as active participants in the process of acquiring knowledge). A comparison of teachers beliefs versus their feelings of job satisfaction and self efficacy revealed that there is a modest positive correlation between them. Teachers following constructivist approach also tend to be slightly more satisfied in their jobs and have higher perception of self efficacy. 77


79 5.3 TEACHERS TEACHING-LEARNING BELIEFS VERSUS STUDENT PERFORMANCE Teachers beliefs, practices and attitudes are important for understanding and improving educational processes and student learning. They are closely linked to teachers strategies for coping with challenges in their daily professional life and to their general well-being, and they shape students learning environment and influence student motivation and achievement. A comparison of teachers beliefs and student performance show that teacher s constructivist beliefs and students scholastic performance had a low positive correlation (r=0.2) while teacher s direct transmission beliefs and student scholastic performance had a low negative correlation (r=-0.3). Classrooms where teachers follow constructivist approach comparatively tends to produce slightly better student outcomes than classrooms which follow direct transmission approach. 5.4 TEACHERS TEACHING-LEARNING BELIEFS VERSUS ACADEMIC PRESSURE A comparison of teachers teaching learning beliefs and the academic pressure felt by their students showed that there is a very slight and weak association between both. This could be due to the fact that what the teacher believes may not necessarily translate to practise in the classroom. However, classrooms where teachers follow constructivist approach tends to have slightly lower academic pressure (r=0.1) than classrooms following direct transmission approach (r=0.3). 5.5 PRINCIPAL AND TEACHER BELIEFS ON STUDENT DISCIPLINE VERSUS STUDENT PERFORMANCE As discussed in Chapter 4, 30% teachers and 40% Principals believed that strict discipline is necessary for proper teaching, teacher s control over students is a must for discipline and there can be discipline only if the students fear the teacher. They also believed that students not paying attention in class should be physically punished. A comparison was done to check if there is any relationship between teachers and principals beliefs on discipline and the students performance in the tests. Results of the comparison showed that the more the Principals and Teachers believe that strict discipline is important, the lower their student performance is likely to be. This suggest that there can be no meaningful learning in a classroom that is filled with fear, as in such classrooms the student may not be open to asking doubts, learning by discussion, etc. 78
80 5.6 CLASSROOM CLIMATE VERSUS PRINCIPAL AND TEACHER BELIEFS ON STUDENT DISCIPLINE Learning environment, also referred to as classroom climate, are the psychosocial characteristics of the classroom environment usually seen from students perspectives. These psychosocial characteristics include interpersonal relationships amongst students; relationships between students and their teacher; relationships between students and the subject being studied, methods of learning; and finally, students perceptions of the structural characteristics such as equity in the classroom. The analysis of relationship between students perception of classroom climate and principal, teacher beliefs on discipline revealed that beliefs of strict discipline (such as inculcating fear and doling out physical punishment) are negatively correlated with student s perceptions of all aspects of a classroom climate. Student s involvement and perceptions of equity had the highest negative correlation (r=-0.4 each). This suggests that when teachers believe in strict discipline approach, then they do not ask questions in class or involve the student s ideas and suggestions; nor do they encourage students to ask questions and discuss ideas in the classroom. Students in such classrooms also feel that they are not treated alike, and do not get the same attention, opportunities, help and encouragement as other students get. 5.7 CLASSROOM CLIMATE VERSUS STUDENT PERFORMANCE Student performance when correlated with student s perception of different aspects of their classroom climate, showed that all aspects such as feelings of classroom being cohesive, having teacher support, being involved, oriented on tasks, having cooperation, and being treated equitably were positively correlated with student performance. However, when students felt they carried out investigations in class/lab to provide evidence for their statements or solve problems on their own, these were found to have a negative correlation with student performance. (r=-0.2). Probably what the students consider as investigations are not robust enough to add to their learning experience substantially or the student is compartmentalising the learning from investigations with the learning from classroom. This needs to be investigated further in the classrooms. 79
 with the teachers asking questions and encouraging students to ask questions, considering students ideas and suggestions and discussing the same in classroom.")
81 Student performance is most correlated (r=0.5) with the teachers asking questions and encouraging students to ask questions, considering students ideas and suggestions and discussing the same in classroom. Similarly students performing well is correlated with (r=0.3) students feeling that that they are treated alike, and getting the same attention, opportunities, help and encouragement as other students get. 5.8 CLASSROOM CLIMATE VERSUS STUDENT VALUES AND INTERPERSONAL SKILLS If students perceive themselves to be in an equitable classroom environment that is cohesive, cooperative and makes them feel involved, teachers are supportive, there is fair degree of task orientation and investigative tasks, then, they are much more likely to also show better social attitudes, values and interpersonal skills, as can be seen from the high positive correlations below. The students who perceive a better classroom climate are more likely to say that they will not use stolen property, will report unidentified wallets to the police, will speak out for their beliefs, will feel bad about bullying others, will be kind to others, will feel sorry for injured people, will be protective towards weaker people, will be a friend to lonely people, will learn from mistakes, like to work in teams, have strategies for handling anger, not let feelings influence their behavior, have a sense of responsibility towards others and serve others, will think how their actions would affect others, and will feel comfortable even if people disagreed with them. Relationship Correlation r Overall Classroom Climate versus Student Attitude towards Citizenship 0.7 Overall Classroom Climate versus Student Attitude towards Compassion 0.5 Overall Classroom Climate versus Student Emotional Growth 0.6 Overall Classroom Climate versus Student Social Growth 0.4 Overall Classroom Climate versus Student Attitude towards Service to Others STUDENTS SELF PERCEPTION ABOUT THEIR LEARNING AND THEIR PERFORMANCE Academic self-concept is defined as an individual s perception of self-efficacy in particular academic subjects (Brookover and Lezotte, 1979; Bong & Skaalvik, 2003; DiPerna & Elliott, 1999). Academic self-concept correlates strongly with student academic achievement (Marsh, 2007 review of research). Questions to measure students academic self-concept pertaining to the subjects being tested (Maths, English, Science/Environmental Science and Social Studies) were included in the student questionnaire. The analysis shows that Students perception of their own scholastic abilities seems to become more unrealistic as they grow older. Class 4 and 6 students had a more realistic picture of their own abilities than students in class 8. Maths class 6 students perception about their abilities and their actual performance had a higher match. There was almost no correlation between self-perception and test scores in class STUDENTS SELF PERCEPTION ABOUT THEIR LEARNING AND THEIR PERFORMANCE VERSUS ACADEMIC PRESSURE Learning and memory can be affected by stress. Although an optimal level of stress can enhance learning ability (Kaplan & Sadock, 2000), too much stress can cause physical and mental health problems (Niemi & Vainiomaki, 1999), reduce students self esteem (Linn & Zeppa, 1984; Silver & Glicken, 1990) and may affect students academic achievement. 80
. However, this is not reflected in actual performance.")

82 QES also collected the information about what students believed about their learning capabilities, their actual performance and their perceptions of academic pressure. There is a moderate correlation about how students perceive their own scholastic abilities and the amount of pressure they feel (r=0.4). However, this is not reflected in actual performance. The correlation between academic pressure and performance is negative and low (r =-0.3). When students express that they are under a lot of pressure to perform academically, they also seem to display a HIGHER degree of confidence in their scholastic abilities, but actually PERFORM POORLY in the scholastic assessment STUDENTS SELF PERCEPTION ABOUT CO-SCHOLASTIC ABILITIES AND THEIR PARTICIPATION One objective of the QES is to expand the idea of quality to include co-scholastic areas. Literature review demonstrates that co-scholastic outcomes are areas not as much researched as the scholastic outcomes are. QES collected information to check if the self concept students have about co-scholastic abilities translates into their participation in the same. The QES data shows that students perception of their own co-scholastic abilities and their participation is moderately correlated in Dance and Debates (r=0.4). There is low correlation between students perception about their sport abilities and their actual participation in sports (r=0.2) STUDENT BACKGROUND FACTORS AND THEIR PERFORMANCE Literature findings suggest that there is relationship between student background factors and student achievement. The intention is to include background variables that have been associated with student learning outcomes as found in the literature so that differences in student achievement across different school level variables can be estimated after taking into account the variation in student level background variables. This section focuses on student background information. Several categorical variables were included, few questions were asked based on likert scale and the rest of type yes/no/don t know. The description of questions with their corresponding numbers of the student questionnaire is given in below table. These questions were asked in all three classes 4, 6 and 8 in both mainstream and alternative type of school. 81
83 The table below lists the variables on which information was collected: Sr. No. Variable collected Through Student Background Questionnaire Item No. 1 Gender of Student OMR 2 Student s age OMR 3 Mother s education SQ1 4 Father s education SQ2 5 Mother s Occupation SQ3 6 Father s Occupation SQ4 7 Whether Student talks about problems they had at school at home. SQ5 8 How often do they talk about things they studied in school with someone in their family? 9 Time spent on Homework. SQ7 10 Getting Mother s help in homework. SQ8 11 Getting Father s help in homework. SQ9 12 Number of Books available for them at home. SQ10 13 Types of books students like to read. SQ11 14 Time spent on reading books other than textbooks. SQ12 15 Getting daily news paper at home. SQ13 16 How frequently students read newspaper. SQ14 17 How often their parents read newspaper and storybook for them. SQ15 18 Availability of computer at home. SQ16 19 Availability of internet connection at home. SQ17 20 Student familiarity with using internet. SQ18 Data Analysis: Student assessment and questionnaire data sets were merged with teacher s and principal s data collected from respective questionnaires. The data preparation and analysis followed the steps as described below: SQ6 1. The data collected on background variables of Schools, Principal, Teachers and Students were entered into a database. 2. The databases were cleaned. In the process duplicate cases, new categories and wrong codes were detected and corrected according to specific situations. 3. Then, the databases containing the student performance, student background data, School data, Principal data and the teacher data for the student were merged. 4. The performance score of student was compared according to different characteristics of the students, schools, principals and teachers; several descriptive statistics (frequency, mean, standard deviation) and inferential statistics t-test, ANOVA and Tukey HSD, crossed and compare means were applied to measure statistical significance. 5. The most relevant variables theoretically and statistically were further included in multiple regression analysis to evaluate possible relations among inputs (School, Principal, Teacher, Student perceptions, Student background) with and outcomes (student performance). Results: Comparison of means, ANOVA, Tukey s HSD, t-test to test different hypotheses were carried out based on total scores in English, Maths, Science and Social Studies. The following relationships are found statistically significant between student performance and student background. 82


84 Homework: If parents helped children in homework, student scores were lower for all the subjects. It may mean that participation of parents is higher when children have difficulties with subjects or that children are not able to think for themselves. Homework seems to improve the student performance if it takes up to two hours. After that, the more the time spent on homework, the lower the student performance. Sharing problem at home and talking with parents: Students who talk with their parents about their problems at school obtained slightly higher scores than their peers who do not talk about the problems faced in school at home. Students who talk with their parents about studies not every day but more than once a week performed better than students who talk once a week or not at all. Students who talk with their parents every day performed lower than children that talk more than once a week This could also indicate that students who talk everyday about studies with their parents may be getting spoon-fed and do not have independent ownership for their performance. 83


85 Reading Habit: Students who reported having higher number of books at home scored higher compared to students who have less number of books at home. Reading material other than books every day also contributes to student performance. Students who reported not having the habit of reading material other than textbooks achieved significantly the lowest scores in all the subjects. Resources at home: Students who mentioned having computer and internet at home performed significantly better than students who didn t have these facilities at home. Familiarity in using internet also was associated with higher scoring students in all the subjects. REGRESSION ANALYSIS Further investigations were carried out to check if any of the student, school, head-teacher or teacher factors could be used to predict the performance of students. This was done by carrying out multiple linear regression analysis. Regression analysis offers a tool to analyze the percentage of variance in scores affected by these variables. In addition, regression analysis shows the combined effect of all the variables on the scores. Table below shows the results of multiple regressions on the score. PRINCIPAL BACKGROUND List of Independent Variables Language Maths Science 1. Gender (Male) Age * Highest teacher training degree Work experience as a teacher * Years of experience as a principal at school * Years of experience as a principal 2.79** 3.83*** Received training related to role as principal in the last 12 months * Time spent on teaching students in a class per year.25* Time spend on teaching and learning (academic or regular classes) per week 10. Perception on leadership/management approach Instructional leadership 15.17** 22.54*** 10.96* Administrative leadership * ; 11. Perception of school climate and self efficacy 3 Self-efficacy *** Trusting and collaborative climate * ** Belief about teaching learning 3 Direct transmission * 4.9 Constructivism * *** * TEACHER BACKGROUND 13. Age **
86 14. Educational qualification Bachelor s degree Post graduate diploma Training degree of teachers 4 Diploma in Education/PTC Bachelor s in education Masters in education ** Frequency of minutes usually assign for homework by teacher 5 Between minutes * -7.00* Between minutes -8.82* * * Between 61 to 90 minutes * Years of experience as a teacher in the current school Years of experience as a teacher ** Perception of school climate and self efficacy 3 Self-efficacy Trusting and collaborative climate Perception on leadership/management approach 3 Instructional leadership -6.56** -7.31*** -6.86** 21. Belief about teaching learning and discipline 3 Direct transmission * Constructivism 7.32* 7.74* 0.49 Discipline Teachers Practices 3 Structuring practices Student-oriented practices * -0.3 Enhanced activities STUDENT BACKGROUND 23. Mother's education 6 Graduate Master's degree Ph.D Other Father s education 6 Graduate * Master's degree 4.28** * Ph.D Other Father's occupation Own business Employee in private company 2.90* * Employee in government/public sector * 2.95* House hold Sharing problem in school at home * * 27. Frequency of talking about things studied in the school with someone in the family 7 Once a week * More than once a week but not Every day Every day * Time spent on homework 8 30 minutes to 2 hours per day * 1.73 More than 2 hours but less than 4 hours per day More than 4 hours per day *
87 29. Getting Mother help in homework Getting Father help in homework * -2.65* No of books available for reading at home for student Between 1 to Between 11 to Between 21 to More than Time spent on reading material other than text books 9 Less than 30 minutes per day * Between 30 to 60 minutes per day * More than 60 minutes per day 5.02** 3.81* 4.13* 33. Frequency of student reading newspapers 7 Once a week More than once a week but not everyday Everyday Frequency of parents reading newspapers and story books for students 7 Once a week More than once a week but not everyday * -3.28* Every day -4.46*** -2.96* -4.55** 35. Availability of computer for student use at home * Availability of internet at home Frequency of student participation in activities related to sports in school 7 Only at times Once a week More than once a week Frequency of Student participation in activities related to music in school 7 Only at times Once a week * More than once a week Frequency of student participation in activities related to art and craft in school 7 Less than once a week * 0.78 Once a week More than once a week Frequency of student participation in activities related to dance in school 7 Only at times less than once a week * -2.63* Once a week -2.85* More than once a week Frequency of student participation in activities related to dramatics in school 7 Only at times Once a week More than once a week Frequency of student participate in activities related to debates/elocution in school 7 Only at times Once a week More than once a week R Square Note: ***p<.001, **p<.005, *p<.05 Reference Category: 1=Female; 2 =No; 3 = Scaled variable(i.e. average of items consisted); 4 =No teacher training; 5 = Fewer than 15 minutes; 6 = Less than X; 7 =Never; 8 = Less than 30 minutes per day; 9 =Not read at all. 86
88 Key Findings: Regression analysis revealed the following factors as having a relationship with student performance: 1. Principal beliefs in constructivism actually were associated with lower performance in all subjects: Maths ( points), Language ( points), and Science ( points) while Teacher beliefs in constructivism were associated with higher performance in Language (7.32 points) and Maths (7.74 points) respectively. 2. When Principals reported higher feelings of self efficacy such as making a difference, managing successfully, making progress even with unmotivated staff, significant increase was observed in Maths performance (30.44 points). 3. For schools, where the Principals were found to have a higher instructional leadership, performance of students was found to be higher in Language (15.17 points), Maths (22.54 points) and Science (10.96 points). 4. Students of Maths teachers who had a post graduate degree in education performed higher (28.09 points). 5. Students performed significantly better in all the subjects Language (5.02 points), Maths (3.81 points), Science (4.13 points) when they spend more than 60 minutes per day on reading material other than textbooks compared to those who don t read at all, or spend less than 30 minutes, or spends between minutes per day in reading other material than textbooks. 6. Students whose parents read out newspaper and story books for them every day performed less in all subjects - Language (-4.46 points), Maths (-2.96points), Science (-4.55 points). Discussion: Educational quality is a result of multiple factors interacting together. QES looked into school environment and facilities, management approach, school autonomy, processes followed in school, provision of professional development program for principal and teachers, leadership quality of principal, school and classroom climate, democratic environment, principal and teacher perceptions on job satisfaction and self efficacy, beliefs about teaching, learning and discipline, classroom practices, principal, teachers and student family background such as age, gender, teaching experience in the same school or overall related to role, academic qualification, teacher training qualification, parents education, occupation, getting help for homework, number of books other than text books at home, reading habit, getting newspapers at home, availability of computer, internet at home, students familiarity with using internet, time spent on homework and on reading material other than text book, sharing school problems at home, student participation in co scholastic activities, etc. The regression model revealed that the percentage of score variance 5 explained by these variables is reasonably good with 41.4% for English, 34.2% for Maths, 29.6% for Science. Constructivist perspectives on learning and teaching are increasingly influential across the world today. These views are grounded in the research of Piaget, Vygotsky, the Gestalt psychologists, Fredric Bartlett, and Bruner as well as the Progressive educational philosophy of Dewey. Teachers following constructivist beliefs ensure that students are given the opportunity through specific activities to construct their knowledge and develop portable higher order skills such as critical thinking, reasoning and application of concepts. Research may not always provide fool proof methods on how to teach, however it can provide directions on which instructional practices are 5 Score variance explains the extent to which the variation in student scores can be explained by the variables considered in the regression model. 87
89 associated with higher student achievement. In QES, while examining beliefs related to teaching and learning, it was noticed that when teachers believed more in constructivism, their students seemed to perform significantly better in Language and Maths (by 7.32 points and 7.74 points respectively).this could be because constructivist beliefs may have enabled the teachers to plan for activities that were clearly linked to a learning goal/unit which also facilitated the students to construct meaning and knowledge based on these. It is also important to note that Principals beliefs on constructivism actually were associated with lower student performance in Maths ( points), Language ( points), and Science ( points). It is possible that Principals beliefs may not really get translated to what happens in classrooms handled by teachers. Also the activities organised by Principals may remain as an activity carried out for the sake of doing activities and the students experience in the activity may not be linked by the teacher to a learning goal. Sweller (1988) found evidence that unnecessary search based activities distracts young learners when their attention should be focussed on understanding. Stephen E. Anderson (2011), Goddard, R. D., Hoy, W. K., & Woolfolk Hoy, A. (2004), Jeff Walker (2011) observed that Principals feelings of self-efficacy were related to the effectiveness of teaching and learning in the school environment. According to social cognitive theory, self-efficacy is a personal factor (P) that can have significant effect upon humans. Self-efficacy beliefs influence the courses of action people pursue such as effort exerted, perseverance in overcoming obstacles or failures, resilience to adversity, the extent to which thoughts are self-aiding or self-hindering when coping with environmental demands, and ultimately the level of accomplishments (Bandura, 1997). Self-efficacy is, therefore, an important construct useful for understanding a broad spectrum of human behaviour in various social contexts. High self-efficacy for a task with positive outcome expectancy is expected to facilitate productive engagement. In QES, when Principals reported higher feelings of self efficacy such as making a difference, managing successfully, making progress even with unmotivated staff, significant increase was observed in students Maths performance (30.44 points). Direct and indirect relationship between Principal s leadership in school and student achievement has been established in several research studies. Principal s instructional leadership has been identified as a major factor contributing to higher student achievement in schools. Hallinger et al. (1983) identified the three functions of instructional leaders as defining the school s mission, managing curriculum and instruction and promoting a positive school climate. QES results showed that when Principals were found to follow a higher instructional leadership, the performance of their students were higher in Language (15.17 points), Maths (22.54 points) and Science (10.96 points). In line with findings in both primary and secondary research studies based on factors influencing student performance and teachers educational training degree, QES also observed that students of Maths teachers who had a post graduate degree in education performed higher (28.09 points). Independent reading is the reading students choose to do on their own. It reflects the reader s personal choice of the material to be read as well as the time and place to read it. Independent reading is done for information or for pleasure. The common sense notion that students who do a substantial amount of voluntary reading demonstrate a positive attitude toward reading is upheld in both qualitative and quantitative research (Long and Henderson 1973; Greaney 1980; Hepler and Hickman 1982; Greaney and Hegarty 1987; Tunnell and Jacobs, 1989; Reutzel and Hollingsworth 1991; Shapiro and White 1991; Mathewson 1994; Barbieri 1995; Short 1995). Students reading achievement has been shown to correlate with success in school and the amount of independent reading they do (Greaney 1980; Anderson, Fielding and Wilson 1988). This affirms the predictability of a success cycle: we become more proficient at what we practice (Cullinan 1992). The amount of free reading done outside of school has consistently been found to relate to growth in vocabulary, reading comprehension, verbal fluency, and general information (Anderson, Wilson, and Fielding 1988; Greaney 1980; Guthrie and Greaney 1991; Taylor, Frye, and Maruyama 1990). Students who read independently become better readers, score higher on achievement tests in 88
90 all subject areas, and have greater content knowledge than those who do not (Krashen 1993; Cunningham and Stanovich 1991; Stanovich and Cunningham 1993). In a previous large scale Student Learning study 6 with more than 100,000 Indian students, it was found that the students who reported reading material other than textbooks at home scored higher in Maths and Language than students who reported no such reading at all. In QES, it was noticed that students performed significantly better in all the subjects (Language: 5.02 points; Maths: 3.81 points, and Science: 4.13 points) when they spend more than 60 minutes per day on reading material other than textbooks. QES, in sync with the known research findings on independent reading also found that students, whose parents read out newspaper and story books for them every day performed less in all subjects - Language (-4.46 points), Maths (-2.96points), Science (-4.55 points). It is possible that when parents continue to read for the children who are not very young (these are students in classes 4 and above), they do not transfer the ownership for reading independently to students which may be required for the students to effectively build language acquisition by themselves. 6 Student Learning Study (2009) was carried out by Educational Initiatives in across 19 states of India for Government schools. The study covered about 1 lac students in Classes 4, 6 and 8. 89
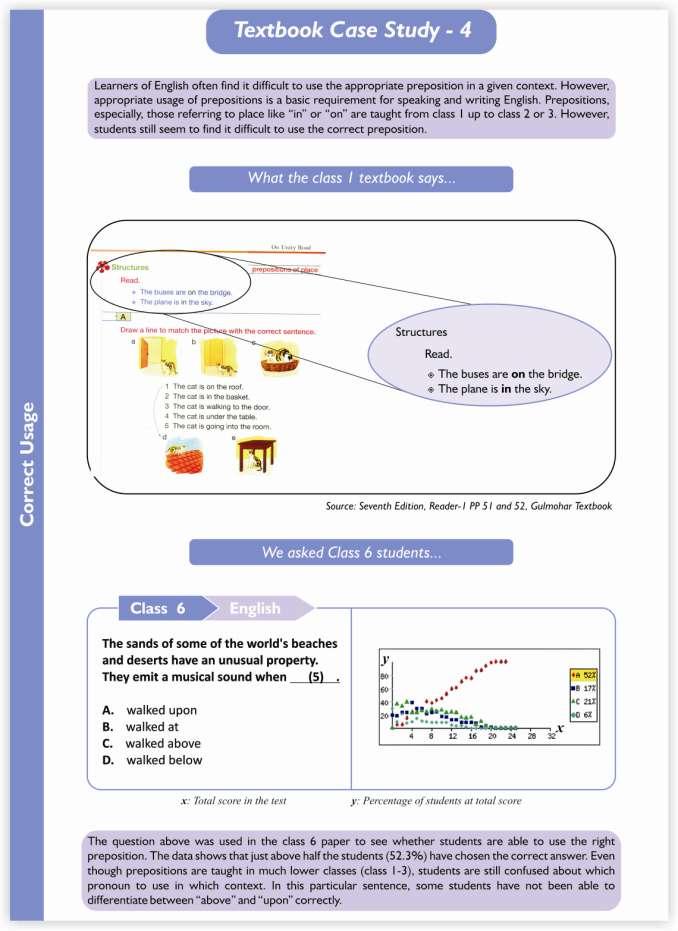
91 90
California Professional Standards for Education Leaders (CPSELs)
") Standard 1 STANDARD 1: DEVELOPMENT AND IMPLEMENTATION OF A SHARED VISION Education leaders facilitate the development and implementation of a shared vision of learning and growth of all students. Element
Standard 1 STANDARD 1: DEVELOPMENT AND IMPLEMENTATION OF A SHARED VISION Education leaders facilitate the development and implementation of a shared vision of learning and growth of all students. Element
Greek Teachers Attitudes toward the Inclusion of Students with Special Educational Needs
 American Journal of Educational Research, 2014, Vol. 2, No. 4, 208-218 Available online at http://pubs.sciepub.com/education/2/4/6 Science and Education Publishing DOI:10.12691/education-2-4-6 Greek Teachers
Carolina Course Evaluation Item Bank Last Revised Fall 2009
 Carolina Course Evaluation Item Bank Last Revised Fall 2009 Items Appearing on the Standard Carolina Course Evaluation Instrument Core Items Instructor and Course Characteristics Results are intended for
Educational system gaps in Romania. Roberta Mihaela Stanef *, Alina Magdalena Manole
 Available online at www.sciencedirect.com ScienceDirect Procedia - Social and Behavioral Scien ce s 93 ( 2013 ) 794 798 3rd World Conference on Learning, Teaching and Educational Leadership (WCLTA-2012)
Introduction to the HFLE course
 Part 1 All about teaching HFLE 1 Introduction to the HFLE course Background The Macmillan HFLE course addresses the needs of lower secondary students and teachers for life-skills based materials to help
EXECUTIVE SUMMARY. TIMSS 1999 International Science Report
 EXECUTIVE SUMMARY TIMSS 1999 International Science Report S S Executive Summary In 1999, the Third International Mathematics and Science Study (timss) was replicated at the eighth grade. Involving 41 countries
Guatemala: Teacher-Training Centers of the Salesians
 Guatemala: Teacher-Training Centers of the Salesians Ex-post evaluation OECD sector Basic education / 11220 BMZ project ID 1995 66 621 Project-executing agency Consultant Asociación Salesiana de Don Bosco
STUDENT PERCEPTION SURVEYS ACTIONABLE STUDENT FEEDBACK PROMOTING EXCELLENCE IN TEACHING AND LEARNING
 1 STUDENT PERCEPTION SURVEYS ACTIONABLE STUDENT FEEDBACK PROMOTING EXCELLENCE IN TEACHING AND LEARNING Presentation to STLE Grantees: December 20, 2013 Information Recorded on: December 26, 2013 Please
UNESCO Bangkok Asia-Pacific Programme of Education for All. Embracing Diversity: Toolkit for Creating Inclusive Learning-Friendly Environments
 UNESCO Bangkok Asia-Pacific Programme of Education for All Embracing Diversity: Toolkit for Creating Inclusive Learning-Friendly Environments UNESCO / O. Saltbones Introduction... Education systems must
OPAC and User Perception in Law University Libraries in the Karnataka: A Study
 ISSN 2229-5984 (P) 29-5576 (e) OPAC and User Perception in Law University Libraries in the Karnataka: A Study Devendra* and Khaiser Nikam** To Cite: Devendra & Nikam, K. (20). OPAC and user perception
KENTUCKY FRAMEWORK FOR TEACHING
 KENTUCKY FRAMEWORK FOR TEACHING With Specialist Frameworks for Other Professionals To be used for the pilot of the Other Professional Growth and Effectiveness System ONLY! School Library Media Specialists
BASIC EDUCATION IN GHANA IN THE POST-REFORM PERIOD
 BASIC EDUCATION IN GHANA IN THE POST-REFORM PERIOD By Abena D. Oduro Centre for Policy Analysis Accra November, 2000 Please do not Quote, Comments Welcome. ABSTRACT This paper reviews the first stage of
Politics and Society Curriculum Specification
 Leaving Certificate Politics and Society Curriculum Specification Ordinary and Higher Level 1 September 2015 2 Contents Senior cycle 5 The experience of senior cycle 6 Politics and Society 9 Introduction
Higher education is becoming a major driver of economic competitiveness
 Executive Summary Higher education is becoming a major driver of economic competitiveness in an increasingly knowledge-driven global economy. The imperative for countries to improve employment skills calls
How we look into complaints What happens when we investigate
 How we look into complaints What happens when we investigate We make final decisions about complaints that have not been resolved by the NHS in England, UK government departments and some other UK public
SASKATCHEWAN MINISTRY OF ADVANCED EDUCATION
 SASKATCHEWAN MINISTRY OF ADVANCED EDUCATION Report March 2017 Report compiled by Insightrix Research Inc. 1 3223 Millar Ave. Saskatoon, Saskatchewan T: 1-866-888-5640 F: 1-306-384-5655 Table of Contents
Lincoln School Kathmandu, Nepal
 ISS Administrative Searches is pleased to announce Lincoln School Kathmandu, Nepal Seeks Elementary Principal Application Deadline: October 30, 2017 Visit the ISS Administrative Searches webpage to view
Effective Pre-school and Primary Education 3-11 Project (EPPE 3-11)
") Effective Pre-school and Primary Education 3-11 Project (EPPE 3-11) A longitudinal study funded by the DfES (2003 2008) Exploring pupils views of primary school in Year 5 Address for correspondence: EPPSE
Effective Pre-school and Primary Education 3-11 Project (EPPE 3-11) A longitudinal study funded by the DfES (2003 2008) Exploring pupils views of primary school in Year 5 Address for correspondence: EPPSE
CONCEPT MAPS AS A DEVICE FOR LEARNING DATABASE CONCEPTS
 CONCEPT MAPS AS A DEVICE FOR LEARNING DATABASE CONCEPTS Pirjo Moen Department of Computer Science P.O. Box 68 FI-00014 University of Helsinki pirjo.moen@cs.helsinki.fi http://www.cs.helsinki.fi/pirjo.moen
National Survey of Student Engagement
 National Survey of Student Engagement Report to the Champlain Community Authors: Michelle Miller and Ellen Zeman, Provost s Office 12/1/2007 This report supplements the formal reports provided to Champlain
Position Statements. Index of Association Position Statements
 ts Association position statements address key issues for Pre-K-12 education and describe the shared beliefs that direct united action by boards of education/conseil scolaire fransaskois and their Association.
DOES OUR EDUCATIONAL SYSTEM ENHANCE CREATIVITY AND INNOVATION AMONG GIFTED STUDENTS?
 DOES OUR EDUCATIONAL SYSTEM ENHANCE CREATIVITY AND INNOVATION AMONG GIFTED STUDENTS? M. Aichouni 1*, R. Al-Hamali, A. Al-Ghamdi, A. Al-Ghonamy, E. Al-Badawi, M. Touahmia, and N. Ait-Messaoudene 1 University
Kelli Allen. Vicki Nieter. Jeanna Scheve. Foreword by Gregory J. Kaiser
 Kelli Allen Jeanna Scheve Vicki Nieter Foreword by Gregory J. Kaiser Table of Contents Foreword........................................... 7 Introduction........................................ 9 Learning
STUDENT LEARNING ASSESSMENT REPORT
 STUDENT LEARNING ASSESSMENT REPORT PROGRAM: Sociology SUBMITTED BY: Janine DeWitt DATE: August 2016 BRIEFLY DESCRIBE WHERE AND HOW ARE DATA AND DOCUMENTS USED TO GENERATE THIS REPORT BEING STORED: The
A STUDY ON AWARENESS ABOUT BUSINESS SCHOOLS AMONG RURAL GRADUATE STUDENTS WITH REFERENCE TO COIMBATORE REGION
 A STUDY ON AWARENESS ABOUT BUSINESS SCHOOLS AMONG RURAL GRADUATE STUDENTS WITH REFERENCE TO COIMBATORE REGION S.Karthick Research Scholar, Periyar University & Faculty Department of Management studies,
What is PDE? Research Report. Paul Nichols
 What is PDE? Research Report Paul Nichols December 2013 WHAT IS PDE? 1 About Pearson Everything we do at Pearson grows out of a clear mission: to help people make progress in their lives through personalized
What Am I Getting Into?
 01-Eller.qxd 2/18/2004 7:02 PM Page 1 1 What Am I Getting Into? What lies behind us is nothing compared to what lies within us and ahead of us. Anonymous You don t invent your mission, you detect it. Victor
Assessment of Student Academic Achievement
 Assessment of Student Academic Achievement 13 Chapter Parkland s commitment to the assessment of student academic achievement and its documentation is reflected in the college s mission statement; it also
TAI TEAM ASSESSMENT INVENTORY
 TAI TEAM ASSESSMENT INVENTORY By Robin L. Elledge Steven L. Phillips, Ph.D. QUESTIONNAIRE & SCORING BOOKLET Name: Date: By Robin L. Elledge Steven L. Phillips, Ph.D. OVERVIEW The Team Assessment Inventory
Segmentation Study of Tulsa Area Higher Education Needs Ages 36+ March Prepared for: Conducted by:
 Segmentation Study of Tulsa Area Higher Education Needs Ages 36+ March 2004 * * * Prepared for: Tulsa Community College Tulsa, OK * * * Conducted by: Render, vanderslice & Associates Tulsa, Oklahoma Project
MINISTRY OF EDUCATION. This syllabus replaces previous NSSC syllabuses and will be implemented in 2010 in Grade 11
 Republic of Namibia MINISTRY OF EDUCATION LIFE SKILLS SYLLABUS GRADES AND This syllabus replaces previous NSSC syllabuses and will be implemented in 00 in Grade Ministry of Education National Institute
Engineers and Engineering Brand Monitor 2015
 Engineers and Engineering Brand Monitor 2015 Key Findings Prepared for Engineering UK By IFF Research 7 September 2015 We gratefully acknowledge the support of Pearson in delivering this study Contact
UK Institutional Research Brief: Results of the 2012 National Survey of Student Engagement: A Comparison with Carnegie Peer Institutions
 UK Institutional Research Brief: Results of the 2012 National Survey of Student Engagement: A Comparison with Carnegie Peer Institutions November 2012 The National Survey of Student Engagement (NSSE) has
Calculators in a Middle School Mathematics Classroom: Helpful or Harmful?
 University of Nebraska - Lincoln DigitalCommons@University of Nebraska - Lincoln Action Research Projects Math in the Middle Institute Partnership 7-2008 Calculators in a Middle School Mathematics Classroom:
Mapping the Assets of Your Community:
 Mapping the Assets of Your Community: A Key component for Building Local Capacity Objectives 1. To compare and contrast the needs assessment and community asset mapping approaches for addressing local
European Higher Education in a Global Setting. A Strategy for the External Dimension of the Bologna Process. 1. Introduction
 European Higher Education in a Global Setting. A Strategy for the External Dimension of the Bologna Process. 1. Introduction The Bologna Declaration (1999) sets out the objective of increasing the international
Strategic Planning for Retaining Women in Undergraduate Computing
 for Retaining Women Workbook An NCWIT Extension Services for Undergraduate Programs Resource Go to /work.extension.html or contact us at es@ncwit.org for more information. 303.735.6671 info@ncwit.org Strategic
A Pilot Study on Pearson s Interactive Science 2011 Program
 Final Report A Pilot Study on Pearson s Interactive Science 2011 Program Prepared by: Danielle DuBose, Research Associate Miriam Resendez, Senior Researcher Dr. Mariam Azin, President Submitted on August
Professional Development and Training for Young Teachers in Russia
 Professional Development and Training for Young Teachers in Russia Marina Pinskaya, Alena Ponomareva, Sergey Kosaretsky Received in February 2016 Marina Pinskaya Candidate of Sciences in Pedagogy, Lead
School Inspection in Hesse/Germany
 Hessisches Kultusministerium School Inspection in Hesse/Germany Contents 1. Introduction...2 2. School inspection as a Procedure for Quality Assurance and Quality Enhancement...2 3. The Hessian framework
STEPS TO EFFECTIVE ADVOCACY
 Poverty, Conservation and Biodiversity Godber Tumushabe Executive Director/Policy Analyst Advocates Coalition for Development and Environment STEPS TO EFFECTIVE ADVOCACY UPCLG Advocacy Capacity Building
Post-intervention multi-informant survey on knowledge, attitudes and practices (KAP) on disability and inclusive education
 on disability and inclusive education") Leonard Cheshire Disability and Inclusive Development Centre University College London Promoting the provision of inclusive primary education for children with disabilities in Mashonaland, West Province,
Leonard Cheshire Disability and Inclusive Development Centre University College London Promoting the provision of inclusive primary education for children with disabilities in Mashonaland, West Province,
Principal vacancies and appointments
 Principal vacancies and appointments 2009 10 Sally Robertson New Zealand Council for Educational Research NEW ZEALAND COUNCIL FOR EDUCATIONAL RESEARCH TE RŪNANGA O AOTEAROA MŌ TE RANGAHAU I TE MĀTAURANGA
Motivation to e-learn within organizational settings: What is it and how could it be measured?
 Motivation to e-learn within organizational settings: What is it and how could it be measured? Maria Alexandra Rentroia-Bonito and Joaquim Armando Pires Jorge Departamento de Engenharia Informática Instituto
USING DRAMA IN ENGLISH LANGUAGE TEACHING CLASSROOMS TO IMPROVE COMMUNICATION SKILLS OF LEARNERS
 RESEARCH ARTICLE USING DRAMA IN ENGLISH LANGUAGE TEACHING CLASSROOMS TO IMPROVE COMMUNICATION SKILLS OF LEARNERS D.M. VEDHA PRIYA Ph. D Research Scholar, Department of English Ethiraj College for Women,
Understanding Co operatives Through Research
 Understanding Co operatives Through Research Dr. Lou Hammond Ketilson Chair, Committee on Co operative Research International Co operative Alliance Presented to the United Nations Expert Group Meeting
IS FINANCIAL LITERACY IMPROVED BY PARTICIPATING IN A STOCK MARKET GAME?
 21 JOURNAL FOR ECONOMIC EDUCATORS, 10(1), SUMMER 2010 IS FINANCIAL LITERACY IMPROVED BY PARTICIPATING IN A STOCK MARKET GAME? Cynthia Harter and John F.R. Harter 1 Abstract This study investigates the
No educational system is better than its teachers
 No educational system is better than its teachers Investment in quality educators has a very high multiplier effect: every good teacher benefits an entire class, year after year, and when those bettereducated
Observing Teachers: The Mathematics Pedagogy of Quebec Francophone and Anglophone Teachers
 Observing Teachers: The Mathematics Pedagogy of Quebec Francophone and Anglophone Teachers Dominic Manuel, McGill University, Canada Annie Savard, McGill University, Canada David Reid, Acadia University,
STUDENT EXPERIENCE a focus group guide
 STUDENT EXPERIENCE a focus group guide September 16, 2016 Overview Participation Thank you for agreeing to participate in an Energizing Eyes High focus group session. We have received research ethics approval
Second Step Suite and the Whole School, Whole Community, Whole Child (WSCC) Model
 Model") Second Step Suite and the Whole School, Whole Community, Whole Child (WSCC) Model suite The Second Step Suite and the WSCC model share the common goals of supporting the safety, well-being, and success
Second Step Suite and the Whole School, Whole Community, Whole Child (WSCC) Model suite The Second Step Suite and the WSCC model share the common goals of supporting the safety, well-being, and success
Office of Institutional Effectiveness 2012 NATIONAL SURVEY OF STUDENT ENGAGEMENT (NSSE) DIVERSITY ANALYSIS BY CLASS LEVEL AND GENDER VISION
 DIVERSITY ANALYSIS BY CLASS LEVEL AND GENDER VISION") Office of Institutional Effectiveness 2012 NATIONAL SURVEY OF STUDENT ENGAGEMENT (NSSE) DIVERSITY ANALYSIS BY CLASS LEVEL AND GENDER VISION We seek to become recognized for providing bright and curious
Office of Institutional Effectiveness 2012 NATIONAL SURVEY OF STUDENT ENGAGEMENT (NSSE) DIVERSITY ANALYSIS BY CLASS LEVEL AND GENDER VISION We seek to become recognized for providing bright and curious
Educational Attainment
 A Demographic and Socio-Economic Profile of Allen County, Indiana based on the 2010 Census and the American Community Survey Educational Attainment A Review of Census Data Related to the Educational Attainment
ROLE OF TEACHERS IN CURRICULUM DEVELOPMENT FOR TEACHER EDUCATION
 ROLE OF TEACHERS IN CURRICULUM DEVELOPMENT FOR TEACHER EDUCATION Presented by Ms. Megha Sahebrao Jadhav 1 Dr.(Ms) Pratibha S Patankar 2 Golden Jubilee DRF, Assistant Professor, Department of Education,
A Survey of Authentic Assessment in the Teaching of Social Sciences
 International Journal of Education and nce www.ijessnet.com Vol. 2 No. 6; June 2015 A Survey of Authentic Assessment in the Teaching of nces Ruby Ann L. Ayo, Ph.D. Associate Professor III Bicol University
NATIONAL SURVEY OF STUDENT ENGAGEMENT
 NATIONAL SURVEY OF STUDENT ENGAGEMENT (NSSE 2004 Results) Perspectives from USM First-Year and Senior Students Office of Academic Assessment University of Southern Maine Portland Campus 780-4383 Fall 2004
ABET Criteria for Accrediting Computer Science Programs
 ABET Criteria for Accrediting Computer Science Programs Mapped to 2008 NSSE Survey Questions First Edition, June 2008 Introduction and Rationale for Using NSSE in ABET Accreditation One of the most common
Setting the Scene and Getting Inspired
 Setting the Scene and Getting Inspired Inclusive Education and Schools Sheldon Shaeffer Save the Children Learning Event Inclusive Education: From Theoretical Concept to Effective Practice Bangkok, Thailand
Mahatma Gandhi Institute of Education for Peace and Sustainable Development. A joint initiative by UNESCO and the Government of India
 Mahatma Gandhi Institute of Education for Peace and Sustainable Development A joint initiative by UNESCO and the Government of India UNESCO and the Government of India in a major new partnership The United
The Second Year of SEC Vocational Subjects. MATSEC Support Unit April 2016 University of Malta
 The Second Year of SEC Vocational Subjects MATSEC Support Unit April 216 University of Malta 1 Table of Contents Executive Summary... Introduction... 8 General Information... 8 Methodology... 8 Survey
How to make an A in Physics 101/102. Submitted by students who earned an A in PHYS 101 and PHYS 102.
 How to make an A in Physics 101/102. Submitted by students who earned an A in PHYS 101 and PHYS 102. PHYS 102 (Spring 2015) Don t just study the material the day before the test know the material well
PUBLIC CASE REPORT Use of the GeoGebra software at upper secondary school
 PUBLIC CASE REPORT Use of the GeoGebra software at upper secondary school Linked to the pedagogical activity: Use of the GeoGebra software at upper secondary school Written by: Philippe Leclère, Cyrille
Simulation in Maritime Education and Training
 Simulation in Maritime Education and Training Shahrokh Khodayari Master Mariner - MSc Nautical Sciences Maritime Accident Investigator - Maritime Human Elements Analyst Maritime Management Systems Lead
Case study Norway case 1
 Case study Norway case 1 School : B (primary school) Theme: Science microorganisms Dates of lessons: March 26-27 th 2015 Age of students: 10-11 (grade 5) Data sources: Pre- and post-interview with 1 teacher
Leo de Beurs. Pukeoware School. Sabbatical Leave Term 2
 Sabbatical Report Leo de Beurs Pukeoware School Sabbatical Leave 2010 Term 2 My name is Leo de Beurs and I am currently the Principal of Pukeoware School, a position I have held for 14 years, previous
TALKING POINTS ALABAMA COLLEGE AND CAREER READY STANDARDS/COMMON CORE
 TALKING POINTS ALABAMA COLLEGE AND CAREER READY STANDARDS/COMMON CORE The Alabama State Department of Education and the Alabama State School Board have a plan to meet that goal beginning with the implementation
NATIONAL SURVEY OF STUDENT ENGAGEMENT (NSSE)
") NATIONAL SURVEY OF STUDENT ENGAGEMENT (NSSE) 2008 H. Craig Petersen Director, Analysis, Assessment, and Accreditation Utah State University Logan, Utah AUGUST, 2008 TABLE OF CONTENTS Executive Summary...1
NATIONAL SURVEY OF STUDENT ENGAGEMENT (NSSE) 2008 H. Craig Petersen Director, Analysis, Assessment, and Accreditation Utah State University Logan, Utah AUGUST, 2008 TABLE OF CONTENTS Executive Summary...1
Audit Of Teaching Assignments. An Integrated Analysis of Teacher Educational Background and Courses Taught October 2007
 Audit Of Teaching Assignments October 2007 Audit Of Teaching Assignments Audit of Teaching Assignments Crown copyright, Province of Nova Scotia, 2007 The contents of this publication may be reproduced
Practices Worthy of Attention Step Up to High School Chicago Public Schools Chicago, Illinois
 Step Up to High School Chicago Public Schools Chicago, Illinois Summary of the Practice. Step Up to High School is a four-week transitional summer program for incoming ninth-graders in Chicago Public Schools.
UPPER SECONDARY CURRICULUM OPTIONS AND LABOR MARKET PERFORMANCE: EVIDENCE FROM A GRADUATES SURVEY IN GREECE
 UPPER SECONDARY CURRICULUM OPTIONS AND LABOR MARKET PERFORMANCE: EVIDENCE FROM A GRADUATES SURVEY IN GREECE Stamatis Paleocrassas, Panagiotis Rousseas, Vassilia Vretakou Pedagogical Institute, Athens Abstract
A. What is research? B. Types of research
 A. What is research? Research = the process of finding solutions to a problem after a thorough study and analysis (Sekaran, 2006). Research = systematic inquiry that provides information to guide decision
Systematic Assessment and Monitoring leading to Improving Quality of Education
 Systematic Assessment and Monitoring leading to Improving Quality of Education Abstract This study was aimed at assessment of quality of teaching-learning process and impact of interventions on actual
Improving the impact of development projects in Sub-Saharan Africa through increased UK/Brazil cooperation and partnerships Held in Brasilia
 Image: Brett Jordan Report Improving the impact of development projects in Sub-Saharan Africa through increased UK/Brazil cooperation and partnerships Thursday 17 Friday 18 November 2016 WP1492 Held in
ACCREDITATION STANDARDS
 ACCREDITATION STANDARDS Description of the Profession Interpretation is the art and science of receiving a message from one language and rendering it into another. It involves the appropriate transfer
Developing Effective Teachers of Mathematics: Factors Contributing to Development in Mathematics Education for Primary School Teachers
 Developing Effective Teachers of Mathematics: Factors Contributing to Development in Mathematics Education for Primary School Teachers Jean Carroll Victoria University jean.carroll@vu.edu.au In response
What Is The National Survey Of Student Engagement (NSSE)?
?") National Survey of Student Engagement (NSSE) 2000 Results for Montclair State University What Is The National Survey Of Student Engagement (NSSE)? US News and World Reports Best College Survey is due next
National Survey of Student Engagement (NSSE) 2000 Results for Montclair State University What Is The National Survey Of Student Engagement (NSSE)? US News and World Reports Best College Survey is due next
Guidelines for Writing an Internship Report
 Guidelines for Writing an Internship Report Master of Commerce (MCOM) Program Bahauddin Zakariya University, Multan Table of Contents Table of Contents... 2 1. Introduction.... 3 2. The Required Components
Swinburne University of Technology 2020 Plan
 Swinburne University of Technology 2020 Plan science technology innovation Swinburne University of Technology 2020 Plan Embracing change This is an exciting time for Swinburne. Tertiary education is undergoing
VIEW: An Assessment of Problem Solving Style
 1 VIEW: An Assessment of Problem Solving Style Edwin C. Selby, Donald J. Treffinger, Scott G. Isaksen, and Kenneth Lauer This document is a working paper, the purposes of which are to describe the three
Program Change Proposal:
 Program Change Proposal: Provided to Faculty in the following affected units: Department of Management Department of Marketing School of Allied Health 1 Department of Kinesiology 2 Department of Animal
Initial teacher training in vocational subjects
 Initial teacher training in vocational subjects This report looks at the quality of initial teacher training in vocational subjects. Based on visits to the 14 providers that undertake this training, it
CREATING SAFE AND INCLUSIVE SCHOOLS: A FRAMEWORK FOR SELF-ASSESSMENT. Created by: Great Lakes Equity Center
 CREATING SAFE AND INCLUSIVE SCHOOLS: A FRAMEWORK FOR SELF-ASSESSMENT Created by: Great Lakes Equity Center May 2015 About Great Lakes Equity Center Great Lakes Equity Center is one of ten regional Equity
American Journal of Business Education October 2009 Volume 2, Number 7
 Factors Affecting Students Grades In Principles Of Economics Orhan Kara, West Chester University, USA Fathollah Bagheri, University of North Dakota, USA Thomas Tolin, West Chester University, USA ABSTRACT
Going back to our roots: disciplinary approaches to pedagogy and pedagogic research
 Going back to our roots: disciplinary approaches to pedagogy and pedagogic research Dr. Elizabeth Cleaver Director of Learning Enhancement and Academic Practice University of Hull Curriculum 2016+ PgCert
Trends & Issues Report
 Trends & Issues Report prepared by David Piercy & Marilyn Clotz Key Enrollment & Demographic Trends Options Identified by the Eight Focus Groups General Themes 4J Eugene School District 4J Eugene, Oregon
INTRODUCTION TO TEACHING GUIDE
 GCSE REFORM INTRODUCTION TO TEACHING GUIDE February 2015 GCSE (9 1) History B: The Schools History Project Oxford Cambridge and RSA GCSE (9 1) HISTORY B Background GCSE History is being redeveloped for
Monitoring Metacognitive abilities in children: A comparison of children between the ages of 5 to 7 years and 8 to 11 years
 Monitoring Metacognitive abilities in children: A comparison of children between the ages of 5 to 7 years and 8 to 11 years Abstract Takang K. Tabe Department of Educational Psychology, University of Buea
Education in Armenia. Mher Melik-Baxshian I. INTRODUCTION
 Education in Armenia Mher Melik-Baxshian I. INTRODUCTION Education has always received priority in Armenia a country that has a history of literacy going back 1,600 years. From the very beginning the school
Alpha provides an overall measure of the internal reliability of the test. The Coefficient Alphas for the STEP are:
 Every individual is unique. From the way we look to how we behave, speak, and act, we all do it differently. We also have our own unique methods of learning. Once those methods are identified, it can make
A non-profit educational institution dedicated to making the world a better place to live
 NAPOLEON HILL FOUNDATION A non-profit educational institution dedicated to making the world a better place to live YOUR SUCCESS PROFILE QUESTIONNAIRE You must answer these 75 questions honestly if you
UNIVERSITY OF DAR-ES-SALAAM OFFICE OF VICE CHANCELLOR-ACADEMIC DIRECTORATE OF POSTGRADUATE STUDIUES
 UNIVERSITY OF DAR-ES-SALAAM OFFICE OF VICE CHANCELLOR-ACADEMIC DIRECTORATE OF POSTGRADUATE STUDIUES GUIDELINES AND REGULATIONS FOR PLAGIARISM AND DEPLOYMENT OF POSTGRADUATE STUDENTS FOR TEACHING OR TECHNICAL
EXECUTIVE SUMMARY. TIMSS 1999 International Mathematics Report
 EXECUTIVE SUMMARY TIMSS 1999 International Mathematics Report S S Executive Summary In 1999, the Third International Mathematics and Science Study (timss) was replicated at the eighth grade. Involving
THE CONSENSUS PROCESS
 THE CONSENSUS PROCESS OR CREATIVE JOINT PROBLEM SOLVING Consensus: Collective opinion or agreement, harmony, cooperation, sympathy and group solidarity. Advantages of Using a Consensus Process 1. Education
Integration of ICT in Teaching and Learning
 Integration of ICT in Teaching and Learning Dr. Pooja Malhotra Assistant Professor, Dept of Commerce, Dyal Singh College, Karnal, India Email: pkwatra@gmail.com. INTRODUCTION 2 st century is an era of
Research Update. Educational Migration and Non-return in Northern Ireland May 2008
 Research Update Educational Migration and Non-return in Northern Ireland May 2008 The Equality Commission for Northern Ireland (hereafter the Commission ) in 2007 contracted the Employment Research Institute
FACULTY OF PSYCHOLOGY
 FACULTY OF PSYCHOLOGY STRATEGY 2016 2022 // UNIVERSITY OF BERGEN STRATEGY 2016 2022 FACULTY OF PSYCHOLOGY 3 STRATEGY 2016 2022 (Adopted by the Faculty Board on 15 June 2016) The Faculty of Psychology has
Social Emotional Learning in High School: How Three Urban High Schools Engage, Educate, and Empower Youth
 SCOPE ~ Executive Summary Social Emotional Learning in High School: How Three Urban High Schools Engage, Educate, and Empower Youth By MarYam G. Hamedani and Linda Darling-Hammond About This Series Findings
THE UNITED REPUBLIC OF TANZANIA MINISTRY OF EDUCATION, SCIENCE, TECHNOLOGY AND VOCATIONAL TRAINING CURRICULUM FOR BASIC EDUCATION STANDARD I AND II
 THE UNITED REPUBLIC OF TANZANIA MINISTRY OF EDUCATION, SCIENCE, TECHNOLOGY AND VOCATIONAL TRAINING CURRICULUM FOR BASIC EDUCATION STANDARD I AND II 2016 Ministry of Education, Science,Technology and Vocational
Multicultural Education: Perspectives and Theory. Multicultural Education by Dr. Chiu, Mei-Wen
 Multicultural Education: Perspectives and Theory Multicultural Education by Dr. Chiu, Mei-Wen Definition-1 Multicultural education is a philosophical concept built on the ideals of freedom, justice, equality,
E-Learning Using Open Source Software in African Universities
 E-Learning Using Open Source Software in African Universities Nicholas Mavengere 1, Mikko Ruohonen 1 and Paul Nleya 2 1 School of Information Sciences, University of Tampere, Finland {nicholas.mavengere,