AFRL-HE-AZ-TR Acquisition and Retention of Team Coordination in Command and-control
|
|
|
- Harriet Osborne
- 6 years ago
- Views:
Transcription

1 AFRL-HE-AZ-TR Acquisition and Retention of Team Coordination in Command and-control Nancy J. Cooke Jamie Gorman Harry Pedersen Jennifer Winner Jasmine Duran Amanda Taylor Polemnia G. Amazeen Dee H. Andrews Leah Rowe Cognitive Engineering Research Institute 5810 S Sossaman Rd. Suite 106 Mesa, AZ Boulder, CO July 2007 Final Report for March 2004 to December 2006 Approved for public release. Distribution is unlimited. Air Force Research Laboratory Human Effectiveness Directorate Warfighter Readiness Research Division
2 NOTICES This report is published in the interest of scientific and technical information exchange and its publication does not constitute the Government s approval or disapproval of its idea or findings. Using Government drawings, specifications, or other data included in this document for any purpose other than Government procurement does not in any way obligate the U.S. Government. The fact that the Government formulated or supplied the drawings, specifications, or other data does not license the holder or any other person or corporation; or convey any rights or permission to manufacture, use, or sell any patented invention that may relate to them. Qualified requestors may obtain copies of this report from the Defense Technical Information Center (DTIC) at AFRL-HE-AZ-TR HAS BEEN REVIEWED AND IS APPROVED FOR PUBLICATION IN ACCORDANCE WITH ASSIGNED DISTRIBUTION STATEMENT. //signed// DEE H. ANDREWS Lab Contract Monitor //signed// HERBERT H. BELL Technical Advisor //signed// DANIEL R. WALKER, Colonel, USAF Chief, Warfighter Readiness Research Division Air Force Research Laboratory
3 REPORT DOCUMENTATION PAGE Form Approved OMB No Public reporting burden for this collection of information is estimated to average 1 hour per response, including the time for reviewing instructions, searching existing data sources, gathering and maintaining the data needed, and completing and reviewing this collection of information. Send comments regarding this burden estimate or any other aspect of this collection of information, including suggestions for reducing this burden to Department of Defense, Washington Headquarters Services, Directorate for Information Operations and Reports ( ), 1215 Jefferson Davis Highway, Suite 1204, Arlington, VA Respondents should be aware that notwithstanding any other provision of law, no person shall be subject to any penalty for failing to comply with a collection of information if it does not display a currently valid OMB control number. PLEASE DO NOT RETURN YOUR FORM TO THE ABOVE ADDRESS. 1. REPORT DATE REPORT TYPE Final Report 4. TITLE AND SUBTITLE ACQUISITION AND RETENTION OF TEAM COORDINATION IN COMMAND-AND- CONTROL 3. DATES COVERED (From - To) to a. CONTRACT NUMBER 5b. GRANT NUMBER FA c. PROGRAM ELEMENT NUMBER 6. AUTHOR(S) 5d. PROJECT NUMBER Nancy J. Cooke, Jamie Gorman, Harry Pedersen, Jennifer Winner, Jasmine Duran, Amanda Taylor, Polemnia G. Amazeen, Dee H. Andrews, and Leah 5e. TASK NUMBER Rowe 5f. WORK UNIT NUMBER 1123AM02 7. PERFORMING ORGANIZATION NAME(S) AND ADDRESS(ES) 8. PERFORMING ORGANIZATION REPORT NUMBER Cognitive Engineering Research Institute (CERI) 5810 S. Sossaman Rd. Suite 106 Mesa, AZ SPONSORING / MONITORING AGENCY NAME(S) AND ADDRESS(ES) 10. SPONSOR/MONITOR S ACRONYM(S) Air Force Research Laboratory AFRL; AFRL/HEA Human Effectiveness Directorate Warfighter Readiness Research 11. SPONSOR/MONITOR S REPORT Division 6030 South Kent Street NUMBER(S) Mesa AZ AFRL-HE-AZ-TR DISTRIBUTION / AVAILABILITY STATEMENT Approved for public release; distribution is unlimited 13. SUPPLEMENTARY NOTES 14. ABSTRACT This project took place in the context of simulated Uninhabited Air Vehicle (UAV) command-and-control. In Experiment 1 we addressed the development of team coordination with experience and over lengthy intervals without practice in situations in which the team retains the same or different members over time. Team coordination is characterized by timely and adaptive information exchange among team members. A procedural model of team coordination was developed and used to generate a model-based metric of team coordination. This metric was then applied to track coordination development in two experiments. Results from the first experiment, showing a team performance decrement and a longer-term process benefit due to longer retention intervals or changes in team composition were used to guide the development of a dynamical systems model of the acquisition and retention of team coordination. The model was then used to generate additional predictions that were tested empirically in a second experiment. In the second experiment, coordination was trained using a rigid procedural model, cross training, or perturbations in the environment constraining coordination. Results indicated that perturbation training resulted in superior team performance across more difficult missions. The dynamical systems model, coupled with the empirical results, generated various implications for training command-and-control. These results suggest that changes to team composition and to a lesser extent, longer retention intervals, may result in temporary performance decrements, but in the long run may be beneficial for building adaptive teams. 15. SUBJECT TERMS Team training, team cognition, team composition, dynamical systems models, unmanned aerial vehicles, team situation awareness, team-level skill retention, coordination flexibility, coordination stability 16. SECURITY CLASSIFICATION OF: 17. LIMITATION OF ABSTRACT a. REPORT UNCLASSIFIED b. ABSTRACT UNCLASSIFIED 18. NUMBER OF PAGES c. THIS PAGE UNCLASSIFIED UNLIMITED a. NAME OF RESPONSIBLE PERSON Nancy J. Cooke 19b. TELEPHONE NUMBER (include area code) (480) Standard Form 298 (Rev. 8-98) Prescribed by ANSI Std. Z39.18
4 This page intentionally left blank.
5 TABLE OF CONTENTS List of Figures, iv List of Tables, vii List of Appendices, xi 1.0 EXECUTIVE SUMMARY, RESEARCH TEAM, INTRODUCTION, The Problem, Long-Range Objectives, Prior Progress Toward Long-Range Objectives, Theoretical Accomplishments Toward The Measurement of Team Cognition, Development of UAV-STE, Empirical Accomplishments, Methodological Accomplishments, Modeling Accomplishments, Publications Resulting from Previous and Current AFOSR-Supported Efforts, Publications, Presentations, Workshops and Invited Talks, Cognitive Engineering Research Institute, Transitions, Strengths and Weaknesses, Objectives of Current Effort ( ), Our Approach, PROGRESS UNDER THIS EFFORT, Background, Coordination and Models of Coordination, Dynamical Systems Modeling, Acquistion and Retention of Team Coordination Skill, Background Summary, Experiment 1: Acquisition and Retention of Team Coordination with Mixed and Intact Teams, Experiment 1: Method, Participants, Equipment and Materials, Measures, Team Performance, Team Knowledge, Team Process, Debriefing Questions, Personality Survey, Procedure, Experiment 1: Results, Demographics, Team Performance, Taskwork Knowledge, 55
6 Teamwork Knowledge, Team Process: Coordination Ratings, CAST Situation Awareness, Experiment 1: Performance Predictors, Experiment 1: Discussion, Modeling Coordination, Procedural Model, Background, Approach, Experiment 1: Coordination Results, Dynamical Systems Model, Background, Approach, Experiment 1: Dynamics Results, Experiment 2: Training Adaptive Teams, Experiment 2: Background: Theoretical Accounts of the Successful Coordination of Mixed Teams and Hypotheses, Shared Mental Models, Experiences with Task Perturbations, Procedural Learning, Hypotheses for Experiment 2, Method, Participants, Equipment and Materials, Measures, Procedure, Experiment 2: Results, Demographics, Team Performance, Taskwork Knowledge, Teamwork Knowledge, Team Process: Coordination Ratings, CAST Situation Awareness, Intrinsic Geometry Coordination Score, Dynamics, Experiment 2: Performance Predictors, Experiment 2: Discussion, Conclusions, Theoretical Contributions, Methodological Contributions, Applied Contributions, Summary, REFERENCES, ACKNOWLEDGEMENTS, GLOSSARY, APPENDICES, 171 Cooke et al. iv Team Coordination
7 List of Figures 1. A generic Input-Process-Output (I-P-O) framework. 2. Team cognition as viewed from the collective (Panel A) and holistic (Panel B) perspectives. 3. CERTT participant consoles. 4. CERTT experimenter consoles. 5. Acquisition of UAV task (team performance scores) for 11 teams in Experiment CERI Facility in Mesa, AZ. 7. Flowchart of integrated modeling and empirical effort. 8. Coordination logger interface used in Experiment Instructions to the experimenter regarding CAST roadblock timing and placement. 10. Experimenter score sheet. 11. Team performance across all Missions. 12. Retention interval by team composition interaction at Mission Post-manipulation team performance difference scores by experimental condition. 14. Average taskwork interpositional knowledge difference scores obtained in four different group conditions. 15. Average of teamwork interpositional knowledge accuracy scores differences obtained in four different group conditions. 16. Teamwork positional knowledge accuracy scores showing short-mixed teams decreasing from Session 1 to Session Average of teamwork intra-team similarity scores differences obtained in four different group conditions. 18. Average of teamwork holistic differences obtained in four different group conditions. 19. Mean coordination rating retention interval by team composition interaction at Mission 4; error bars represent the standard errors of the means. 20. Coordination rating difference scores for post-manipulation missions by team composition group.
8 21. Estimated means for three-way false alarm interaction between Mission, Team Composition, and Retention Interval; negative difference scores indicate a reduction in false alarm rate. 22. Pre-manipulation percent roadblocks overcome by Mission. 23. Number of roadblocks overcome by Retention Interval condition for the three postmanipulation Missions. 24. Procedural model (standard operating procedure) for photographing UAV ground targets. 25. Elements of the coordination logger associated with the Information (I), Negotiation (N), and Feedback (F) elements of the procedural model of coordination. 26. Graphical depiction of the intrinsic geometry coordination score. 27. Distribution of mean and log normal mean coordination scores for all Missions across all teams. 28. Persistence, antipersistence, and random walk Hurst slopes. 29. Histograms of the coordination dynamics measures. a. Short-region session 1. b. Long-region session 1 c. Stability session 1. d. Short-region session 2. e. Long-region session 2. f. Stability session Short and long (separated by inflection point) region Hurst estimates by experimental condition. 31. Coordination logger interface used in Experiment Distribution of team performance scores for all Missions. 33. Team performance across all missions. 34. Distribution of team process scores for all Missions. 35. Team process across all Missions. Cooke et al. vi Team Coordination
9 36. Team coordination ratings across Mission Histograms of rates of hits and false alarms across teams (Missions 5-9). 38. Mean time-to-overcome scores (in seconds) across teams for Missions Distribution of coordination scores for all teams, all conditions, and all Missions. 40. Logarithmic distribution of coordination Scores for all teams, all conditions and all Missions. 41. Mean coordination scores over missions one through nine (across teams and conditions). 42. Histograms of coordination dynamics measures over Sessions 1 and 2: Columns are Measures and Rows are Sessions. 43. Session 1 coordination flexibility; 95% confidence intervals are plotted at each level of binning; Dashed lines represent the random walk slope. 44. Phase-space reconstructions of cross-trained, procedural, and perturbed team coordination dynamics during training. 45. AVO empirical taskwork referent. 46. PLO empirical taskwork referent. 47. DEMPC empirical taskwork referent. 48. Team empirical taskwork referent. Cooke et al. vii Team Coordination
10 List of Tables 1. Summary of Five Previously Completed Empirical Studies Under AFOSR Support 2. Issues in the Measurement of Team Cognition 3. Points Assigned to Responses on the Teamwork Questionnaire 4. Experimental Protocol 5. Number of Targets per Mission 6. Means for Group Demographics (averaged across teams) 7. Gender Composition for High and Low Performance Groups 8. Prior Aviation Training for High and Low Performance Groups 9. Frequency of Video Game Play for High and Low Performance Groups 10. Median Split Age Groups for High and Low Performance Groups 11. Age Groups 2SD above Mean for High and Low Performance Groups 12. Distribution of High and Low Performance Teams across Age Groups 13. Means and Standard Deviations for Team Performance (Averaged across Teams within Conditions) 14. Overall Taskwork Accuracy for Knowledge Session 1 and Knowledge Session Taskwork Positional Knowledge for Knowledge Session 1 and Knowledge Session Taskwork Interpositional Knowledge for Knowledge Session 1 and Knowledge Session Taskwork Intrateam Similiarity for Knowledge Session 1 and Knowledge Session Taskwork Holistic Accuracy for Knowledge Session 1 and Knowledge Session Teamwork Overall Accuracy for Knowledge Session 1 and Knowledge Session Teamwork Positional Accuracy for Knowledge Session 1 and Knowledge Session Teamwork Interpositional Accuracy for Knowledge Session 1 and Knowledge Session Teamwork Intrateam Similarity for Knowledge Session 1 and Knowledge Session Teamwork Holistic Accuracy for Knowledge Session 1 and Knowledge Session 2
11 24. Means and Standard Deviations for Coordination Ratings (Averaged across Teams within Conditions) 25. Means and Standard Deviations for CAST Hit Rate (Averaged across Teams within Conditions) 26. Means and Standard Deviations for CAST False Alarm Rate (Averaged across Teams within Conditions) 27. Pre-manipulation Mean, Standard Deviation, and Sample Size for Number of Roadblocks Overcome by Experimental Condition 28. Post-manipulation Mean, Standard Deviation, and Sample Size for Number of Roadblocks Overcome by Experimental Condition 29. Standardized Regression Coefficients of Significant Mission-level Team Performance Predictors by Experiment 1 Session and Condition 30. Standardized Regression Coefficients of Significant Session-level Team Performance Predictors by Experiment 1 Session and Condition 31. Means and Standard Deviations for Transformed Coordination Scores (Averaged across Teams within Conditions) 32. Means and Standard Deviations for Coordination Dynamics Measures (Averaged across Teams within Conditions) 33. Experimental Protocol 34. Number of Targets per Mission 35. Total Number of Participants with VGE and Aviation Experience and their Percentages 36. Total Number of Participants in Each Condition, Number, and Percentage of Males, and Individual Age across Condition 37. Gender Composition for High and Low Performance Groups 38. Prior Aviation Training for High and Low Performance Groups 39. Frequency of Video Game Play for High and Low Performance Groups 40. Median Split Age Groups for High and Low Performance Groups 41. Distribution of High and Low Performance Teams across Age Groups 42. Distribution of High and Low Performing Teams across Conditions for No Show Teams Cooke et al. ix Team Coordination
12 43. Average Age of Individuals for Show versus No Show Teams 44. Means and Standard Deviations for Team Performance (Averaged across Teams within Conditions) 45. Overall Taskwork Accuracy for Knowledge Session 1 and Knowledge Session Taskwork Positional Knowledge for Knowledge Session 1 and Knowledge Session Taskwork Interpositional Knowledge for Knowledge Session 1 and Knowledge Session Taskwork Intrateam Similarity for Knowledge Session 1 and Knowledge Session Taskwork Holistic Accuracy for Knowledge Session 1 and Knowledge Session Means and Standard Deviations for Teamwork Overall Accuracy for Knowledge Sessions 1 and Means and Standard Deviations for Teamwork Positional Accuracy for Knowledge Sessions 1 and Means and Standard Deviations for Teamwork Interpositional Accuracy for Knowledge Sessions 1 and Means and Standard Deviations for Teamwork Intrateam Similarity for Knowledge Sessions 1 and Means and Standard Deviations for Teamwork Holistic Accuracy for Knowledge Sessions 1 and Means and Standard Deviations for Coordination Ratings (Averaged across Teams within Conditions) 56. Means and Standard Deviations for CAST Hit Rate (Averaged across Teams) 57. Means and Standard Deviations of False Alarm Rate (Averaged across Teams) 58. Means and Standard Deviations of Time-to-Overcome Scores (in Seconds) 59. Means and Standard Deviations of Coordination Scores (Averaged across Teams for all Conditions) 60. Means and Standard Deviations for Coordination Flexibility and Stability (Averaged across Teams within Conditions) 61. Standardized Regression Coefficients of Significant Mission-level Team Performance Predictors by Experiment 2 Session and Condition Cooke et al. x Team Coordination
13 62. Standardized Regression Coefficients of Significant Session-level Team Performance Predictors by Experiment 2 Session and Condition 63. Outlying Personality Scores across High and Low Performance Groups 64. Outlying Personality Scores across High and Low Process Groups 65. Outlying Personality Scores across High and Low Team Performance Decrements (Intact Teams) 66. Outlying Personality Scores across High and Low Process Rating Decrements (Intact Teams) 67. Outlying Personality Scores across High and Low Coordination Decrements (Intact Teams) 68. Distribution of Outlying Personality Score (Mixed Teams) 69. Outlying Personality Scores across High and Low Team Performance Decrements (Mixed Teams) 70. Outlying Personality Scores across High and Low Process Decrements (Mixed Teams) 71. Outlying Personality Scores across High and Low Coordination Decrements (Mixed Teams) 72. Outlying Personality Scores across High and Low Team Performance Decrements (Mixed Teams) 73. Outlying Personality Scores across High and Low Process Decrements (Mixed Teams) 74. Outlying Personality Scores across High and Low Coordination Decrements (Mixed Teams) 75. Outlying Personality Scores across High and Low Team Performance Decrements (Mixed Teams) 76. Outlying Personality Scores across High and Low Process Decrements (Mixed Teams) 77. Outlying Personality Scores across High and Low Coordination Decrements (Mixed Teams) Cooke et al. xi Team Coordination
14 List of Appendices Appendix A. Components of Individual and Team Performance Scores Appendix B. Pathfinder Referent Networks Appendix C. Teamwork Knowledge Questionnaire Appendix D. CAST Roadblocks used in Experiment 1 Appendix E. Experiment 1 Debriefing Questions Appendix F. Experiment 2 Debriefing Questions Appendix G. Experiment 1 Ten Item Personality Inventory (TIPI) Appendix H. Experiment 1 Team Member Exchange Quality Questionnaire Appendix I. Experiment 1 Personality and Team Member Exhange Results Appendix J. Basic Skills Training Checklist Appendix K. Refresher Training Used in Experiments 1 and 2 Appendix L. CAST Roadblocks used in Experiment 2 Appendix M. Experiment 2 Condition-Specific Scripted Activities Appendix N. Procedural Model Hardcopy Appendix O. Perturbations used in Experiment 2 Appendix P. Taskwork Ratings Application
15 1.0 EXECUTIVE SUMMARY Acquisition and Retention of Team Coordination in Command-and-Control This report describes the technical progress accomplished under Air Force Office of Scientific Research (AFOSR) (grant FA ) and Air Force Research Lab (AFRL) Funding (grant FA ) spanning the performance period of March 2004 through December This report documents the research conducted in the total 34-month effort. The focus of this project is team coordination in command-and-control and in particular, the development and retention of team coordination in order to address training and retraining needs in these settings. Team coordination is characterized by timely and adaptive information exchange among team members. Team command-and-control tasks in both military and civilian domains can be characterized as challenging for a number of reasons including the 1) unanticipated nature of the situation, 2) ad hoc formation of team structure, 3) lack of familiarity among team members, and 4) extended intervals with little or no team training. In this project we address the third and fourth features by focusing on the development of team coordination with experience and over lengthy intervals without practice in situations in which the team retains the same or different members over time. This particular focus is relevant to military and civilian command-and-control communities because there can be fairly long periods when commandand-control teams are not able to train and practice together, yet they are expected to be competent as soon as they are deployed. Although there is a literature on individual retention in fairly simple tasks, there has been virtually no research on retention of team skills. We investigated the acquisition and retention of team coordination in command-and-control tasks through integrated modeling and empirical efforts. This project took place in the context of simulated Unmanned Air Vehicle (UAV) command-and-control, though we assume that the basic coordination process generalizes to other command-and-control and other team settings. A procedural model of team coordination was developed and used to generate a model-based metric of team coordination. This metric was then applied to track coordination development in two experiments. Results from the first experiment were used to guide the development of a dynamical systems model of the acquisition and retention of team coordination, which was then used to generate additional predictions that were tested empirically in a second experiment. The dynamic systems model, coupled with the empirical results, generated various implications for training command-and-control. In the first experiment we examine acquisition and retention functions associated with the development of team coordination (i.e., timely and adaptive sharing of information). Retention Interval length and Team Composition (i.e., during the retention phase of the experiment teams were intact [made up of either the same team members] or mixed [switched to different team members] as the acquisition phase of the experiment) were manipulated in order to examine their effects on team coordination, as well as team performance (i.e., outcomes) and team cognition. Results indicated that the longer Retention Interval and changing of team members was detrimental in terms of team performance. All teams, except those that experienced a short interval and remained intact (with the same team members), experienced a team performance Cooke et al. 1 Team Coordination
16 decrement, but recovered to pre-break (i.e., pre-retention Interval) levels of performance after one mission. Interestingly, there were process improvements as measured by experimenter coordination ratings for mixed teams after the break, but not intact teams that retained the same pre-break team members. Long-retention mixed teams also showed the greatest improvement in efficient responding to situation awareness roadblocks after the break and showed the most notable improvements in taskwork knowledge compared to other teams. A procedural model of optimal coordination at target waypoints in the UAV task was developed along with a metric that captured variation in the target-to-target application of this model. The coordination metric was analyzed across conditions and dynamical modeling approaches were applied to examine the temporal characteristics of this metric and to provide insight into the coordination dynamics of the Experiment 1 teams. Post-manipulation mixed teams exhibited more flexible coordination dynamics than post-manipulation intact teams. Mixed teams also exhibited higher coordination stability. Higher coordination stability was associated with overcoming more roadblocks during both sessions of the experiment. These results suggest that changes to Team Composition and to a lesser extent, longer Retention Intervals, may result in temporary performance decrements, but in the long run may be beneficial for building flexible and adaptive teams. The benefits of changes to Team Composition and longer Retention Intervals can be explained in terms of gaining richer shared mental models through crossfertilization with new team members or in terms of experiencing perturbations to coordination dynamics that necessitate exploratory coordination. An experiment was conducted in order to compare procedural training to team training based on either the shared mental models or perturbations to coordination mechanisms for building adaptive command-and-control teams. Procedural training focused on the Procedural Model of coordination and discouraged any deviations from it. Shared Mental Model (SMM) training involved cross training team members in all positions. Perturbed training constrained team interactions in order to force exploration of different patters. Although all teams experienced a retention decrement, Perturbed training resulted in superior performance compared to the other two conditions in three of the missions. Perturbed teams also gained more positional taskwork knowledge than other teams and like SMM-trained teams were faster to overcome situation awareness roadblocks than Procedural teams. In addition the Perturbed teams performed significantly better under high workload. These results indicate that procedural (by the book) training may result in rapid training of fairly rigid teams, whereas training that provides a richer array of possible coordination scenarios and experiences results in more adaptive teams with superior performance over a range of mission contexts (e.g., high workload). These results are significant not only in implications for training command-and-control teams, but also in the development of a metric of team coordination and in the application of dynamical systems modeling of coordination to understand and make predictions about training mechanisms. Cooke et al. 2 Team Coordination
17 2.0 RESEARCH TEAM Principle Investigator Nancy J. Cooke, Ph.D. Science Director, CERI Professor, Applied Psychology, ASU Polytechnic Consultant Nia Amazeen, Ph.D. Associate Professor, Psychology, ASU Graduate Students Jasmine Duran, CERI & ASU Jamie C. Gorman, Ph.D., CERI & NMSU * (Ph.D. obtained Dec. 2006) Harry K. Pedersen, CERI & NMSU * Leah Rowe, CERI & ASU Eugene Slutskiy, CERI & ASU Amanda Taylor, CERI & ASU Jennifer Winner, CERI & ASU Undergraduates Steven James, ASU CERTT Developer Steven M. Shope, Ph.D., Executive Director, CERI AFRL Collaborators Dee Andrews, Ph.D. Pat Fitzgerald *These students relocated from NMSU to CERI & ASU, though still officially working on NMSU degrees. Cooke et al. 3 Team Coordination
18 3.0 INTRODUCTION 3.1 The Problem The operational environment of today s U.S. Air Force is heavily dependent on command-and control tasks that are increasingly cognitively-demanding, information-centric, and sensor dependent in settings that are dynamic, uncertain, and of high tempo. Operators in these settings work together in teams that are often geographically distributed, heterogeneous in regard to skills and backgrounds, and multinational. This Air Force command-and-control scenario has parallels in many civilian tasks including emergency operations centers, telemedicine, and air traffic control. Now, more than ever, issues of assessing team performance, training teams, and designing technological aids for effective team command-and-control performance are critical, and increasingly challenging. How can team performance be measured? How can we characterize and assess cognitive skill at the team level? Can assessment occur without disruption of operational performance and can it occur in time for intervention? How is team cognition and performance impacted by training, technology, and Team Composition? Is team cognition different than the sum of the cognition of individual team members? How can command-andcontrol performance be modeled so that predictions can be made about the impact of various factors on performance? What are effective training regimes or decision tools for these team members? Our research program in the Cognitive Engineering Research on Team Tasks (CERTT) Lab and at the Cognitive Engineering Research Institute (CERI) is focused on these and other questions pertaining to team performance and cognition. Team coordination is characterized by timely and adaptive information exchange among team members. In the project reported here we focused on the development and retention of team coordination in order to address training and retraining needs in command-and-control settings. Team command-and-control tasks in both military and civilian domains can be characterized as challenging for a number of reasons including the 1) unanticipated nature of the situation, 2) ad hoc formation of team structure, 3) lack of familiarity among team members, and 4) extended intervals with little or no team training. In this project we address the third and fourth factors by focusing on the development of team coordination with experience and over lengthy intervals without practice in situations in which the team is either intact (with the same team members) or mixed (with different members) over time. This particular focus is relevant to military and civilian command-and-control communities because there can be fairly long periods when command-and-control teams are not able to train and practice together, yet they are expected to be competent as soon as they are formed and deployed. We view team coordination as central to team skill in command-and-control. Practical guidance on retention of team coordination and retraining needs is virtually nonexistent due to the lack of empirical studies or modeling tools in this area. All existing models of skill retention and loss, and tools for retention and loss prediction, are focused on individual skills. In contrast, skill retention and loss for higher order cognitive team skills has received little examination in the past. Team retention and loss research is difficult to perform practically because it is often a Cooke et al. 4 Team Coordination
19 challenge to keep experimental teams together long enough to measure loss over a period of time. In addition, for teams that stay together in a natural, operational setting (e.g., UAV teams) it is difficult to control the amount of exposure teams get to the operational tasks between laboratory sessions. Consequently, the team literature has little to say about team retention and loss and how to best to mitigate the effects of team skill loss. This research examines team retention issues both analytically and experimentally in a synthetic testbed. The synthetic testbed allows for better control of the factors influencing retention and also allows for manipulation of Team Composition. Recognizing the difficulty of conducting long-term retention studies of team coordination we have also developed models of coordination that will provide practical guidance in command-and-control training and retention issues. 3.2 Long-Range Objectives The long-term goal of our research program is to develop and evaluate measures of team cognition in a military context in order to improve team performance. This goal can be decomposed into the following long-range objectives: Develop a military synthetic task environment that emphasizes team cognition. Identify needs and issues in the measurement of team cognition. Develop new methods suited to the measurement of team cognition. Evaluate newly developed measures. Apply measures to better understand team cognition. Apply measures to evaluate interventions relevant to team cognition. Generate models of team cognition that are predictive of team performance. Since 1997, when our research program was first funded by AFOSR, we have made significant progress toward these long-range objectives. 3.3 Prior Progress Toward Long-Range Objectives Our research program on team cognition was initiated in 1997 with a Defense University Research Instrumentation Program (DURIP; F ) grant that provided funds for initial equipment in the CERTT Laboratory. Subsequent grants from AFOSR (F ; F , F , FA , FA ) have funded research in the CERTT Lab from 1998 to the present (2007) and with the latest funding projected through the end of Our progress toward the long-range objectives of our research program fall into five major areas: 1) Theoretical accomplishments toward the measurement of team cognition, 2) Development of a UAV Synthetic Task Environment (UAV- STE), 3) Empirical accomplishments, 4) Methodological accomplishments, and most recently. 5) Modeling accomplishments. This progress is summarized in the sections that follow and reported in more detail in the listed publications. Cooke et al. 5 Team Coordination
.")
20 3.3.1 Theoretical Accomplishments Toward The Measurement of Team Cognition Our initial methodological focus was prompted by much of the research and theory surrounding shared mental models and team situation awareness (e.g., Cannon-Bowers Salas, & Converse, 1993; Orasanu, 1990; Stout, Cannon-Bowers, & Salas, 1996). In this literature, the unit of study is a team (a type of group) and is defined as "a distinguishable set of two or more people who interact dynamically, interdependently, and adaptively toward a common and valued goal/object/mission, who have each been assigned specific roles or functions to perform, and who have a limited life span of membership" (Salas, Dickinson, Converse, & Tannenbaum, 1992, p. 4). Thus, this literature focuses on heterogeneous groups with interdependent roles in which members have differentiated responsibilities and roles (Cannon-Bowers, et al., 1993) in contrast to much of the small group literature. This cognitive division of labor is quite common in military settings and enables teams to tackle tasks too complex for any individual. Interestingly, despite this focus on heterogeneous teams, the theoretical constructs and operational definitions of those constructs often neglect this critical feature of teams and tend to assume homogeneity. Thus, shared mental model theories often posit that similar (as opposed to complementary) mental models of the domain across team members are desirable for better team performance and adaptability. Specifically, attempts to measure shared mental models tend to do so by looking at the degree to which two individuals have similar responses to domain-related queries. Often accuracy is not measured, but when it is, it is based on comparison to a single team referent, thereby ignoring the possibility of heterogeneity of knowledge. One of the most common frameworks for conceptualizing team cognition puts shared mental models at the forefront of an input-process-output (I-P-O) framework (e.g., Hackman, 1987). Applying the I-P-O framework to cognition at the team level is analogous to the information processing view of cognition at the individual level insofar that knowledge structure is distributed over team members, instead of over long term memory, and is operated on by team process behaviors, instead of memory processes. A generic I-P-O framework is presented in Figure 1. Individual Taskwork Knowledge Individual Teamwork Knowledge Team Process Behaviors Team Outcome Individual Dynamic Knowledge Cooke et al. 6 Team Coordination
21 Figure 1. A generic Input-Process-Output (I-P-O) framework. Interestingly, within this framework some have conceptualized team cognition as an outcome (e.g., Mathieu, Goodwin, Heffner, Salas, & Cannon-Bowers, 2000). Others have considered collective cognition as an input in the I-P-O framework (e.g., Mohammed & Dumville, 2001) and others have viewed team cognition in terms of process behaviors such as planning and decision making (e.g., Brannick, Prince, Prince, & Salas, 1995). So team cognition can and has been associated with all parts of the I-P-O framework, however, there has been increasing focus on the I part in which team cognition is thought of as the collection of individual team member knowledge involving the task and team. Views of shared mental models and team situation awareness as common understanding, vision, or knowledge across team members and the concomitant emphasis on knowledge in cognitive theories of individual expertise (Cooke, 1994) turned the spotlight toward the input side of the I- P-O framework. The focus was on the knowledge or mental models and not the sharing processes. For example, these sharing processes have been tied to knowledge tied to process (e.g., Entin & Serfaty, 1999). Thus the information processing perspective is knowledge-centric, rather than behavior-centric (e.g., Mohammed & Dumville, 2001). At the same time, with this emphasis also came a shift from decentralized notions of adaptive team coordination (cf. Tushman, 1979) to a more knowledge-homogeneous, static view. We take issue with the focus on input over process and the idea that team cognition is the aggregate of individual cognition. These limitations in theory and measurement have motivated our research program, which focuses on metrics more appropriate for the types of teams defined by Salas, et al. (1992). In developing new metrics we have also created a conceptual framework for thinking about team cognition as displayed in Figure 2. Panel B of Figure 2 represents our most recent thinking along these lines and is inspired by ideas from ecological and Gibsonian psychology. Our research targets team cognition, rather than individual cognition. Traditional metrics of team cognition (i.e., shared mental model measures) also target the team level, but estimate that level using collective metrics that aggregate individual data (Panel A). Although we believe that knowledge measured collectively should be predictive of team performance, it is also devoid of the influences of team process behaviors (e.g., communication, coordination, situation awareness), analogous to individual cognitive processes that transform the individual knowledge into effective cognition. Effective team cognition is what we attempt to measure at the holistic level and is associated with actions and ultimately, with team performance. This view is partly an issue of level of analysis as portrayed by multi-level theories of teams (Kozlowski & Klein, 2000). However, the view also proposes what should be measured (i.e., team process over team knowledge) which is a dimension that is in some cases confounded with level. Cooke et al. 7 Team Coordination
22 + + + Individual Panel A TEAM COGNITION = Panel B Figure 2. Team cognition as viewed from the collective (Panel A) and holistic (Panel B) perspectives. We (i.e., the CERTT Lab team) have conceptualized team cognition differently. We take an alternative perspective to the I-P-O framework that is partially motivated by some limitations of the information processing (IP) perspective (i.e., applicability to heterogeneous teams, knowledge vs. process focus) and partially motivated by some alternative views of scientific psychology (i.e., distributed cognition, Hutchins, 1991; ecological psychology, Reed, 1996; and Soviet-era activity theory, Leontev, 1990) as well as dynamical systems theory (Alligood, Sauer, & York, 1996). This ecological/activity view considers team cognition as emergent, rather than a linear aggregate, and is thus focused on the dynamic interplay among team members, rather than the static structure of team member knowledge. It is accordingly, a perspective on team cognition that supports holistic rather than aggregate measurement. As represented in Figure 2, Panel B, team cognition is not equivalent to the (aggregate) function of individual team member cognition, but instead emerges from the dynamic interplay between collective cognition and team member interactions. This perspective advocates holistic thinking about team cognition and holistic measurement (i.e., measurement at the team level) rather than collective measurement (measurement of individuals and aggregation) and is inspired by the notion of holism and emergence in Gestalt psychology (Cooke, Salas, Cannon-Bowers, & Stout, 2000); see also collective cognition, Gibson, 2001). Simple aggregation rules (e.g., summing) do not capture emergent gestalts, especially when there is a high level of interdependency due to heterogeneous distribution of knowledge and abilities across team members (Cooke & Gorman, 2006; Gorman, Cooke, & Kiekel, 2004). Essentially, in an aggregate the parts are independent of their relations to each other while in a whole, relations help determine the nature of the parts (Juarrero, 1999). For holistic team cognition the relations among the parts are of inherent interest, in addition to the static distribution of knowledge among the parts themselves. The ecological view is concerned with the team processing mechanisms by which the team perceives, decides, reacts, adapts, and behaves. This emphasis on team member interactions beyond a collection of team knowledge stores is also shared with much of the small group work on decision making (Festinger, 1954; Steiner, 1972), social decision schemes (Davis, 1973; Cooke et al. 8 Team Coordination
23 Hinsz, 1995; 1999), and even transactive memory with its emphasis on transaction or communication (Hollingshead & Brandon, 2003). However the ecological approach to team cognition is unique with its emphasis on dynamics of team member interactions. Borrowing concepts from ecological psychology, teams can be viewed as a set of distributed perception-action systems that can become coordinated to the relatively global stimulus information specifying a team-level event. By analogy, when we encounter fire we see flames, we smell smoke, we feel the heat, we hear the crackle, etc.; our perceptual systems are attuned to different aspects of the same stimulus information specific to fire, but are coordinated across time (Gibson, 1966). Similarly, when an event occurs in the team environment, each team member is heterogeneously attuned to different aspects of the event. These perception-action systems are all attuned to the same event, they just extract information about it in different ways, in such a manner that these systems need to be coordinated. Our preferred perspective thus emphasizes team coordination (i.e., a team process) in response to events in the team environment. In this manner, team cognition is characterized as a single organism, ebbing and flowing and adapting itself to novel environmental constraints through the coordination of a team s perceptual systems. This process of adaptation is also consistent with Soviet activity theory (Leontev, 1990) or how a team internalizes new information in terms of information distribution across team members (cf. Artman, 2000). Our focus on metrics of team performance and cognition have not only resulted in tested metrics that can be applied to other team tasks, but also specific findings in the context of our UAV task that can contribute to theories on shared mental models, cross training, team knowledge, team situation awareness, and cognitive workload. As we further develop our conception of team cognition and collect additional data, we have encountered the need for, as well as the feasibility of, developing models of team coordination in command-and-control, of which the UAV task is an exemplar. We view coordination (i.e., timely and adaptive timed information sharing) as the essence of team cognition in command-and-control and in our previous studies we see the development of coordination as a key to effective team performance. Thus, understanding and prediction of the development of coordination is critical to interventions to improve commandand control performance. Our emphasis on team coordination is in keeping with the general assumption that the team is more than the sum of individual cognitive agents and that there are emergent properties brought about through their coordination Development of UAV-STE The CERTT Lab is a research facility for studying team performance and cognition in complex settings and it houses experimenter- friendly equipment to simulate these settings. Our work has been greatly influenced by the assumption that synthetic tasks provide ideal environments for cognitive engineering research on complex tasks in that they serve as a middle ground between the difficult to control field and the artificial tasks typically found in the lab. We have developed in the CERTT Lab a UAV-STE based on a cognitive task analysis (Gugerty, DeBoom, Walker, & Burns, 1999) of ground control operations for the Predator at Indian Springs, NV (Cooke, Rivera, Shope & Caukwell, 1999; Cooke & Shope, 2005; Cooke & Shope, 2002a; Cooke & Shope, 2002b; Cooke & Shope, 1998; Cooke, Shope, & Rivera, 2000). This UAV-STE emphasizes team aspects of the task such as planning, replanning, decision-making, and Cooke et al. 9 Team Coordination


24 coordination. Our research and methodological developments in team cognition have taken place in this context. We assume that our research and methods relevant to team cognition in this environment can be generalized to other command-and-control environments. CERTT's UAV-STE is a three-team member task in which each team member is provided with distinct, though overlapping, training; has unique, yet interdependent roles; and is presented with unique and overlapping information during the mission. The overall goal is to fly the UAV to designated target areas and to take acceptable photos at these areas. The Air Vehicle Operator (AVO) controls airspeed, heading, and altitude, and monitors UAV systems. The Payload Operator (PLO) adjusts camera settings, takes photos, and monitors the camera equipment. The Data Exploitation, Mission Planning, and Communication Operator (DEMPC) oversees the mission and determines flight paths under various constraints. To successfully complete a mission, the team members need to share information with one another in a coordinated fashion. Most communication is done via microphones and headsets, although some involves computer messaging. Measures taken include audio records, video records, digital information flow data, embedded performance measures, team process behavior measures, situation awareness measures, and a variety of individual and team knowledge measures. The participant and experimenter consoles are depicted in Figures 3 and 4. Figure 3. CERTT participant consoles. Figure 4. CERTT experimenter consoles. Features of the CERTT UAV-STE include (*features implemented in this effort): Three participant consoles One experimenter workstation Integration of seven task applications over local area net Video and audio recording equipment (including digital audio) David Clark headsets for participants and experimenter Intercom and software for logging communications flow Embedded performance measures Computer event logging capabilities Ability to disable or insert noise in channels of communication intercom* Experimenter access to participant screens Experimenter control capability of participant applications* Cooke et al. 10 Team Coordination
25 Easy to change start- up parameters and waypoint library that define a scenario Software to facilitate measurement of team process behaviors * Software to facilitate situation awareness measurement* Coordination logging software* Training software modules with tests Software modules for off-line knowledge measurement (taskwork ratings) Software for administering debriefing questionnaire Software for administering NASA Task Load Index (NASA TLX), Situational Awareness Rating Technique (SART), and other scales Capability for distributed simulation (across intranet and internet) Numerous possibilities for inserting team situation awareness roadblocks into scenario* Empirical Accomplishments Thus far, with US Air Force support (AFOSR, AFRL), seven experiments have been completed in the context of the CERTT UAV-STE. The sixth and seventh experiments on team coordination are presented in detail in the remainder of this report. Two other studies have been conducted in the lab one supported by the Army Research Institute and the other a student M.A. thesis on collaborative writing. A summary of features of each of the five previously completed Air Force studies is presented in Table 1. By the end of fall 2006 over 339 individuals had participated in the Air Force studies in the CERTT UAV-STE. Data collected thus far have provided insight into the acquisition of team skill, knowledge development and sharing, the effects of workload, training strategy, distributed vs. co-located environments, and the retention of team cognition, coordination, and performance. This work has been reported in detail in technical reports, book chapters, journals, and conference presentations (Cooke, Salas, Kiekel, & Bell, 2004; Cooke, Kiekel, Bell, & Salas, 2002; Cooke, Kiekel, & Helm, 2001a; Cooke, Kiekel, & Helm, 2001b; Cooke, Shope, & Kiekel, 2001). Table 1 Summary of Five Previously Completed Empirical Studies Under AFOSR Support Missions (M) Workload (WL) Constant Constant M 1-4: Low WL M 5-7 High WL M 1-4: Low WL M 5: High WL M 1-4: Low WL M 5: High WL Knowledge Sessions (KS) Place of KS 1-after M 1 1-after training 2-after M 4 1-after training 2-after M 2 3-after M 7 2-after M 7 3-after M 5 4-after M 9 1-after M 3 1-after M 3 Mission Time 40 min 40 min 40 min 40 min 40 min Number of Teams Number of Sessions Manipulations None- Acquisition task Benchmarking task Shared knowledge vs. no shared knowledge Co-located vs. Distributed Low vs. high workload Co-located vs. Distributed Low vs. high workload Cooke et al. 11 Team Coordination
26 Participants Compensation AF ROTC cadets $6/hr to organization plus $50 bonus to best team AF ROTC cadets $6/hr to organization plus $50 bonus to best team Campus organizations $6/hr to organization plus $50 bonus to best team Male students $6/hr to individual plus $50 bonus to best team Male expert teams $10/hr to individual plus $100 bonus to best team One robust finding from our lab is exemplified by in Figure 5. Here we see team-level performance acquisition (learning) occurring over the course of each of ten 40-minute missions. It generally takes teams four 40-minute missions after reaching individual training criterion to reach asymptote as a team. Other data indicate that individual and team knowledge is not changing in the first four missions as much as team process, coordination, and communication patterns are changing. Figure 5. Acquisition of UAV task (team performance scores) for 11 teams in Experiment 1. Major findings from these empirical studies are as follows: Team performance consistently reaches asymptotic levels after four 40-minute missions. Interpositional taskwork knowledge tends to develop with task and team experience. Taskwork knowledge is relatively stable after initial task training and teamwork knowledge tends to develop with mission experience. Gender composition accounts for some variance in team performance with mixed gender teams tending to perform more poorly than same gender teams. Cooke et al. 12 Team Coordination
27 Working memory capacity of team members also accounts for some variation in team performance. Specifically, DEMPC s working memory capacity is positively correlated with team performance. Encouraging or discouraging information sharing during breaks and by examining others displays had no effect on team performance. Early attempts to force-feed teamwork or coordination information prior to development of taskwork knowledge have not succeeded suggesting a sequential dependency in knowledge development (taskwork must precede teamwork). We find no deleterious effects of the distributed vs. co- located manipulation (dispersion) on team performance. We find a significant effect of workload on team performance, such that an increase from 9 to 20 targets and additional route constraints results in fewer photos per minute. The dispersion manipulation affects team process behavior; distributed teams tend to prebrief and debrief less than co-located teams. The dispersion manipulation affects knowledge; distributed teams tend to have less taskwork knowledge than co-located teams. The dispersion manipulation affects perception of workload; co- located DEMPCs perceive greater degrees of workload than distributed DEMPCs. Distributed teams with better team process and team knowledge have higher team performance scores. The pattern of results that we find regarding distributed vs. co- located teams suggests that the distributed environment affects behavior and cognition of teams, but that they adapt (probably through coordination/communication) to maintain performance comparable to colocated teams. We have collected communication data that support this claim. Experienced teams (made up of individuals who communicate and coordinate with each other on a regular basis) show accelerated team skill acquisition on the UAV-STE, and overall higher levels of team performance Methodological Accomplishments Given that we have a long-term goal of developing and evaluating measures of team cognition and performance, many of our accomplishments are methodological in nature. Reliable and valid measurement of constructs like team knowledge is a first, albeit nontrivial step, that presents a challenge to advances in theories and understanding of team cognition. Many parallels can be drawn between the measurement of individual and team cognition, given that the primary difference is whether the measurement is directed at the team or individual. Just as individual cognition is reflected in the behavior of the individual, team cognition is reflected in the behavior of the team. One of our foci on team knowledge measurement (most closely aligned with the shared mental model literature) has highlighted several areas in which measurement can be improved. In particular, methods commonly used to measure team cognition are inappropriate for heterogeneous teams whose team process behaviors are more complex than simple aggregation schemes (e.g., averaging) reflect. Our methodological work and the various measurement issues relevant to team knowledge that have been identified thus far are described in detail elsewhere (Cooke & Gorman, 2006; Cooke, Kiekel, Bell, & Salas, 2002; Cooke, Kiekel, & Helm, 2001a, Cooke et al. 13 Team Coordination
28 2001b; Cooke et al., 2001; Cooke, Stout, & Salas, 2001; Cooke, et al., 2000; Cooke, Stout, Rivera, & Salas, 1998; Cooke, Stout, & Salas, 1997) and are briefly summarized in Table 2 below. Table 2 Issues in the Measurement of Team Cognition Measures are needed that target the holistic level, rather than the collective (aggregate) level, of team cognition (i.e., elicit team knowledge from the team). Measures of team cognition are needed that are suited to teams with different roles (e.g., navigator, pilot). Methods for aggregating individual data to generate collective knowledge that better reflect team process behavior need to be investigated. Measures of team knowledge that target the more dynamic and fleeting situation models are needed. Measures that target different types of team knowledge (e.g., strategic, declarative, procedural knowledge or task vs. team knowledge) are needed. The extension of a broader range of knowledge elicitation methods to the problem of eliciting team cognition is needed. The streamlining of measurement methods to facilitate automation within the task context is needed. Validation of newly developed measures is required. Our methodological progress has included the development of training and measurement modules that interface with the CERTT Lab including: UAV-STE waypoint database to facilitate scenario changes Communication flow logging software Participant performance score viewer and experimenter interface Upgrades to performance score appropriate for high workload conditions Development of secondary measures of taskwork and teamwork knowledge used to conduct multitrait multimethod (MTMM) analyses Software measures of working memory capacity and social desirability Implemented online subjective measures of situation awareness (SART) and workload (NASA TLX) Critical incident and summary measures of team process behavior Systems for randomizing and recording responses to embedded situation awareness probes Coordination logging tool for experimenters Situation awareness measurement tool for experimenters We have also made methodological progress in developing and evaluating metrics that are more appropriate for the heterogeneous command-and-control teams that we study: Cooke et al. 14 Team Coordination
29 Holistic or consensus-based methods of measuring taskwork knowledge, teamwork knowledge, and situation awareness at the team level. Accuracy metrics for heterogeneous teams that can quantify overall, positional, and interpositional accuracy of knowledge. Proportion of agreement metrics Various aggregation schemes more appropriate for command-and-control than averaging responses Communication analysis as an unmitigated approach to the measurement of team cognition (funded by Office of Naval Research (ONR), N , N , and N ) Procedural metric of team coordination at target events Coordinated Awareness of Situation by Teams (CAST) metric In the course of testing our new metrics in the context of the CERTT UAV-STE, we have found: Holistic measures are more appropriate than collective measures for heterogeneous teams The timing of off-line knowledge measurement within the experimental session is critical. Data are better obtained after mission experience, but before the end of a session or experiment. Off-line measures and those that especially lack face validity (i.e., relatedness ratings of taskwork concepts) tend to lack reliability and validity compared to embedded, missionrelevant measures. Indirect measures such as pairwise relatedness ratings of taskwork concepts tend to be more sensitive than more direct knowledge measures such as multiple-choice tests. Embedded situation awareness queries that are repeated across missions seem to better reflect team performance compared to non-repeated situation awareness queries Knowledge and process measures tend to be more predictive of performance for conditions with comparatively poor knowledge and process Assessment of individual and team taskwork knowledge by comparison to empirically derived, rather than logically derived referents seems to have better predictive validity. Knowledge measures reflect stable mental models very early after training. Team performance changes seem to go hand-in-hand with team process, team situation awareness, coordination, and changes in communication patterns Modeling Accomplishments Prior to the current effort we identified modeling as a gap in our research program on team cognition. Our focus had been on empirical data collection which fed the development of theories and helped to develop and validate measures. Our modeling to this point was statistical in nature, relying on multiple regression models to describe the connection between our team cognition metrics and team performance. As we moved away from individual knowledge metrics and questions about team knowledge and into issues of team coordination and team process, we saw a greater need for modeling. Cooke et al. 15 Team Coordination
30 Although CERI s partners (including AFRL s Kevin Gluck, ASU s Dynamical Systems Modeling focus (Nia Amazeen), and Bayesian modelers at Los Alamos National Labs, a potential future partner) have significant strengths in modeling, none of these efforts have directly targeted command-and-control. We see the tremendous potential in a model of command-and-control coordination that could predict coordination loss or gains as factors such as team size, geographic dispersion, team member turnover, team member skill differences, or workload change. Further, we see modeling not only as a weakness to be addressed, but also as an approach that complements our strengths in empirical endeavors. Through the effort reported here we have narrowed this gap by applying dynamical systems modeling approaches to team coordination. In addition we have developed a model of procedural team coordination at target waypoint in order to provide the data for dynamic modeling. The modeling conducted on the data collected in our first experiment was used to direct research questions and to make predictions for the second experiment. The capabilities developed under this modeling effort complement the CERTT-UAV test bed by providing 1) a working model that reflects empirical findings to-date 2) a means of making empirically-based predictions about coordinated team performance, and 3) a mechanism for guiding future empirical work and metric development Publications Resulting from Previous and Current AFOSR-Supported Efforts The following are publications and presentations associated with our AFOSR-funded work since Publications 1998 Cooke, N. J. & Shope, S. M. (1998). Facility for Cognitive Engineering Research on Team Tasks. Report for Grant No. F , submitted to AFOSR, Bolling AFB, Washington, DC. Cooke, N. J., Stout, R., Rivera, K., & Salas, E. (1998). Exploring measures of team knowledge. Proceedings of the Human Factors and Ergonomics Society 42nd Annual Meeting, Cooke, N. J. & Rivera, K. (1999). CERTT Lab Brochure. Funded by NMSU Department of Psychology, NMSU College of Arts and Sciences Research Center, and Sandia Research Corporation. Cooke, N. J. & Shope, S. M. (1999). CERTT Lab Video. Produced by NMSU s Instructional Video Services. Funded by NMSU Department of Psychology, NMSU College of Arts and Sciences Research Center, and Sandia Research Corporation. Cooke, N. J., Rivera, K., Shope, S. M., & Caukwell, S. (1999). A synthetic task environment for team cognition research. Proceedings of the Human Factors and Ergonomics Society 43rd Annual Meeting, Cooke et al. 16 Team Coordination
31 2000 Cooke, N. J., Salas, E., Cannon-Bowers, J. A., & Stout, R. (2000). Measuring team knowledge. Human Factors, 42, Cooke, N. J., Shope, S. M., & Rivera, K. (2000). Control of an uninhabited air vehicle: A synthetic task environment for teams. Proceedings of the Human Factors and Ergonomics Society 44th Annual Meeting, Cooke, N. J., Kiekel, P. A., & Helm E. (2001). Comparing and validating measures of team knowledge. Proceedings of the Human Factors and Ergonomics Society 45th Annual Meeting. AFOSR Acquisition and Retention of Team Coordination in Command-and- Control, 17. Cooke, N. J., Kiekel, P. A., & Helm E. (2001). Measuring team knowledge during skill acquisition of a complex task. International Journal of Cognitive Ergonomics: Special Section on Knowledge Acquisition, 5, Cooke, N. J., Shope, S. M., & Kiekel, P. A. (2001). Shared-Knowledge and Team Performance: A Cognitive Engineering Approach to Measurement. Technical Report for AFOSR Grant No. F Kiekel, P. A., Cooke, N. J., Foltz, P. W., & Shope, S. M. (2001). Automating measurement of team cognition through analysis of communication data. In M. J. Smith, G. Salvendy, D. Harris, and R. J. Koubek (Eds.),Usability Evaluation and Interface Design, (pp ). Mahwah, NJ: Lawrence Erlbaum Associates Cooke, N. J. & Shope, S. M. (2002). Behind the scenes. UAV Magazine, 7, 6-8. Cooke, N. J. Team communication analysis: Exploiting the wealth. (2002) Proceedings of the Human Factors and Ergonomics Society 46th Annual Meeting, 289. Cooke, N. J., & Shope, S. M. (2002). The CERTT-UAV Task: A Synthetic Task Environment to Facilitate Team Research. Proceedings of the Advanced Simulation Technologies Conference: Military, Government, and Aerospace Simulation Symposium, pp San Diego, CA: The Society for Modeling and Simulation International. Cooke, N. J., Kiekel, P. A., Bell, B., & Salas, E. (2002). Addressing limitations of the measurement of team cognition. Proceedings of the Human Factors and Ergonomics Society 46th Annual Meeting, Kiekel, P. A., Cooke, N. J., Foltz, P. W., Gorman, J. C., & Martin, M. J. (2002). Some promising results of communication-based automatic measures of team cognition. Proceedings of the Human Factors and Ergonomics Society 46th Annual Meeting, Cooke, N. J., Salas, E., Kiekel, P. A., & Bell, B. (2004). Advances in measuring team cognition. In E. Salas and S. M. Fiore (Eds.), Team Cognition: Understanding the Factors that Drive Process and Performance, (pp ). Washington, DC: American Psychological Association. Gorman, J. C., Cooke, N. J., & Kiekel, P. A. (2004). Dynamical perspectives on team cognition. Proceedings of the Human Factors and Ergonomics Society 48th Annual Meeting. Shope, S. M., DeJoode, J. A., Cooke, N. J., & Pedersen, H. (2004). Using Pathfinder to generate communication networks in a cognitive task analysis. Proceedings of the Human Factors and Ergonomics Society 48th Annual Meeting. Cooke et al. 17 Team Coordination
32 2005 Cooke, N. J. (2005). Measuring Team Knowledge. Handbook on Human Factors and Ergonomics Methods, (pp. 491). Boca Raton, FL: CLC Press, LLC. Cooke, N. J., & Shope, S. M. (2005). Synthetic Task Environments for Teams: CERTT s UAV- STE Handbook on Human Factors and Ergonomics Methods, (pp. 461). Boca Raton, FL: CLC Press, LLC. Cooke, N. J., Kiekel, P.A., Salas, E., Stout, R. J., Bowers, C., & Cannon-Bowers, J. (2003). Measuring Team Knowledge: A Window to the Cognitive Underpinnings of Team Performance. Group Dynamics: Theory, Research and Practice, 7, Gorman, J. C., Cooke, N. J., Pedersen, H. K., Connor, O. O., & DeJoode, J. A. (2005). Coordinated awareness of situation by teams (CAST): Measuring team situation awareness of a communication glitch. Proceedings of the Human Factors and Ergonomics Society 49 th Annual Meeting, Orlando, FL, Connor, O., Pedersen, H., Cooke, N. J., & Pringle, H. (2006). CERI Human Factors of UAVs: 2004 and 2005 Workshop Overviews In N. J. Cooke, H. Pringle, H. Pedersen, & O. Connor (Eds.), Human Factors of Remotely Piloted Vehicles. Volume in Advances in Human Performance and Cognitive Engineering Research Series, (pp. 3-20). Elsevier. Cooke, N. J. (2006). Human Factors of Remotely Operated Vehicles. Proceedings of the Human Factors and Ergonomics Society 49 th Annual Meeting, San Francisco, CA. Cooke, N. J., & Gorman, J. C. (2006). Assessment of team cognition. In P. Karwowski (Ed.), 2nd EDITION- International Encyclopedia of Ergonomics and Human Factors,( pp ). UK: Taylor & Francis Ltd. Cooke, N. J., Pedersen, H. K., Gorman, J. C., & Connor, O. (2006). Acquiring Team-Level Command and Control Skill for UAV Operation. In N. J. Cooke, H. Pringle, H. Pedersen, & O. Connor (Eds.), Human Factors of Remotely Piloted Vehicles. Volume in Advances in Human Performance and Cognitive Engineering Research Series, (pp ). Elsevier. Cooke, N. J., Pringle, H., Pedersen, H., & Connor, O. (2006). Preface: Why Human Factors of Unmanned Systems? In N. J. Cooke, H. Pringle, H. Pedersen, & O. Connor (Eds.), Human Factors of Remotely Piloted Vehicles. Volume in Advances in Human Performance and Cognitive Engineering Research Series, (pp. xvii-xxii). Elsevier. Cooke, N. J., Pringle, H., Pedersen, H., & Connor, O. (Eds.), (2006). Human Factors of Remotely Piloted Vehicles. Volume in Advances in Human Performance and Cognitive Engineering Research Series, Elsevier. DeJoode, J. A., Cooke, N. J., Shope, S. M., & Pedersen, H. (2006). Guiding the Design of a Deployable UAV Operations Cell In N. J. Cooke, H. Pringle, H. Pedersen, & O. Connor (Eds.), Human Factors of Remotely Piloted Vehicles. Volume in Advances in Human Performance and Cognitive Engineering Research Series, (pp ). Elsevier. Gorman, J. C. (2006). Team coordination dynamics in cognitively demanding environments. Ph.D. Thesis, New Mexico State University. Gorman, J. C., Cooke, N. J., Pedersen, H. K., Winner, J. L., Andrews, D., & Amazeen, P. G. (2006). Changes in Team Composition After a break: Building adaptive command-andcontrol teams. Proceedings of the Human Factors and Ergonomics Society 49 th Annual Meeting, San Francisco, CA. Gorman, J. C., Cooke, N. J., & Winner, J. L. (2006). Measuring team situation awareness in decentralized command and control systems. Ergonomics, 49, Cooke et al. 18 Team Coordination
33 Pedersen, H. K, & Cooke, N. J. (2006). From Battle Plans to Football Plays: Extending Military Team Cognition to Football. International Journal of Sport and Exercise Psychology, 4, Pedersen, H., Cooke, N. J., Pringle, H., & Connor, O. (2006). UAV Human Factors: Operator Perspectives In N. J. Cooke, H. Pringle, H. Pedersen, & O. Connor (Eds.), Human Factors of Remotely Piloted Vehicles. Volume in Advances in Human Performance and Cognitive Engineering Research Series, pp , Elsevier. Gluck, K. A., Ball, J. T., Gunzelmann, G., Krusmark, M. A., Lyon, D. R., & Cooke, N. J. (2006). A Prospective Look at Synthetic Teammate for UAV Applications. Invited talk for AIAA "Infotech@Aerospace" Conference on Cognitive Modeling Cooke, N. J., Gorman, J., Pedersen, H., & Bell, B. (2007). Distributed Mission Environments: Effects of Geographic Dispersion on Team Cognition and Performance. In S. Fiore & E. Salas (Eds.), Toward a science of distributed learning and training. Washington, DC: American Psychological Association. Cooke, N. J., Gorman, J. C., & Winner, J. L. (2007). Team cognition. In F. Durso, R. Nickerson, S. Dumais, S. Lewandowsky, & T. Perfect, Handbook of Applied Cognition, 2nd Edition, (pp ). Wiley. In Press Cooke, N. J. & Pederson, H. K. (in press). Human Factors of Unmanned Aerial Vehicles. To appear in Wise, J. A., Hopkin, V. D., & Garland, D. J. (Eds.), Handbook of Aviation Human Factors (2 nd Ed.). Hillsdale, NJ: Erlbaum. Cooke, N. J. & Fiore, S. (in press). Cognitively-Based Principles for the Design and Delivery of Training, S. W. J. Kozlowski & E. Salas (Eds.), Learning, Training, and Development in Organizations. SIOP Frontiers Series, Erlbaum. Cooke, N. J., Gorman, J. C., & Rowe, L. J. (in press). An Ecological Perspective on Team Cognition. E. Salas, J. Goodwin, & C. S. Burke (Eds.), Team Effectiveness in Complex Organizations: Cross-disciplinary Perspectives and Approaches, SIOP Frontiers Series, Erlbaum Presentations 1999 Cooke, N. J. (1999), September. CERTT Lab. Poster presented at the technical group meeting of the Cognitive Engineering and Decision Making technical group at the 43rd annual meeting of the Human Factors and Ergonomics Society, Houston, TX. Cooke, N. J. (1999), April. Knowledge metrics for teams. Paper presented at the meeting of the Southwestern Psychological Association, Albuquerque, NM. Cooke, N. J., Rivera, K., Shope, S.M., & Caukwell, S. (1999), September. A synthetic task environment for team cognition research. Paper presented at the 43rd annual meeting of the Human Factors and Ergonomics Society, Houston, TX Cooke, N. J., Shope, S.M., & Rivera, K. (2000), August. Control of an uninhabited air vehicle: A synthetic task environment for teams. Demonstration presented at the 44th annual meeting of Cooke et al. 19 Team Coordination
34 the Human Factors and Ergonomics Society and International Ergonomics Association, San Diego, CA Cooke, N. J., & Bell, B. (2001), September. The CERTT Lab: Cognitive Engineering Research on Team Tasks. Poster presented at the first annual NMSU Research and Creative Activities Fair, Las Cruces, NM. Cooke, N. J., Kiekel, P. A., & Helm E. (2001), October. Comparing and validating measures of team knowledge. Paper presented at 45th annual meeting of the Human Factors and Ergonomics Society and International Ergonomics Association, Minneapolis, MN. Hottman, S.B., Jackson, J., Sortland, K., Witt, G., & Cooke, N.J. (2001), August. UAVs and air traffic controllers: Interface considerations. Paper presented at the AUVSI 2001 Annual Symposium of the Association for Unmanned Vehicle Systems International, Arlington, VA Cooke, N. J., & Shope, S. M. (2002), April. The CERTT-UAV Task: A Synthetic Task Environment to Facilitate Team Research. Paper presented at the Advanced Simulations Technologies Conference, San Diego, CA. Cooke, N. J., DeJoode, J, Gorman, J., Keith, R., Lee, S., & Pedersen, H. (2002), October. Team cognition and homeland defense. Poster presented at 46th annual meeting of the Human Factors and Ergonomics Society, Special AFOSR Acquisition and Retention of Team Coordination in Command-and-Control Page 18 poster session on Cognitive Engineering and Decision Making Applied to Homeland Defense, Baltimore, MD. Cooke, N. J., Kiekel, P. A., & Bell, B., & Salas, E. (2002), October. Addressing limitations of the measurement of team cognition. Paper presented at 46th annual meeting of the Human Factors and Ergonomics Society, Baltimore, MD Bell, B. G., & Cooke, N. J. (2003), October. Cognitive ability correlates of performance on a team task. Poster presented at 47th annual meeting of the Human Factors and Ergonomics Society, Denver, CO Gorman, J. C., Cooke, N. J., & Kiekel, P. A. (2004). Dynamical perspectives on team cognition. Proceedings of the Human Factors and Ergonomics Society 48th Annual Meeting Gorman, J. C., Cooke, N. J., Pedersen, H. K., Connor, O.O., & DeJoode, J. A. (2005), September. Coordinated awareness of situation by teams (CAST): Measuring team situation awareness of a communication glitch. Paper presented at 49th annual meeting of the Human Factors and Ergonomics Society, Orlando, FL. Pedersen, H. K., & Cooke, N. J. (2005), April. Team Coordination in UAV Operations. Paper presented at the International Symposium on Aviation Psychology, Oklahoma City, OK Gorman, J. C., Cooke, N. J., Pedersen, H. K., Winner, J. L., Andrews, D., & Amazeen, P. G. (2006), October. Changes in Team Composition After a break: Building adaptive command-andcontrol teams. Paper presented at 50th annual meeting of the Human Factors and Ergonomics Society, San Francisco, CA. Cooke, N. J. (2006), October. Human Factors of Remotely Operated Vehicles. Panel chaired at 50th annual meeting of the Human Factors and Ergonomics Society, San Francisco, CA. Cooke et al. 20 Team Coordination
35 Workshops and Invited Talks 1999 Cooke, N. J. & Shope, S. M. (1999), June. CERTT-UAV Task. Invited talk and demonstration presented at the Scaled Worlds Symposium, Athens, GA Cooke, N. J. (2001), October. Team Cognition: What Have We Learned? Paper presented at the Air Force Office of Scientific Research Workshop on Team Performance, Fairfax, VA. Cooke, N. J. (2001), December. Eliciting the Knowledge of Individuals and Teams. Invited talk presented at San Diego Center for Patient Safety, Visiting Professor Series, San Diego, CA. Cooke, N. J., & Shope, S. M. (2001), October. The CERTT-UAV Synthetic Task: Validity, Flexibility, Availability. Paper presented at the Air Force Office of Scientific Research Workshop on Team Performance, Fairfax, VA Cooke, N. J. (2002), October. Cognitive Task Analysis for Teams. On-line CTA Resource Seminar sponsored by Aptima and Office of Naval Research, US Positioning, Las Cruces, NM. Cooke, N. J. (2002), October. Diagnosing Team Performance Through Team Cognition. Paper presented at ONR-NMSU Workshop on New Directions in Cognitive Science, New Mexico State University, Las Cruces, NM. Cooke, N. J., Gorman, J., & Pedersen, H. (2002), November. My Favorite Ways to Measure Team Stuff. Paper presented at NASA HORM Workshop, Moffett Field, CA Cooke, N. J. (2003), August. Assessing Team Cognition. Invited Talk, Air Force Research Laboratory, Mesa, AZ. Cooke, N. J. (2003), August. Knowledge Elicitation Meets Team Cognition. Invited Talk, AFRL- Rome, Cognitive Systems Engineering Workshop, Hamilton, NY. Cooke, N.J. (2003), June. Assessing Team Cognition. Invited Talk, Los Alamos National Laboratory, Los Alamos, NM. Cooke, N.J. (2003), January. Measuring Collaborative Cognition. ONR Workshop on Collaborative Knowledge Management, College Park, MD Cooke, N. J. (2004), November. Design for Coordination and Control. National Academies of Science workshop on Scalable Interfaces for Air and Ground Military Robots, Washington, DC. Cooke, N. J. (2004), May. Command-and-Control Coordination: Cognitive Processing at the Team Level. Paper presented at Human-Technology Integration Colloquium Series, Air Force Research Laboratory, Human Effectiveness Directorate, WPAFB, Ohio. Cooke, N. J. (2004), May. Opening Session Overview. Human Factors of UAVs: Manning the Unmanned Workshop, Chandler, AZ. Cooke, N. J. (2004), March. Team cognition in distributed command-and-control. Paper presented at AFOSR Cognitive Decision Making Program Review Workshop, Chandler, AZ. Cooke, N. J. (2004), May. Team Cognition, Coordination, and Communication: Effects of Distributed Versus Co-located Environments. Invited Symposium. American Psychological Society 16 th Annual Convention, Chicago, IL. Cooke et al. 21 Team Coordination
36 Cooke, N. J. (2004), May. Team Coordination and UAV Operations. Human Factors of UAVs: Manning the Unmanned Workshop, Chandler, AZ. Cooke, N. J. (2004), December. Where s the Sharing in Shared Mental Models? Invited talk presented at ARI/UCF team workshop, Orlando, FL Cooke, N. J. (2005), April. Acquisition and Retention of Team Coordination in Command-and- Control: Data, Metrics, and Models. Paper presented at AFOSR Cognitive Decision Making Program Review Workshop, St. Augustine, FL. Cooke, N. J., Connor, O., & Pedersen, H. (2005), May. Acquisition and Retention of Team UAV Skills. Paper presented at the Second Annual Human Factors of UAVs Workshop, Mesa, AZ. Cooke, N.J. (2005), February. Emergent Team Cognition or What Was Wrong With The US Olympic Basketball Team? Colloquium presented at Texas Tech University, Lubbock, TX. Cooke, N.J. (2005), March. Emergent Team Cognition or What Was Wrong With The US Olympic Basketball Team? Colloquium presented at Georgia Tech University, Atlanta, GA. Cooke, N.J. (2005), April. Emergent Team Cognition or What Was Wrong With The US Olympic Basketball Team? Colloquium presented at North Dakota State University, Fargo, ND. Cooke, N.J. (2005), November. Human Factors of Homeland Security. Overview talk given at the Homeland Security Science Forum sponsored by Human Factors and Ergonomics Society and the Federation of Behavioral, Psychological, and Cognitive Sciences, Washington, DC Cooke, N. J. (2006), January. Designing for Collaboration. Invited talk at MIT s Humans and Technology Symposium, Cambridge, MA. Cooke, N. J. (2006), June. Designing for Collaboration. Invited talk at Ohio State University, Department of Industrial, Welding and Systems Engineering, Columbus, OH. Cooke, N. J. (2006), April. When mixed up teams are good teams: The Development of Coordination in Command and Control Teams. Paper presented at AFOSR Cognitive Decision Making Program Review Workshop, Dayton,OH Cognitive Engineering Research Institute Our research program in the CERTT Laboratory has also progressed through the formation of the Cognitive Engineering Research Institute (CERI), a not- for-profit, 501 (c3) research organization in Mesa, AZ affiliated with academic, government, and industry institutions including the Air Force Research Laboratory in Mesa, Arizona State University, Williams Gateway Airport, and Sandia Research Corporation. CERI s mission is to address problems of distributed sociotechnical systems through research, development, and ultimate commercialization facilitated through collaboration among the partners. CERI s plans entail the extension of much of the CERTT Lab work to other domains of command-and control (Emergency Response, Noncombatant Emergency Evacuation, Remote Medicine), additional synthetic task environments (Navy Multidisciplinary University Research Initiative (MURI) testbed for macrocognition, emergency response centers), and to the development of tools based on the cognitive and performance metrics. There are plans for growth in funding, partners, and research programs. This work was conducted with the support of AFOSR and AFRL through CERI (with a subcontract to ASU). Cooke et al. 22 Team Coordination
37 Figure 6. CERI Facility in Mesa, AZ Transitions Through our work funded by AFOSR and AFRL we have made many connections with other laboratories, with businesses, as well as with the operational community. Through a Cooperative Resesearch and Development Agreement (CRADA) between CERI and AFRL s Performance and Learning Models (PALM) Lab we have begun work on integrating an Adaptive Control of Thought-Rational (ACT-R) agent AVO into the CERTT UAV test bed. A project just funded by AFOSR/AFRL will extend resources to that project. In order to develop a natural language interface for the agent, however, communication data collected in the course of the project reported here are being examined. We can also leverage previous metric development work for that project and data indicating baseline performance for three-person human teams. We have also shared our data or aspects of our data with many individual investigators and have provided our metrics to other interested researchers. Another connection is between our AFOSR-funded work and the ONR (Mike Letsky s Collaborative Knowledge Interoperability program). We are funded by this ONR program to analyze communication patterns and interpret them in terms of macrocognitive processes. The work that has been conducted for ONR is now dovetailing with the AFOSR work in that our coordination metrics can benefit from the ONR communication flow patterns. The flow patterns are being examined using dynamical systems modeling (similar to the models reported here) to automatically code team coordination, ultimately replacing the experimenter who codes coordination manually in the studies reported here. CERI has also made extensive contacts with the operational UAV community through its annual Human Factors of UAVs Workshops. The presence of the operational community at the workshops has been of significant value to other attendees from academia and industry. In addition, the CERI team has made additional connections with Army operators at Ft. Huachuca, Air Force Predator operators at Creech Air Force Base, and Air National Guard operators in AZ. Cooke et al. 23 Team Coordination
38 3.3.9 Strengths and Weaknesses Through this project, we fill some gaps that we have perceived in our research program. CERTT s research program focused in the first six years on empirical research within the CERTT-UAV (Uninhabited Air Vehicle) synthetic task environment. The CERTT Lab has hosted seven AFOSR experiments with over 339 individuals as participants. Though our sample size is relatively small (5-20 teams per experiment), we collect an enormous amount of data from our participant teams in order to develop and evaluate metrics of team performance and cognition. So, CERTT s forte has been its ability to conduct well-controlled experimental research in a realistic command-and-control environment. CERTT has generated not only empirical findings but also a host of new and adapted methodologies and metrics for assessing team performance and cognition. Through the empirical work, we have also come a long way in terms of a theoretical framework for team cognition. The operational community has responded enthusiastically to CERTT s efforts. In recent meetings with Sgt. Major Raleigh Matthews of Ft. Huachuca it was noted that the lab provides or has the capability to provide answers to questions about UAV operations and training through empirical work and performance metrics; questions that are typically resolved through guesswork. Through CERI these strengths will extend to other domains of command-and control, additional synthetic task environments, and continue to develop tools based on the cognitive and performance metrics. CERI and CERTT, therefore, have significant capabilities for solving problems through empirical research. We have previously identified lack of modeling efforts as a weakness of our research program. As mentioned earlier, the effort reported here has strengthened CERTT s capabilities in modeling, specifically through dynamical systems modeling of coordination. We have seen the tremendous potential in a model of command-and-control coordination that could predict coordination loss or gains as factors such as team size, geographic dispersion, team member turnover, team member skill differences, or workload change. We are currently using our dynamical models to make predictions about the success of particular training interventions. We have also initiated work with AFRL s PALM Lab that would expand our modeling efforts through ACT-R modeling of an AVO Agent. This is in fact, one of the main thrusts in our newest AFOSR effort. We see great potential for examining team coordination through ACT-R cognitive modeling of the AVO agent. 3.4 Objectives of Current Effort ( ) In this effort we empirically studied and modeled the acquisition and retention of command-andcontrol coordination in the following objectives and tasks: OBJECTIVE 1: Derive procedural model and metric for team coordination in the context of the UAV-STE (Uninhabited Air Vehicle-Synthetic Task Environment). TASK 1.1: Based on previous data collected in the UAV-STE identify local points in the scenario that maximally discriminate team coordination skill TASK 1.2: Model procedural team coordination at those points TASK 1.3: Develop a metric of coordination skill based on this model Cooke et al. 24 Team Coordination
39 TASK 1.4: As existing data permit, interpret previously collected team data in light of new model-based metric TASK 1.5: Apply model-based metric to data collected in two experiments OBJECTIVE 2: Identify empirical acquisition and retention functions for team performance TASK 2.1: Collect team coordination data on 40 teams in the UAV-STE context in which Retention Interval length and team member ffamiliarity are manipulated TASK 2.2: Analyze data to identify acquisition and retention functions for performance (i.e., outcome) as well as coordination (i.e., target procedural metric) TASK 2.3: Analyze data on team process and cognition to identify correlates of acquisition and retention OBJECTIVE 3: Model development of team coordination in command-and-control using dynamical systems approach TASK 3.1: Apply dynamical systems approach to model the development of team coordination with team Familiarity and experience as control parameters TASK 3.2: Model empirical acquisition and retention functions derived in Task 2 using this approach TASK 3.3: Extend model as needed by including additional control parameters TASK 3.4: Make predictions based on the extended model regarding interventions to improve retention and test predictions in second experiment OBJECTIVE 4: Collect additional data to test model predictions regarding interventions to improve retention TASK 4.1: Design a retention study to test model predictions using 20 teams TASK 4.2: Collect team coordination data in the UAV-STE context and test model predictions TASK 4.3: Make recommendations for improved retention of team skill 3.5 Our Approach We investigated empirically and through modeling efforts, the acquisition and retention of team coordination in command-and-control. Our motivation for pursuing this line of research is theoretical, empirical, and pragmatic. From a theoretical perspective team coordination or the timely and adaptive sharing of information among team members, is an essential aspect of command-and-control team skill. Coordination may involve communication (i.e., explicit verbal coordination), but coordination can also take place via computer messaging, nonverbal communication and implicit coordination that involves anticipating another s information needs. We use the term coordination to refer to all forms of information sharing. Coordination has been cited in the literature as a critical team process behavior in addition to other process behaviors like situation assessment, leadership behaviors, and conflict management (Stout, Salas, & Carson, 1994). Further, based on our framework, team cognition is the integration of individual cognition through team process behaviors like coordination. We see these process behaviors as analogous to cognitive processing at the individual level. Thus, coordination (including communication for the purpose of coordinating) can be thought of as Cooke et al. 25 Team Coordination
40 cognitive processing at the team level. Understanding the acquisition and retention of coordination, therefore, is tantamount to understanding the development of team-level cognitive processing, a large part of team cognition. Little is known about the development of team cognition. From an empirical perspective, our previous CERTT UAV-STE studies suggest that team-level skills develop during the early missions (i.e., Missions 1-4). Because individuals have mastered their individual tasks prior to the first mission, we believe that what develops is team coordination. We also find that although taskwork knowledge is relatively stable immediately after training and prior to missions, teamwork knowledge (knowledge of who passes information to whom and when) changes in the course of mission experience. Further, coordination seems to play an important role in team performance. We find that distributed teams demonstrate different communication patterns compared to co-located teams and that team performance for these distributed teams is positively correlated with team process. Additionally, our ONR-funded work has capitalized on the importance of team communication, a primary means of coordinating in the UAV task, as well as the fact that team communication provides a natural think-aloud protocol. This work has resulted in discoveries of communication patterns that are predictive of performance (Kiekel, Cooke, Foltz, & Shope, 2001). Thus, we recognize in our studies the important role of team coordination in command-and-control and as reported below, have identified a gap in the literature when it comes to studies of the acquisition and retention of team-level skills. Finally, our pragmatic motivation for pursuing this line of work has to do with the nature of command-and-control teams. These teams are often formed on an as-needed basis and the delay between training and actual mission may be substantial. There are many practical questions that cannot be answered such as 1) How much retraining, if any is needed? 2) How long can team coordination skills persist without retraining? 3) What is lost (e.g., is it taskwork knowledge, teamwork knowledge, process skills)? 4)How can we train for maximum retention of team skill? In general, the more we know about the developmental course of team skill, the better equipped we will be to answer these kinds of questions. The ad hoc nature of command-and-control teams also means that teams may be composed on the fly and the team members that were together at training may not be the same team members together at the time of the mission. In emergency operation centers, for instance, team members may come together who are completely unfamiliar with each other. Knowing the idiosyncrasies of specific individuals likely facilitates team coordination, though it is not clear to what extent. Therefore, in the empirical work, we manipulate not only Retention Interval length, but also team member Familiarity (i.e., the individuals return for the second session with either the same people from the first session (intact) or different people (mixed). We investigated the acquisition and retention of team coordination in command-and-control tasks through integrated modeling and empirical efforts (see Figure 7). This project took place in the context of simulated Uninhabited Air Vehicle command-and-control, though we assume that the basic coordination process generalizes to other command-and-control settings. A procedural model of team coordination was developed and used to generate a model-based metric of team coordination. This metric was then applied to track coordination development in two Cooke et al. 26 Team Coordination

41 experiments. Results from the first experiment were used to guide the development of a dynamical systems model of the acquisition and retention of team coordination, which was then used to generate additional predictions that were tested empirically in a second experiment. The dynamical systems model, coupled with the empirical results, generated various implications for training command-and-control. ure Figure 7. Flowchart of integrated modeling and empirical effort. Although we develop models that are based on a combination of mathematical formalisms and empirical data, the military has explored more subjective or self-report based models for predicting skill retention (Bryant & Angel, 2001). These kinds of methods are relatively easy and inexpensive to implement, involving minimal training and no special equipment. However, there are biases inherent in self-report data compared to reports made by more objective observers. Without adequate safeguards, individuals can avoid training simply by claiming to have better retention than they actually do. Likewise, individuals could engage in unnecessary training by simply reporting a need. Therefore, we view this approach as an alternative or complement to qualitative models. The results of this effort contribute to the literature on team performance by providing data and models that speak to the acquisition and retention of team coordination. These data and models not only fill a gap in the literature, but contribute a theoretical foundation of team performance through a better understanding of how coordination develops in teams. From a pragmatic perspective, this research provides useful information and predictive tools for understanding command-and-control training needs, can improve team coordination through design and training interventions, and practical prescriptions for retraining command-and-control tasks. Cooke et al. 27 Team Coordination
42 4.0 PROGRESS UNDER THIS EFFORT 4.1 Background In the first experiment we explore retention and acquisition of team coordination skill in order to better understand team coordination development for purposes of training, but also in order to develop metrics and models of team coordination. Before presenting hypotheses we present background information that is relevant to the measuring and modeling of coordination and to the topic of acquisition and retention of a team skill Coordination and Models of Coordination Team coordination theory and models of coordination are intimately linked. Specifically, when one talks about a model of coordination they are also invoking a theory of coordination. In this section we will focus specifically on two different approaches to modeling coordination, and consequently two different theories of coordination. In the research presented in this technical report represents a synthesis of these two different approaches. The first approach is based on the procedural/stage theory of coordination. From this perspective the general definition of coordination is the attempt by multiple entities to act in concert in order to achieve a common goal by carrying out a script/plan they all understand (Klein, 2001, p. 70). The script/plan is essentially a recipe for an interdependent sequence of events to be carried out (Malone & Crowston, 1994). This is the procedural part of procedural/stage theory. The stage part of procedural/stage theory involves a sequence of discrete stages that a team moves through while coordinating. For example, Klein (2001) characterized these stages for the coordination of an air strike package. These stages included Preparation, Planning, Direction, Execution, and Assessment. Importantly some of these stages (e.g., Preparation, Planning) may be involved in the development of common script/plan for the procedure, and may occur though implicit coordination (e.g., via a shared mental model of the task; e.g., Entin & Serfaty, 1999; Stout, Cannon-Bowers, Salas, & Milanovich, 1999). Klein (2001) states that these stages are analogous to the four sequential strokes of a four-stroke gasoline engine. Following the analogy, these stages cycle anew each time a team coordinates. Therefore, given a repetitive task, this means the stages cycle once for each repetition of the task and a procedure is followed from start to finish for each repetition of the task. In light of this, deviations from the normative script/plan procedure for each repetition of a task are modeled as independent (and usually random) deviations in this approach (e.g., Klienman, Luh, Pattipati, & Serfaty, 1992; Wang, Kleinman, & Luh, 2001). This modeling assumption has been challenged by the dynamical systems approach to team coordination (Gorman, 2006). Unlike the four-stroke engine metaphor, the dynamical systems approach to modeling coordination characterizes coordination as an open self-organizing system. Self-organization entails that there is no a priori script/plan or procedure that organizes coordination. In fact, there is no need for a script/plan held in the heads of team members (e.g., Camazine, et al., 2003). Cooke et al. 28 Team Coordination
43 Rather, coordination emerges from the interplay between team interactions and the fluctuations of the task environment, while performing the team function, where the system (team + task environment) is open with respect to intrinsic (team) and extrinsic (task) inputs, including perturbations. Equilibrium states in open systems correspond to temporally extended modes of coordination (Kelso, 1995). For instance, a particular mode of coordination is comprised of bottom-up processes operating on shorter timescales and top-down processes operating on longer timescales that provide a context for the shorter-range bottom-up processes. This circular causality, of nested processes operating on different timescales, is a hallmark of selforganized coordination, and the dynamical systems approach to coordination in general. The open system aspect of the dynamical systems approach, along with temporally extended patterning, and nested processes have been cited as reasons for the dynamical approach to team coordination being an outside the head approach to team cognition (Cooke, Gorman, & Kiekel, under revision). Returning to the procedural/stage theory of coordination, the four-stroke engine metaphor does not work well for the dynamical systems approach to coordination in part because it does not allow stages to be nested; i.e., each of the four strokes must take place before the coordinative task is repeated. The research presented in this technical report represents a synthesis of the procedural/stage theory of coordination and the dynamical systems approach to coordination. Specifically, for the repetitive task of photographing UAV ground targets we measured coordination as deviations from a procedural model of coordination. This aspect of our work is very similar to the procedural part of procedural/stage theory. In addition, using the dynamical systems approach we modeled the temporally extended properties of these procedural deviations. By synthesizing these two theoretical approaches to modeling coordination we sought to identify how procedural aspects of taking photographs of UAV ground targets fluctuate with respect to experimental manipulations, including length of a Retention Interval and training regime, and how long-range patterns differ for teams under different experimental conditions Dynamical Systems Modeling Dynamical systems theory (DST) has been applied to understand a variety of different phenomena. For example, research in neuroscience and cognition (e.g., Favorov, Hester, Lao, & Tommerdahl, 2002; Bressler & Kelso, 2001; Van Orden & Holden, 2002; Van Orden, Pennington, & Stone, 2001), human limb coordination and movement (e.g., Amazeen, Amazeen, & Turvey, 1998a; Amazeen, Amazeen, & Turvey, 1998b; Bardy, Oullier, Bootsma, & Stoffregen, 2002; Kelso, 1995; Schmidt, Bienvenu, Fitzpatrick, & Amazeen, 1998; Turvey, 1990), mental illness (Paulus, Rapaport, & Braff, 2001), and substance abuse (Warren, Hawkins, & Sprott, 2003) are among the areas in which researchers apply DST. In social and personality psychology, researchers are investigating a variety of phenomena using DST (Vallacher, Read, & Nowak, 2002). Self-organization is often evident in interpersonal interactions (Baron, Amazeen, & Beek, 1994; Carver & Scheier, 2002). For instance, a purposive action that differs from the intended action emerges in a bottom- up process of social selforganization among individuals. In another example from the social psychological literature, Latane, Nowak, and Liu (as cited in Latane and Nowak, 1994) found that, without outside influence, group attitudes self-organized to form locally coherent groups. In this study, the size of the minority was reduced from 30% to 16% after social influence. Research on the dynamics of group tasks indicates that self-organization occurs when the task is not too difficult, especially Cooke et al. 29 Team Coordination
44 when the participants have the opportunity to practice the task (Guastello, 2000). DST research is also applied in social psychological studies of dyads and group socialization (Baron et al., 1994), dyadic systems (Shoda, LeeTiernan, & Mischel, 2002), leadership emergence (Zaror & Guastello, 2000), and social norms (Kenrick, Li, & Butner, 2000). We believe that dynamical systems theory provides a promising framework for modeling the complex information transfer that occurs in command-and-control teams. Following is a generic overview of dynamical systems modeling. Broadly, a dynamical system is any system whose behavior changes over time. The goal of dynamical systems modeling is to describe and predict behavior over time. Modeling a dynamical system involves describing how a dynamical system evolves, in order to make predictions about system evolution under different conditions. A dynamical system is usually modeled using either differential equations or a corresponding potential well representation. Formally, a dynamical system is a velocity vector field that, when integrated, describes trajectories on a continuous manifold (the phase space ). A velocity vector is the derivative of a position with respect to time taken at any possible coordinate on the manifold. The velocity vectors underlie trajectories that are in turn descriptions of where the system will move (for example a particle) over a given change in time. The velocity vector field underlies a family of trajectories, or solutions, of the dynamical system. An example is the differential equation that models exponential growth: dx/dt = rx; where, r = growth rate and x = population size. The family of solutions to this system is: x (t) = Ce rt ; where C is a constant that is extrinsic to the system (e.g., an initial condition on the evolution of rx). A family of solutions for some parameter value of r therefore results in a family of solutions (trajectories), one for any constant C. These solutions describe possible trajectories. In more complex dynamical systems the qualitative nature of trajectories changes as a continuous scaling of system-level parameters, which in the growth model is only r. Qualitative changes in the nature of trajectories with changes in a control parameter, here r defines the states of a dynamical system. Because a dynamical system is defined on a continuous manifold however, the state space is also theoretically continuous. States are described by basins of attraction and are separated from one another by separatrices. Basins of attraction are made up of trajectories that converge over time (e.g., dx 2 /d 2 t < 0). Attractors are associated with the concept of stabile states. Because there are generally basins of attraction on either side of a separatrix, the trajectories on either side of the separatrix will appear to diverge since they are converging on different basins of attraction. Separatrices are associated with the concept of instabilities. Most dynamical systems are made up of combinations of attractor basins with separatrices in between. However some dynamical systems also have repellors. Repellors are similar to basins of attraction in that they can be isolated by separatrices, repellors are similar to separatrices because they are associated with instability and diverging trajectories (e.g., dx 2 /d 2 t > 0). Combinations of attractors and repellors can lead to complex dynamics, including chaos. Finally, most dynamical systems are deterministic, but they can also be described using stochastic differential equations when fluctuations due to an underdetermined source need to be modeled (Oksendal, 2000). Cooke et al. 30 Team Coordination
45 4.1.3 Acquisition and Retention of Team Coordination Skill One of the earliest studies of skill acquisition was conducted by Bryan and Harter (1897). Apprentice telegraphers practiced coding single letters in which after 15 weeks, no more improvements were produced. From then on, they were allowed to practice whole words, producing an increase in performance and eventually leading to the development of automaticity. Other early studies have also focused on the effects of practice in skill acquisition. For example, Crossman (1959) explored cigar making skills in a factory for a period of ten years and found that time to produce cigars followed the power-law function such that within five years, workers would no longer improve due to the fact that they were working as fast as the machinery would operate. Most interestingly, such findings point to the notion that physical limits may curtail cognitive skill acquisition (Anderson, 1995). In these early efforts Fitts and Posner (1967) identified three stages of skill acquisition--cognitive, associative, and autonomous which have held across modern studies of skill acquisition. Current research on skill acquisition ranges from the investigation of the effects of nefazodone on the acquisition of psychotherapy skills (Manber et al., 2003) and the acquisition of skill among those suffering from Alzheimer s disease (Dick, Hsieh, Bricker, & Dick-Muehlke, 2003) to the testing of acquisition of athletic skills such as dribbling a basketball (Perkos, Theodorakis, & Chroni, 2002) and exploring the links between acquisition and intention in sports (Seiler, 2000). Current applied efforts in this area are equally varied. For example, Mead and Fisk (1998) studied the effects of age and training in learning how to operate an automated teller machine, and Christoffersen, Hunter, and Vicente (1996) studied the acquisition of different interface designs in the simulated control of a power plant. Research is also strong in aviation where recent efforts include the study of individual differences in learning air traffic control tasks (Taatgen, 2001) and transfer effects in simulated flight control systems (Atkins, Lansdowne, Pfister, & Provost, 2002). One of the earliest studies of memory retention and loss was published by Ebbinghaus in 1885 (Ebbinghaus, 1913). In what was the first experimentally structured investigation of the subject, Ebbinghaus studied the retention and loss of nonsense syllables. In the spirit of Ebbinghaus, others have investigated long-term retention of memories. Bahrick (1984) examined intervals of up to 50 years in a study of retention of the Spanish language learned in high school. He found that people who had learned more, retained more. Most importantly, he also found that knowledge declined exponentially for the first three to six years after initial learning, only for retention to stabilize with little loss for up to 30 years thereafter. Rubin, Wetzler, and Nebes (1986) examined word cueing and memories and found that elicited memories declined as a function of the age of those memories. Strong emotional ties however, led to higher recall rates for memories recalled from periods between years of age (Cohen & Faulkner, 1988a). Laboratory research has also ventured beyond retention of nonsense syllables to examine retention of visual search skill. Fisk and Hodge (1992) explored retention of skilled search using an interval of one year and Cooke, Durso, and Schvaneveldt (1994) demonstrated retention of visual search over a nine-year interval. In addition, some natural applications of retention and loss concepts have resulted in studies of the retention of other kinds of learned skills. More recent research efforts range from investigating the effects of donepezil (used to treat Cooke et al. 31 Team Coordination
46 Alzheimer s patients) on participants retention of flight simulator skills (Yesavage et al., 2002) to testing the retention of skills learned in the operation of a computer simulated spacecraft in the context of procedure based vs. system based (low-level learning of procedures vs. high-level system learning) training (Sauer, Hockey, & Wastell, 2000). Knowledge about retention and loss is also applicable to military domains. Hagman and Rose (1983) discuss various tasks performed in operational environments and factors relevant to enhancing retention. The Army Research Institute has investigated retention and capacity for relearning training of various skills such as weapon maintenance and reaction to biological/chemical threats. Such research has lead to the development of training aids for use by instructors which allows for the rapid identification of tasks that may require more re-learning due to low retention (Sabol & Wisher, 2001; Wisher, Sabol, & Ellis, 1999). Although skill retention is often accurate and automatic even after extended periods of time, the airline industry has also expressed interest in retention of skills (i.e. recovery in emergencies) such that training is required at regular intervals (Wickens, 1992). However, little has been done in the field of aviation, as most research in that domain tends to focus on transfer of training rather than retention. Finally, Rose (1989) identified four variables that influence skill retention in real world applications: 1) the retention interval, 2) degree of over-learning, 3) task type, and 4) individual differences. In short, continued practice reduces forgetting and automates tasks and tasks that involve perceptual- motor skills show little degradation over time in comparison to procedural task skills (i.e. tasks involving a checklist), which are rapidly forgotten. Lastly, slow learners show less retention than fast learners, which may be related to skill at chunking in short-term memory. Current efforts in skill acquisition also involve modeling. For example, Taatgen (2001) has investigated the use of ACT-R modeling on ATC tasks and Wisher, Sabol, and Kern (1995) developed a model of Morse code acquisition in Army soldiers. Doane and Sohn (2000) have also developed a modeling technique called ADAPT in which novice and expert pilots execution of flight maneuvers are predicted from eye fixations and control movements. ADAPT is hypothesized to be useful in aiding acquisition by pointing to areas in need of improvement. A dynamical system modeling approach has also been applied to the acquisition of motor skill (e.g., Amazeen, 2002; Kelso & Zanone, 2002; Zanone & Kelso, 1992; 1997). Despite this relatively large body of work on skill acquisition, a review of the literature reveals that very little research has been done on skill acquisition at the team level. Do teams demonstrate the same types of acquisition and retention functions as individuals? A few studies do exist. Cooke et al. (2001b) evaluated team performance and cognition during the acquisition of a complex UAV ground control task and found that teams achieved asymptotic levels of performance after four 40-minute missions. Another effort involved the team training of stress exposure (due to environment, time pressure, etc.) such that through over-learning, teams working in high stress conditions are ultimately able to maintain effective performance under duress (Driskell & Johnston, 1998). Largely for pragmatic reasons of bringing groups of trained participants back into the laboratory after some delay, there has been relatively little work on the retention of a team s skills. Similarly, there has also no published work on team retention for intact versus mixed teams. Cooke et al. 32 Team Coordination
47 In summary, although the scientific community has investigated the topic of skill acquisition, largely for pragmatic reasons, there has been little work on retention of that skill. Even less is known about acquisition of a team skill such as coordination and virtually nothing is known about retention of a team skill or the effects of changes in Team Composition on retention. Thus, the research reported here on acquisition and retention of team skill can fill gaps in the literatures on team performance and skill acquisition and retention Background Summary Part of the impetus for this project is to fill a gap in the training literature that is important for application. That gap centers on the acquisition and retention of a team skill in this case team coordination. Although there is literature on acquisition and retention of individual skills from which we formulate our hypotheses in the following section, there is very little on team skills. There is also virtually no information on the other variable of applied interest, intact versus mixed teams. Further, because it is not a meaningful dimension at the individual level, our hypotheses on this Team Composition factor are necessarily more exploratory. Our approach to coordination modeling is a hybrid one which draws from both procedural models of coordination and dynamical systems models. Our metric of team coordination is based on deviations from a procedural model at UAV target waypoints. Events pertinent to the model were collected in the context of the simulated missions. Later a dynamical systems approach is applied to temporally extended patterns of procedural variation Experiment 1: Acquisition and Retention of Team Coordination with Mixed and Intact Teams We conducted an experiment using the CERTT lab s UAV-STE to examine acquisition and retention functions associated with the development of team coordination (i.e., timely and adaptive sharing of information). Retention Interval Length and Team Composition (i.e., the teams in the first session are made up of the same or different people as in the second session) were manipulated in order to examine their effects on team coordination, as well as team performance (i.e., outcomes) and team cognition. Acquisition and retention functions identified in Experiment 1 that are relevant to the development of team coordination served as input to a dynamical systems model of the development of team coordination. Expected results are based on the assumptions stated previously regarding factors associated with skill retention and team coordination as well as our theoretical views concerning the relation between team cognition, process, and performance. H1.1 Teams in the long-retention Interval condition will demonstrate coordination, process, performance and cognitive deficits compared to teams in the short-retention Interval condition. H1.2 Teams in the mixed condition (i.e., new teammates) will demonstrate coordination, process, performance and cognitive deficits compared to teams in the intact condition resulting in poorer overall performance. Cooke et al. 33 Team Coordination
48 H1.3. Retention Interval and Team Composition should interact, whereby the deleterious effects of changes in team membership (on coordination, performance, etc.) are more severe at the short Retention Interval compared to long. This is predicted based on the assumption that team member familiarity will decline with time so that the advantage of familiar versus unfamiliar team members will be greatest in the short Retention Interval condition Experiment 1: Method Participants Forty-five three-person teams of individuals from ASU and the surrounding local community (135 individuals) voluntarily participated in one 6.5 hour session and a second 3.5 hour session which was scheduled either 3-6 or weeks after the first session. Individuals were assigned to teams in one of four conditions: long-mixed, long-intact, short-mixed, short-intact. The participants were randomly assigned to role (AVO, PLO, or DEMPC). Assignment of individuals to teams, Team Composition level, and Retention Interval Length was random within major scheduling constraints. That is, the Long interval teams were run early in the study to accommodate students later in the semester as well as to build up a pool of participants in which to mix for the second session. Short interval teams were run later in the experiment because participants would return only 3-6 weeks later. Long-intact and short-intact teams signed up for the second session immediately after the first session with the team agreeing on the time and day they would return. Individual team members in the long-mixed, and short-mixed teams, after completing the first session, indicated the times and days after the Retention Interval they would be able to return for the second session. When all long-mixed and short-mixed teams were run through the first session, the teams were decomposed and randomly assembled into new teams such that individual team members were unfamiliar with each other. Each individual team member retained the roles they were assigned in Session 1. These newly formed teams were then contacted and scheduled for Session 2 before the Retention Interval expired. Of the 45 teams, five did not return for the second experimental session due to fact that one or more of the teams members had a scheduling conflict. Three of these teams had been assigned to the short-mixed treatment group and two had been assigned to the long-mixed treatment group. Therefore there were data for 45 teams in Session 1, but only 40 for Session 2. In addition, there were two teams identified as outliers on the basis of Session 1 performance data. One of these teams (in the long-intact condition) was eliminated from the entire data set. The other, a short-mixed team, was eliminated from consideration in Session 1, but the team members went on to three new teams in Session 2. Therefore removal of the outliers resulted in 43 Session 1 teams (10, 9, 12, and 12 teams in the short-intact, long-intact, short-mixed, and long-mixed treatment groups, respectively) and 39 Session 2 teams (10, 9, 10, and 10 teams in the short-intact, long-intact, short-mixed, and long-mixed treatment groups, respectively). Individuals were compensated for their participation by payment of $10.00 per person per hour with each of the three team-members on the highest (average) performing team for the first Cooke et al. 34 Team Coordination
49 session receiving a $ bonus. Most of the participants were Caucasian (81%) with males representing 71% of the sample. Participants ranged in age from 18 to 58. The average age was Equipment and Materials The experiment took place in the CERTT Lab configured for the UAV-STE (described earlier). Each participant was seated at a workstation consisting of two computer monitors (one View Sonic monitor connected to an IBM PC 300PL, and one Dell Trinitron monitor connected to a Dell Precision 220 PC), and a Sony video monitor that presented text messages for the situation awareness (SA) Roadblocks, two keyboards, and a mouse for input. Participants communicated with each other and the experimenters using David Clark headsets and a custom-built intercom system designed to log speaker identity and time information. The intercom enabled participants to select one or more listeners by pressing push-to-talk buttons. Two experimenters were seated in a separate adjoining room at an experimenter control station consisting of Four Dell Precision 220 PCs and Dell Trinitron monitors, an IBM PC computer and Panasonic monitor, two Panasonic monitors for viewing video output, and two Sony monitors for video feed from ceiling mounted Toshiba CCD cameras located behind each participant. From the experimenter workstation, the experimenters could start and stop the mission, query participants together or individually, administer situation awareness roadblocks, log team member coordination, monitor the mission-relevant displays, select any of the computer screens to monitor using a Hall Research Technologies keyboard video mouse (KVM) matrix switch, observe team behavior through camera and audio input, and enter time-stamped observations. A Javelin Systems Quad Splitter allowed for video input from each of the four cameras to be displayed simultaneously on the monitor and was recorded on another Quasar VCR. In addition, a video overlay unit was used to superimpose team number, date, and real-time mission information on the video. Audio data was also recorded to the VCR. Furthermore, custom software recorded communication events in terms of speaker, listener, and the interval in which the push-to-talk button was depressed. A Radio Design Lab audio matrix also enabled experimenters to control the status of all lines of communication. Custom software was developed to conduct tests on information in the Powerpoint tutorials, to collect individual and consensus taskwork relatedness ratings, collect individual and consensus teamwork knowledge, and to collect demographics and preference data at debriefing (see Appendix E for debriefing questions). New to this study was the development of a custom coordination logger. An experimenter would monitor all communications between participants and log coordination and information passing between participants at each target. In addition, the administration of newly developed CAST SA roadblocks described below, required the development of custom PDF forms which experimenters used to record and log key elements of each event. One SA roadblock simulated a camera glitch in which the PLO s camera was temporarily disabled. This required the addition of a take-control switch at the experimenter workstation to disable the PLO s mouse. Cooke et al. 35 Team Coordination
50 In addition to software, some mission-support materials (i.e. rules-at-a-glance for each position, two screen shots per station corresponding to that station's computer displays, and examples of good and bad photos for the PLO) were presented on paper at the appropriate workstation. Other paper materials consisted of consent forms, debriefing forms, and checklists (i.e. set-up, data archiving and skills training) Measures Performance, knowledge measures (taskwork and teamwork), and team process behaviors (including CAST situation awareness and coordination ratings) served as dependent measures in this study, in addition to a coordination metric developed as part of this project. Demographic items, video records, and communication records were also collected. In this section these measures are described with the exception of the coordination metric which is described in Section Team Performance Team performance was measured using a composite score based on the result of mission variables including time each individual spent in an alarm state, time each individual spent in a warning state, rate with which critical waypoints were acquired, and the rate with which targets were successfully photographed. Penalty points for each of these components were weighted a priori in accord with importance to the task and subtracted from a maximum score of Team performance data were collected for each of the seven missions. Each individual role within a team (AVO, PLO and DEMPC) also had a composite score based on various mission variables including time spent in alarm or warning state as well as variables that were unique to that role. Penalty points for each of the components were weighted a priori in accord with importance to the task and subtracted from a maximum score of The most important components for the AVO were time spent in alarm state and course deviations, for the DEMPC they were critical waypoints missed and route planning errors, and for the PLO, duplicate good photos, time spent in an alarm state, and number of bad photos were the most important components. Individual performance data for a role were collected for each of the seven missions. This team performance measure has been used in previous CERTT studies and was modified in the last effort (Cooke, et al., 2004) in order to take into account workload differences in scenarios. For example, the new team performance metric, which is based on rate of performance, does not penalize teams for photographing a smaller proportion of targets in the high workload missions (e.g., 12 out of 20 targets) despite the improvement from the low workload missions (e.g., 9 out of 9 targets). Appendix A shows the weighting scheme used for each component of the team and individual role performance metrics Team Knowledge Team Knowledge of Taskwork. Taskwork knowledge was assessed through a rating task. The taskwork ratings consisted of eleven task related terms: altitude, focus, zoom, effective radius, ROZ entry, target, airspeed, shutter speed, fuel, mission time, and photos. These task related Cooke et al. 36 Team Coordination
51 terms formed 55 concept pairs, which were presented in one direction only, one pair at a time. Pair order was randomized and order within pairs was counterbalanced across participants. Team members made relatedness ratings of the 55 concept pairs on a six-point scale that ranged from unrelated to highly-related. By submitting these ratings to Knowledge Network Organization Tool (KNOT), using parameters r = infinity and q = n-1, an individual Pathfinder network (Schvaneveldt, 1990) was derived for each of the team members. These networks reduce and represent the rating data in a graph structure with concept nodes standing for terms and links standing for associations between terms. The individual taskwork networks were scored against a key representing overall knowledge, and against role-specific keys. In this way, measures of role or positional accuracy, as well as interpositional accuracy could be determined. The referent networks were based on data from the highest scoring individuals or teams in our previous studies. See Appendix B for overall and positional referent networks and the approach that was used to derive these networks. The accuracy of an individual s knowledge was determined by comparing each individual network to empirical referents associated with knowledge relevant to the respective roles and overall knowledge. Network similarities were computed that ranged from 0 to 1 and represented the proportion of shared links between the two networks (based on the Pathfinder similarity metric). Using this similarity metric, three accuracy values were computed for each team member. Overall accuracy is the similarity between the individual network and the overall knowledge referent. Positional (role) accuracy is the similarity between the individual s network and the referent network associated with that individual s role. Interpositional accuracy is the average of the similarity between the individual s network and the referent networks of the two other roles. These three accuracy values were averaged across all team members to give a final overall, positional and interpositional accuracy score for each team. It should be noted that prior to averaging similarity values to calculate positional and interpositional accuracy scores for the team, positional and interpositional scores for each team member were standardized, as team positional and interpositional accuracy scores are made up of individual scores based on different referents. Intrateam similarity was scored on the same scale as accuracy and ranged from 0 to 1. An individual s network was compared to another team member s network and assigned a similarity value. This was done until all three team members had been compared to one another (i.e. AVO- PLO, AVO-DEMPC, and PLO-DEMPC). Intrateam similarity was computed by averaging the three similarity values measured using the proportion of shared links for all intrateam pairs of two individual networks (i.e. the mean of the three pairwise similarity values across the three networks). Taskwork consensus ratings consisted of the same pairs as taskwork ratings (randomly presented); however the team entered a rating for each pair. For each pair, the rating entered in the prior session by each team member was displayed on the computer screen of that team member. The three team members discussed each pair over their headsets until consensus was reached. As a team, the individuals had to agree on relatedness ratings for the concepts. The team Cooke et al. 37 Team Coordination
52 ratings were submitted to Pathfinder network scaling. The holistic accuracy score is the similarity value between the team s network and the overall referent network. From their answers, a team knowledge network was developed and compared to the overall knowledge referent. Team Knowledge of Teamwork Teamwork knowledge was assessed using a teamwork questionnaire (Appendix C). The teamwork questionnaire consisted of a scenario in which each individual participant was required to indicate which of sixteen specific communications were absolutely necessary in order to achieve the scenario goal. To calculate each individual s overall accuracy, the responses were compared to an answer key, which classified each of the 16 communications into one of the following categories: (1) the communication is NEVER absolutely necessary to complete the scenario goal; (2) the communication could POSSIBLY be necessary to complete the scenario goal (e.g., as considered by novices); or (3) the communication is ALWAYS absolutely necessary to complete the scenario goal. Each communication was worth 2 points, which yielded a maximum of 32 points possible per team member. Participants either checked each communication, indicating that it was absolutely necessary to complete the scenario goal or left it blank, indicating that it wasn't absolutely necessary. The table below illustrates how the questionnaires were scored. A perfect score was achieved by only checking those communications that were ALWAYS absolutely necessary and leaving all other communications blank. Team overall knowledge was the mean of the three team members overall accuracy scores. Table 3 Points Assigned to Responses on the Teamwork Questionnaire Truth If Participant Checked If Participant Left Item Response Blank Never Necessary 0 points given 2 points given Possibly Necessary 1 point given 2 points given Always Necessary 2 points given 0 points given Using the same scoring scheme, individual team member responses to the teamwork questionnaire were also scored against role-specific keys. In particular, role or positional accuracy, as well as interpositional accuracy (i.e., interpositional knowledge or knowledge of roles other than his or her own) was determined. Role or positional knowledge accuracy was determined by comparing each individual s responses to the role-specific key. To score positional knowledge accuracy, each role-specific key was used to compare each individual s responses to the subset of the items on the questionnaire specific to his/her role. For example, the key for AVO positional knowledge did not take into consideration five items on the questionnaire that asked about communications between PLO and DEMPC. Therefore, the maximum score for AVO positional knowledge accuracy was 22 (i.e., 11 questionnaire items worth 2 points each). The maximum scores for PLO and DEMPC positional knowledge accuracy were 20 and 22, respectively. Scores were converted into proportion of points and proportions were averaged across the three team members to derive a positional accuracy score for the team. Cooke et al. 38 Team Coordination
53 For each role, interpositional knowledge was scored against those items on each key not used in scoring positional knowledge. For example, the accuracy of AVO s responses on the teamwork questionnaire to those 5 items involving communications between the PLO and DEMPC constituted his/her score for interpositional knowledge. Since each response is worth 2 points, the AVO interpositional knowledge maximum is 10. The maximum scores for PLO and DEMPC interpositional knowledge accuracy scores were 12 and 10, respectively. Scores were converted into proportion of points and proportions were averaged across the three team members to derive an interpositional accuracy score for the team. Intra-team similarity was also computed by comparing responses from all 3 participants and assigning a point to every response that all the team members had in common. A maximum of 16 points were possible where a higher score indicates that more of the team members responses were identical. The teamwork consensus ratings were administered in the same manner as the teamwork ratings, but were completed on a team level where team members discussed their answers over the headsets until a consensus was reached. In this manner, each team was scored for holistic accuracy on the teamwork variable, for a maximum score of Team Process Team coordination log. The team coordination logger is a custom-developed software tool that allows for the recording and time stamping of team coordination events in the CERTT Lab UAV-STE. This measure is based on the procedural model and incorporates key communication events that occur at each target: Whether the DEMPC informed the AVO and PLO of upcoming targets (e.g., restrictions, effective radius), whether the DEMPC was given information by the AVO or PLO, whether the PLO and AVO negotiated airspeed and altitude at the target, and whether the AVO was told by the PLO that the photograph taken at the target was acceptable (thus indicating to the AVO that the team is clear to move to the next waypoint). Experimenters were also able to indicate if a particular communication event did not occur, if a packet of information was re-passed, if they were not sure a particular event occurred (in order to review the videotape and make confirmations that the event in question did or did not occur), and make comments at each particular target. The experimenter logged events in real-time while remotely observing the team and listening to the audio. Each time an observation was logged it was associated with a time stamp. In addition, team coordination ratings described in the next section were entered using this software. Cooke et al. 39 Team Coordination

54 Figure 8. Coordination Logger interface used in Experiment 1. Team coordination rating. Team coordination was scored by consensus between the two experimenters. For each target, the experimenters observed team behavior based on the key coordination events recorded on the coordination logger. The experimenters rated process on a scale ranging from 0 to 4 with 4 indicating excellent process and 0 indicating poor process. The rating was based on the timing of communications, number of repeated communications, situation awareness behaviors, and whether the team followed and included all elements of the procedural model for that particular target. Coordinated Awareness of Situation by Teams (CAST). CAST is a method for measuring team situation awareness developed in the CERTT Lab. This measure is taken on three levels, wherein the team responds to some unusual circumstance, or a CAST roadblock. A roadblock is defined experimentally as any manipulation introduced during the course of performance that can result in performance decrement if not successfully coordinated and acted upon by the team. CAST measures the coordinated perception and action of a team responding to a roadblock. Roadblocks are driven by events that take place within the scenario (e.g., a roadblock is inserted after entry into a particular waypoint). The specific CAST roadblocks used in Experiment 1 are shown in Appendix D. The first part of the CAST measure is firsthand perception who responds independently to the unusual circumstance; the second is coordinated perception which team members tell other Cooke et al. 40 Team Coordination
 according to an optimal response with respect to a roadblock manipulation. A non-response is zero, whereas a response is 1.")
, or it could be a six element vector (the number of possible communication channels) for shared perspectives (i.")
55 team members of their experience; the third is coordinated action given the roadblock, how does the team address it? Each of these levels can be coded (by an experimenter) according to an optimal response with respect to a roadblock manipulation. A non-response is zero, whereas a response is 1. According to different channels of communication (e.g., AVO PLO), a response can be coded as 1 if the channel is employed with respect to the roadblock, or 0 if the channel is NOT employed with respect to the roadblock. In our case we have a three member team, so an optimal response would either be a three element vector for unique perspectives (i.e., action or not with respect to each team member), or it could be a six element vector (the number of possible communication channels) for shared perspectives (i.e., [AVO PLO AVO DEM PLO AVO PLO DEM DEM AVO DEM PLO]). Each element of the observed vector can then be compared to an optimal vector determined by expert judgment. The 1 s and 0 s are coded as hits and false alarms according to signal detection theory. In this analysis, we report CAST observations across firsthand, coordinated perception, and coordinated action levels, although any level could be analyzed individually. Here is a brief example: Step 1: Identification of Optimum and Scoring. Figure 9. Instructions to the experimenter regarding CAST roadblock timing and placement. Figure 10. Experimenter score sheet for roadblock in Figure 9. In this optimal example the scoring is divided into two parts, Stage 1. Perceive and Stage 2. Act. Perception involves Cooke et al. 41 Team Coordination
56 mutual identification of a roadblock and act involves steps taken to counteract the roadblock. In this example the AVO and DEMPC each perceive a different aspect of the roadblock as illustrated in Figure 10. This is recorded under Perceived Only. Optimally, the AVO coordinates this firsthand perception to the DEMPC who coordinates his firsthand perception to PLO. This is recorded under Coordinated Perception. Finally, the AVO changes the altitude, allowing PLO to set the correct focus and take the picture. This is recorded under Act. The score sheet in Figure 10 can be coded as follows: Using the abbreviations, A AVO, P PLO, and D DEMPC, create a vector with 15 binary elements representing presence or absence of behavior by a particular team member in accordance with the check boxes in Figure 10: Firsthand perception: [APD] Coordinated perception: [A P A D P A P D D A D P] Coordinated action: [A P A D P A P D D A D P] Thus, an observation would look something like: [ ], where the bars are used to separate the three CAST components. In the optimal example of Figure 10: For firsthand perception, optimal response is [1 0 1] For coordinated perception, optimal response is [ ] For coordinated action, optimal response is [ ] If for coordinated perception two different teams provide the following observed values A = [ ] and B = [ ], then this would indicate that, at this roadblock, Team A displayed twice as many interactions as Team B. The following step illustrates the application of signal detection analysis to CAST scoring: Step 2. Calculate proportion hits and proportion false alarms relative to optimal. Taking just the coordinated perception optimal response ([ ]) it can be seen that there are two possible hits and four possible false alarms. For the proportion of hits we sum the elements in positions 2 and 5 from the observed vectors and divide by 2: A 2/2 = 1 and B 0/2 = 0. For the proportion of false alarms we sum the elements in the other positions and divide by 4: A 2/4 =.5 and B 2/4 =.5. So for A and B, we have a proportion of hits and a proportion of false alarms. (For comparison, if we observe another vector, [ ], then the proportion of hits is 2/2 = 1 and the proportion of false alarms is 0/4 = 0.) Team situation awareness (TSA) is reflected in high hit rate coupled with low false alarm rate in response to a roadblock. Taking this procedure to the next level, the full 15-element vector can be compared Cooke et al. 42 Team Coordination
57 to optimal for an overall CAST score. The full vector procedure was used for the CAST scores in the analyses that follow. CAST data were collected for every mission of the experiment Debriefing Questions We administered a series of questions at the end of the study to assess various constructs such as retention as well as to collect demographic information. A set of questions also asked participants about their experiences as a participant such as whether they enjoyed the study, liked working with other members of the team, performed well on the task, and how they felt about other members of their team. Participants were also asked about how they performed after the Retention Interval. The complete set of questions for each of the two studies can be found in Appendices E and F for Experiments 1 and 2, respectively Personality Survey As a secondary question, we were interested in the impact of individual team member personality on team performance and how team interactions learned in the context of one team might carry over to another team. Specifically, we wondered if dysfunctional team behavior resulting from the presence in Session 1 of a team member with unique personality characteristics would transfer to new teams that host one of the non-aberrant team members from Session 1. To measure team personality for our task we utilized the Ten Item Personality Inventory (TIPI). The TIPI, which is based on the Big Five, was chosen after careful consideration; we were in need of a valid and short individual personality measurement tool. This survey initiates ten statements that begin, I see myself as: followed by two descriptors; subjects respond using a seven-point scale 1=disagree strongly and 7 =agree strongly. Test-retest reliabilities for this measure range from.62 to.77 (Gosling, Rentfrow, & Swann, 2003). This measure is reproduced in Appendix G. We also administered a second personality questionnaire which was divided into two parts. The first part consisted of five statements regarding whether team members made suggestions about better work methods and this team member acted as the leader. Each participant was asked to respond using a five-point scale 1=I completely disagree and 5=I completely agree and rate each member of the team (including themselves). The second part of the survey required participants to rate all team members with a five-point scale (including themselves) on several dimensions including whether a particular team member was talkative or silent, good-natured or irritable, and relaxed or high-strung. The survey can be found in Appendix H. Because the results associated with these personality measures are not central to our research questions, we report them in Appendix I Procedure The experiment consisted of two sessions (see Table 4). Session 1 lasted approximately 6.5 hours and Session 2 lasted approximately 3.5 hours. Both sessions were separated by either a 3-6 week or week Retention Interval. Prior to arriving at the first session, the three participants were randomly assigned to one of the three task positions: AVO, PLO, or DEMPC. Cooke et al. 43 Team Coordination
58 The team members retained these positions for the remainder of the study whether they were on a same or mixed team for the second session. Table 4 Experimental Protocol Session 1 Session 2 Consent Forms Skills Refresher Task Training Mission 6 Mission 1 Mission 7 Mission 2 Knowledge Measures Knowledge Measures Mission 8 Mission 3 Personality Survey Mission 4 Demographics Mission 5 Debriefing In the first session, the team members were seated at their workstations where they signed a consent form, were given a brief overview of the study and started training on the task. During training, all the team members were separated by partitions regardless of the condition they were assigned. Team members studied three PowerPoint training modules at their own pace and were tested with a set of multiple-choice questions at the end of each module. If responses were incorrect, they were instructed to go back to the PowerPoint tutorial and correct their answers. Experimenters provided assistance and explanation if their second response was also incorrect. Once all team members completed the tutorial and test questions, a mission was started and experimenters had participants practice the task, checking off skills that were mastered (e.g., the AVO needed to change altitude and airspeed, the PLO needed to take a good photo of a target) until all skills were mastered (See Appendix J for the checklist of skills). Again, the experimenters assisted in cases of difficulty. Training took a total of 1.5 hours. After training, the partitions were removed and the team started their first 40-minute mission. All missions required the team to take reconnaissance photos of targets. However the number of targets varied from mission to mission in accordance with the introduction of situation awareness roadblocks at set times within each mission. See Table 5 for number of targets per mission. Missions were completed either at the end of a 40-minute interval or when team members believed that the mission goals had been completed. Immediately after each mission, participants were shown their performance scores. Participants could view their team score, their individual score, and the individual scores of their teammates. The performance scores were displayed on each participant s computer and shown in comparison to the mean scores achieved by all other teams (or roles) who had participated in the experiment up to that point. Participants were given short breaks after each mission. Cooke et al. 44 Team Coordination
59 Table 5 Number of Targets per Mission Mission Targets After the second mission, knowledge measures were administered in the following order: taskwork ratings, taskwork consensus ratings, teamwork ratings, teamwork consensus ratings, and the secondary knowledge questionnaire. The participants were separated by partitions during the knowledge sessions as well. Once the knowledge measures were completed, partitions were removed and teams began the third 40-minute mission followed by the fourth and fifth missions. Upon returning for the second experimental session, individual team members were instructed to not discuss the task and their prior performance during the first session. Participants were then individually given a 5-minute scripted refresher training course (shown in Appendix K) which focused on the taskwork aspects of their individual roles. Participants were asked to perform various tasks and were only given instruction or aid when they could not remember specific steps in completing the tasks. They were also rated on how much re-training was necessary for each task. The second session then continued immediately with Missions 6 and 7 followed by the second knowledge session. During the second knowledge session, participants completed the same ratings tasks as in the first knowledge session. After the second knowledge session, the experiment concluded with Mission 8, personality questionnaire, demographics and debriefing questionnaires Experiment 1: Results Effects of Retention Interval and Team Composition were examined across all Session 1 teams (43 excluding the two outliers). This pre-manipulation analysis was conducted to determine if there were any unexpected spurious differences between conditions that would have to be accounted for in the analysis of post-manipulation effects. There were some pre-manipulation differences and to take these into account pre-post effects were tested using difference scores (Session 2 Session 1) for each team. The calculation of difference scores was straightforward for teams in the Intact condition. Mission 4 was selected as a baseline for those measures collected at each mission. Mission 4 and Cooke et al. 45 Team Coordination
60 not Mission 5 was used as an estimate of maximum performance in Session 1 because Mission 5 contained a particularly difficult SA road block which tended to reduce team performance scores for that mission. The calculation of difference scores for mixed teams was not straightforward because these newly composed teams did not experience Session 1 as a team. Therefore, baseline scores were estimated for mixed teams by taking the Mission 4 scores from their originating teams and averaging them across the three team members. In the case of the outlying mixed team, baselines were constructed from the original teams of the two team members not originating from the outlying team. Due to the relatively small sample size per condition, extensive across-team variation, and an objective of identifying any potentially interesting measures or effects at the expense of possible Type I errors, we considered α-levels of p<.10 statistically detectable (Cohen, 1994; Wickens,1998) Demographics Demographic data were analyzed to assess whether differences in the Team Performance scores varied with age, video game experience, prior aviation training, and gender. Age information was missing for 21 individuals (i.e., Teams 3, 4, 5, 7, 9, 13 & 67) leaving 36 teams for analyses. If individuals reported playing video games frequently, their response was coded 1, otherwise their response was coded 0. If team members reported having received prior aviation training, their response was coded 1, otherwise their response was coded 0. Males were coded 1 ; females were coded 0. The data were aggregated for each team as follows: age was averaged for each team; video game experience, aviation training, and gender were summed for each team. For the mixed teams, these averages were calculated based upon their session 1 team members. Table 6 presents mean demographics across groups. Table 6 Means for Group Demographics (Averaged across Teams) Retention Interval Short Long Team Composition Age No. Video game players per team No. Aviation trainees per team No. Males per team Mixed Intact Mixed Intact Cooke et al. 46 Team Coordination
61 Chi-Square tests were calculated to assess whether the classification of high and low performing teams at Mission 4 was dependent on demographic characteristics. Teams were split into high and low performance groups using a median split (MD = ). We summarized the data into contingency tables to illustrate the distribution of demographic characteristics between high and low teams. First, we categorized the high and low performance groups as intact or mixed gender groups. Second, we categorized the performance groups as having one or more team member with prior aviation training or having no members with prior aviation training. Third, we categorized the performance groups as either having one or more team members that played video games frequently or having no members that played frequently. Lastly, we categorized the performance groups relative to the age of the team members. We used two different ways to categorize based on age. First, we took the median age for all participants (23). We then categorized the performance groups as having one or more members whose age was above the median or having no members whose age was above the median. We also categorized age groups as having one or more members whose age was more than two standard deviations above the mean (M = 26.07, SD = 8.73), or having no members whose age was more than two standard deviations above the mean. Tables 7-12 illustrate the distribution of high and low performing groups across the demographic categories. Table 7 Gender Composition for High and Low Performance Groups Team Gender Composition Performance Mixed Same Low 10 8 High 10 8 Total Table 8 Prior Aviation Training for High and Low Performance Groups Team Members Had Aviation Training Performance At Least One None Low 9 9 High 14 4 Total Table 9 Frequency of Video Game Play for High and Low Performance Groups Team Members Frequently Play Video Games Performance At Least One None Low 15 3 Cooke et al. 47 Team Coordination
62 High 16 2 Total 31 5 Table 10 Median Split Age Groups for High and Low Performance Groups Team Members Above Median Age Performance At Least One None Low 16 2 High 14 4 Total 30 6 Table 11 Age Groups 2SD above Mean for High and Low Performance Groups Team Member Age Above Two Standard Deviations from Mean Age Performance At Least One None Low 7 11 High 0 18 Total 7 29 The results of the Chi-Square tests indicate that the classification of high and low performing teams at Mission 4 was independent of team gender composition χ 2 (1, N = 36) = 0, p >.10) and of frequent video game experience χ 2 (1, N = 36) =.23, p >.10). The classification of team performance was dependent, however, on prior aviation training χ 2 (1, N = 36) = 3.01, p <.10). Team performance was independent of age if the age classification was conducted using a median split χ 2 (1, N = 36) =.8, p >.10), but dependent on age if age classification was based on those teams containing members whose age was more than two standard deviations from the average, χ 2 (1, N = 36) = 8.69, p <.10. To further investigate the dependence of team performance on age, we categorized teams into three age ranges using the average team age. Table 12 illustrates the distribution of high and low performing teams across the age group ranges. The results of a Chi-square test indicate that performance did depend on age χ 2 (2, N = 36) = 13.08, p <.10). Table 12 Distribution of High and Low Performance Teams across Age Groups Average Age for Team Performance Low Cooke et al. 48 Team Coordination
63 High Total Findings Teams with members who had aviation training tended to score higher on team performance than teams with no aviation training. Teams with members who were younger tended to score higher on performance than teams with older members. Factors such as aviation training and age contribute to team performance differences described in the next section. In order to best control for individual team differences in this study, a team s performance in response to the manipulations was assessed relative to its own baseline established in Mission 4 of the first session Team Performance Team performance data were collected for each of the eight missions. The data were highly negatively skewed. Additionally, separate detrended quantile-quantile plots for the treatment groups indicated that variances across groups differed. In light of the skewness and heterogeneous variances, the data were transformed. One team s performance on Mission 1 resulted in a negative score. To ensure that all data points were included in the analysis, a constant (200) was added to each team performance score. The scores were then subtracted from 1,201 to reflect them so that higher values correspond to better performance. A square root transformation (reflected to return it to the original scale) best approached a normal distribution and equalized the variances for the different groups. The transformation also resulted in fewer outliers both across the individual missions and in the overall sample. After applying the transformation, we excluded any teams that scored below two standard deviations from overall mean performance on Mission 4. We selected Mission 4 as an estimate of asymptotic team performance rather than Mission 5 because the SA roadblock presented during Mission 5 was deemed to be especially difficult based on an item analysis and if the teams failed the roadblock, their performance score was affected substantially. Only two teams obtained performance scores that fell below two standard deviations from the mean on Mission 4 (Teams 1 and 37). All additional analyses use the transformed performance data and exclude Teams 1 and 37. Mean team performance scores are presented in Table 13 and Figure 11. Cooke et al. 49 Team Coordination
64 Table 13 Means and Standard Deviations for Team Performance (Averaged across Teams within Conditions) Retention Interval Short Long Team Composition Mixed Intact Mixed Intact Mission Mean (across teams) Team Performance N Standard Deviation Total Total Total Total Cooke et al. 50 Team Coordination
65 Figure 11. Team performance across all Missions. Pre-manipulation Effects We conducted an analysis to check for any systematic condition differences prior to manipulations. A Team Composition (2) X Retention Interval (2) ANOVA was run using data from only Mission 4, the mission for which teams reached asymptotic performance. The model for this analysis included Team Composition and Retention Interval as fixed between-subjects factors. The two outlying teams were excluded from this analysis resulting in 43 observations (43 teams). The Mixed teams obtained higher team performance scores than the intact teams, F (1, 39) = 6.97, p =.012, η 2 =.15; however a significant Team Composition by Retention Interval effect (F (1, 39) = 3.76, p =.06, η 2 =.09) suggests that this was true only for the long interval-mixed group. This two-way interaction is illustrated in Figure 12. Cooke et al. 51 Team Coordination

66 Figure 12. Retention interval by team composition interaction at Mission 4. Manipulation Effects The goal of this analysis was to examine the manipulations of Team Composition and Retention Interval Length and their interaction on team performance. A pre-manipulation baseline score for each team was subtracted from the post-manipulation scores. The baseline (i.e., pretest) measure used for the intact teams was the Team Performance score obtained for Mission 4. Therefore difference scores for intact teams = Mission 6 (or 7 or 8) TPS Mission 4 TPS, where TPS = Team Performance Score for designated mission. Due to the nature of the Team Composition manipulation, the mixed teams did not have a baseline measure going into Mission 6. Although each of the mixed teams had performed the task in the fourth mission during Session 1, they had not done so with their new Session 2 team members. Therefore, we constructed a baseline score for each of these teams by taking the average of each of the Mission 4 team performance scores of the three originating teams. We subtracted each teams baseline score from their Mission 6, 7, and 8 scores. Therefore, difference scores for mixed teams = Mission 6 (or 7 or 8) TPS ((AVO M4 TPS + PLO M4 TPS + DEMPC M4 TPS)/3), where TPS = team performance score for designated mission. These difference scores were indicative of degree of team performance improvement or decrement (negative score) and served as the dependent variable in the following design. We Cooke et al. 52 Team Coordination
67 used a Retention Interval (2) X Team Composition (2) X Mission (3) repeated measures ANOVA to assess the effects of our manipulations on Team Performance across Missions 6, 7, and 8. The model for this analysis included Team Composition and Retention Interval as fixed between-subjects factors and Mission as a within-subjects factor. The two outlying teams were excluded from these analyses, as were the teams that did not complete the second session, resulting in 117 observations (39 teams). Difference scores increased significantly across Missions 6, 7 and 8 (F (2, 70) = 41.02, p <.001, η 2 =.54). The three-way interaction between Mission, Team Composition, and Retention Interval was significant; the increased performance across Missions 6, 7 and 8 differed for the various combinations of Team Composition and Retention Interval Length (F (2, 70) = 4.55, p =.01, η 2 =.12). Specifically, the short-intact teams did not show as large of a gain in performance across Missions 6, 7 and 8 as the other teams. No other effects were statistically significant (p >.10). Figure 13 illustrates the team performance decrement at Missions 6, 7 and 8. Looking at the decrement at Mission 6 only, there was a significant Retention Interval X Team Composition interaction (F (1, 35) = 6.14, p =.02, η 2 =.15). There was also a main effect of Team Composition (F (1, 35) = 5.86, p =.02, η 2 =.14). Independent sample t-tests were conducted to explore the Retention Interval X Team Composition interaction. The decrement in team performance for the short-intact teams was significantly smaller than the decrements of the long interval-intact teams (t (17) = 2.08, p =.05), the short-mixed teams (t (18) = 3.81, p <.01), and the long-mixed teams (t (18) = 2.88, p =.01). The decrement in long-mixed teams did not differ significantly from either the long-intact teams (t (17) = -.04, p =.97) or the short-mixed teams (t (18) = -1.37, p =.19. Similarly, the decrement in the short-mixed teams did not differ significantly from the long-intact teams (t (17) = 1.01, p =.33). One-sample t-tests were conducted to assess whether the decrements were significantly different from zero. An alpha of.025 was used for each test to reduce the chance of Type I error. At Mission 6, the short-intact teams did not experience a decrement in their team performance scores at Mission 6 (t (9) =.24, p =.82. Although the long-intact teams showed a decrement, it was not significant (t (8) = -2.17, p =.06). The decrements experienced by the short-mixed and long-mixed teams were significant (t (9) = -4.52, p <.01 and t (9) = -3.76, p <.01, respectively). Cooke et al. 53 Team Coordination
68 Figure 13. Post-manipulation team performance difference scores by experimental condition. To further explore the relationship between pre- and post-retention Interval team performance we looked at the correlation between Mission 4 and Mission 6 team performance. It was hypothesized that teams that performed best at Mission 4 would be more motivated to perform well upon return from the break, which would be reflected in a positive correlation between the two variables. Indeed, the correlation between Mission 4 team performance and Mission 6 team performance (Mission 6 minus Mission 4) was positive and significant (r =.36, p =.01). Findings Team performance data were not homogeneous across conditions and were skewed. A square root transformation was applied. Long-mixed teams obtained higher pre-manipulation team performance scores than teams in other conditions. Short-intact teams had a significantly lower deficit at Mission 6 than all other teams supporting Hypotheses H1.1 and H1.2 concerning the deleterious effects of long intervals and changes in Team Composition. Mixed teams displayed a significant decrement in team performance after the Retention Interval. The decrement for long-intact and short-intact teams was not statistically different from zero. All teams recovered from the retention deficit by Mission 7, the second mission after the break. Hypotheses H1.1 and H1.2 were supported, however there was no support for a Retention Interval x Team Composition interaction (H1.3). Cooke et al. 54 Team Coordination
69 Taskwork Knowledge Taskwork knowledge was measured in two separate sessions (after Mission 2 in Session 1, and after Mission 6 in Session 2) using the taskwork ratings application (see Measures section, ). Descriptive statistics on the five taskwork measures (overall accuracy, positional accuracy, interpositional accuracy, intrateam similarity, and holistic accuracy) follow. Taskwork Overall Accuracy Examination of quantile-quantile plots showed that the dependent measure was approximately normally distributed. The means and standard deviations as well as the minimum and maximum scores for overall taskwork accuracy from both knowledge sessions are presented in Table 14for short and long Retention Intervals and mixed and intact Team Compositions. Table 14 Overall Taskwork Accuracy for Knowledge Session 1 and Knowledge Session 2 Retention Interval Short Long Team Composition Mixed Intact Mixed Intact Knowledge Session Min Max Mean Standard Deviation Taskwork Positional Knowledge Examination of quantile-quantile plots showed that the dependent measure was approximately normally distributed. The means and standard deviations as well as the minimum and maximum scores for taskwork positional knowledge from both knowledge sessions are presented in Table 15 for short and long Retention Intervals and mixed and intact Team Compositions. Cooke et al. 55 Team Coordination
70 Table 15 Taskwork Positional Knowledge for Knowledge Session 1 and Knowledge Session 2 Retention Interval Short Long Team Composition Mixed Intact Mixed Intact Knowledge Session Min Max Mean Standard Deviation Taskwork Interpositional Knowledge Examination of quantile-quantile plots showed that the dependent measure was approximately normally distributed. The means and standard deviations as well as the minimum and maximum scores for taskwork interpositional knowledge from both knowledge sessions are presented in Table 16 for short and long Retention Intervals and mixed and intact Team Compositions. Table 16 Taskwork Interpositional Knowledge for Knowledge Session 1 and Knowledge Session 2 Retention Interval Short Long Team Composition Mixed Intact Mixed Intact Knowledge Session Min Max Mean Standard Deviation Taskwork Intrateam Similarity Examination of quantile-quantile plots showed that the dependent measure was approximately normally distributed. The means and standard deviations as well as the minimum and maximum scores for taskwork intrateam similarity from both knowledge sessions are presented in Table 17 for short and long Retention Intervals and mixed and intact Team Compositions. Cooke et al. 56 Team Coordination
71 Table 17 Taskwork Intrateam Similarity for Knowledge Session 1 and Knowledge Session 2 Retention Interval Short Long Team Composition Mixed Intact Mixed Intact Knowledge Session Min Max Mean Standard Deviation Holistic Taskwork Accuracy Examination of quantile-quantile plots showed that the dependent measure was approximately normally distributed. The means and standard deviations as well as the minimum and maximum scores for holistic taskwork accuracy from both knowledge sessions are presented in Table 18 for short and long Retention Intervals and mixed and intact Team Compositions. Table 18 Taskwork Holistic Accuracy for Knowledge Session 1 and Knowledge Session 2 Retention Interval Short Long Team Composition Mixed Intact Mixed Intact Knowledge Session Min Max Mean Standard Deviation Pre-manipulation Effects For all five taskwork knowledge measures, analyses were conducted to check for systematic condition differences prior to our manipulations by running a Team Composition (2) x Retention Interval (2) MANOVA on the taskwork data from the first of the two knowledge sessions. The model for the analyses treated Team Composition and Retention Interval as fixed betweensubjects factors. All pre-manipulation descriptive statistics and analyses utilize all data from a total of 43 Session 1 teams. Cooke et al. 57 Team Coordination
72 The analyses revealed no significant main effect of Team Composition (F (5, 35) =.742, p =.597, η 2 =.096) Retention Interval (F (5, 35) =.664, p =.653, η 2 =.087) nor an interaction between Team Composition and Retention Interval (F (5, 35) =.714, p =.617, η 2 =.093) indicating as expected no manipulation effects in Session 1. Manipulation Effects The goal of this analysis was to examine the effects of the manipulations of Team Composition and Retention Interval Length on all five taskwork measures. The dependent measures were difference scores for which the Session 1 taskwork scores (baseline) were subtracted from Session 2 taskwork scores. There were 39 teams included in this analysis. Mixed team Session 1 baselines for intrateam similarity and holistic accuracy were computed as other team-level baselines in this experiment by taking the average of the team scores for the three originating teams. Because overall, positional, and interpositional accuracy are initially calculated from individual Pathfinder scores, baseline scores were constructed from the mean of the three individual Session 1 scores for the team members on each team. Generally, the difference scores for mixed teams = TKS 2 score ((AVO TKS 1 + PLO TKS 1 + DEMPC TKS 1)/3) where TKS is the team knowledge score for the Session 1 originating team (intrateam similarity and holistic) or the individual knowledge score from Session 1 (overall, positional, interpositional). Difference scores for each of the five taskwork measures served as the dependent measures in the Team Composition (2) x Retention Interval (2) MANOVA with Team Composition and Retention Interval as the fixed factors. The MANOVA revealed a significant main effect of Team Composition (F (5, 31) = 7.29, p <.001, η 2 =.540). No significant effect of Retention Interval (F (5, 31) = 1.67, p =.171, η 2 =.212), and no interaction between Team Composition and Retention Interval (F (5, 31) =.424, p =.828, η 2 =.064) were found. Univariate tests for between-subjects effects revealed a significant main effect of Team Composition on interpositional accuracy (F (5, 31) = 25.51, p <.001). Further examination with one-way t-tests revealed that the difference scores for long-mixed (t (9) = 11.51, p <.01) and short-mixed (t (9) = 3.83, p <.01) were significantly different from zero indicating that those teams exhibited an increase in interpositional knowledge from Session 1 to Session 2. Cooke et al. 58 Team Coordination
73 Figure 14. Average taskwork interpositional knowledge difference scores obtained in four different group conditions. Findings Greater improvements in knowledge accuracy (interpositional) from Session 1 to Session 2 were seen in mixed teams, relative to intact teams. Contrary to Hypothesis 1.2, mixed Team Composition did not result in decrements in taskwork knowledge Teamwork Knowledge Teamwork knowledge was measured in two separate sessions (after Missions 2 and 6), using the teamwork knowledge questionnaire (See Appendix C) and scored as described above at the beginning of the Measures section (section ). Descriptive team-level statistics on the five teamwork measures (overall accuracy, positional accuracy, interpositional accuracy, intrateam similarity, and holistic accuracy) follow. Teamwork Overall Accuracy Examination of quantile-quantile plots showed that the dependent measure was approximately normally distributed. The means and standard deviations as well as the minimum and maximum scores for overall teamwork accuracy from both knowledge sessions are presented in Table 19 for short and long Retention Intervals and mixed and intact Team Compositions. Cooke et al. 59 Team Coordination
74 Table 19 Teamwork Overall Accuracy for Knowledge Session 1 and Knowledge Session 2 Retention Interval Short Long Team Composition Mixed Intact Mixed Intact Knowledge Session Min Max Mean Standard Deviation Teamwork Positional Knowledge Examination of quantile-quantile plots showed that the dependent measure was approximately normally distributed. The means and standard deviations as well as the minimum and maximum scores for teamwork positional knowledge from both knowledge sessions are presented in Table 20 for short and long Retention Intervals and mixed and intact Team Compositions. Table 20 Teamwork Positional Accuracy for Knowledge Session 1 and Knowledge Session 2 Retention Interval Short Long Team Composition Mixed Intact Mixed Intact Knowledge Session Min Max Mean Standard Deviation Teamwork Interpostional Knowledge Examination of quantile-quantile plots showed that the dependent measure was approximately normally distributed. The means and standard deviations as well as the minimum and maximum scores for teamwork interpositional knowledge from both knowledge sessions are presented in Table 21 for short and long Retention Intervals and mixed and intact Team Compositions. Table 21 Cooke et al. 60 Team Coordination
75 Teamwork Interpositional Accuracy for Knowledge Session 1 and Knowledge Session 2 Retention Interval Short Long Team Composition Mixed Intact Mixed Intact Knowledge Session Min Max Mean Standard Deviation Teamwork Intrateam Similarity Examination of quantile-quantile plots showed that the dependent measure was approximately normally distributed. The means and standard deviations as well as the minimum and maximum scores for intrateam similarity from both knowledge sessions are presented in Table 22 for short and long Retention Intervals and mixed and intact Team Compositions. Table 22 Teamwork Intrateam Similarity for Knowledge Session 1 and Knowledge Session 2 Retention Interval Short Long Team Composition Mixed Intact Mixed Intact Knowledge Session Min Max Mean Standard Deviation Holistic Teamwork Accuracy Examination of quantile-quantile plots showed that the dependent measure was approximately normally distributed. The means and standard deviations as well as the minimum and maximum scores for holistic teamwork accuracy from both knowledge sessions are presented in Table 23 for short and long Retention Intervals and mixed and intact Team Compositions. Cooke et al. 61 Team Coordination
76 Table 23 Teamwork Holistic Accuracy for Knowledge Session 1 and Knowledge Session 2 Retention Interval Short Long Team Composition Mixed Intact Mixed Intact Knowledge Session Min Max Mean Standard Deviation Pre-manipulation Effects For all five teamwork knowledge measures, analyses were conducted to check for systematic condition differences prior to our manipulations by running a Team Composition (2) x Retention Interval (2) MANOVA on the teamwork knowledge data from Session 1. The model for the analyses treated Team Composition and Retention Interval as fixed between-subjects factors. All pre-manipulation descriptive statistics and analyses utilize all data from a total of 43 Session 1 teams. The pre-manipulation MANOVA was performed and revealed no significant main effect of Team Composition, F(5, 35) = 1.73, p =.153, η 2 =.198, or Retention Interval, F(5, 35) =.906, p =.488, η 2 =.115. However, an interaction between Team Composition and Retention Interval, F(5, 35) = 2.93, p =.026, η 2 =.295, was found. The test for between-subjects effects revealed that with Team Composition x Retention Interval as the source, positional, interpositional, and intrateam similarity were all significant F(1, 39) = 4.00, p =.052, F(1, 39) = 3.79, p =.059, and F(1, 39) = 6.21, p =.017 respectively. The test for between-subjects effects also revealed that with Team Composition as the source, overall accuracy was significant at F(1, 39) = 4.036, p =.051, and with Retention Interval as the source, intrateam similarity was significant at F(1, 39) = 3.65, p =.063. In general, these findings indicate that team teamwork knowledge was not similar in Session 1. A post-hoc test was run to determine where the significant differences existed. This test revealed that long-intact teams scored significantly higher on teamwork intra-team similarity than long-mixed teams (p =.04), and than short-mixed teams (p =.06) during knowledge Session 1. Manipulation Effects The goal of this analysis was to examine the effects of the main manipulations of Team Composition and length of Retention Interval on all five teamwork measures. The dependent measures were difference scores for which the Session 1 taskwork scores (baseline) were subtracted from Session 2 taskwork scores. There were 39 teams included in this analysis. Cooke et al. 62 Team Coordination
77 Mixed teams Session 1 baselines for holistic accuracy were computed as other team-level baselines in this experiment by taking the average of the team scores for the three originating teams. Because overall, positional, interpositional accuracy, and intrateam similarity are initially calculated from individual scores, baseline scores were constructed from the mean of the three individual Session 1 scores for the team members on each team. Generally, the difference scores for mixed teams = TKS 2 score ((AVO TKS 1 + PLO TKS 1 + DEMPC TKS 1)/3) where TKS is the team knowledge score for the Session 1 originating team (intrateam similarity and holistic) or the individual knowledge score from Session 1 (overall, positional, interpositional). These difference scores for each of the five taskwork measures served as the dependent measures in the Team Composition (2) x Retention Interval (2) MANOVA with Team Composition and Retention Interval as the fixed factors. The Team Composition effect was not significant. However, the MANOVA revealed a significant main effect of Retention Interval (F (5, 31) = 2.15, p =.086, η 2 =.257) as well as a significant interaction between Team Composition and Retention Interval (F (5, 31) = 2.88, p =.03, η 2 =.317). The interaction indicated that shortintact teams exhibited an increase in teamwork interpositional knowledge accuracy from Session 1 to Session 2. Univariate tests for between-subjects effects revealed a significant main effect of Retention Interval on interpositional accuracy (F (5, 31) = 4.26, p =.047). One-way t-tests revealed that the difference scores were significantly different from zero for the short-intact (t (9) = 2.35, p =.04) and long-intact conditions (t (8) = -1.94, p =.09). The short interval teams achieved higher difference scores on this teamwork knowledge measure compared to the long interval teams. Interpositional knowledge score difference Long-Intact Long-Mixed Short-Intact Short-Mixed Group Conditions Figure 15. Average of teamwork interpositional knowledge accuracy scores differences obtained in four different group conditions. Cooke et al. 63 Team Coordination
78 Univariate tests for between-subjects effects revealed a significant Team Composition x Retention Interval effect on positional accuracy (F (1, 35) = 5.42, p =.026), intrateam similarity (F(1, 35) = 7.97, p =.008), and holistic accuracy (F(1, 35) = 3.47, p =.071). For positional accuracy, the interaction indicated that that short-mixed teams positional knowledge decreased from Session 1 to Session 2 while all other teams knowledge tended to increase. The interaction is shown in Figure 16. One-way t-tests revealed that the difference scores were significantly different from zero, for the short-intact teams only (t (9) = 2.49, p =.03). Short-intact teams showed an increase in teamwork positional knowledge accuracy from Session 1 to Session 2. Figure 16. Teamwork positional knowledge accuracy scores showing Short-Mixed teams decreasing from Session 1 to Session 2. For intrateam similarity, One-way t-tests revealed that the difference scores were significantly different from zero for the short-intact condition only (t (8) = 2.05, p =.07). short-intact teams exhibited increases in teamwork intrateam similarity from Session 1 to Session 2. Cooke et al. 64 Team Coordination
79 Figure 17. Average of teamwork intra-team similarity scores differences obtained in four different group conditions. Lastly, for holistic accuracy, One-way t-tests revealed that the difference scores were significantly different from zero for the short-mixed condition only (t (9) = -2.33, p =.045) indicating that these teams tended to display a decrease in holistic accuracy Holistic accuracy difference Long-Same Long-Mixed Short-Intact Short-Mixed Group Conditions -1.4 Figure 18. Average of teamwork Holistic differences obtained in four different group conditions. Cooke et al. 65 Team Coordination
80 Findings The pre-manipulation analysis revealed an interaction between Team Composition and Retention Interval indicating that long-intact teams scored significantly higher on teamwork intrateam similarity. Analysis of manipulation effects revealed a main effect of Retention Interval and a Retention Interval x Team Composition interaction. The short interval teams achieved higher difference scores on interpositional knowledge measure compared to the long interval teams. Specifically, short-intact teams exhibited an increase in teamwork interpositional knowledge accuracy from Session 1 to Session 2. Short-mixed teams positional knowledge accuracy decreased from Session 1 to Session 2 Analysis of intra-team similarity scores indicated that long-mixed and short-intact teams demonstrated greater positive change on this teamwork knowledge measure compared to long-intact teams. This result provides some support for Hypothesis 1.3 favoring longmixed teams. Holistic accuracy scores revealed that short-mixed teams tended to display a decrease in holistic accuracy from Session 1 to Session 2. From Session 1 to Session 2, short-intact teams demonstrated consistent improvement on all teamwork knowledge measures supporting Hypotheses 1.1 and Team Process: Coordination Ratings Coordination Rating Reliability Coordination ratings reflect the experimenters evaluation of team process behaviors, conceptualized as the level of coordination/communication, timeliness of interactions, team situation awareness, and overall impressions of the team acting as a well-integrated behavioral unit. DVD recordings for ten percent of all missions (n = 34 missions) were coded (using the coordination logger) independently by separate experimenters in order to assess inter-rater agreement. Three hundred thirty three pairs of independently rated process scores were analyzed for inter-rater agreement. Inter-rater agreement was adequate (κ =.06, z = 1.76, p <.08). Coordination Rating Results Coordination ratings were averaged across targets for every mission (summary statistics are presented in Table 24). There were 332 total observations, one for each mission. Forty-three teams were analyzed for Session 1 (two performance outliers were dropped) and 39 teams (one performance outlier was dropped) were analyzed for Session 2. Normal quantile-quantile plots were made in order to test the data for normality. In light of a negative skew, the data were transformed. Coordination ratings were first multiplied by -1 (or reflected ) in order to make low scores high, and then we added 5 to keep the same numbering. Square root, inverse, and log Cooke et al. 66 Team Coordination
81 (base e) were then applied to the coordination rating data. After transforming the rating data by square root, 5 was added 5 the data were re-reflected (multiplied again by -1). This transformation approximated a normal distribution. Cooke et al. 67 Team Coordination
82 Table 24 Means and Standard Deviations for Coordination Ratings (Averaged across Teams within Conditions) Retention Interval Long Short Team Composition Mission Mixed Intact Mixed Intact Mean (across teams) Team Process Standard Deviation N Total Total Total Total Cooke et al. 68 Team Coordination
83 Pre-manipulation Effects To control for systematic effects prior to manipulations, we analyzed assigned conditions before the Retention Interval. A Team Composition (2) X Retention Interval (2) ANOVA was run, using data from only Mission 4, the mission at which reached asymptotic performance The ANOVA revealed a significant interaction effect between Team Composition and Retention Interval (F (1, 41) = 2.85, p <.10, η 2 =.07). Figure 19 indicates that the short-intact and longmixed pre-manipulation groups received higher ratings than the long-intact and short-mixed premanipulation groups (refer to Table 24). Figure 19. Mean coordination rating retention interval by team composition interaction at Mission 4; error bars represent the standard errors of the means. Manipulation Effects The goal of this analysis was to examine Team Composition and Retention Interval effects on coordination ratings. A pre-manipulation baseline score for each team was subtracted from the post-manipulation scores. For the Intact teams, Mission 4 coordination ratings served as a baseline. Difference scores were then obtained by subtracting Mission 4 coordination ratings from Mission 6 coordination ratings, Mission 7 ratings, and Mission 8 ratings. For the mixed teams the baseline score was the average of their respective Mission 4 coordination ratings. The difference scores were indicative of the amount of change in coordination ratings between Mission 4 and the post-interval missions; i.e., improvement (a positive number) vs. decline (a negative number). The difference scores served as the dependent measure in a Retention Interval (2) X Team Composition (2) X Mission (3) repeated measures ANOVA in order to assess the effects of our manipulations on team process across Missions 6, 7, and 8. The model includes two between-subjects factors, Team Composition and Retention Interval, and one within-subjects factor, Mission. Coordination rating differences changed significantly over Missions 6, 7, 8 (F (2, 34) = 6.59, p <.01, η 2 =.28;), and there was a significant Mission X Team Composition interaction effect (F (2, 34) = 3.26, p <.06, η 2 =.16; Figure 20). The between-subjects Team Composition effect was Cooke et al. 69 Team Coordination
84 also significant (F (1, 35) = 5.53, p <.03, η 2 =.14). There was no significant three-way interaction or effect of Retention Interval. Post hoc testing (α <=.10/9 =.01) revealed that Intact teams showed no change from baseline across Mission 6, 7, and 8 (Mission 6 t (18) = -.34; Mission 7 t (18) = -.28; Mission 8 t (18) =.24; all p s >.70), while Mixed teams appeared to improve over these Missions at an increasing rate (i.e., Mission 6 t (19) = 1.06, p =.30; Mission 7 t (19) = 3.53, p <.003; Mission 8 t (19) = 4.90, p <.001), and paired t-tests indicated that this group did indeed improve from mission to mission (6 7: t (19) = -3.26, p <.0005; 7 8: t (19) = -2.98, p <.009) Intact Mixed Mission Figure 20. Coordination rating difference scores for post-manipulation missions by team composition group. Findings Significant pre-manipulation effects were found for team process; namely, short-intact and long-mixed teams tended to earn higher ratings, while long-intact teams tended to earn very low ratings. After the Retention Interval, mixed teams had higher team process ratings relative to their baseline than the Intact teams averaged over missions 6, 7, and 8. Post hoc testing revealed the seemingly counter-intuitive result that intact teams tended to earn process ratings at similar levels prior to the Retention Interval, while mixed teams tended to earn significantly higher process ratings after the Retention Interval. That is, intact teams stayed the same after the Retention Interval, but mixed teams tended to improve. These results are contrary to the hypothesized process deficits due to changes in Team Composition (H1.2) and provide no support for the other hypotheses (H1.1, H1.3). Cooke et al. 70 Team Coordination
85 CAST Situation Awareness Data Visualization and Planning There were 329 total CAST observations. Forty-three teams were analyzed for Session 1 and 38 teams were analyzed for Session 2 (there was a missing data point for a short-mixed Mission 7-8). A normal quantile-quantile plot did not suggest deviations from normality for either the hit rate or false alarm rate data. The hit rate and false alarm data were positively correlated r (325) =.25, p <.001suggesting a multivariate treatment, in this case bivariate normal, of the hit and false alarm rate data. CAST Score Reliability Inter-rater reliability for CAST was evaluated for approximately 10% (34 of 329) independently coded missions. The independently coded missions were then lined up by CAST instrument check box into two columns resulting in 544 paired observations (34 missions X 16 check boxes). Based on Cohen s Kappa agreement was adequate (κ =.49, p <.001, z = 11.46). Cooke et al. 71 Team Coordination
86 Table 25 Means and Standard Deviations for CAST Hit Rate (Averaged across Teams within Conditions) Retention Interval Long Short Team Composition Mixed Intact Mixed Intact Mission Mean (across teams) SA Hit Rate Standard Deviation N Total Total Total Total Cooke et al. 72 Team Coordination
87 Table 26 Means and Standard Deviations for CAST False Alarm Rate (Averaged across Teams Within Conditions) Retention Interval Long Short Team Composition Mixed Intact Mixed Intact Mission Mean (across teams) False Alarm Rate Standard Deviation N Total Total Total Total Cooke et al. 73 Team Coordination
88 Pre-manipulation Effects To rule out systematic effects prior to manipulations, we analyzed assigned conditions before the Retention Interval at performance asymptote Mission 4. A 2 (Team Composition) X 2 (Retention Interval) MANOVA revealed no significant effects on hit and false alarm rate data due to the pre-manipulation group assignments. Manipulation Effects The goal of this analysis was to examine the effects of Team Composition and Retention Interval on CAST. Difference scores were computed, CAST Mission 6 minus CAST Mission 4, Mission 7 minus Mission 4, and Mission 8 minus Mission 4, for both hit and false alarm rate data. Due to the nature of the Team Composition manipulation, the newly mixed teams did not have a Mission 4 CAST score, their Mission 4 scores were estimated by taking the average across each team member s Mission 4 scores obtained with their original teams. The difference scores for hits and false alarms were indicative of degree of CAST team situation awareness improvement or decrement (a negative score for hit rate and a positive score for false alarm rate), and served as the dependent variables in the following design. A Retention Interval (2) X Team Composition (2) X Mission (3) repeated measures MANOVA was used to assess the effects of the manipulations on CAST team situation awareness across Missions 6, 7, 8. The model for this analysis included Team Composition and Retention Interval as fixed betweensubjects factors and Mission as a within-subjects factor. CAST scores changed significantly over Missions 6, 7, 8 (F (4, 31) = 3.76, p <.02, η 2 =.33) and there was a significant Mission X Retention Interval interaction effect (F (4, 31) = 2.31, p <.09, η 2 =.23). These effects were due to a steady decrease in false alarm rate, relative to Mission 4 (univariate F (2, 68) = 6.76, p <.01, η 2 =.17). However, a significant three-way interaction effect on false alarm rate difference (F (1, 68) = 2.98, p <.10, η 2 =.08) revealed that it was the long-mixed teams that decreased their false alarm rate most, as indicated in Table 26. Examining Table 26, short-intact and long-mixed appear to change the most (steady improvement) over Missions 6, 7, 8. Post hoc testing revealed no significant improvement or decline for the short-intact condition at Mission 6. With regard to this last finding, it is important to note that short-intact teams had lower false alarm rates at Mission 4 compared to the other conditions (Table 26). Relative to the Mission 4 means of the other groups (.26 over all other groups) the short-intact teams did show a minor improvement (e.g., = -.05 at Mission 6; cf. Table 26 and Figure 21). In this case difference scores may be misleading since the short-intact teams tended to have lower false alarm rates at the Mission 4 baseline. Cooke et al. 74 Team Coordination
89 Figure 21. Estimated means for three-way false alarm interaction between Mission, Team Composition, and Retention Interval; negative difference scores indicate a reduction in false alarm rate. Roadblocks Overcome In order to examine the number of roadblocks successfully overcome prior to manipulations, categorical linear models were fit separately for between-subjects pre-manipulation effects and repeated measures effects due to Mission. Pearson chi-square tests of independence were computed for each effect. Pooled across missions, none of the effects in the Team Composition X Retention Interval factorial were significant (all p >.13). In the repeated measures analysis the effect of Mission was significant (χ 2 (4) = 71.25, p <.001). All other effects in the Mission X Team Composition X Retention Interval factorial could not be tested using the linear model because the covariance matrix of the linear response function for long-intact, short-mixed, and long-mixed was singular and the linear modeling effort required these matrices to be inverted. Therefore Mission was treated as a between-subjects factor and two-way contingency tables were tested for Mission X Team Compositiong (χ 2 (4) = 1.43, p >.83) and Mission X Retention Interval (χ 2 (4) = 2.02, p >.73). The Mission X Team Composition X Retention Interval effect was not tested. Cooke et al. 75 Team Coordination
90 Table 27 Pre-manipulation Mean, Standard Deviation, and Sample Size for Number of Roadblocks Overcome by Experimental Condition Condition Overcome Short-Intact M 0.66 SD 0.48 n 44 Long-Intact M 0.56 SD 0.50 n 43 Short-Mixed M 0.52 SD 0.50 n 56 Long-Mixed M 0.63 SD 0.49 n 56 Figure 22 is a graph of the significant Mission effect. It is apparent from this graph that some roadblocks were more readily overcome than others. However the lack of pre-manipulation experimental effects does not suggest that the pre-manipulation groupings would have caused this. An item analysis (Embretson & Reise, 2000) was conducted using hit and false alarm difficulty scores for each roadblock item (hit difficulty = M / max per item; false alarm difficulty = M / min per item). A difficulty score of.5 identifies a roadblock that is neither too easy nor too difficult. A high value (>.5) suggests an easier roadblock and a low value (<.5) suggests a more difficult roadblock. As can be seen in Figure 22 the Mission 3 roadblock was relatively difficult (hit difficulty =.29; false alarm difficulty =.42) while the Mission 4 roadblock was relatively easy (hit difficulty =.59; false alarm difficulty = 1). The Mission 3 roadblock involved changing the UAV route to avoid a dangerous storm and the Mission 4 roadblock involved adding an unexpected target to the route plan of the DEMPC. Except for Mission 5 false alarm difficulty (.76) all other difficulty scores hovered around the ideal value of.5. The significant effect of Mission in the pre-manipulation dataset is therefore most likely due to differences in difficulty of roadblock. Cooke et al. 76 Team Coordination
91 % Overcome Mission Figure 22. Pre-manipulation percent roadblocks overcome by Mission. Table 28 lists descriptive statistics by experimental condition for post-manipulation roadblocks overcome across missions. In order to test for post-manipulation differences due to experimental condition, the [0, 1] overcome roadblock coding was used as the dependent variable in categorical linear models. Separate categorical linear models were fit for between-subjects effects and repeated measure (Mission) effects. All effects in the between-subjects Team Composition X Retention Interval model were not significant (all p >.18). In the Mission X Team Composition X Retention Interval model there was a significant Mission X Retention Interval association (χ 2 (2) = 13.08, p <.002). All other effects were not significant (all p >.22). Table 28 Post-manipulation Mean, Standard Deviation, and Sample Size for Number of Roadblocks Overcome by Experimental Condition Condition Overcome Short-Intact M 0.52 SD 0.51 n 29 Long-Intact M 0.48 SD 0.51 n 25 Short-Mixed M 0.68 SD 0.48 n 25 Long-Mixed M 0.57 SD 0.50 n 30 Cooke et al. 77 Team Coordination
92 Figure 23 is a graph of the Mission X Retention Interval association. Post hoc tests for significant differences at Missions 7 and 8 (Bonferroni α =.05/2 =.025) revealed only a significant difference at Mission 8 (χ 2 (2) = 5.35, p <.021). The number of roadblocks overcome at Mission 8 by short interval teams was roughly equivalent for intact (6 overcome) and mixed (7 overcome) teams. The same was true for long interval teams (intact had 4 overcome; mixed had 3 overcome). Overall at Mission 8 there were 20 successful overcomes and 17 non-overcomes (54% overcome rate). In the item analysis this roadblock ranked as the most difficult (hit difficulty =.35; false alarm difficulty =.31). (In comparison the Mission 6 roadblock hit difficulty =.38 and false alarm difficulty =.64; Mission 7 hit difficulty =.46 and false alarm difficulty =.53.) The Mission 8 roadblock involved an unexpected target. Number of Roadblocks Overcome Mission Short Interval Long Interval Figure 23. Number of roadblocks overcome by Retention Interval condition for the three postmanipulation Missions. Findings No pre-manipulation effects were detected. Based on difference scores, in general teams exhibited decreased false alarm rates after the Retention Interval, while hit rates did not appear to change. In other words, teams exhibited post-manipulation change in team situation awareness processes via a reduction in interactions not necessitated by CAST roadblocks. Similar patterns of decreasing false alarm rates were for short-intact and long-mixed teams who showed a negative slope of false alarm rate difference scores over Missions 6, 7, and 8. Long-intact and short-mixed teams showed a relatively more constant reduction in false alarm rates. These results support H1.3 predictions of a Retention Interval x Team Composition interaction, at least for Missions 7 and 8. In deference to the difference scores, short-intact teams may have been unjustly penalized initially in their Mission 6 difference scores because of their relatively low premanipulation false alarm rates. Cooke et al. 78 Team Coordination
93 The long-mixed teams showed the highest degree of reduction in false alarm rates after the Retention Interval. This result contradicts predictions made about deleterious effects of long Retention Intervals and changes in Team Composition (i.e., H1.1, H1.2). According to CAST roadblock performance, mixing the teams coupled with a longer Retention Interval may actually engender good team situation awareness via a reduction in false alarm interactions under unusual circumstances. There was a significant main effect of Mission on number of roadblocks overcome for pre-manipulation, and a significant Retention Interval X Mission interaction effect on number of post-manipulation roadblocks overcome. The Mission effects were primarily due to differences in roadblock difficulty at each mission It is interesting that the changes in false alarm rates associated with more efficient coordination for situation assessment did not translate into more roadblocks overcome. On the other hand, increased coordination efficiency for teams of three is unlikely to make the difference in outcome that increased efficiency of larger teams would make Experiment: 1 Performance Predictors Mission-level Team Performance Predictors In order to identify mission-level variables that are predictive of team performance across missions, variables that were measured at each mission were entered into a stepwise regression with mission performance as the dependent variable. Some of the coordination and dynamics variables described here are discussed in the next section in more depth. The mission-level variables are listed under Metrics in Table 29. The selection criteria for the stepwise regression included a p-value of.10 or less to enter the model at each step, and a p-value of.10 or less to stay in the model at each step. Separate regression models were fit by experimental session and condition. Significant predictors for each model are denoted in Table 29 by their standardized regression coefficients. Table 29 Standardized Regression Coefficients of Significant Mission-level Team Performance Predictors by Experiment 1 Session and Condition Session 1 Short- Mixed Long- Mixed Metric Short-Intact Long-Intact Coordination Rating.420(43)***.718(43)***.468(55)***.452(56)*** Coordination Score (56)* Team SA Overcome.296(43)* Hits -.404(43)** -.200(43)* - - False Alarms -.255(43)** - - Cooke et al. 79 Team Coordination
94 Session 2 Short- Mixed Long- Mixed Metric Short-Intact Long-Intact Coordination Rating.512(27)***.476(25)**.546(25)***.668(30)*** Coordination Score Team SA Overcome Hits False Alarms (25)* - - *Note. Numbers in parentheses are sample sizes. At the mission-level, the most consistent predictor of team performance was coordination rating. Various aspects of CAST team SA also predicted team performance. Session-level Team Performance Predictors At the session-level, Taskwork and Teamwork Overall Accuracy were used. Session-level variables were examined similarly in order to identify the best predictors of session-level team performance. Session-level variables are identified under Metrics in Table 30. A stepwise regression with p-value not larger than.10 as the include/exclude criteria was run with Mission 4 team performance as the dependent variable for Session 1 (i.e., the performance acquisition asymptote) and mean team performance over Missions 6-8 as the dependent variable for Session 2. Separate regression models were fit by experimental condition. Significant predictors for each model are denoted in Table 30 by their standardized regression coefficients. Table 30 Standardized Regression Coefficients of Significant Session-level Team Performance Predictors by Experiment 1 Session and Condition Metric Knowledge Short- Intact Session 1 Long- Intact Short- Mixed Long- Mixed Taskwork (12)* Teamwork Hurst Short Long..619(10)* - - Lyapunov Cooke et al. 80 Team Coordination
95 Session 2 Metric Knowledge Short- Intact Long- Intact Short- Mixed Long- Mixed Taskwork Teamwork Hurst Short (10)** - Long Lyapunov (10)** - The best session-level performance predictors tended to by dynamics measures. Taskwork knowledge was also a significant performance predictor in one model. Findings Coordination ratings consistently predicted mission-level team performance. Although results were not consistent across models, dynamics measures tended to predict session-level team performance. The superior predictive validity of process-oriented measures over knowledge-oriented measures supports previous patterns of findings in our lab which suggest that in this setting the interactions of team members and not the individual knowledge of team members or distribution of that knowledge across team members is what drives team performance Experiment 1: Discussion In summary, the three hypotheses raised earlier received mixed support. Team performance results supported the first two hypotheses in that the performance of teams who were exposed to long Retention Intervals or changes in Team Composition declined immediately after the manipulation. However, this performance decrement was short-lived for all affected teams who were performing at pre-manipulation levels after just one 40-minute mission. The team performance data failed to support the third hypothesis that long Retention Intervals would lessen the impact of changes in Team Composition. All teams except for short-intact teams displayed the same levels of team performance decrement. Interestingly the results from the teamwork knowledge analysis also supported the three hypotheses. Teams that remained intact and that were exposed to short Retention Intervals also gained greater knowledge about teamwork over the two experimental sessions relative to other teams. The teamwork knowledge results also support Hypothesis 1.3 in that long-mixed teams also showed some improvements in teamwork knowledge. Thus, team performance and teamwork knowledge results were as anticipated. Long Retention Intervals and changes in Team Composition were detrimental, though not long-lasting. What Cooke et al. 81 Team Coordination
96 was surprising was that the other measures taken produced patterns of results that contradicted the hypotheses. Both of the process measures (coordination ratings and CAST) contradict Hypothesis 1.2 and to some extent Hypothesis 1.1. Team coordination ratings improved after the Retention Interval for mixed teams, but not intact teams and the long-mixed teams demonstrated the greatest decrement in CAST false alarms across the two sessions. Taskwork knowledge results also corroborate this contradictory pattern. Mixed teams, but not intact teams, gained taskwork knowledge over the two sessions. Putting aside the knowledge results, it appears that the manipulations had very different effects on team performance versus process. Team performance was briefly negatively affected by changing Team Composition and long Retention Intervals, whereas, team process was positively impacted by the same manipulations. These results are intriguing from applied and theoretical perspectives. From an applied perspective they suggest that teams that are exposed to changes in Team Composition and maybe even longer Retention Intervals may suffer performance deficits in the short-term, but recover quickly to become behaviorally more effective teams. The kinds of process improvements seen in this study did not translate to performance improvements, but in the face of a more complex task with unexpected changes the teams with the better process may surpass other teams in terms of team performance. This prediction is supported by the positive correlation between the process and performance measures. At any rate, these results suggest that the costs of mixing teams (and longer intervals) may be minimal, yet the benefits may be well worth these costs. From a theoretical perspective, these results suggest that the Team Composition and Retention Interval manipulations are resulting in improved team process as evidenced here in coordination ratings and efficient situation assessment on the part of the team. Process could be improving through the construction of a shared mental model that improves when new team members are added to the mix. The Teamwork knowledge results support this for knowledge of the team and team roles. It could be that this additional knowledge translated into superior process. It could also be that the addition of new teammates simply increases the process possibilities for the team, resulting in superior and more flexible process. In this case, the process experience of a team would be effectively amplified by a power of two when the team members are mixed post- Retention Interval. That is, each member of an unmixed team has always worked with two other people (three team members total), whereas each member of a mixed team has worked with two other people (six other team members) not including working together on the newly mixed team (three team members; summative experience is = 9 for mixed versus 3 for intact). In the next section we take a deeper look at the process of these teams through the development of models of team coordination. These models are then used to extend these two explanations of the Experiment 1 results that are tested in Experiment 2. Cooke et al. 82 Team Coordination
97 4.3 Modeling Coordination In this section, we describe the two interrelated coordination modeling efforts that made use of data collected in Experiment 1 and that was then used to make predictions for Experiment 2. The first modeling effort derives a procedural model of team coordination at each target waypoint that is then used to generate a metric of coordination based on deviations from the model. The second modeling effort examines the temporal characteristics of the coordination score using a dynamical systems modeling approach Procedural Model Background As noted previously, it is important to model coordination procedures in the CERTT UAV-STE for three reasons: 1) To establish a benchmark that reflects ideal coordination so that conclusions can be drawn about the degree to which training or other interventions are effective, 2) To provide a coordination metric that can be used to inform the development of models of coordination acquisition and retention (Objective 3), and 3) To offer a more continuous metric of team performance within a mission (as opposed to a single mission outcome). Within the procedural or normative modeling framework for coordination research, a model is defined to predict team behavior under circumstances of interest to the researcher. The purpose of such modeling may be to explore progression toward a procedural optimum under certain interventions or to determine how far a team deviates from a procedural ideal. Procedural models are often designed to determine behavior that satisfies a set of constraints, and simultaneously maximize or minimize a set of criteria (e.g., linear programming). For example, a "traveling salesman" model might be appropriate to define ideal team behavior in the context of CERTT s UAV-STE scenario, in that teams would be required to fly from one waypoint to another, under certain order constraints (e.g., restricted operating zones, priority targets, and various ad hoc restrictions). Simultaneously, the modeled teams would be required to save as much fuel and time as possible, and photograph as many pictures as possible, in order to get the highest possible performance score. Optimal control models (e.g., Zachary, Campbell, Laughery, Glenn, & Cannon-Bowers, 2001) involve modeling adaptation to novel stimuli with representations of team inputs, outputs, self assessment, and information processing. These models may be created in the absence of data, or may be used in conjunction with an empirical research setting. For example, in the context of cognitive modeling, Kleinman, et al. (1992) discuss a general approach of first forming a normative model, then testing it against actual data, and finally revising it to adapt elements that are too deviant from actual data Approach The complexity of our task makes the cost of deriving a procedural model of an entire mission (e.g., solving the traveling salesman problem in addition to other constraints) prohibitive. Further it is not clear that the benefits of a procedural model at the level of whole mission performance Cooke et al. 83 Team Coordination
98 justifies these costs. Nor was it clear that team coordination was continuously exercised throughout the course of a mission. Rather in the UAV-STE task there appeared to be bursts of team coordination exercised at and around target waypoints. For the purpose of this project it was therefore desirable to model team coordination at a finer-than-mission level. Therefore, we formed an idealized procedural model of team interaction at target waypoints in the course of a UAV-STE mission. The procedural model was based on the standard operating procedure for taking pictures of UAV ground targets. Procedural task elements included: Information (a) AVO was told target restrictions by DEMPC (b) AVO was told target radius by DEMPC (c) AVO was told it is a target by DEMPC Negotiation (d) PLO coordinates altitude with AVO (e) PLO coordinates airspeed with AVO (f) AVO coordinates altitude with PLO (g) AVO coordinates airspeed with PLO Feedback (h) PLO tells team good picture was taken Essentially the standard operating procedure is a function of ordering, timing, and mode of task elements. Ordering corresponds to sequential ordering of task elements, timing corresponds to the onset of an element, and mode corresponds to the nature of the element; i.e., information mode versus negotiation mode versus feedback mode (Figure 21). The procedural UAV-STE target waypoint model is related to the procedural/stage theory of team coordination, insofar as it provides a blueprint for team coordination for the repetitive task of taking pictures of ground targets. t(i) t(i) - Information Initiated DEMPC t(f) PLO AVO t(n) t(n) - Negotiation Initiated t(f) - Feedback Initiated Optimal sequence is: I,N,F Figure 24. Procedural model (standard operating procedure) for photographing UAV ground targets. Cooke et al. 84 Team Coordination
.")
99 In the procedural model, the coordination procedure begins with the DEMPC telling the AVO information concerning upcoming target restrictions (task elements a through c). The AVO and PLO then negotiate the appropriate altitude and airspeed for taking the photograph through backand-forth negotiation (task elements d through g). Finally, the PLO tells the DEMPC and AVO that the target has been photographed and, thus, that the UAV may continue to the next routed waypoint (task element h). Implementation of the procedural model by teams was computed as a coordination score. Specifically, coordination scores were obtained by evaluating the relationship among the procedural model constituents at each target waypoint. Coordination scores were based on the procedural model (under standard operation constraints) of the task elements involved in photographing UAV ground targets. The time stamps of the task elements that went into the coordination scores were collected by an experimenter monitoring team communication in real-time using the time-stamped buttons on the panels of a coordination logger (refer to Figure 25). There was one panel for each target in a 40-minute UAV mission and the time stamps for each button on the target panel correspond to one the three procedural model task elements, information, negotiation, or feedback. Figure 25. Elements of the coordination logger associated with the Information (I), Negotiation (N), and Feedback (F) elements of the procedural model of coordination. Taking information, negotiation, and feedback to be the principal axes of the procedural model, we created a geometry-based measure of coordination. First, we normalize the space by feedback (at every target) in order to develop a distribution over the intrinsic procedural model geometry that relates all three principal axes to each other (β in Figure 25). This variable has some interesting properties. First, it is dimensionless. Specifically the constituent units (e.g., t(f) t(n)) are measured in seconds and therefore cancel in the relation β. Second, although the measure is theoretically continuous (on [-, ]) in practice it contains two qualitatively different Cooke et al. 85 Team Coordination
100 states: uncoordinated (β < 1) and coordinated (β > 1). Finally, a transition point (β = 1) separates these two different states. This transition point is a critical threshold beyond which bad coordination becomes good coordination. Specifically, in the bad region either N precedes I, or F precedes either I or N or both. When N precedes I this is indicative of a backlog of information. In the good region, all components are in the proper sequence for the procedural model, with larger values indicating more front-loading of information in terms of establishing the I component well before the target is approached. t(f. ) - t(f. ) = 0 t(f1) t(i1) t(f2) t(i2) t(f 2) t(n 2) t(f 1) t(n 1) β 1 > 1 β i = β = 1 β 2 < 1 t(n) t(f i ) t(i i ) t(f i ) t(n i ) Figure 26. Graphical depiction of the intrinsic geometry coordination score. t(i) Experiment 1: Coordination Results Coordination scores were calculated target-by-target. For this analysis, coordination scores were averaged across targets within a mission and are thus presented on a mission-by-mission basis. The scores were then transformed by taking the logarithm in order to better approximate a normal distribution. Figure 27 illustrates the distribution of mean coordination scores and the distribution of log-normal mean coordination scores across all teams for all missions. Table 31 represents the means and standard deviations of the transformed coordination scores averaged across teams, within conditions, by mission. Cooke et al. 86 Team Coordination
101 Std. Dev = 5.45 Mean = 3.7 N = Std. Dev =.66 Mean =.99 0 N = Figure 27. Distribution of mean and log normal mean coordination scores for all Missions across all teams. Table 31 Means and Standard Deviations for Transformed Coordination Scores (Averaged across Teams within Conditions) Retention Interval Short Team Composition Mission Intact Mixed Mean Coord. Score Standard Deviation N Total Total Cooke et al. 87 Team Coordination
102 Long Intact Mixed Total Total Pre-Manipulation Effects In order to rule out systematic effects prior to manipulations, assigned conditions were analyzed before the retention interval at performance asymptote (Mission 4). Forty-three of 45 teams were included in this analysis; two teams were excluded (Team 1 and 37) as their Mission 4 baseline scores were considered outliers in the team performance data set. A 2 (Team Composition) X 2 (Retention Interval) X 5 (Mission) repeated measures ANOVA was conducted treating Team Composition and Retention Interval as between subjects factors and Mission as the repeated measure. This analysis did not reveal significant pre-manipulation differences among groups. Manipulation Effects A pre-manipulation baseline score for each team was subtracted from the post-manipulation scores. For the intact teams, Mission 4 coordination score served as a baseline. Difference scores were obtained by subtracting these estimated Mission 4 scores from Mission 6 scores, Mission 7 minus Mission 4, and Mission 8 minus Mission 4. For the mixed teams, who had never actually worked together before, the baseline score was the average of their respective Mission 4 team scores. As before, difference scores were obtained by subtracting these estimated Mission 4 scores from Mission 6 scores, Mission 7 minus Mission 4, and Mission 8 minus Mission 4. The goal of the following analysis was to examine the experimental manipulations of Team Composition and length of Retention Interval on coordination scores. Thirty-nine teams were included in this analysis (Team 1 scores were excluded as this team was an outlier). A 2 (Team Composition) X 2 (Retention Interval) X 3 (Mission) repeated measures ANOVA was conducted, treating Team Composition and Retention as between subjects factors and Mission as a repeated measure. This analysis did not yield significant results. The coordination data set had Cooke et al. 88 Team Coordination
103 three missing data points. As a result, an analysis was conducted on the data set with the missing values. Then the analysis was conducted a second time using mean replacement. The results of the analysis were not significantly changed due to mean replacement. Findings Coordination scores among teams did not significantly differ prior to manipulations. Coordination analysis did not yield significant results due to team Team Composition and Retention Interval manipulations. The coordination score when averaged over targets within a mission does not seem to be sensitive enough to detect some of the condition differences that were discriminated by the coordination rating. The analysis in the following sections examines coordination at a finer level of analysis and with regard for temporal patterns identified via dynamical systems modeling Dynamical Systems Model Background The overall objective of this part of the work was to develop a dynamical systems model of team coordination with control parameters for predicting the effects of familiarity and retention interval on team coordination. Sub-goals for achieving the overall objective included conceptualizing the fundamental nature of team coordination as a dynamical system, identifying a model (or set of models) that apply to this conceptualization, evaluating the results of AF6 with reference to the model, and applying the model to UAV teams in order to predict the effect of interventions on team coordination. Work on the first two sub-goals is described in this section. Work relevant to the second two sub-goals is described in this section. In order to begin thinking about the fundamental nature of team coordination as a dynamical system, we had to think about how team coordination is structured over time. One of the first conclusions we made about team coordination is that it is an ongoing activity, not a static product or outcome. From a functional standpoint, coordination does not occur for the sake of coordination; it is best characterized as a means rather than an end. Second, we assumed that team coordination is a holistic phenomenon, as opposed to a collective phenomenon. This means that team coordination cannot be reduced to the sum of individual system components (here, UAV team members). Rather, the relations between the parts (e.g., the intrinsic geometry/coordination score) provide a measure taken across components involved in team coordination. Third, we assumed that because team coordination is fundamentally active, passivity would be associated with an uncoordinated state. Stated differently, in the absence of team-level activity (e.g., no communicating) then the system is drawn to a state of being uncoordinated. This is where the system evolves unless team members are interactive. In the language of dynamical systems theory, this suggests a model in which there is a stable attractor Cooke et al. 89 Team Coordination
104 ( uncoordinated ) intertwined ( homoclinic tangling ; Abraham & Shaw, 1992) with an unstable repellor ( coordinated ). Therefore, we conceptualized a dynamical system that naturally evolves from coordinated to uncoordinated in the absence of the team-level activity, team coordination. The next sub-goal was to identify a model (or set of models) that applies to this conceptualization. In order to identify a model (or set of models) we sought to capitalize on the dynamical similitude of other dynamical systems to the team coordination dynamical system. Dynamical similitude is the notion that dynamics often generalize across systems, independent of the specific components that make up the system. For example, a horse transitioning from a trot to a gallop is identical to the transition from anti-phase to in-phase finger tapping, when considered from a dynamical systems perspective (Kelso, 1995). In thinking about our problem from this perspective, we reviewed the literature on dynamical systems theory in general (Alligood et al., 1996), applied to social psychology (Vallacher & Nowak, 1994), and engineering (Beltrami, 2007). Our search identified one system in particular that shared all the same dynamical properties as our conceptualization of team coordination dynamics: the inverted pendulum. The inverted pendulum consists of a long thin rod balanced on a surface, for example the palm of a hand. If the rod loses its upright balance, it behaves as an ordinary damped pendulum: It swings straight down coming to a rest after a few oscillations. Straight down is an attractor. However when the rod is balanced on a controlling device; e.g., the palm of a hand, the hand can counteract the pendulums tendency to swing straight down by actively balancing it in the upright, repelling orientation. In terms of dynamical similitude, this is identical to our conceptualization of team coordination as an activity that maintains a team in an inherently unstable (repelling) state. In the absence of team-level activity (cf. actively balancing the rod ), the team evolves toward the uncoordinated state. The inverted pendulum is a relatively simple mechanical system that elegantly describes the dynamics we hypothesized for team coordination. That is, although many different levels can be included in the system description in order to refine our understanding of rod balancing; e.g., neurons, eyes, wrists, feet, surface supporting feet, etc., most basically it is the level of hand movements coordinated with rod displacement that captures our hypothesized team coordination dynamics. Although the mechanical system is simple, because of the intertwined attractor and repellor, stabilized by the controlling hand, the dynamics become complex. Therefore, our next step was to research experimental analysis of the inverted pendulum. In general, we found that this dynamical system can be characterized as actively stabilizing an inherently unstable system, including rod balancing (Treffner & Kelso, 1999) and center-of-pressure (COP) dynamics in control of upright human posture (Collins & De Luca, 1993). The next step was to review this research in order to identify how this model has been applied Approach In both the rod balancing and COP research, time-scaling techniques were used to describe the dynamics of actively stabilizing an inherently unstable system. In particular the Hurst exponent (H) is often measured via rescaled-range analysis (R/S; Hurst, 1951), in order to investigate the time-scaled properties of actively stabilizing an unstable system. Next, we describe the theory and interpretation of H, followed by a brief description of estimating H using R/S analysis, Cooke et al. 90 Team Coordination
105 including identifying inflection points between qualitatively different values of H in a single stochastic process. The stochastic (stochastic = deterministic + random) diffusion equation Δx 2 = 2DΔt (Einstein, 1905) states that the average mean square displacement ( stands for average) of a variable x is proportional to time displacement Δt depending on the diffusion coefficient D, where D is the measure of the random component of the stochastic process. Mandelbrodt and Van Ness (1968) integrated this equation into a family of stochastic processes called fractional (i.e., fractal) Brownian motions: Δx 2 ~ Δt 2H {0 < H < 1}. In this family of stochastic processes, the random component varies as a function of H (the Hurst exponent). Specifically, H = 0.5 is a true random walk, 0.5 < H <= 1 is a correlated random walk with a trend: positive long-range correlation, and 0 <= H < 0.5 is a correlated random walk with a different type of trend: negative long-range correlation. Essentially long-range correlation is observed when variance at one timescale is related to variance at another timescale in a way that would not be expected from simply iterating a random walk, in which case variance is a one-to-one function of the number of steps (i.e., timescale) the random walk has generated. Positive long-range correlation (also termed persistence or long memory depending on the application) is observed whenever past events have effects on future events, such as when a stochastic system is in an exploratory mode. Negative long-range correlation (also termed antipersistence ) is also observed whenever past events have effects on future events, but in this case the stochastic system is in a performatory mode, after reaching the exploratory boundary (Gibson, 1966). Returning to the research on rod balancing and COP dynamics, these systems tend to exhibit positive long-range correlation (exploratory dynamics) over shorter timescales and negative long-range correlation (corrective dynamics) over longer timescales: small deviations from upright at shorter timescales tend to be corrected at longer timescales (Figure 28). The plots in Figure 28 are in log-log coordinates. In practice to estimate H, a regression model is fit where log Δx 2 = H log Δt, where H is the leastsquares slope. Exploration (H > 0.5) Correction (H < 0.5) log Δx 2 Random (H = 0.5) log Δt Figure 28. Persistence, antipersistence, and random walk Hurst slopes. This pattern of findings, short-term exploration followed by long-term correction, is general across the rod balancing and COP dynamics literature. Therefore, it is important to estimate the inflection point between two qualitatively different aspects of a stochastic process. This is Cooke et al. 91 Team Coordination
106 accomplished by using the minimum R 2 method (e.g., Treffner & Kelso, 1999), in which the regression model is refit by incorporating longer and longer timescales of x displacement measurement. Following the R/S method for measuring H, a trial (or time) series is separated into bin sizes, starting with the trial series as a whole (n = length), and repeatedly halving the series into smaller and smaller non-overlapping bins (i.e., bin size = n/2, n/4, n/8, etc.). The average range/standard deviation = R/S is then calculated for each level of binning. The regression model log R/S = log Δbin size is then fit repeatedly, increasing bin size with each fit. The R 2 values of each fit are then inspected and the level of binning with the smallest R 2 value is selected as the inflection point. Separate H estimates are then made for the bin sizes up to the inflection point and the bin sizes after the inflection point using the regression model log R/S = log Δbin size. The slopes of these regressions are the short-term and long-term H estimates. In Figure 28 the short-term H would be significantly larger than 0.5 and the long-term H would be significantly smaller than 0.5, corresponding to exploration and correction, respectively. However, some stochastic processes appear to be more flexible than others, requiring either a lesser degree of correction beyond the inflection point or equivalently a longer region of exploration. For this reason we will refer to the long-term estimate of H in coordination trial series as an estimate of coordination flexibility. The dynamical similitude of our hypothesized dynamical systems model of team coordination is amenable to the analysis of coordination dynamics similar to the analysis of actively stabilizing an inherently unstable system (e.g., inverted pendula). That analysis provides insight into the stochastic dynamics of team coordination, including differences in dynamics (e.g., coordination flexibility) due to experimental manipulations. However, there is another (more bottom-up ) aspect of our approach to modeling team coordination as a dynamical system that stems from two concerns. First, from a purely deterministic standpoint, what do the dynamics look like? Second, using the inverted pendulum metaphor, what happens when the top of the rod is perturbed unexpectedly; that is, what is the teams balancing response? From a bottom-up perspective, we used the method of attractor reconstruction (Abarbanel, 1996) to unfold the dynamical system into an appropriate phase space from a scalar observation, the team coordination trial series. Unfolding is the process of identifying the true dynamics of the trial series, such that there are no false projections not due to dynamics. An example is a circular orbit (e.g., simple pendulum) projected in one dimension, position. In one dimension, as the dynamic evolves there is a straight line with the current position moving back and forth along the line, slowing around the endpoints of the line. However, we know this is not the true picture of these dynamics; specifically, they are being projected on only one axis: position. Unfolding the dynamics into a second dimension (velocity) provides the true picture of a circle rather than a line. Attractor reconstruction works the same way: if you do not know the differential equation governing the dynamics you can still observe the system s behavior by unfolding a scalar observation trial series that the system generated. Attractor reconstruction requires the application of the method of delays in order to estimate an appropriate time delay (τ) for unfolding the dimensions of phase space (d E ), and the method of false nearest neighbors in order to estimate the number of dimensions necessary for completely unfolding the dynamics (i.e., removing false proximities that are not due to dynamics; Kennel, Brown, & Abarbanel, 1992). After reconstructing the attractor, the stability of trajectories on the attractor was evaluated by calculating the largest Lyapunov exponent. Cooke et al. 92 Team Coordination
107 Every dimension of a dynamical system (in a reconstructed dynamical system this is equal to the number of embedding dimensions) can be characterized in terms of the behavior of nearby trajectories along the dimension. Specifically, the exponential rate of convergence or divergence of trajectories along each dimension as the system evolves is characterized using Lyapunov exponents. A negative Lyapunov exponent (λ < 0) characterizes convergence (high stability) whereas a positive Lyapunov exponent (λ > 0) characterizes divergence (instability). A Lyapunov exponent equal to zero (λ = 0) is characteristic of a dimension along which trajectories are neither converging nor diverging. The set of Lyapunov exponents are ordered from largest to smallest. This is the Lyapunov spectrum of the dynamical system. The largest Lyapunov exponent, λ 1, is an index of overall attractor stability. Specifically, λ 1 > 0 is associated with a chaotic attractor. In a chaotic attractor initially close trajectories diverge exponentially proportional to their initial separation. λ 1 < 0 is associated with a globally stable attractor. Along every dimension of the dynamical system trajectories tend to converge exponentially toward the same trajectory, proportional to their initial separation. In practical terms, the difference between having λ 1 > 0 versus λ 1 < 0 is that given small perturbations to the system trajectories tend not to be recovered in the former case, but are recovered rather quickly in the latter. The relationship between λ 1 and recovery from perturbation is characterized as the systems relaxation time: λ 1 f(δ) f(δ + Δt) -1, where δ is a perturbation. We calculated overall attractor stability (i.e., λ 1 ) from the reconstructed attractors in order to estimate coordination stability. In order to calculate λ 1, the essential idea is to follow two nearby trajectories (e.g., i and j) and compute their average logarithmic rate of convergence or divergence (d ij ): (a) d ij C ij e λ1δt (b) ln d ij ln C ij + λ 1 Δt Where C ij is an arbitrary small initial separation between trajectories, Δt is the time step (e.g., one target), and λ 1 is the largest Lyapunov exponent. Equation (a) is the equation of a Lyapunov exponent and Equation (b) is a linear version of (a). Using a method described by Rosenstein, Collins, and De Luca (1993; see also Sato, Sano, & Sawada, 1987) attractor reconstruction is used to represent a team s trial series (of length N) as a N (d E 1)τ X d E matrix of trajectories. Each row (observation) of the matrix is thus a d E -component (lagged by τ) observation of the trial series. The forward pointing NN of each observation is then obtained. The analysis then proceeds by tracking the mean rate of separation across all of these initially close trajectories as a function of the time step Δt. A least-squares line is then fit to the equation ln d ij = Δt (the initial conditions C ij intercept is not estimated). The slope of this line is the estimate of λ Experiment 1: Dynamics Results All dynamical analyses were conducted separately over pre-manipulation (Session 1) and postmanipulation (Session 2) trial series. Session 1 and Session 2 trial series were composed of coordination scores concatenated over Session 1 and Session 2 missions, respectively. Before conducting the Hurst analyses, a surrogate analysis was conducted. The goal of a surrogate Cooke et al. 93 Team Coordination
108 analysis is to compare the dynamics embodied in the original dataset with a randomly shuffled surrogate of itself. The purpose of comparing the correlational structure of the surrogate trial series to the correlational structure of the observed trial series is to detect the presence of spurious long-range correlation in short trial series. For the pre-manipulation time series, across all teams both the mean observed H (M =.75) and the mean randomly-reshuffled surrogate H (M =.65) were significantly larger than the random walk value of H =.5 (t (42) = 16.41, p <.001 and t (42) = 11.41, p <.001, respectively). However a paired samples t-test indicated that the mean observed H was significantly larger than the mean surrogate H (t (42) = 5.38, p <.001). For the post-manipulation trial series, both the mean observed H (M =.79) and the mean surrogate H (M =.70) differed significantly from the null value of H =.5 (t (38) = 16.68, p <.001 and t (38) = 15.03, p <.01, respectively). Again a paired samples t-test indicated that the mean observed H values were significantly larger than the mean surrogate H values (t (38) = 3.90, p <.001). Based on the results there was some degree of spurious long-range correlation, however because the observed trial series had significantly greater long-range correlation than the random surrogate baselines the results provide strong evidence long-range correlation across trial series. Two measures of team coordination dynamics were calculated across the coordination score trial series. These included the Hurst exponents (short and long region; related to coordination flexibility) and the largest Lyapunov exponent (related to stability of coordination). These measures were taken separately over Session 1 and Session 2 for each team. Histograms of the coordination dynamics measures are given in Figures 29a-f. Sample size, mean, and standard deviations for coordination dynamics measures for each condition in the experiment over sessions 1 and 2 are presented Table Std. Dev =.10 Mean =.821 N = SHRTREG Figure 29a. Short-region session 1. Cooke et al. 94 Team Coordination
109 Std. Dev =.31 Mean =.56 0 N = LONGREG Figure 29b. Long-region session Std. Dev =.03 Mean =.004 N = LYAP1 Figure 29c. Stability session 1. Cooke et al. 95 Team Coordination
110 Std. Dev =.10 Mean =.91 0 N = SHRTREG Figure 29d. Short-region session Std. Dev =.29 Mean =.49 0 N = LONGREG Figure 29e. Long-region session 2. Cooke et al. 96 Team Coordination
111 Std. Dev =.05 Mean =.011 N = LYAP1 Figure 29f. Stability session 2. Table 32 Means and Standard Deviations for Coordination Dynamics Measures (Averaged across Teams within Conditions) Treatment Condition Session Statistic H-Short H-Long λ 1 M SD Short- Intact Long- Intact n M SD n M SD n M SD Cooke et al. 97 Team Coordination
112 Short- Mixed Long- Mixed n M SD n M SD n M SD n M SD n Session 1: Pre-manipulation Effects The goal of this analysis was to test for pre-manipulation effects that need to be controlled for in post-manipulation analyses. There were N = 43 pre-manipulation teams. A Team Composition X Retention Interval ANOVA was conducted separately on Hurst short region, Hurst long region, and Lyapunov exponents. In addition a Levene test for equality of error variance across conditions was run. All Levene tests failed to reject the null hypothesis of equality of error variance. The Team Composition X Retention Interval ANOVAs failed to yield any significant differences between pre-manipulation experimental condition for Hurst short and Hurst long. There was a main effect of Retention Interval on the Lyapunov exponent (F (1, 39) = 7.45, p =.009, η 2 =.16). Session 1: Relationship to Outcome Measures Coordination dynamics measures were tested for relationships with team performance and team situation awareness outcome measures. Relationships were identified as significant zero-order correlations between dynamics measures and outcome measures. The team performance outcome measure was taken as Mission 4 team performance (i.e., the team performance asymptote) and the team situation awareness measure was taken as the number of roadblocks overcome during Session 1. There were no significant correlations between the coordination dynamics measures and team performance outcome. There was a significant correlation between the Session 1 Lyapunov exponent and the number of roadblocks overcome score (r (41) = -.31, p <.05). This result suggests that overcoming team situation awareness roadblocks was associated with more stable team coordination dynamics. Session 2: Post-manipulation Effects The goal of this analysis was to test for post-manipulation effects due to the experimental manipulations. There were N = 39 post-manipulation teams. A Team Composition X Retention Cooke et al. 98 Team Coordination
113 Interval ANOVA was conducted separately on Hurst short region, Hurst long region, and Lyapunov exponents. In addition a Levene test for equality of error variance across conditions was run. For Hurst exponents, seven teams were not included in the analysis due to overly truncated trial series. For these teams a sign test revealed that all long region Hurst exponents were smaller than the short region Hurst exponents (prob. =.5, p <.02). None of these teams exhibited negative long-range correlation. All Levene tests failed to reject the null hypothesis of equality of error variances. There were no significant effects of experimental condition on the short region Hurst estimates. For the long region estimates, there was a significant main effect of Team Composition (F (1, 28) = 4.46, p <.05, η 2 =.14). Intact teams exhibited negative long-range correlation (M =.34) and mixed teams exhibited positive long-range correlation (M =.57; Figure 30). Figure 30. Short and long (separated by inflection point) region Hurst estimates by experimental condition. Error bars represent 95% confidence intervals, solid lines represent observed fit, and dashed lines represent random walks. Due to the presence of a significant pre-manipulation Retention Interval effect on the Lyapunov exponent, Session 1 Lyapunov scores were partialled from the post-manipulation Team Composition X Retention Interval ANOVA in order to control for pre-manipulation differences. Mixed pre-scores were calculated as the average of the three pre-manipulation teams represented in the post-manipulation mixed team. There was a significant main effect of Team Composition (F (1, 34) = 3.91, p <.06, η 2 =.10) with mixed teams exhibiting greater stability (M = -.01) than intact teams (M =.03). Cooke et al. 99 Team Coordination
114 Session 2: Relationship to Outcome Measures Coordination dynamics measures were tested for relationships with team performance and team situation awareness outcome measures. Relationships were identified as significant zero-order correlations between dynamics measures and outcome measures. In order to account for the significant pre-manipulation Team Composition X Retention Interval effect on team performance, Mission 4 team performance was partialled from the Mission 6 team performance score. Paritialling out Mission 4 team performance from Mission 6 team performance, the correlation between Session 2 long region Hurst exponents and team performance was significant (r (30) = -.38, p <.03). This result indicates that the most flexible teams over Session 3 tended to also be teams who experienced the brief Mission 6 performance decrement. Controlling for the premanipulation Lyapunov exponents, the correlation between Session 2 Lyapunov exponent and number of Session 2 roadblocks overcome was significant (r (36) = -.36, p <.03). This indicates that overcoming roadblocks is associated with stability of coordination over time. Findings There was an unexpected pre-manipulation effect of Retention Interval on the Lyapunov exponent. Post-manipulation mixed teams exhibited more flexible coordination dynamics than postmanipulation intact teams. Post-manipulation flexibility was correlated with a Mission 6 team performance decrement. Controlling for pre-manipulation Lyapunov scores, post-manipulation mixed teams exhibited more stable coordination dynamics than post-manipulation intact teams. Higher coordination stability was associated with overcoming more roadblocks during both sessions of the experiment. Summary of Modeling Results Mission level coordination scores were not sensitive to condition differences seen in performance and process measures. However, when the coordination scores were considered as a finer grained trial series via dynamical systems approaches the results were clear. The coordination dynamics of mixed teams displayed more flexibility and stability than that of intact teams. These results may seem counterintuitive, but they correspond well with the other findings from Experiment 1. Changes in team composition may produce short-lived performance decrements, however, they also result in stronger teams in terms of process and coordinated response to change in the environment. The increased flexibility and stability of the mixed teams supports the general conclusion that mixing strengthens team process. The combination of stability and flexibility may also seem counterintuitive, however, the combination results in a team that is flexible enough to bend in response to change in the environment, and therefore stable with respect to roadblock perturbations. Cooke et al. 100 Team Coordination
115 4.4. Experiment 2: Training Adaptive Teams Experiment 2: Background: Theoretical Accounts of the Successful Coordination of Mixed Teams and Hypotheses In Experiment 1, mixed teams demonstrated improvements in team process (coordination ratings and situation assessment efficiency) after the retention interval. The mixed teams also demonstrated different patterns of coordination dynamics that paralleled their team process development. In this section we describe some team-level mechanisms that could contribute to the development of adaptive (i.e., flexible, yet stable) team coordination. These mechanisms are then cast in terms of training regimes for training adaptive coordination in teams, the basis for Experiment 2. The transition between the success of the mixed teams in Experiment 1 and training regimes in Experiment 2 deserves some discussion. In Experiment 1, training (PowerPoint and first four missions) was identical for all Session 1 teams. The manipulation took place in the form of team composition or retention interval changes that followed this identical training. The question addressed in this section has to do with identifying the mechanism that occurred in the mixing of team members or in a longer delay so that this mechanism can be deliberately trained. The mechanism then becomes something that is conveyed through training and hopefully transferred to Session 2 in the form of adaptive team coordination. The principles of transfer of learning for teams follow closely those that apply to individual learning. Generally, the closer the match between conditions in the training situation and the actual job, the higher the rate of transfer of training (Thorndike & Woodworth, 1901; Singley & Anderson, 1989). While there are sometimes exceptions to that rule the literature is replete with examples of high fidelity resulting in high transfer for teams (e.g., Bassok & Holyoak, 1989). The key question for transfer revolves around the type of fidelity that is of interest. Physical fidelity refers to how closely the training simulation looks like the conditions (including equipment) on the job. Functional fidelity refers to how well the training simulation acts like the conditions on the job. Psychological fidelity, which is somewhat more controversial than the other two types of fidelity, refers to how well the simulation acts like the conditions on the job or exercises the cognitive processes that are required for the job (Goettle, Ashworth, & Chaiken, 2007). It is possible for transfer to take place even if not all of the three types of fidelity in a situation can be called high. Conversely, one might have high fidelity in the physical domain (or one of the other domains), yet transfer may not take place because one of the other fidelity domains is low (Andrews and Bell, 2000). For tasks in complex settings such as UAV command-and-control, the trick is to identify those aspects of the task environment that are most critical for high levels of fidelity. In addition, the transfer issue cannot be resolved without knowing, a priori the conditions of the test. Therefore fidelity can only be judged relative to the test. The optimal training environment and fidelity characteristics for high performance teams in predictable environments may differ when the goal is adaptive team coordination in dynamic environments, as it is for this project. Cooke et al. 101 Team Coordination
116 In Experiment 2, we hold physical fidelity constant by using the same UAV-STE for all conditions. However, the manipulations of training regimes in accord with the theoretical mechanisms identified may have the subtle side effect of improving functional or psychological fidelity of training. Therefore we assume that training regimes that produce adaptive teams in dynamic environments do so at least partly because they optimize the match between training and test Shared Mental Models One explanation offered in the literature for high-performing and adaptive teams is the concept of shared mental models. The idea is that a common understanding, vision, or knowledge across team members underlies superior team performance (Cannon-Bowers, et al., 1993; Orasanu, 1990, Stout, Cannon-Bowers, Salas, & Milanovich, 1999). Shared mental models could also lead to implicit coordination on the part of team members (Entin & Serfaty, 1999), thereby having an impact on coordination. The development of a shared mental model among mixed teams in Experiment 1 is one mechanism that could potentially explain improved coordination. In Experiment 1 we would assume that the act of adding new (i.e., mixed) team members to the team facilitated the development of a shared mental model. This may be a bit counterintuitive in that one could also assume that intact teams together for a longer period of time would have better chances of converging on a shared understanding of the task and team. Indeed based on the results of Experiment 1, the intact teams did gain more shared knowledge of teamwork than mixed teams. However, one could also argue that changes in team composition may illuminate for the observant team member the essence of the task from the perspective of each role by virtue of exposure to slightly different ways of doing the same thing. In fact, the data from Experiment 2 point to more sharing of taskwork knowledge for mixed teams over same teams. Thus, the Experiment 1 findings on changes in team composition and shared mental models are dependent on the type of knowledge that is shared. It may be however that a shared mental model of the taskwork, not teamwork, lends itself to implicit coordination in the UAV-STE task and thus, makes for a more adaptive team in the long run. How can we transition the shared mental model (taskwork) mechanism to team coordination training? One way to approach this is through cross training in which team members are exposed to the taskwork from the perspective of the three different roles. Cross training has been shown to be effective in some experiments for improving team performance presumably through the development of shared mental models (Cannon-Bowers, Blickensderfer, & Bowers, 1998). Cooke, Kiekel, Salas, Stout, Bowers, and Cannon-Bowers (2003) also found that cross training directly impacted shared mental models with cross trained teams understanding more about the other aspects of the task than teams without cross training. Therefore in Experiment 2, a crosstraining condition was included as a test of the shared mental model explanation of the Experiment 1 results. In essence we are predicting (Hypothesis 2.1) that to the extent that shared mental models are required for adaptive teams, then cross training should transfer and result in adaptive teams in the UAV-STE Experiences with Task Perturbations Cooke et al. 102 Team Coordination
117 Whereas the development of a shared mental model is one explanation of the mixed team process advantages in Experiment 1, another explanation is suggested by the dynamic systems model. In particular, mixed teams demonstrate coordination patterns that indicate that they are still exploring coordination possibilities (i.e., exploratoratory behavior; Gibson, 1966), but intact teams do not. Intact teams reached a coordination boundary by the second session (i.e., exploration plus correction). Further the mixed teams dynamics revealed flexibility coupled with stability to perturbation, or metastability (Gorman, 2006). Contrary to traditional thinking therefore (i.e., shared mental model theory), the ideal team does not demonstrate rigid coordination patterns (e.g., intact teams), but a pattern of variability that affords flexibility to change coordination when faced with novel situations. The results were then used to inform a mathematical model of the dynamical system. The theory-comparison results can be formulated as a deterministic mathematical model for team coordination dynamics: (i) Variability in team coordination (C) increases as a power law (e.g., H >.5) of timescale (dt) up to a critical boundary threshold (variability flexibility) (ii) At a critical threshold this change (C ) becomes unstable and saturates to a constant (equilibrium) value (iii) Ф on [0, 1] is a control parameter that quantifies Team Composition (familiarity) and Ω on [0, 1] is a control parameter that quantifies the ability to attenuate an experimental perturbation (e.g., a TSA roadblock) (iv) d 2 C / dt 2 = f (C, Ω, Ф) such that C = C + Ω(C ) Ф(C ) 3 C is a differential equation for a self-sustaining oscillator. The right hand side of the equation is composed of three C terms. C represents the intrinsic geometry coordination score. This term quantifies the amount of displacement of coordination due to the changing relation among the I, N, and F procedural model components. + Ω(C ) controls relaxation time when coordination is perturbed, for example by a TSA roadblock (this term is elaborated in the next section). The last term, Ф(C ) 3, represents the capacity of the UAV team to periodically inject or transfer information in the system as a function of Familiarity. (Note that Ф(C ) 3 is the second term in a series expansion called the Rayleigh escapement; Abraham and Shaw, Thus for some applications we might include higher terms however the model would be essentially unchanged.) The first two terms are conservative in terms of information processing. The last term is traditionally non-conservative; i.e., Ф(C ) 3 modulates the capability for influx or outflux of information in the system. This can be taken either literally to mean that information is not conserved when team members are mixed or alternatively that information is Cooke et al. 103 Team Coordination
118 conserved and mixing taps extant information in new ways. The latter interpretation seems more plausible given that the relations of individual team members to the UAV-STE task environment (their roles on the team) do not change as a function of mixing. Regardless of interpretation this last term controls for differential onset of boundary constraints in team coordination. (Gorman, 2006, p. 101) We used the dynamical systems model in order to simulate various coordination dynamics to generate predictions about the impact of a different training intervention on team coordination. Specifically, the model predicted that the larger coordination boundaries of mixed teams could be duplicated in teams who undergo high levels of experimental perturbation during training in contrast to teams with small coordination boundaries (e.g., who either follow a script or were cross-trained for a shared mental model). Specifically, the model predicts that tuning the Ω parameter is another route to achieving the large coordination boundaries of a mixed team. The model predicts that following a script or cross-training will not lead to increased coordination boundaries for intact teams because these conditions do not directly influence Ω (recovery from perturbation) the way perturbations do. In this regard, the model assumes that the introduction of new team members perturbs the coordination process resulting in more adaptive teams. That is, new team members introduce slightly different procedures for coordinating, thereby, driving the mixed teams to generate a large coordination repertoire. We propose therefore that a training regime that includes deliberate perturbations that force teams to coordinate in alternative ways will result in more adaptive teams (Hypothesis 2.2). The extent to which this training regime results in adaptive teams over other training regimes is support for the perturbation explanation of mixed team adaptability Procedural Learning The dynamical systems model also suggests that rigid, procedural training would not directly impact Ω, resulting in dynamics comparable to Experiment 1 intact teams, and in the long run lower levels of team adaptability. A transfer of training explanation also predicts that the way to make teams that adapt to a changing environment is to expose them in training to change, the opposite of a rigid, procedural training regime. Thus both of these views predict that rigid, procedural training would result in teams that are not adaptive. On the other hand, it could also be argued that rigidly trained teams would be high-performing teams and effective coordinators in the case of a highly stable environment. Furthermore, in the case of overlearning, that these teams would excel under pressure at by depending on rigidly structured coordination. There are a number of reasons to compare cross-training and perturbation training with procedural training. It is likely the case that rigid procedural training provides a foundation for cross training or perturbation training (i.e., you cannot introduce variance in the task without some foundation) and so it is of interest to understand how this training fairs as a baseline for comparison. Finally, although our models and theories suggest that rigid, procedural training is at odds with the development of adaptive teams, it is a common form of training in the military. For example, a team might be taught a scripted set of procedures and asked to follow them as strictly as possible until they are well understood and performed to the point of overlearning. Cooke et al. 104 Team Coordination
119 In the UAV context, procedural training can conform to the sequential coordination rules of the procedural model in which the DEMPC provides target information, followed by AVO and PLO negotiation and completed by PLO feedback. We predict that procedural training will result in high performance under stable environmental conditions, but rigid coordination and ultimately poor performance in the face of change in the environment (Hypothesis 2.3) Hypotheses for Experiment 2 Hypothesis 2.1: Cross training should transfer and result in adaptive teams in the UAV-STE to the extent that shared mental models are required for adaptive teams. Hypothesis 2.2: A training regime that includes deliberate perturbations that force teams to consider alternative ways to coordinate will result in adaptive teams. The extent to which this training regime results in adaptive teams over other training regimes is support for the perturbation explanation of mixed team adaptability. Hypothesis 2.3: Procedural training will result in high performance under stable environmental conditions, but rigid coordination and ultimately poor performance in the face of change in the environment Method Participants Ninety-six individuals recruited from Arizona State University's student body and from the local surrounding area voluntarily participated in one seven-hour session and a second 4 hour session which was scheduled 8-10 weeks after the first session. Individuals were compensated for their participation by payment of $10.00 per person per hour with each of the three team-members on the highest performing team receiving a $ bonus. Participants were assigned to their teams based on scheduling constraints. The participants were randomly assigned to role (AVO, PLO, or DEMPC) and teams were randomly assigned to one of three conditions: cross-training, procedural, or perturbation Condition. Each team was comprised of three members therefore a total of 32 teams participated in the study. Of those teams, five did not return for the second experimental session due to fact that one or more of the team members had a scheduling conflict. Two of these teams had been assigned to the cross-training treatment group, one to the procedural group, and two others to the perturbed treatment group. One other team did not return for the second experimental session due to a conflict that had arisen early in the first experimental session. The experimenters terminated the data collection session to ensure the comfort of the participants. No teams were excluded from the analyses because of outlying data points. Therefore, we report the analyses for a total of 26 teams: 10, 8, and 8 teams in the cross-training, procedural, and perturbed treatment groups, respectively. The majority of the participants were Caucasian (66.7%) with males representing 74% of the sample. Participants ranged in age from Mean age was 28. Cooke et al. 105 Team Coordination
120 Equipment and Materials The experiment took place in the CERTT Laboratory configured for the UAV-STE (described previously). For the most part, materials were the same as those used in Experiment 1 with the exception of the installation of upgraded Dell 2001 FP 20 LCD flat-panel computer monitors for each participant workstation and the experimenter workstation. In addition, a modification made to the experimenter workstation allowed experimenters to selectively introduce static into the team s communications. This capability was utilized during the training of perturbed teams and is described in the procedure section. Minor changes were made to the team coordination logger to better reflect the procedural model and add to ease of use by allowing experimenters to undo errors in logging, and indicate whether the experimenter was uncertain of a particular judgment. Also, if information was repassed, the experimenter simply could now click on the associated item again (whereas the interface used in Experiment 1 utilized three check boxes for repasses). In addition to software, mission-support materials (i.e. rules-at-a-glance for each position, two screen shots per station corresponding to that station's computer displays, and examples of good and bad photos for the PLO) were presented on paper at the appropriate workstation. Other paper materials consisted of consent forms, debriefing forms, and checklists (i.e. set-up, data archiving and skills training). Cooke et al. 106 Team Coordination


121 Figure 31. Coordination Logger interface used in Experiment Measures Performance, knowledge measures (taskwork and teamwork), and team process behaviors (including CAST SA, coordination ratings, coordination scores and dynamics) served as dependent measures in this study. Demographic items, video records, and communication records were also collected. Of the measures used in Experiment 1, the personality surveys were not administered in Experiment 2. Details of all of the measures used in Experiment 2 are described in the measures sections of Experiment 1. Performance, coordination, and knowledge measures were administered and scored identically to Experiment 1. A similar CAST measure was used in this experiment with changes made to several scenarios previously used in Experiment 1 (See Appendix L for CAST scenarios used in Experiment 2) Procedure The experiment consisted of two sessions (see Table 33). Session 1 lasted approximately seven hours and Session 2 lasted approximately four hours. Sessions were separated by an 8-10 week Cooke et al. 107 Team Coordination
122 retention interval. Prior to arriving at the first session, the three participants were randomly assigned to one of the three task positions: AVO, PLO or DEMPC. The team members retained these positions for the remainder of the study. Table 33 Experimental Protocol Session 1 Session 2 Consent Forms Skills Refresher Task Training Mission 6 Mission 1 Knowledge Measures Knowledge Measures Mission 7 Mission 2 Mission 8 Mission 3 Mission 9 Mission 4 Demographics Mission 5 Debriefing In the first session, the team members were seated at their workstations where they signed a consent form, were given a brief overview of the study and started training on the task. During training, all the team members were separated by partitions regardless of the condition they were assigned. Team members studied three PowerPoint training modules at their own pace and were tested with a set of multiple-choice questions at the end of each module. If responses were incorrect, they were instructed to go back to the PowerPoint tutorial and correct their answers. Experimenters provided assistance and explanation if their second response was also incorrect. The first two PowerPoint training modules for each of the three experimental conditions (crosstraining (CT), procedural, and perturbed were identical and consistent with training used in Experiment 1. The third module for each condition was also identical except for the final eight slides that were specific to each particular condition. Participants in the CT condition received a primer on the two other roles (i.e., the AVO would view slides describing the PLO and DEMPC roles and screens). Participants in the procedural condition received slides describing the three phases of coordination (Information, Negotiation, and Feedback) that they should follow. Participants in the perturbed condition viewed a short review on UAVs which covered their history and current and future uses. Once all team members completed the tutorial and test questions, a training mission was started in which experimenters had participants practice the task, checking off skills that were mastered (e.g., the AVO needed to change altitude and airspeed, the PLO needed to take a good photo of a target) until all skills were mastered (See Appendix J for the checklist of skills). Again, the experimenters assisted in cases of difficulty. This individual skills check was identical to the skills check in Experiment 1 and other CERTT UAV-STE experiments. After the hands-on practice phase, participants were then exposed to condition-specific scripted activities which lasted 15 minutes (See Appendix M for the scripts). The CT teams received hands-on cross training on the other roles (i.e., the AVO and PLO would receive training on the Cooke et al. 108 Team Coordination
123 DEMPC role. The procedural teams received practice in communicating and coordinating using the procedural model and were provided with a hardcopy of the model to refer to throughout Session 1 (See Appendix N). Lastly, the perturbed teams participated in a team building exercise in which they were instructed to find static (a white noise signal) within the communications system and determine the directionality of the static (i.e., determine which team member was generating the static, and who specifically receives that static). This training was assumed to exercise alternative communication paths (See Appendix M for the script used). Training took a total of 1 hour and 45 minutes. After training, the partitions were removed and the team started their first 40-minute mission. All missions required the team to take reconnaissance photos of targets. However the number of targets varied from mission to mission in accordance with the introduction of SA roadblocks at set times within each mission. See Table 34 for number of targets per mission. Mission 1 for all teams was identical. However, for Missions 2, 3, and 4, teams in the Perturbed condition were exposed to 3, 4, and 6 perturbations in each mission respectively. Exposure to perturbations in the context of the mission was considered part of the training for this group. Perturbations were administered at set points within each mission in an effort to force the team to coordinate in different ways (See Appendix O for examples of the perturbations used). Perturbations were based on the three procedural model stages. For example, in the feedback component of the procedural model, the PLO informs the AVO and DEMPC that a photograph has been taken. However, in the perturbed condition, the task is constrained such that the AVO must inform the team. Mission 5 was identical for all three conditions with the introduction of the first CAST roadblock. All missions in Session 2 for the three conditions were also identical. Missions were completed either at the end of a 40-minute interval or when mission goals had been completed. Immediately after each mission, participants were shown their performance scores. Participants could view their team score, their individual score, and the individual scores of their teammates. The performance scores were displayed on each participant s computer and shown in comparison to the mean scores achieved by all other teams (or roles) who had participated in the experiment up to that point. In addition, procedural and CT teams were given additional feedback and/or the opportunity to ask questions after each mission depending on which condition they were in. Teams in the procedural condition received feedback regarding their coordination and communication, namely their success in adhering to the procedural model pattern. Deviations from the model (which were noted by the experimenters during the mission) were discussed and the teams coordination score (calculated from the Coordination Logger) was announced. Teams in the CT condition were asked by the experimenter a) What do you think you did right as a team? and b) What do you think you can do to improve your performance in the next mission? Teams in this condition were also reminded that they were able to view other member s screens when needed. Teams in the perturbed condition were only allowed to ask general questions. The post mission discussions lasted five minutes after which participants were given a short break before their next mission. These feedback manipulations were also considered part of the training conditions. In summary, each training condition consisted of unique PowerPoint training slides, a unique 15- minute, scripted training activity following the skills check, and a unique feedback discussion for Cooke et al. 109 Team Coordination
124 five minutes. In addition, the perturbed condition experienced perturbations in the course of Missions 2, 3, and 4. Table 34 Number of Targets Per Mission Mission Targets After the first mission, knowledge measures were administered in the following order: taskwork ratings, taskwork consensus ratings, teamwork ratings, and teamwork consensus ratings. The participants were separated by partitions during the knowledge sessions. Once the knowledge measures were completed, partitions were removed and teams began the second 40-minute mission followed by the third, fourth, and fifth missions. The second session consisted of Mission 6 followed by the second knowledge session. During the second knowledge session, participants completed the same ratings tasks as in the first knowledge session. After the second knowledge session, the participants completed Missions 7, 8, and 9, followed by the demographics and debriefing questionnaires (see Appendix F for debriefing questions) Experiment 2: Results The following tests were conducted to ensure that the assumptions of the repeated measures statistical models were upheld. First, using studentized residuals, influential data points were identified using α =.02 and n = number of model parameters = 16 degrees of freedom. In cases where influential data points were identified, we substituted the mean of the treatment condition for that mission for the missing data point. For within subject effects, the homogeneity of variance assumption (i.e., sphericity) was tested using Mauchley s test of sphericity. If the assumption was violated (p <.05), then the F-test associated with Wilk s λ is reported. Levene tests was conducted in order to test for homogeneity of variance for between subject effects. If this assumption was violated (p <.05), a correction was made (α/2). Otherwise, α =.10 was used. Due to the relatively small sample size per condition, extensive across-team variation, and an objective of identifying any potentially interesting measures or effects at the expense of possible Type I errors, we considered α-levels of p<.10 statistically detectable (Cohen, 1994; Wickens, 1998). In addition, residual plots were Cooke et al. 110 Team Coordination
125 examined to look for violations of the normal error linear model. Namely: normality, homogeneity, independent error, and correct functional form (e.g., presence of curvilinear trends) Demographics Demographic data were analyzed to assess whether differences in team performance varied with age, video game experience, prior aviation training, or gender. If individuals reported playing video games frequently, their response was coded 1, otherwise their response was coded 0. If team members reported having received prior aviation training, their response was coded 1, otherwise their response was coded 0. Males were coded 1 ; females were coded 0. The data were aggregated for each team as follows: video game experience and aviation training were summed across conditions. Individual age, video game experience, aviation training, and gender were averaged for each team. Table 35 illustrates the total number of participants with video game experience and aviation training, as well as the percentage of participants they represent. Table 36 illustrates the total number of participants in each condition, number and percentage of males, and individual age across the three conditions. Table 35 Total Number of Participants with VGE and aviation experience and their percentages Sum Aviation Training Team Members % Aviation Training Team Members Sum Video Game Players % Video Game Players Procedural % % Perturbed % % Cross-Trained % % Table 36 Total Number of Participants in Each Condition, Number and Percentage of Males, and Individual Age across Conditions Number of Participants Number of Males % of Males Individual age averaged across conditions Procedural % Perturbed % Cross-Trained % Chi-Square tests were conducted in order to assess whether the classification of high and low performing teams at Mission 4 was dependent on demographic characteristics. Teams were split into high and low performance groups using a median split. We summarized the data into contingency tables to illustrate the distribution of demographic characteristics between high and Cooke et al. 111 Team Coordination
126 low teams. First, we categorized the high and low performance groups as same or mixed gender groups. Second, we categorized the performance groups as having one or more team members with prior aviation training or having no members with prior aviation training. Third, we categorized the performance groups as either having one or more team members that played video games frequently or having no members that played frequently. Lastly, we categorized the performance groups by age of team members. We used two different ways to categorize based on age. First, we took the median age for all participants (26.83). We then categorized the performance groups as having one or more members whose age was above the median or having no members whose age was above the median. Tables illustrates the distribution of high and low performing groups across the demographic categories. Table 37 Gender Composition for High and Low Performance Groups Team Gender Composition Performance Mixed Same Low 7 6 High 6 7 Total Table 38 Prior Aviation Training for High and Low Performance Groups Team Members Had Aviation Training Performance At Least One None Low 7 6 High 9 4 Total Table 39 Frequency of Video Game Play for High and Low Performance Groups Team Members Frequently Play Video Games Performance At Least Two None Low 7 2 High 8 0 Total 15 2 Table 40 Median Split Age Groups for High and Low Performance Groups Cooke et al. 112 Team Coordination
127 Team Members Above Median Age Performance At Least One None Low 6 7 High 7 6 Total The results of the Chi-Square tests indicate that the classification of high and low performing teams at Mission 4 was independent of team gender composition χ 2 (1, N = 26) =.52, p >.10) and of frequent video game experience χ 2 (1, N = 26) = 2.16, p >.10). The classification of team performance was also independent of prior aviation training χ 2 (1, N = 26) =.65, p >.10). Team performance was independent of age if the age classification was conducted using a median split χ 2 (1, N = 26) =.15, p >.10). Furthermore, performance was also independent of age if age classification was based on those teams containing members whose age was more than two standard deviations from the average, χ 2 (1, N = 26) = 1.04, p >.10). To further investigate the dependence of team performance on age, we categorized teams into two age ranges using the average team age. Table 41 illustrates the distribution of high and low performing teams across the age group ranges. The results of a Chi-square test indicate that performance did not depend on age χ 2 (1, N = 26) = 0, p >.10). Table 41 Distribution of High and Low Performance Teams across Age Groups Average Age for Team Performance Low 7 6 High 7 6 Total We also had five teams that did not return for their second session. Demographic data for these teams were also analyzed including age, gender, video game experience, and aviation training to determine if these factors influenced a teams returning for their second session. Table 42 shows the distribution of high and low performing teams across all conditions for the teams unable to return for session two. Table 43 illustrates the distribution of show versus no show across age group ranges. The results of the Chi-square test indicated that whether or not an individual returned for the second session was not associated with age χ 2 (1, N = 26) =.14, p >.10) or video game experience χ 2 (1, N = 26) =.12, p >.10). Of the teams not returning, all were mixed gender and no one had prior aviation training. Across all teams 79.57% did not have aviation experience and of those 20.27% did not return for their second session. Cooke et al. 113 Team Coordination
128 Table 42 Distribution of High and Low Performing Teams across Conditions for No Show Teams Condition Performance Cross-Trained Procedural Perturbed Low High Total Table 43 Average Age of Individuals for Show versus No Show Teams Average Age of Individuals Show No Show 10 5 Total Findings Demographic variables were not related to team performance Team Performance Data from teams that completed fewer than nine missions were excluded from the analyses (5, 12, 15, 26, 27, and 30). Team 13 s Mission 6 team performance score was affected by a computer malfunction during data collection. This score was replaced by the mean Mission 6 team performance score for all other teams in the treatment condition. The distribution of the team performance scores is illustrated in Figure 32. Mean team performance scores are presented in Table 44 and Figure 32. Cooke et al. 114 Team Coordination
129 Count Team Performance Figure 32. Distribution of Team Performance scores for all Missions. Cooke et al. 115 Team Coordination
130 Table 44 Means and Standard Deviations for Team Performance (Averaged across Teams within Conditions) Training Regime Cross- Trained Procedural Perturbed Mission Mean Team Performance N Standard Deviation Total Total Total Cooke et al. 116 Team Coordination
131 Figure 33. Team performance across all missions. Manipulation Effects The goal of this analysis was to examine the effects of the training protocols on Team Performance. A Training Regime (3) X Mission (9) Mixed ANOVA was calculated using the team performance data from Missions 1 through 9. The model for this analysis included Training Regime as a fixed between subjects factor. There were 234 observations. We report the analyses for a total of 26 teams: 10, 8, and 8 teams in the cross-training, procedural, and perturbed treatment groups, respectively. Team performance changed significantly across Missions 1 through 9 (F (8, 184) = 25.59, p <.001, η 2 =.53). There was no significant effect of Training Regime (F (2, 23) = 1.62, p =.22, η 2 =.12). There was no significant Mission X Training Regime interaction (F (16, 184) = 0.76, p =.73, η 2 =.06). Inspecting Figure 33 it appears that the perturbed teams obtained higher team performance than the other two groups in Missions 4, 5, 8, and 9. Contrasts were set up in order to compare the team performance of the perturbed group with that of the other two groups combined. The perturbed group did not score significantly higher than the other two groups at Mission 4 (p >.10), but they did obtain significantly higher team performance at Mission 5 (t (23) = 1.73, p <.05), Mission 8 (t (23) = 1.45, p <.10), and Mission 9 (t (23) = 2.48, p <.05). Figure 33 also indicates that both the perturbed and the CT teams obtained higher team performance than the procedural teams in Missions 6 and 7. Contrasts were set up in order to compare the team performance of the procedural group with the team performance of the other two groups combined. Compared to teams in the other two conditions, the procedural teams did not obtain significantly lower team performance in Mission 6 (t (23) = 1.19, p >.10), but did in Mission 7 (t (23) = 1.55, p <.10). We hypothesized that the retention interval would result in a significant decline in team performance. At Mission 5, all teams were presented with a SA roadblock that may have affected team performance; therefore, Mission 4 was selected for use as the baseline score. A Cooke et al. 117 Team Coordination
132 decrement score was generated for each team by subtracting a pre-manipulation baseline score (Mission 4) from the post-manipulation score (Mission 6). These decrement scores were indicative of degree of team performance decrement (negative score) and served as the dependent variable in the following tests. The decrement in team performance was significantly less than zero (t (25) = -2.96, p <.01). Next, we assessed whether the amount of performance decrement differed for the treatment groups. We used a One-Way ANOVA to assess the effects of Training Regime on team performance decrement from Mission 4 to Mission 6. The performance decrement was not significantly different for the treatment groups (F (2, 23) = 0.93, p =.41). We hypothesized that the high workload mission (Mission 9) would also result in a decline in team performance. A decrement score was generated for each team by subtracting a preworkload manipulation baseline score (Mission 8) from the post-manipulation score (Mission 9). These decrement scores were indicative of degree of team performance decrement (negative score) and served as the dependent variable in the following tests. The decrement in team performance was significantly less than zero (t (25) = -9.89, p <.001). Next, we assessed whether the amount of performance decrement differed for the treatment groups. We used a One-Way ANOVA to assess the effects of Training Regime on team performance decrement from Mission 8 to Mission 9. The performance decrement was not significantly different for the treatment groups (F (2, 23) = 0.38, p =.69). Findings Team performance scores changed across missions. The retention interval resulted in significant decrements in team performance for all treatment groups. Increased workload resulted in a significant decrement in team performance for all treatment groups. Combined treatment effects: Procedural teams worse at 7. Perturbed teams performed best at 5, 8, and 9. Missions 5 and 9 included the introduction of novel task constraints. These results support Hypothesis 2.2 and the use of perturbations to train adaptive teams Taskwork Knowledge Taskwork knowledge was measured in two separate sessions (after Mission 1 in Session 1, and after Mission 6 in Session 2) using the taskwork ratings application (see Appendix P). Taskwork Overall Accuracy Examination of Q-Q plots showed that the dependent measure was approximately normally distributed. The means and standard deviations as well as minimum and maximum scores for overall taskwork accuracy during knowledge Sessions 1 and 2 are presented in Table 45 for cross-trained, procedural, and perturbed teams. Cooke et al. 118 Team Coordination
133 Table 45 Overall Taskwork Accuracy for Knowledge Session 1 and Knowledge Session 2 Training Regime Knowledge Session Min Max Mean Standard Deviation Cross-Trained Procedural Perturbed Taskwork Positional Knowledge Examination of Q-Q plots showed that the dependent measure was approximately normally distributed. The means and standard deviations for taskwork positional accuracy during Knowledge Sessions 1 and 2 are presented in Table 46 for cross-trained, procedural, and perturbed teams. Table 46 Taskwork Positional Knowledge for Knowledge Session 1 and Knowledge Session 2 Training Regime Knowledge Session Min Max Mean Standard Deviation Cross-Trained Procedural Perturbed Taskwork Interpositional Knowledge Examination of Q-Q plots showed that the dependent measure was approximately normally distributed. The means and standard deviations for taskwork interpositional accuracy during Knowledge Sessions 1 and 2 are presented in Table 47 for cross-trained, procedural, and perturbed teams. Table 47 Taskwork Interpositional Knowledge for Knowledge Session 1 and Knowledge Session 2 Cooke et al. 119 Team Coordination
134 Training Regime Knowledge Session Min Max Mean Standard Deviation Cross-Trained Procedural Perturbed Taskwork Intrateam Similarity Examination of Q-Q plots showed that the dependent measure was approximately normally distributed. The means and standard deviations for taskwork intrateam similarity during Knowledge Sessions 1 and 2 are presented in Table 48 for cross-trained, procedural, and perturbed teams. Table 48 Taskwork Intrateam Similarity for Knowledge Session 1 and Knowledge Session 2 Training Regime Knowledge Session Min Max Mean Standard Deviation Cross-Trained Procedural Perturbed Holistic Taskwork Accuracy Examination of Q-Q plots showed that the dependent measure was approximately normally distributed. The means and standard deviations for taskwork holistic accuracy during Knowledge Sessions 1 and 2 are presented in Table 49 for cross-trained, procedural, and perturbed teams. Cooke et al. 120 Team Coordination
135 Table 49 Taskwork Holistic Accuracy for Knowledge Session 1 and Knowledge Session 2 Training Regime Knowledge Session Min Max Mean Standard Deviation Cross-Trained Procedural Perturbed Session 1 Manipulation Effects For all five taskwork knowledge measures, analyses were conducted to check for systematic condition differences by running a MANOVA on the taskwork Knowledge Session 1 data. The model for the analyses we treated Training Regime as the fixed between-subjects factor. All premanipulation descriptive statistics and analyses utilize all data from a total of 26 teams. A pre-manipulation MANOVA was performed and revealed no significant main effect of Training Regime (F (5, 19) = 1.268, p =.281, η 2 =.241) indicating that as expected team taskwork knowledge was similar in Session 1. Session 2 Manipulation Effects The goal of this analysis was to examine the effect of the main manipulation of Training Regime on all five taskwork measures. The dependent measures were difference scores for which the Session 1 taskwork scores were subtracted from Session 2 taskwork scores. There were 26 teams included in this analysis. The MANOVA however, revealed no significant results (F (5, 19) =.554, p =.840, η 2 =.122). Findings There were no statistically significant taskwork differences found between conditions at Session 1 or Session Teamwork Knowledge Teamwork knowledge was measured in two separate sessions (after Missions 1 and 6), using a teamwork knowledge questionnaire (see Appendix C). The method for scoring teamwork knowledge is outlined in the teamwork knowledge section for Experiment 1. Descriptive statistics on the five teamwork measures (overall accuracy, positional accuracy, interpositional accuracy, intrateam similarity, and holistic accuracy) follow. Teamwork Overall Accuracy Exploratory analysis of teamwork overall accuracy scores indicated that the data met assumptions of homogeneity of variance. Also, examination of Q-Q plots showed that the Cooke et al. 121 Team Coordination
136 dependent variable was approximately normally distributed. The means and standard deviations as well as the minimum and maximum values for teamwork overall accuracy during Knowledge Session 1 and Knowledge Session 2 are given in Table 50 for cross-trained, procedural, and perturbed teams. Table 50 Means and Standard Deviations for Teamwork Overall Accuracy for Knowledge Sessions 1 and 2 Training Regime Knowledge Session Min Max Mean Standard Deviation Cross-Trained Procedural Perturbed Teamwork Positional Knowledge Accuracy The Positional knowledge accuracy and Interpositional knowledge accuracy scores are based on percentage correct because the number of items on which a score was based varied by role. Exploratory analysis of teamwork positional accuracy scores revealed that the data met assumptions for homogeneity of variance. Examination of Q-Q plots showed that the dependent variable was normally distributed. The means and standard deviations are shown below. Table 51 Means and Standard Deviations for Teamwork Positional Accuracy for Knowledge Sessions 1 and 2 Training Regime Knowledge Session Min Max Mean Standard Deviation Cross-Trained Procedural Perturbed Cooke et al. 122 Team Coordination
137 Teamwork Interpositional Knowledge Accuracy Exploratory analysis of teamwork interpositional accuracy scores revealed that the data met assumptions for homogeneity of variance. Examination of Q-Q plots showed that the dependent variable was normally distributed. The means and standard deviations are shown below. Table 52 Means and Standard Deviations for Teamwork Interpositional Accuracy for Knowledge Sessions 1 and 2 Training Regime Knowledge Session Min Max Mean Standard Deviation Cross-Trained Procedural Perturbed Teamwork Intra-team Similarity Exploratory analysis of teamwork intra-team similarity scores revealed that the data met assumptions for homogeneity of variance. Examination of Q-Q plots showed that the dependent variable was normally distributed. The means and standard deviations are shown below. Table 53 Means and Standard Deviations for Teamwork Intrateam Similarity for Knowledge Sessions 1 and 2 Training Regime Knowledge Session Min Max Mean Standard Deviation Cross-Trained Procedural Perturbed Holistic Teamwork Accuracy Exploratory analyses indicated that the holistic teamwork accuracy data met assumptions of homogeneity of variance. Also, examination of Q-Q plots revealed that the dependent variable was approximately normally distributed. The means and standard deviations are shown below. Cooke et al. 123 Team Coordination
138 Table 54 Means and Standard Deviations for Teamwork Holistic Accuracy for Knowledge Sessions 1 and 2 Training Regime Knowledge Session Min Max Mean Standard Deviation Cross-Trained Procedural Perturbed Session 1 Manipulation Effects For all five teamwork knowledge measures, analyses were conducted to check for systematic condition differences by running a MANOVA on the Teamwork Knowledge Session 1 data. The model for the analyses treated Training Regime as the fixed between-subjects factor. All descriptive statistics and analyses utilize all data from a total of 26 teams. A MANOVA was performed and revealed no significant main effect of Training Regime (F (5, 19) =.655, p =.758, η 2 =.141) indicating as expected that there were no teamwork knowledge differences due to training condition in Session 1. Session 2 Manipulation Effects The goal of this analysis was to examine the effect of the main manipulation of Training Regime on all five teamwork measures. The dependent measures were difference scores for which the Session 1 teamwork scores were subtracted from Session 2 teamwork scores. There were 26 teams included in this analysis. The MANOVA however, revealed no significant results (F (5, 19) = 1.09, p =.392, η 2 =.214). Findings There were no statistically significant teamwork differences found between conditions at Session 1 or Session Team Process: Coordination Ratings Coordination Rating Reliability Ten percent of the missions were randomly selected to be independently coded by a second experimenter. For the missions selected, a second experimenter played back the video recording to log the coordination and assign coordination ratings for each target that the team photographed. After excluding all cases in which one rater provided a rating and the other had not, there were 200 coordination ratings provided by both sets of raters. Ratings were paired by Cooke et al. 124 Team Coordination
.")
139 team, mission, and target. Based on the results, we rejected the null hypothesis that the coordination ratings assigned by the different experimenters were independent (κ = 0.16, z = 4.23, p <.01). Coordination Rating Results Data from teams that completed fewer than nine missions were excluded from the analyses (5, 12, 15, 26, 27, and 30). Team 13 s Mission 1 score was identified as an influential data point, therefore it was replaced by the mean Mission 1 coordination rating for all other teams in their treatment condition. The distribution of the coordination ratings are illustrated in Figure 34. Mean team ratings are presented in Table 55 and Figure 35. Figure 34. Distribution of Team Coordination Rating for all Missions. Cooke et al. 125 Team Coordination
140 Table 55 Means and Standard Deviations for Coordination Ratings (Averaged across Teams within Conditions) Training Regime Cross- Trained Procedural Perturbed Mission Mean Team Process N Standard Deviation Total Total Total Cooke et al. 126 Team Coordination
141 Figure 35. Team Process across all Missions. Manipulation Effects The goal of this analysis was to examine the effects of the training protocols on coordination ratings. A Training Regime (3) X Mission (9) Mixed ANOVA was calculated using the coordination rating data from Missions 1 through 9. The model for this analysis included Training Regime as a fixed between subjects factor. There were 234 observations. Results indicated that the sphericity assumption did not hold (χ 2 (35) = 86.73, p <.01), therefore the multivariate (Wilks Lambda) results are reported for the within-subject effects. Team process changed significantly across Missions 1 through 9 (F (8, 16) = 3.80, p <.05, η 2 = 30.36). The effect of Training Regime was non-significant (F (2, 23) = 0.30, p =.75, η 2 =.03). The Mission X Training Regime interaction was also non-significant (F (16, 184) = 0.75, p =.72, η 2 =.27). We hypothesized that the retention interval would result in a significant decline in coordination rating. In Mission 5, all teams were presented with a SA roadblock that may have affected coordination rating; therefore, Mission 4 was selected for use as the baseline score. A decrement score was generated for each team by subtracting a pre-manipulation baseline score (Mission 4) from the post-manipulation score (Mission 6). These decrement scores were indicative of degree of team coordination decrement (negative score) and served as the dependent variable in the following tests. Overall, there was a significant decrement in coordination ratings (t (25) = , p <.10). Next, we assessed whether the amount of process decrement differed for the treatment groups. We used a one-way ANOVA to assess the effects of Training Regime on team coordination decrement from Mission 4 to Mission 6. The decrement was not significantly different for the treatment groups (F (2, 23) = 2.02, p =.16). We hypothesized that the high workload mission (Mission 9) would also result in a decline in coordination ratings. A decrement score was generated for each team by subtracting a preworkload baseline score (Mission 8) from the post-manipulation score (Mission 9). These Cooke et al. 127 Team Coordination
142 decrement scores were indicative of degree of coordination rating decrement (negative score) and served as the dependent variable in the following tests. The decrement in team coordination rating was significantly different from zero (t (25) = -4.27, p <.01). Next, we assessed whether the amount of process decrement differed for the treatment groups. We used a one-way ANOVA to assess the effects of training protocol on team coordination decrement from Mission 8 to Mission 9. The decrement was not significantly different for the treatment groups (F (2, 23) = 1.26, p =.30). The analyses of coordination ratings reported thus far were based on the average coordination rating assigned to a team within a given mission. Because we found no significant effects of treatment group on the coordination rating averages in this experiment, we elected to do an exploratory analysis of the data at the level of target waypoint. We noted the order in which the targets were visited and the coordination rating the teams received at each target. Our empirical question was whether the coordination ratings differed significantly along their route within each mission. In other words, we wanted to assess whether the coordination ratings changed (increased or decreased) significantly within each mission. More importantly, we wanted to assess whether the change in coordination ratings within a mission differed for the treatment groups. This analysis was complicated by many factors. First, not all teams visited the same number of target waypoints within each Mission. Some teams may have reached five waypoints and others nine. Second, the number of target waypoints visited by the teams differed for the different Missions. For example, the largest number of target waypoints visited by teams in Mission 1 was nine, whereas in Mission 2, teams visited as many as eleven. Third, not all teams visited the target waypoints in the same order. It was for these reasons that we made the following choices. First, we looked at each Mission separately. Second, we ignored the specific target identity and looked only at the order in which teams visited the waypoints. In other words, we calculated the test based on waypoint (first, second, third, etc.) instead of target name (H-AREA, F-AREA, etc.). For each Mission, we calculated a Training Regime (3) X Waypoint repeated measures ANOVA. The number of levels of Waypoint for Missions 1-9 were 9, 11, 11, 11, 12, 12, 11, 12, and 12, respectively. The model for this analysis included Training Regime as a fixed between subjects factor and Waypoint as a fixed within subjects factor. The number of observations for Missions 1-9 were 152, 218, 242, 265, 272, 255, 254, 302, and 230, respectively. Results of earlier tests on the coordination ratings indicated that the sphericity assumption did not hold. However, due to the limitations of the current data set (e.g., the fact that not all teams visited all of the same waypoints and if they did they did not necessarily do so in the same order), we elected to assume sphericity. The separate analyses for Mission 1-6 showed that the effects of Training Regime and Waypoint were non-significant (p >.10). Similarly, there were not significant Training Regime X Waypoint interactions in Missions 1-6 (p >.10). For Mission 7, there was not a significant main effect of Training Regime, but the main effect of Waypoint order (F (10, 198) = 2.03, p =.03) and the Training Regime X Waypoint interaction (F (20, 198) = 1.60, p =.05) were significant. As Figure 36 illustrates, the change in the team coordination ratings obtained by the treatment Cooke et al. 128 Team Coordination
143 groups at Mission 7 differed. It appears that the procedural condition tended to improve during the mission, unlike the other two treatment groups. Figure 36. Team coordination ratings across Mission 7. For Missions 8 and 9, the main effect of Waypoint was significant (F (11, 243) = 2.04, p =.03 and F (11, 173) = 2.59, p <.01, respectively). However, after inspecting the data it appeared that these main effects were due to one waypoint in the route and not an overall trend within the missions. The main effect of Training Regime and the Training Regime X Waypoint interaction for Missions 8 and 9 were non-significant (p >.10). Findings Average coordination ratings changed across missions. The retention interval resulted in significant decrements in the average Coordination rating for all treatment groups. Increased workload resulted in a significant decrement in the average coordination rating for all treatment groups. Looking at change in coordination rating within the Missions, the treatment groups differed only at Mission 7 with the procedural condition tending to show higher coordination ratings and better improvement within the mission compared to the other two conditions. These results, though weak, serve as a manipulation check that verifies that procedural teams were adhering to the procedural model which serves as the criterion for coordination ratings CAST Situation Awareness There were 129 CAST observations (i.e., one SA roadblock for each of the Missions 5-9; see Table 55 and Table 56 of means and standard deviations) after removing data from teams that Cooke et al. 129 Team Coordination
144 completed fewer than nine Missions. Figure 37 represents the distribution of hits and false alarms across teams in Missions 5-9. Hits False Alarms Std. Dev =.23 Std. Dev =.13 Mean =.38 Mean =.13 0 N = N = Figure 37. Histograms of rates of hits and false alarms across teams (Missions 5-9). Table 56 Means and Standard Deviations for CAST Hit Rate (Averaged across Teams) Training Regime Perturbed Procedural Cross-Trained Mission Mean Hit Rate Standard Deviation N Total Total Total Cooke et al. 130 Team Coordination
145 Table 57 Means and Standard Deviations of False Alarm Rate (Averaged across Teams) Training Regime Perturbed Procedural Cross-Trained Mission Mean False Alarm Rate Standard Deviation N Total Total Total CAST Score Reliability Approximately 10% of missions (12 Missions) were randomly selected and rated by a second experimenter. Inter-rater reliability was assessed in two ways. First, component agreement (agreement between ratings of perception, coordinated perception, and action) was calculated between ratings provided by the two experimenters using Cohen's Kappa, there were 165 paired observations (κ =.68, z = 8.72, p <.0001). Next, outcome agreement (agreement between ratings of whether or not the team overcame the SA roadblock) was calculated between the two experimenters, there were a total of 12 paired observations (κ =.83, z = 2.93, p =.003). Manipulation Effects Cooke et al. 131 Team Coordination
146 Outcome A chi-square was used to examine the relationship between treatment condition and the SA outcome measure. The test did not yield a significant difference between treatment conditions and whether SA roadblocks were overcome. Hit and False Alarm Rate An initial correlation analysis indicated a significant correlation between hit rate and false alarm rate (r (127) =.17, p =.06) suggesting a multivariate analysis. A Training Regime (3) X Mission (5) MANOVA was conducted using hit rate and false alarm rates as the dependent variables from SA roadblocks in Missions 5-9. Due to differences in the nature of roadblock at each mission, this model treated mission as a random effect. The MANOVA yielded a main effect of mission (F (4, 8.15) = 5.56, p =.02, η 2 =.73). All other results were not significant. Time-To-Overcome Onset of SA roadblock time and roadblock end time (time at which each team either overcame the roadblock or the time that the roadblock was ended because the team failed to overcome) were time-stamped by experimenters over Missions 5-9. End time minus onset time was calculated and used as a time-to-overcome score. In all, there were 125 time-to-overcome scores and six missing values. The six missing values were replaced with the mean value for that condition at that mission in order to preserve time-to-overcome data for the entire Mission for the teams with the missing values. To ensure that mean replacement did not interfere with the distribution of time-to-overcome values, tests were run with and without mean replacements in order to insure that results were not due to mean replacement. The time-to-overcome scores were used as the dependent variable in a Training Regime (3) X Mission (5) repeated measure ANOVA. There were 125 observations (means and standard deviations are presented in Table 58). The analysis yielded a significant main effect of Training Regime (F (2, 8) = 3.66, p =.073, η 2 =.48) and a significant main effect of Mission (F (4, 8.38) = , p <.0001, η 2 =.98; Figure 38). The Mission X Condition interaction effect was not significant. Cooke et al. 132 Team Coordination
147 Mean Overcome Time Mission Figure 38. Mean time-to-overcome scores (in seconds) across teams for Missions 5-9. Table 58 Means and Standard Deviations of Time-to-Overcome Scores (in Seconds) Training Regime Perturbed Procedural Cross- Trained Mission Mean Time-To- Overcome Rate Std. Deviation N Total Total Total A contrast between the procedural condition time-to-overcome and the other two conditions (cross-trained and perturbed) was conducted for time-to-overcome scores in order to investigate Cooke et al. 133 Team Coordination
148 the condition effect. Time-to-overcome scores for the procedural condition were significantly slower (M = ) than the cross-trained condition (M = ) and Perturbed condition (M = ; F (1, 8) = 7.30, p =.027). A correlation analysis was conducted in order to explore the relationship between time-toovercome scores and whether the team actually overcame the SA roadblock. The analysis yielded a significant negative correlation between time-to-overcome and whether the team overcame the SA roadblock (r (122) = -.18, p =.04). Findings There was adequate inter-rater agreement for both CAST metrics, component and outcome metrics. Hit rate was positively correlated with false alarm rate, indicating that hits came at the expense of making false alarms. There was a significant main effect of Mission for hit and false alarm rate. This is attributable to random sampling of roadblocks; e.g., roadblocks differed in terms of difficulty across missions, but not in a controlled manner. There was a significant main effect of Mission on time-to-overcome. As with hit and false alarm rate the Mission effect was attributed to random differences in roadblock difficulty. There was a significant main effect of Training Regime on time-to-overcome. A contrast revealed that procedural teams were slower to overcome roadblocks than cross-trained and perturbed teams. This results supports Hypothesis 2.3 concerning the poor performance of procedural teams in the face of change. There was a significant negative correlation between time-to-overcome roadblocks and number of roadblocks overcome. Teams that took longer to overcome roadblocks also overcame fewer roadblocks Intrinsic Geometry Coordination Score For the present analyses, Mission-level coordination scores were computed by taking the mean across targets in a mission. Figure 39 shows the distribution of these scores. This distribution is log-normal therefore the natural logarithm of the original scores was taken in order to approximate a normally distributed random variable (Figure 40). Means and standard deviations of the transformed variable by treatment condition and mission are given in Table 58. Cooke et al. 134 Team Coordination
149 Std. Dev = 2.42 Mean = 2.6 N = AVG Figure 39. Distribution of coordination scores for all teams, all conditions, and all Missions Std. Dev =.53 Mean =.76 0 N = AVG_SQR Figure 40. Logarithmic distribution of coordination scores for all teams, all conditions and all Missions. Cooke et al. 135 Team Coordination
150 Table 59 Means and Standard Deviations of Coordination Scores (Averaged across Teams for all Conditions) Training Regime Procedural Perturbed Cross-Trained Mean Coordination Score Standard Deviation Mission N Total Total Total Cooke et al. 136 Team Coordination
151 Manipulation Effects A Training Regime (3) X Mission (9) Repeated Measures MANOVA was used to explore the relationship between Training Regime effect and coordination scores. The spherecity assumption could not be upheld (χ 2 (35) = p <.0001). Therefore, multivariate repeated measures results are reported. The analysis yielded a significant main effect of Mission (F (8, 16) = 2.85, p =.035, η 2 =.59). All other results were not significant. Mean Coordination Scores Mission Figure 41. Mean coordination scores over missions one through nine (across teams and conditions). Findings There was a significant main effect of mission. However there was not a clear pattern of acquisition Dynamics Team coordination dynamics were measured using the concatenated trial series of coordination scores across the Session 1 and Session 2 missions. Before conducting the Hurst analyses, a surrogate analysis was conducted. The goal of a surrogate analysis is to compare the dynamics embodied in the original dataset with a randomly shuffled surrogate of itself. The purpose of comparing the correlational structure of the surrogate trial series to the correlational structure of the observed trial series is to detect the presence of spurious long-range correlation in short trial series. For the Session 1 (manipulation) trial series, across all teams both the mean observed short-region (before the inflection point) H (M =.83) and the mean randomly-reshuffled surrogate H (M =.71) were significantly larger than the random walk value of H =.5 (t (25) = 17.33, p <.0001 and t (25) = 12.69, p <.0001, respectively). However a paired samples t-test indicated that the mean observed H was significantly larger than the mean surrogate H (t (25) = 5.15, p <.0001). For the Session 2 trial series, both the mean observed H (M =.72) and the mean surrogate H (M =.76) differed significantly from the null value of H =.5 (t (25) = 10.50, p <.0001 and t (25) = 15.65, p <.0001, respectively). However a paired-sample t-test revealed that the observed and surrogate H values for Session 2 did not differ statistically. There was Cooke et al. 137 Team Coordination
152 strong evidence of long-range correlation across trial series in both Session 1 and Session 2. However, for Session 2 the patterns of long-range correlation could not be isolated from randomly generated patterns. Two measures of team coordination dynamics were calculated across the coordination scores trial series. The two measures were Hurst exponent (H; related to coordination flexibility) and the largest Lyapunov exponent (related to coordination stability). There were four coordination dynamics measures for each team: Session 1 H values and λ 1 values, and Session 2 H and λ 1. Additionally, separate short-region and long-region components of H were calculated as before, where long is separated from short by identifying an inflection in the dynamics were a shift in correlational structure is most likely to occur. The purpose of calculating a separate long region is in order to examine whether or not the coordination process is bounded (H <.5) at longer time scales, or remains flexible (H >.5), where coordination boundaries are analogous to the limits on coordination flexibility. The observed distributions of the coordination dynamics measures are given in Figure 42. Means and standard deviations for coordination dynamics measures for each condition over Sessions 1 and 2 are presented in Table 60. Flexibility (Short) Flexibility (Long) Stability S 1 M N S M 0 N SHORTREG LONGREG LYAP S M N S M N SHORTREG LONGREG Figure 42. Histograms of Coordination Dynamics Measures over Sessions 1 and 2: Columns are Measures and Rows are Sessions. LYAP Cooke et al. 138 Team Coordination
153 Table 60 Means and Standard Deviations for Coordination Flexibility and Stability (Averaged across Teams within Conditions) Training Regime Session Statistic CF- Short CF- Long CS M N SD M N SD M Total N SD M N SD M N SD M Total N SD M N SD M N SD M Total N SD Cross- Trained Procedural Perturbed Predictions for coordination dynamics include that we can increase coordination flexibility in any team, similar to mixed teams from Experiment 1, by tuning coordination experience to a large enough value, for instance by throwing a lot of TSA roadblocks at a team during training. Session 1: Manipulation Effects The goal of this analysis was to examine the effects of the training protocols on the team coordination dynamics measures, H and λ 1, during Session 1. H-short and H-long were Cooke et al. 139 Team Coordination
154 significantly correlated (r (24) =.47, p <.02), therefore a one-way between subjects MANOVA on the Session 1 H-short and H-long scores was conducted for the 3-level Training Regime factor, cross-trained, procedural, and perturbed. There were 26 bivariate observations (52 total). There was a significant main effect of Training Regime (F (4, 44) = 2.58, p =.05, η 2 =.19). The source of the difference appears to lie partly in the presence of more correlational structure in the short region estimates for the perturbed and cross-trained conditions compared to the procedural condition (p <.07 and p <.10, respectively), indicating less structured patterns of coordination for the procedural condition. Looking at the long region estimates, perturbed (M =.34) had smaller estimates than cross-trained (M =.57; p =.08). The perturbed estimates were on average <.5 and the cross-trained estimates were on average >.5, suggesting the presence of a coordination boundary for the perturbed condition, but not for the cross-trained condition. These results are illustrated in Figure 43. The perturbed teams exhibited less coordination flexibility than the cross-trained teams in Session 1. Both the cross-trained and perturbed teams exhibited higher long-range correlation in coordination than the procedural teams. Importantly, none of the Session 1 coordination dynamics resembled random walks. However the perturbed and cross-trained conditions appear to be the most highly structured, as noted by the vertical distance of the lines from the dashed random walk line in Figure D2.2. This result seems counterintuitive given the procedural orientation of the procedural teams. However, with respect to what the procedure entails-starting and ending the I, N, F sequence one target at a time-the results begin to make sense. In terms of the procedural model of coordination, the Procedural teams are engaged in a more finite-state type of process: I 1 N 1 F 1 I 2 N 2 F 2, etc., where the subscripts refer to different targets. Alternatively, the cross-trained and perturbed teams are engaged in a more self-organizing process: e.g., patterns like I 1 I 2 N 1 F 1 N 2 F 2 are more likely in the cross-trained and perturbed conditions. Emergent patterns such as this latter one can have a profound impact temporal correlations across IG. Cooke et al. 140 Team Coordination

155 Figure 43. Session 1 coordination flexibility; 95% confidence intervals are plotted at each level of binning; Dashed lines represent the random walk slope. Turning to coordination stability, λ 1, a one-way between subjects ANOVA was run on the Session λ 1 scores in order to investigate the effects of the three different treatments. There were 26 observations. The main effect of training regime was not significant (F (2, 23) = 1.22, p >.31, η 2 =.10). Variability in λ 1 was not attributable to the different training conditions in Session 1. In summary, perturbed and cross-trained conditions both exhibited a higher degree of dynamic structure in coordination than procedural. Examining the long region estimates, the perturbed teams exhibited a coordination boundary, exhibiting lower coordination flexibility than the crosstrained teams in Session 1. Figure 44 illustrates the effect of training regime on team coordination dynamics using phase-space reconstruction (Abarbanel, 1996). Figure 44. Phase-space reconstructions of cross-trained, procedural, and perturbed team coordination dynamics during training. Cooke et al. 141 Team Coordination
156 Session 1: Relationships to Outcome Measures In order to investigate the relationship between coordination dynamics and outcome measures of team performance and team SA, tests for correlation were conducted between the coordination dynamics variables, mean Session 1 team performance, and whether or not the Mission 5 team SA roadblock was overcome. The zero-order correlations between H-short, H-long, λ 1, and team performance did not reveal any significant relationships between coordination dynamics and team performance (H-variables and λ 1 were also not correlated). However the regression of H-short and H-long on team performance did reveal a significant partial correlation between H-short and team performance (r (23) =.34, p <.10), suggesting that more dynamic structure (i.e., long-range dependencies in coordination: not the procedural condition) was related to higher Session 1 performance. The zero-order correlations between H-short, H-long, λ 1, and Mission 5 roadblock overcome revealed a significant relationship between λ 1 and whether or not the roadblock was overcome (r (24) = -.40, p <.05). This result suggests that more stable coordination dynamics (e.g., the average Cross-Trained team; Table 59) are associated with the team being able to overcome the Mission 5 roadblock. This result replicates the finding from Experiment 1 that ability to overcome roadblock perturbation is related to coordination stability as measured through λ 1. Session 2: Manipulation Effects The purpose of this analysis was to investigate the retention effects of the different Session 1 treatments on the coordination dynamics measures, H and λ 1. The H-short and H-long measures were not significantly correlated (r (24) =.29, p =.15), therefore separate one-way between subjects ANOVAs were run over the H-short and H-long estimates for the 3-level treatment factor. There was no main effect of Training Regime on either the H-short (F (2, 23) =.19, p =.83, η 2 =.02) or H-long (F (2, 23) =.59, p =.56, η 2 =.05) measures. A one-way between subjects ANOVA run over the λ 1 stability measure for the Treatment factor was also nonsignificant (F (2, 23) =.20, p =.82, η 2 =.02). Variability in Session 2 coordination dynamics is not attributable to the Session 1 training conditions. Session 2 Outcome Relationships In order to investigate the relationship between coordination dynamics and outcome measures of team performance and TSA, tests for correlation were conducted between the coordination dynamics variables, mean Session 2 team performance, high workload Mission 9 performance, and the number of Session 2 TSA roadblocks overcome. The zero-order correlations between H-short, H-long, λ 1, and team performance did not reveal any significant relationships between coordination dynamics and mean team performance, or high workload Mission 9 team performance. The zero-order correlations between H-short, H-long, λ 1, and number of Session 2 roadblocks overcome revealed a significant relationship between λ 1 coordination stability and overcoming roadblocks (r (24) = -.38, p <.06), consistent with the Session 1 result. These results suggest that more stable coordination dynamics are associated with the team being able to overcome Cooke et al. 142 Team Coordination
157 TSA roadblocks. λ 1 was also significantly correlated with H-short (r (24) = -.37, p =.06), suggesting that for this experimental session long-range correlation in coordination was related to coordination stability. Summarizing the correlational results, more structured, less random coordination are associated with a more stable coordination dynamic. A more stable coordination dynamic is in turn associated with higher aptitude to overcome TSA roadblocks. This latter result is consistent with the AF6 Session 2 and AF7 Session 1 findings. Decrements and Changes in Coordination Dynamics between Sessions 1 and 2 Difference scores for each coordination dynamics variable were computed by subtracting the Session 1 score from the Session 2 score. A one-sample t-test revealed that H-short scores decreased from Session 1 to Session 2 (t (25) = -3.77, p <.01), indicating less dynamical structure across all teams in Session 2 than in Session 1 (see surrogate analysis above). All other difference scores were non-significant. This result suggests that team coordination was generally less patterned across all teams in Session 2 than in Session 1. This result is likely due to the scripted training manipulations that took place in Session 1 (i.e., perturbed and procedural) and not in Session 2. The relationship between Session 1 and Session 2 coordination dynamics differences, and Session 1 and Session 2 team performance differences was also assessed. Zero-order correlations between H-short, H-long, λ 1, and team performance difference scores failed to reveal any significant relationships. The relationship between coordination dynamics and performance decrements moderated by Training Regime were also investigated. There was a significant relationship between partialled λ 1 (Session 2 variance partialled from Session 1) and partialled team performance (Mission 5 variance partialled from Mission 6 variance) controlling for Training Regime (F (1, 20) = 3.57, p =.07, η 2 =.15). This relationship was moderated by the Training Regime (F (1, 20) = 2.68, p =.09, η 2 =.21). The pattern of correlations between partialled λ 1 and partialled performance reveal that for the cross-trained (r (6) = -.31, ns) and perturbed (r (6) = -.57, ns) treatments higher coordination stability was associated with larger performance decrements. For the procedural condition (r (8) =.18, ns) higher coordination stability was associated with a smaller performance decrement. Team coordination dynamics were less structured in Session 2 than in Session 1. Presumably this is an artifact of the different training methodologies that were used in Session 1. Both the perturbed and cross-trained λ 1 scores were negatively correlated with performance decrement, however the procedural λ 1 scores were positively correlated. It appears that the procedural training treatment leads to the biggest decrement as well as the highest aptitude to stabilize coordination given perturbation, or TSA roadblocks. During training the procedural condition exhibited the least amount of overall correlational structure. In terms of coordination boundaries, procedural training was intermediate between the highly bounded regiment of the perturbed group and the unbounded regiment of the cross-trained group. Essentially there was a highly structured bounded coordination training (perturbed), a highly structured but unbounded training (cross-trained), and a less structured, somewhat bounded training in between (procedural). Cooke et al. 143 Team Coordination
158 Findings During Session 1 training, perturbed and cross-trained both exhibited a higher degree of dynamic structure in coordination than procedural. The perturbed teams were less flexible than the cross-trained teams partially supporting Hypothesis 2.1. The correlation tests for relationships between coordination dynamics and team outcomes in Session 1 were consistent with the same tests for Experiment Session 2, in which significant differences in coordination dynamics attributable to experimental treatments were found. Namely, flexibility is related to performance and stability is related to overcoming team SA roadblocks. (More structured, less random coordination dynamics are associated with more stable coordination.) No treatment effects in Session 2 coordination dynamics. Over all conditions, coordination structure decreased from Session 1 to Session 2. There was a trade-off in training: in Session 2 perturbed and cross-trained sacrifice stability, and overcoming team SA roadblocks, for performance; the procedural training sacrifices performance decrement for stability Experiment 2: Performance Predictors Mission-level Team Performance Predictors In order to identify mission-level variables that are predictive of team performance across missions, variables that were measured at each mission (Table 60) were entered into a stepwise regression with mission performance as the dependent variable. The mission-level variables are listed under Metrics in Table 60. CAST team SA data were not included in the Session 1 models because only the last mission (Mission 5) contained CAST data. The selection criteria for the stepwise regression included a p-value of.10 or less to enter the model at each step, and a p- value of.10 or less to stay in the model at each step. Separate regression models were fit by experimental session and condition. Significant predictors for each model are denoted in Table 61 by their standardized regression coefficients. Table 61 Standardized Regression Coefficients of Significant Mission-level Team Performance Predictors by Experiment 2 Session and Condition Session 1 Cross- Metric Trained Procedural Perturbed Procedure Rating.470(40)***.362(50)***.505(40)*** Intrinsic Geometry (40)** Session 2 Cross- Trained Procedural Perturbed Metric Procedure Rating.696(31)***.291(39)*.393(32)** Cooke et al. 144 Team Coordination
159 Coordination Score -.366(31)** - - Team SA Overcome Hits False Alarms -.282(39)*.302(32)* In Experiment 2, the coordination rating consistently predicted mission-level team performance. Interestingly intrinsic geometry had a positive relationship with team performance for the Session 1 perturbed teams, but a negative relationship with team performance for the Session 2 cross-trained teams. A positive relationship suggests that information frontloading is good for performance, while a negative relationship indicates that information frontloading is bad for performance. Session-level Team Performance Predictors Session-level variables were examined similarly in order to identify the best predictors of session-level team performance. Session-level variables are identified under Metrics in Table 61. A stepwise regression with p-value not larger than.10 as the include/exclude criteria was run with Mission 4 team performance as the dependent variable for Session 1 (i.e., the performance acquisition asymptote) and mean team performance over Missions 6-9 as the dependent variable for Session 2. Separate regression models were fit by experimental condition. Significant predictors for each model are denoted in Table 62 by their standardized regression coefficients. Table 62 Standardized Regression Coefficients of Significant Session-level Team Performance Predictors by Experiment 2 Session and Condition Metric Knowledge Session 1 Cross- Trained Procedural Perturbed Taskwork.705(8)* - - Teamwork Hurst Short (8)** Long Lyapunov Session 2 Cross- Metric Trained Procedural Perturbed Knowledge Cooke et al. 145 Team Coordination
160 Taskwork Teamwork Hurst Short.718(8)** - - Long Lyapunov The session-level regression models revealed that the best predictor of cross-trained session-level team performance was interestingly a knowledge metric in Session 1, but a dynamics metric in Session 2. In addition, a dynamics measure was the best predictor of session-level team performance given Perturbation training, which may not be surprising given the coordinationcentered nature of this training protocol. It would be possible to speculate on the meaning of these results, however in the present context, neither of these findings can be considered reliable or valid. Findings Subjective coordination ratings were consistently the best predictor of mission-level team performance. Session-level findings suggested some interesting relationships, however the results were sporadic and therefore interpretation of these results is speculative Experiment 2: Discussion In Experiment 2 we tested three types of training. Procedural training was very rigid, prescriptive training on how to coordinate at each target waypoint. Cross-training provided team members with information about what the other team member was doing and perturbed training provided the team experiences with alternative ways of coordinating. Our hypotheses focused on training effects on team adaptability in a dynamic environment. Given that Session 1 is largely training, adaptive performance in a dynamic environment can be measured in this study in Session 2 team performance and response to SA roadblocks. It can also be assessed in some of the dynamics measures. The coordination rating score may also be considered a measure of adaptability, though it is based on degree to which a team adhered to the procedural model of coordination, which may not necessarily be adaptive. Teamwork and taskwork knowledge scores are not directly relevant to adaptability, but of interest in this study because our cross-training manipulation would be expected to have some impact on these measures. However, training effects were not seen in these measures. We first hypothesized that cross-training would be effective at producing adaptive teams (high performing teams in a dynamic environment) to the extent that a shared mental models explanation of Experiment 1 mixed team superiority prevailed (Hypothesis 2.1). The fact that cross-trained teams did not have superior team knowledge scores suggests that the cross-training may not have had the impact on shared mental models that was intended. The results pertaining to this condition must be interpreted in that light. Cross-trained teams demonstrated no advantage over other training regimes in terms of team performance, coordination rating, or team Cooke et al. 146 Team Coordination
161 SA. The dynamics measures did indicate that the cross-trained teams in Session 1 were more flexible than perturbed teams supporting Hypothesis 2.1. It should be kept in mind that these Session 1 results could be accounted for by the fact that perturbed teams were intentionally limited in terms of the coordination possibilities. Second we hypothesized that the perturbed training would result in adaptive teams to the extent that a perturbation explanation for Experiment 1 findings is warranted. There was some support for Hypothesis 2.2. Perturbed training resulted in higher levels of team performance (in comparison to the other two conditions) for three of the nine missions, two of them in Session 2. There was little support for this hypothesis in any of the other measures, though the dynamics measures did reveal different coordination dynamics for each of the conditions. Finally it was hypothesized that procedural training would result in reliable performance in Session 1, but poor performance in Session 2 when the environment becomes more dynamic. Supporting this hypothesis, team performance for procedural teams was lower than for other teams in Mission 7. Interestingly, it was Mission 7 that also showed some coordination rating advantage for procedural teams. Procedural teams were also slower to overcome SA roadblocks than the other two conditions. Most of these results support Hypotheses 2.3. Dynamics indicated that procedural teams demonstrated less dynamic coordination structure in Session 1 than the other teams. In sum, the perturbed training seems to produce the highest performing teams and the procedural the lowest, but not very different from cross-trained teams. Thus for this primary outcome variable Hypothesis 2.2 is supported. For other measures there are few differences and when there are, the results are mixed. The dynamics analysis is interesting in that it corroborates some previous findings concerning the relationship between dynamic coordination structure (flexibility and stability) and team performance. However, the effects of training on coordination dynamics are weak and difficult to interpret. It is fairly clear that the three manipulations intended to affect team coordination, did make a difference in the coordination patterns. But it may be premature to fully interpret those differences. Experiment 2 was limited by a high participant drop-out rate constraining the number of Session 2 data points. In addition, the cross training manipulation may not have had the impact of shared mental models that was intended, limiting our ability to test this explanation. Finally, our coordination measures are relatively new and should be considered exploratory. The most compelling and clear results are for team performance. The coordination training manipulation did have some effect on team performance for a few missions. Considering the relative gains or losses in efficiency for three-person coordination compared to 100-person coordination, the results have interesting implications for larger teams and organizations. Thus, although results from Experiment 2 are limited, they support the perturbation explanation of mixed team superiority in Experiment 1 and have implications for even greater advantages as coordination complexity increases with more team members. Cooke et al. 147 Team Coordination
162 4.5 Conclusions This project encompasses two team experiments and two modeling efforts, all with the goal of understanding how coordination skill is acquired and retained over time by teams. The results of this project have theoretical, methodological, and applied implications. We discuss each contribution in turn in the following sections Theoretical Contributions The empirical and modeling results have implications for collective versus holistic theories of team cognition. Shared mental model theories, or collective views, of team cognition have tended to emphasize the knowledge held by individual team members about the task and team and how this knowledge is distributed across the team. Holistic views of team cognition, of which ours is an exemplar, however see team cognition as more than an issue of level of analysis (i.e., individual versus team), but instead as a qualitatively different construct with unique teamlevel structures and processes. In particular, our research has demonstrated that much of the performance variance in command-and-control teams can be attributed to differences in strictly team-level cognitive processes such as coordination and communication. These team-level processes are qualitatively different from individual processes and in fact are not observable at the individual level. As a whole, the research documented in this report focused primarily on team coordination, a team-level process, though other process and knowledge measures were taken. For both studies, one of the strongest predictors of team performance was the coordination rating, a subjective experimenter rating of team coordination at each target waypoint in the UAV-STE. The modeling effort also indicated that coordination differed over time/missions and across teams supporting the idea that it is a source of variance in team performance. The modeling effort also indicated that flexible team coordination is may be associated with brief performance decrements, although these teams also developed more stable team coordination dynamics which were associated with the team s ability to overcome situation awareness roadblocks. The results described thus far are correlational in nature. This project, however, does provide some additional causal evidence supporting the holistic view of team cognition. Manipulations of Retention Interval and Team Composition produced performance decrements and process improvements that could be explained by either a collective or holistic perspective. However in the second experiment, the training condition that attempted to implement training based on the holistic perspective (i.e., perturbed) resulted in teams who performed at higher levels than the other two training conditions including the cross-trained condition that attempted to promote the development of shared mental models. Although we cannot rule out the collective or shared mental models perspective on the basis of this experiment (due to possible failure of the training to affect shared mental models) the results do provide additional support for the holisticallyinspired training and therefore the practical significance of the holistic perspective of team cognition. Cooke et al. 148 Team Coordination
163 4.5.2 Methodological Contributions There are several methodological contributions inherent in this work. In the context of the experiments, the CAST measure of SA was further developed by examining the time to overcome roadblocks and additional data were collected to speak to the validity of this measure. The logging of coordination events also represents a contribution by which events were first defined in the context of the task and associated with specific team behaviors that could be time stamped. The majority of the methodological contributions center on the measurement and modeling of team coordination. The ability to quantify coordination through the procedural model and coordination score is a significant contribution to the understanding and assessment of team coordination. Our metric of team coordination was based on the temporal relationships among task elements (i.e., Information, Negotiation, and Feedback). The metric was conceptually related to kinematic measures of bodily coordination except the team coordination metric was based on communicative, rather than physical, sampling points. The team coordination measure was described as intrinsic geometry (IG) because it was intrinsically scaled (i.e., it is dimensionless) and because it was based on a geometrical relation among time intervals between task elements (i.e., hypotenuse of a right triangle; the slope F I / F N). The coordination score had some interesting distributional properties. Histograms and transformations indicated that the coordination score sampling approximates a log-normally distributed random variable. Unlike in a normally distributed random variable in a log-normal distribution variability is not random about a mean, median, and mode, with larger deviations on either side becoming equally less probable. Specifically, the large positive skew of coordination score sampling indicates that smaller values are much more likely than larger values. By way of analogy, we imagine that sampling coordination scores is less like a normally distributed organismic property such as height and more like a non-randomly distributed behavioral property such as reaction time variance. Consequently, we do not believe that coordination scores are independent of one another (i.e., unlike height they do not constitute an independent random sample). We conclude that this distributional property is due to the interacting nature of coordination score component variables (I, N, F). That is, the coordination score of the team coordination task elements represents a multiplicative function of task elements rather than an additive factors combination of task elements, as might be found in a metric of team coordination based on independent procedural stages (cf. Klein, 2001). Analysis of mission-level coordination aggregate scores (M, SD) failed to yield any statistically significant differences due to experimental manipulations (e.g., training protocol in Experiment 2). However, dynamical systems modeling of the target-level coordination score trial series did yield statistically significant differences due to experimental manipulations (e.g., post-retention familiarity in Experiment 1). Taken together, this pattern of results leads us to the conclusion that the lack of independence between coordination scores translates into a significant loss of information about team coordination when coordination scores are treated independently; i.e., when they are summed, averaged, or otherwise aggregated. On the other hand, this lack of Cooke et al. 149 Team Coordination
164 independence provides critical information for modeling coordination variability, which was accomplished here in accordance with dynamical systems theory. In terms of quantifying coordination we conclude that there is significant information loss when coordination events (e.g., coordination scores) are treated as independently, identically, and randomly distributed (e.g., Ishida & Ohta, 2001), rather than treated as events in an evolving dynamic process. The dynamical systems modeling contributed to this research effort by not only yielding significant coordination differences based on the experimental manipulations. In addition its qualitative representations of the dynamics allowed us to visualize the nature of these differences. Thus, the modeling provided increased depth to the interpretation of experimental results. For instance, in Experiment 1 it was revealed that mixed teams showed postmanipulation improvement in terms of process based on the experimenter coordination ratings. However, other than conforming to the behavior prescribed by the procedural model there was not much more that could be concluded based on this result alone. However, the dynamical systems models and associated parameters indicated that the mixed teams displayed more flexible, and at the same time stable with respect to roadblock perturbation, coordination dynamics relative to other teams. That is, these teams were more apt to adapt to changing circumstances. This analysis provided a better understanding of the mixed team coordination and suggested an explanation of mixed superiority entailing the role of perturbations in creating adaptive coordination dynamics. Most impressive about the dynamical systems modeling to methodology was the role that the models played in the development of explanations of Experiment 1 results and predictions for Experiment 2. The perturbed training, which is for several missions, including the first roadblock mission and the high workload mission, was superior relative to the other training conditions, was inspired by the dynamical systems models. Specifically, the models predicted that teams with perturbed training would perform best in non-routine missions, where coordination flexibility is at a premium. Additional work is needed to understand how to interpret some of the dynamical patterns observed, especially given the training dynamics of Experiment 2. We also believe that these models can be used to make more specific predictions about perturbation training including when the perturbations should begin in the course of training and the ratio of perturbed to routine trials Applied Contributions Part of the negative critique of the old Soviet forces was that they were overly managed and directed from the top down. The theory was that while Soviet teams might perform well in a highly scripted battle for which they had rehearsed many times, they would falter if they were presented with a foe that rapidly changed tactics to those on which the Soviet forces had not practiced. Conversely, the notion was that western forces would probably ultimately prevail because of their greater flexibility and allowance for bottom up initiative. While the theory was thankfully never proved out in a Soviet versus the West war, it was at least partially proven in Operation Desert Storm when western forces easily overcame Iraqi forces trained with Soviet tactics and techniques. Cooke et al. 150 Team Coordination
165 The results from this project have implications for training team coordination and in particular for training adaptive teams. Maintenance of combat readiness is the main impetus for military forays into studies of retention. The U.S. Armed Forces is constantly faced with the problem of balancing combat readiness and skill maintenance with availability of funds and resources. Prophet (1976) reported that the U.S. Air Force was especially concerned about rising fuel costs due to the oil embargo in the early 1970 s. Because of that event, the Air Force was compelled to cut down on its pilot training. Coupled with the fact that Air Force pilots do not spend their entire careers actually flying, and are frequently assigned to other tours of duty yet must maintain their skills, also became an impetus to study the retention of skills. The concern for skills retention is still relevant today in the face of rising fuel costs and the need to maintain combat readiness. Studies in the retention of individual skills in the military are numerous (Hagman & Rose, 1983; Sabol & Wisher, 2001; Wisher et al., 1999) and often cover major themes such as initial learning, events during the retention interval, and conditions of retrieval in skills ranging from marksmanship and the retention of motor skills (McDonald, 1967) to the retention of procedures in flight (Prophet, 1976). Foremost, these results are the first to address retention of team-level skills, namely those of coordination and communication. The fact that there is a performance decrement after a lengthy delay is not surprising, however it is important that this decrement is short-lived, lasting only one UAV mission. Even more interesting theoretically, and critical from an applied perspective, is the finding that long retention intervals and changes in team composition may actually produce a more adaptive team, as in Experiment 1. In Experiment 2 training conditions most closely mimicking what we considered to be the dynamics associated with team mixing resulted in superior team performance than other training conditions. Therefore, the data are the first to speak to team retention and suggest an interesting performance-process tradeoff. These results have important implications for military training of command-and-control teams. Real world teams often face changing conditions under which they must perform their tasks and jobs. Nowhere is this truer than for military combat teams. In order to be successful they must be competent in their individual tasks, they must know what each team member requires from the other team members, and they must be flexible enough in their procedures to quickly adapt coordination to rapidly changing conditions. Flexible teams are thought to result from a number of different factors. Some examples are: 1) frequent training under a variety of different conditions 2) allowance for team initiative and decision making that is only generally guided from authority from above 3) change of team membership from time to time. This can mean both an infusion of new team members occasionally, and it might mean that team members change roles on occasion. This can prevent the team from becoming overly rigid, with few means to adapt to change. The results described in this report lend empirical support to the first and last factors team member turnover can lead to more flexible and adaptive teams. This result seems at first to be counter-intuitive. After all, don t we expect better performance from sports teams that have been together longer than other teams who have less time as a unit? These results suggest that if Cooke et al. 151 Team Coordination
166 adaptability is a key goal, it is not the length of time together as a team that is critical, but rather the variety of team experiences while together. Rigid training that becomes ingrained may lead to precision performance in static environments but is bound to become brittle in more dynamic environments. Adaptive teams require experience of a broad repertoire of responses to the environment and team member interactions. Based on our findings in these studies we have concluded that mixed command-and-control teams (teams that were re-structured after the retention intervals) appeared to perform better (performance, process) in the long run than did those teams that were kept intact after the retention break. The same types of process improvements after the break were seen with longer retention intervals and perturbed training seemed to be most beneficial to team performance. These results are based on a limited context in which three individuals interacted. We project that coordination demands that increase exponentially with additions in team members would show even greater benefits of these manipulations Summary In this three-year project we conducted two experiments and developed two models--all directed at understanding and assessing the acquisition and retention of team coordination. This work has contributed to this problem theoretically, methodologically, and through application. Theoretically, the work supports a holistic perspective of team cognition in which team interaction (e.g., coordination, communication) is central to team performance. Methodologically, this work has led to metrics of team coordination and models that provide explanatory and predictive power to facilitate research and development in this area. Finally, the results have interesting applications for training command-and-control teams. There appears to be a trade-off between training teams for repeated precision in an unchanging environment and training adaptive teams. Cooke et al. 152 Team Coordination
167 REFERENCES Abarbanel, H. D. I. (1996). Analysis of observed chaotic data. New York: Springer-Verlag Inc. Abraham, R. H. & Shaw, C. D. (1992). Dynamics: The geometry of behavior. Redwood City, CA: Addison-Wesley. Alligood, K. T., Sauer, T. D., and Yorke, J. A. (1996). Chaos: An introduction to dynamical systems. New York: Springer-Verlag Inc. Amazeen, P. G. (2002). Is dynamics the content of a generalized motor program for rhythmic interlimb coordination? Journal of motor behavior, 34(3), Amazeen, P. G., Amazeen, E. L., & Turvey, M. T. (1998a). Breaking the reflectional symmetry of interlimb coordination dynamics. Journal of motor behavior, 30(3), Amazeen, P. G., Amazeen, E. L., & Turvey, M. T. (1998b). Dynamics of human intersegmental coordination: Theory and research. In D. A. Rosenbaum & C. E. Collyer (Eds.), Timing of behavior: Neural, computational, and psychological perspectives (pp ). Cambridge, MA: MIT Press. Anderson, J. R. (1995). Learning and memory: An integrated approach. Oxford, England: John Wiley & Sons. Andrews, D. H. & Bell, H. H. (2000). Simulation-based training. In S. Tobias & J.D. Fletcher (Eds.), Training and re-training. American Psychological Association, New York, NY: Macmillian-Gale Group. Artman, H. (2000). Team situation assessment and information distribution. Ergonomics, 43, Cooke et al. 153 Team Coordination
168 Atkins, R. J., Lansdowne, A. T. G., Pfister, H. P., & Provost, S. C. (2002). Conversion between control mechanisms in simulated flight: An ab initio quasi-transfer study. Australian Journal of Psychology.Special Issue: Human Factors, 54(3), Bahrick, H. P. (1984). Semantic memory content in permastore: Fifty years of memory for spanish learned in school. Journal of Experimental Psychology: General, 113(1), Bardy, B., Oullier, O., Bootsma, R. J., & Stoffregen, T. A. (2002). Dynamics of human postural transitions. Journal of Experimental Psychology: Human Perception and Performance, 28(3), Baron, R. M., Amazeen, P. G., & Beek, P. J. (1994). Local and global dynamics of social relations. In R. R. Vallacher, & A. Nowak (Eds.), Dynamical systems in social psychology (pp ). San Diego, CA, US: Academic Press. Bassok, M., & K. J. Holyoak (1989). Transfer of domain-specific problem solving procedures. Journal of Experimental Psychology: Learning, Memory, and Cognition 16: Beltrami, E. (2007). Mathematics for dynamical modeling. Academic Press. Brannick, M. T., Prince, A., Prince, C., & Salas, E. (1995). The measurement of team process. Human Factors, 37, Bressler, S. L., & Kelso, J. A. S. (2001). Cortical coordination dynamics and cognition. Trends in cognitive sciences, 5(1), Bryan, W. L. & Harter, N. (1897). Studies in the psysiology of telegraphic language. Psychological Review, 4, 1, Bryant, D. J., & Angel, H. (2001). Retention and Fading of Military Skills. Technical report produced for the Human Performance and Resources Group of the Technical Cooperation Program. Report number TTCP/HUM /01/05. Cooke et al. 154 Team Coordination
169 Camazine, S., Deneubourg, J. L., Franks, N. R., Sneyd, J., Theraula, G., & Bonabeau, E. (2003). Self-Organization in Biological Systems. NJ: Princeton University Press. Cannon-Bowers, J. A., Salas, E., Blickensderfer, E., & Bowers, C. A. (1998). The impact of cross-training and workload on team functioning: A replication and extension of initial findings. Human factors, 40(1), Cannon-Bowers, J. A., Salas, E., & Converse, S. (1993). Shared mental models in expert team decision making. In J. Castellan Jr. (Ed.), Current issues in individual and group decision making (pp ). Hillsdale, NJ: Erlbaum. Carver, C. S., & Scheier, M. F. (2002). Control processes and self-organization as complementary principles underlying behavior. Personality and Social Psychology Review, 6(4), Christoffersen, K., Hunter, C. N., & Vicente, K. J. (1996). A longitudinal study of the effects of ecological interface design on skill acquisition. Human factors, 38(3), Cohen, J. (1994). The earth is round (p<.05) American Psychologist, 49(12), Cohen, G. & Faulkner, D. (1988). Life span changes in autobiographical memory. In M. M. Gruneberg, P. E. Morris & R. N. Sykes (Eds.), International conference on practical aspects of memory, aug 1987, swansea, wales (pp ). Oxford, England: John Wiley & Sons. Collins, J. J. & De Luca, C. J. (1994). Random walking during quiet standing. Physical Review Letters, 73, Cooke, N. J. (1994). Varieties of knowledge elicitation techniques. International Journal of Human-Computer Studies, 41, Cooke et al. 155 Team Coordination
170 Cooke, N. J., Durso, F. T., & Schvaneveldt, R. W. (1994). Retention of skilled search after nine years. Human factors, 36(4), Cooke, N. C., & Gorman, J. C. (2006). Assessment of team cognition. In p. Karwowski (Ed.), 2 nd Edition of the International Encyclopedia of Ergonomics and Human Factors, pp Boca Raton, FL: CRC Press. Cooke, N. J., Gorman, J. C., & Kiekel, P. A. (under revision). Communication as Team-level Cognitive Processing. In M. Letsky, N. Warner, S. Fiore & CAP Smith, Macrocognition in Teams. Elsevier. Cooke, N. J., Kiekel, P. A., Bell, B., & Salas, E. (2002). Addressing limitations of the measurement of team cognition. Proceedings of the Human Factors and Ergonomics Society 46th Annual Meeting, Cooke, N. J., Kiekel, P. A., & Helm E. (2001a). Comparing and validating measures of team knowledge. Proceedings of the Human Factors and Ergonomics Society 45th Annual Meeting. Cooke, N. J., Kiekel, P.A., & Helm E. (2001b). Measuring team knowledge during skill acquisition of a complex task. International Journal of Cognitive Ergonomics: Special Section on Knowledge Acquisition, 5, Cooke, N. J., Kiekel, P. A., Salas, E., Stout, R., Bowers, C., & Cannon-Bowers, J. (2003). Measuring team knowledge: A window to the cognitive underpinnings of team performance. Group Dynamics: Theory, Research, and Practice, 7(3), Cooke, N. J., Rivera, K., Shope, S. M., & Caukwell, S. (1999). A synthetic task environment for team cognition research. Proceedings of the Human Factors and Ergonomics Society 43rd Annual Meeting, Cooke et al. 156 Team Coordination
171 Cooke, N. J., Salas, E., Cannon-Bowers, J. A., & Stout, R. (2000). Measuring team knowledge. Human Factors, 42, Cooke, N. J., Salas, E., Kiekel, P. A., & Bell, B. (2004). Advances in measuring team cognition. In E. Salas and S. M. Fiore (Eds.), Team Cognition: Understanding the Factors that Drive Process and Performance, pp , Washington, DC: American Psychological Association. Cooke, N. J. & Shope, S. M. (1998). Facility for Cognitive Engineering Research on Team Tasks. Report for Grant No. F Cooke, N. J., & Shope, S. M. (2002a). The CERTT-UAV Task: A Synthetic Task Environment to Facilitate Team Research. Proceedings of the Advanced Simulation Technologies Conference: Military, Government, and Aerospace Simulation Symposium, pp San Diego, CA: The Society for Modeling and Simulation International. Cooke, N.J. & Shope, S.M. (2002b). Behind the scenes. UAV Magazine, 7, 6-8. Cooke, N.J., & Shope, S. M. (2005). Synthetic Task Environments for Teams: CERTTS s UAV- STE Handbook on Human Factors and Ergonomics Methods, pp Boca Raton, FL: CLC Press, LLC. Cooke, N. J., Shope, S. M., & Kiekel, P. A. (2001). Shared-Knowledge and Team Performance: A Cognitive Engineering Approach to Measurement. Technical Report for AFOSR Grant No. F Cooke, N.J., & Shope, S. M., & Rivera, K. (2000). Control of an uninhabited air vehicle: A synthetic task environment for teams. Proceedings of the Human Factors and Ergonomics Society 44th Annual Meeting, 389. Cooke et al. 157 Team Coordination
172 Cooke, N. J., Stout, R., Rivera, K., & Salas, E. (1998). Exploring measures of team knowledge. Proceedings of the Human Factors and Ergonomics Society 42nd Annual Meeting, Cooke, N. J., Stout, R., & Salas, E. (1997) Expanding the measurement of situation awareness through cognitive engineering methods. Proceedings of the Human Factors and Ergonomics Society 41st Annual Meeting, Cooke, N. J., Stout, R., & Salas, E. (2001). A knowledge elicitation approach to the measurement of team situation awareness. In M. McNeese, E. Salas, & M. R. Endsley (Eds.), New Trends in Cooperative Activities: Understanding System Dynamics in Complex Environments (pp ). Santa Monica, CA: Human Factors and Ergonomics Society. Crossman, E. P. F. W. (1959). A theory of the acquisition of speed-skill. Ergonomics, 2, Davis, J. H. (1973). Group decision and social interaction: A theory of social decision schemes. Psychological Review, 80, Dick, M. B., Hsieh, S., Bricker, J., & Dick-Muehlke, C. (2003). Facilitating acquisition and transfer of a continuous motor task in healthy older adults and patients with alzheimer's disease. Neuropsychology, 17(2), Doane, S. M., & Sohn, Y. W. (2000). ADAPT: A predictive cognitive model of user visual attention and action planning. User Modeling and User-Adapted Interaction, 10(1), Driskell, J. E. & Johnston, J. H. (1998). Stress exposure training. In J. A. Cannon-Bowers, & E. Salas (Eds.), Making decisions under stress: Implications for individual and team training (pp ). Washington, DC, US: American Psychological Association. Cooke et al. 158 Team Coordination
173 Ebbinghaus, H. (1913). Memory: A contribution to experimental psychology. New York, NY, US: Teachers College Press. Einstein, A. (1905). On the movement of particles in suspension in resting liquids, postulated by the molecular-kinetic theory of warmth. Annalen der Physik, 322, Entin, E. E. & Serfaty, D. (1999). Adaptive team coordination. Human Factors, 41, Favorov, O. V., Hester, J. T., Lao, R., & Tommerdahl, M. (2002). Spurious dynamics in somatosensory cortex. Behavioural Brain Research.Special Issue: Brain mechanisms of tactile perception, 135(1), Festinger, L. (1954). A theory of social comparison processes. Human Relations, 7, Fisk, A. D., & Hodge, K. A. (1992). Retention of trained performance in consistent mapping search after extended delay. Human factors, 34(2), Fitts, P. M., & Posner, M. I. (1967). Human performance. Oxford, England: Brooks/Cole. Gibson, C. (2001). From knowledge accumulation to accommodation: Cycles of collective cognition in work groups. Journal of Organizational Behavior, 22, Gibson, J. J. (1966). The senses considered as perceptual systems. Boston, MA: Houghton, Mifflin. Goettle, B.P., Ashworth III, A.R.S., & Chaiken, S.R. (2007). Advanced distributed learning for team training in command and control apllications. In S.M. Fiore and E. Salas (Eds.), Toward a Science of Distributed Learning (pp ). Washington, DC: American Psychological Association. Gorman, J. C. (2006). Team coordination dynamics in cognitively demanding environments. Ph.D. Dissertation, New Mexico State University Cooke et al. 159 Team Coordination
174 Gorman, J. C., Cooke, N. J., & Kiekel, P. A. (2004). Dynamical perspectives on team cognition. In Proceedings of the Human Factors and Ergonomics Society 48th Annual Meeting. Santa Monica, CA: Human Factors and Ergonomics Society. Gosling, S. D., Rentfrow, P. J., & Swann, W. B. J. (2003). A very brief measure of the big-five personality domains. Journal of Research in Personality, 37(6), Guastello, S. J. (2000). Symbolic dynamic patterns of written exchanges: Hierarchical structures in an electronic problem solving group. Nonlinear Dynamics, Psychology, and Life Sciences, 4(2), Gugerty, L., DeBoom, D., Walker, R., Burns, J. (1999). Developing a simulated uninhabited aerial vehicle (UAV) task based on cognitive task analysis: task analysis results and preliminary simulator data. Proceedings of the Human Factors and Ergonomics Society 43 rd Annual Meeting, pp Hackman, J. R. (1987). The design of work teams. In J. W. Lorsch (Ed.), Handbook of Organizational Behavior (pp ). Englewood Cliffs, NJ: Prentice-Hall. Hagman, J. D., & Rose, A. M. (1983). Retention of military tasks: A review. Human Factors, 25(2), Hinsz, V. B. (1995). Group and individual decision making for task performance goals: Processes in the establishment of goals in groups. Journal of Applied Social Psychology, 25, Hinsz, V. B. (1999). Group decision making with responses of a quantitative nature: The theory of social decision schemes for quantities. Organizational Behavior and Human Decision Processes, 80, Cooke et al. 160 Team Coordination
175 Hollingshead, A. B. & Brandon, D. P. (2003). Potential benefits of communication in transactive memory systems. Human Communication Research, 29, Hurst, H. E. (1951). Long term storage capacity of reservoirs. Transactions of the American Society of Civil Engineering, 116, Hutchins, E. (1991). The social organization of distributed cognition. In L. B. Resnick, J. M. Levine, & S. D. Teasley (Eds.), Perspectives on Socially Shared Cognition (pp ). Washington, DC: American Psychological Association. Ishida, K. & Ohta, T. (2001). Development of Interdisciplinary Academic Commons in Social Science based on Multi Lingual Anchor Texts. Proceedings of the 5th World Multiconference on Systemics, Cybernetics and Informatics, Juarrero, A. (1999). Dynamics in Action. Cambridge, MA: The MIT Press. Kelso, J.A.S. (1995). Dynamic patterns: the self-organization of brain and behavior. MA: MIT Press. Kelso, J. A. S. & Zanone, P. (2002). Coordination dynamics of learning and transfer across different effector systems. Journal of Experimental Psychology: Human Perception and Performance, 28(4), Kennel, M. B., Brown, R., and Abarbanel, H. D. I. (1992). Determining minimum embedding dimension using a geometrical construction. Physical Review A, 45, Kenrick, D. T. & Li, N. (2000). The darwin is in the details. American Psychologist, 55(9), Kiekel, P. A., Cooke, N. J., Foltz, P. W., & Shope, S. M. (2001). Automating measurement of team cognition through analysis of communication data. In M. J. Smith, G. Salvendy, D. Cooke et al. 161 Team Coordination
176 Harris, & R. J. Koubek (Eds.), Usability Evaluation and Interface Design (pp ) Mahwah, NJ: Lawrence Erlbaum Associates. Klein, G. (2001). Features of team coordination. In M. McNeese, M. Endsley, & E. Salas, (Eds.), New Trends in Cooperative Activities: System Dynamics in Complex Settings (pp ). Santa Monica, CA: Human Factors. Kleinman, D. L., Luh, P. B., Pattipati, K. R., & Serfaty, D. (1992). Mathematical models of team distributed decision making. In R. W. Swezey & E. Salas (Eds.), Teams: Their Training and Performance (pp ). Norwood, NJ: Ablex. Kozlowski, S. W. J. & Klein, K. J. (2000). A multilevel approach to theory and research in organizations: Contextual, temporal, and emergent processes. In K. J. Klein & S. W. J. Kozlowski (Eds.), Multilevel Theory, Research, and Methods in Organizations (pp. 3-90). San Francisco, CA: Jossey-Bass. Latané, B. & Nowak, A. (1994). Attitudes as catastrophes: From dimensions to categories with increasing involvement. In R. R. Vallacher, & A. Nowak (Eds.), Dynamical systems in social psychology (pp ). San Diego, CA, US: Academic Press. Leontev, D.A. (1990). Deyatelnost i potrefnost (Activity and need). In D.B. Davydov & D.A. Leontev (Eds.), Deyatelnostnyi Podhod v Psihologii: Problemy i Perspektivy (The Activity Approach in Psychology: Problems and Perspectives) (pp ). Moscow, USSR: APN. Malone, T. W. & Crowston, K. (1994). The interdisciplinary study of coordination. ACM Computing Surveys, 26, Cooke et al. 162 Team Coordination
177 Manber, R., Arnow, B., Blasey, C., Vivian, D., McCullough, J. P., & Blalock, J. A. (2003). Patient's therapeutic skill acquisition and response to psychotherapy, alone or in combination with medication. Psychological medicine, 33(4), Mandelbrodt, B. B. & Van Ness, J. W. (1968). Fractional Brownian motions, fractional noises and applications. SIAM Review, 10, Mathieu, J. E., Goodwin, G. F., Heffner, T. S., Salas, E., & Cannon-Bowers, J. A. (2000). The influence of shared mental models on team process and performance. Journal of Applied Psychology, 85, McDonald, R. D. (1967). Retention of military skills acquired in basic combat training. Technical Report Alexandria, VA: Human Resources Research Office. Mead, S. & Fisk, A. D. (1998). Measuring skill acquisition and retention with an ATM simulator: The need for age-specific training. Human factors, 40(3), Mohammed, S. & Dumville, B. C. (2001). Team mental models in a team knowledge framework: Expanding theory and measurement across discipline boundaries. Journal of Organizational Behavior, 22, Oksendal, B. K. (2000). Stochastic differential equations. Springer-Verlag:Berlin. Orasanu, J. M. (1990). Shared mental models and crew decision making. (Tech. Rep. No. 46). Princeton, NJ: Princeton University, Cognitive Science Laboratory. Paulus, M. P., Rapaport, M. H., & Braff, D. L. (2001). Trait contributions of complex dysregulated behavioral organization in schizophrenic patients. Biological psychiatry, 49(1), Perkos, S., Theodorakis, Y., & Chroni, S. (2002). Enhancing performance and skill acquisition in novice basketball players with instructional self-talk. Sport Psychologist, 16(4), Cooke et al. 163 Team Coordination
178 Prophet, W. W. (1976). Long-term retention of flying skills: A review of the literature. HumRRO Final Technical Report FR-ED(P) Alexandria, VA: Human Resources Research Organization. Reed, E. S. (1996). Encountering the world: Toward an ecological psychology. New York: Oxford University Press. Rose, S. R. (1989). Members leaving groups: Theoretical and practical considerations. Small Group Behavior, 20(4), Rosenstein, M. T., Collins, J. J., and De Luca, C. J. (1993). A practical method for calculating largest Lyapunov exponents from small data sets. Physica D, 65, Rubin, D. C., Wetzler, S. E., & Nebes, R. D. (1986). Autobiographical memory across the lifespan. In D. C. Rubin (Ed.), Portions of this book were presented at the 92nd annual convention of the American Psychological Association (pp ). New York, NY, US: Cambridge University Press. Sabol, M. A. & Wisher, R. A. (2001). Retention and reacquisition of military skills. Military Operations Research, 6(1), Salas, E. Dickinson, T. L., Converse, S. A., & Tannenbaum, S. I. (1992). Toward an understanding of team performance and training. In R. W. Swezey & E. Salas (Eds.), Teams: Their training and performance (pp. 3-29). Norwood, NJ: Ablex. Sato, S., Sano, M., and Sawada, Y. (1987). Practical methods of measuring the generalized dimension and the largest Lyapunov exponent in high dimensional chaotic systems. Progress of Theoretical Physics, 77, 1-5. Sauer, J., Hockey, G. R. J., & Wastell, D. G. (2000). Effects of training on short- and long-term skill retention in a complex multiple-task environment. Ergonomics, 43(12), Cooke et al. 164 Team Coordination
179 Schmidt, R. C., Bienvenu, M., Fitzpatrick, P. A., & Amazeen, P. G. (1998). A comparison of intra- and interpersonal interlimb coordination: Coordination breakdowns and coupling strength. Journal of Experimental Psychology: Human Perception and Performance, 24(3), Schvaneveldt, R. W. (1990). Pathfinder associative networks: Studies in knowledge organization. Westport, CT, US: Ablex Publishing. Seers, A. (1989). Team-member exchange quality: A new construct for role-making research. Organizational Behavior and Human Decision Processes, 43(1), Seiler, R. (2000). The intentional link between environment and action in the acquisition of skill. International Journal of Sport Psychology.Special Issue of the International Journal of Sports Psychology: Sport psychology in a broad perspective, 31(4), Shoda, Y., LeeTiernan, S., & Mischel, W. (2002). Personality as a dynamical system: Emergency of stability and distinctiveness from intra- and interpersonal interactions. Personality and Social Psychology Review, 6(4), Singley, M. K. & Anderson, J. R. (1989). The transfer of cognitive skill. Cambridge, MA, US: Harvard University Press. Steiner, I.D. (1972). Group process and productivity. New York: Academic Press. Stout, R. J., Cannon-Bowers, J. A., & Salas, E. (1996). The role of shared mental models in developing team situation awareness: implications for training. Training Research Journal, 2, Stout, R.J., Cannon-Bowers, J.A., Salas, E. & Milanovich, D.M. (1999). Planning, shared mental models and coordinated performance: an empirical link is established. Human Factors, 41, Cooke et al. 165 Team Coordination
180 Stout, R. J., Salas, E., & Carson, R. (1994). Individual task proficiency and team process behavior: What is important for team functioning. Military Psychology, 6, Taatgen, N. A. (2001). A model of individual differences in learning air traffic control. In E. M. Altmann, A. Cleeremans, C. D. Schunn & W. D. Gray (Eds.), International conference on cognitive modeling., jul 2001, george mason U, fairfax, US (pp ). Mahwah, NJ, US: Lawrence Erlbaum Associates Publishers. Thorndike, E. L. & Woodworth, R. S. (1901). The influence of improvement in one mental function upon the efficiency of other functions: Functions involving attention, observation and discrimination. Psychological review, 8(6), Treffner, P. J. & Kelso, J. A. S. (1999). Dynamic encounters: Long memory during functional stabilization. Ecological Psychology, 11, Turvey, M. T. (1990). Coordination. American Psychologist, 45(8), Tushman, M. L. (1979). Work characteristics and subunit communication structure: A contingency analysis. Administrative Science Quarterly, 24, Vallacher, R.R. & Nowak, A. (1994). Dynamical systems in social psychology. San Diego, CA: Academic Press. Vallacher, R. R., Read, S. J., & Nowak, A. (2002). The dynamical perspective in personality and social psychology. Personality and Social Psychology Review, 6(4), Van Orden, G. C. & Holden, J. G. (2002). Intentional contents and self-control. Ecological Psychology, 14(1), Van Orden, G. C., Pennington, B. F., & Stone, G. O. (2001). What do double dissociations prove? Cognitive Science, 25(1), Cooke et al. 166 Team Coordination
181 Wang, W-P, Kleinman, D. L., & Luh, P. B. (2001). Modeling team coordination and decisions in a distributed dynamic environment. In G. M. Olson, T. W. Malone, & J. B. Smith (Eds.), Coordination Theory and Collaboration Technology (pp ). Mahway, NJ: Earlbaum. Warren, K., Hawkins, R. C., & Sprott, J. C. (2003). Substance abuse as a dynamical disease: Evidence and clinical implications of nonlinearity in a time series of daily alcohol consumption. Addictive Behaviors, 28(2), Wickens, C. D. (1992). Engineering psychology and human performance (2nd ed.). New York, NY, US: HarperCollins Publishers. Wickens, T. D. (1998). On the form of the retention function: Comment on Rubin and Wenzel (1996): A quantitative description of retention. Psychological review, 105(2), Wisher, R., Sabol, M. A. & Ellis, J. A. (1999) Staying Sharp: Retention of military knowledge and skills (ARI Special Report 39). US Army Research Institute for Social and Behavioral Sciences: Alexandria, VA. Wisher, R. A., Sabol, M. A., & Kern, R. P. (1995). Modeling acquisition of an advanced skill: The case of morse code copying. Instructional Science, 23(5), Yesavage, J. A., O'Hara, R., Kraemer, H., Noda, A., Taylor, J. L., Ferris, S., et al. (2002). Modeling the prevalence and incidence of alzheimer's disease and mild cognitive impairment. Journal of psychiatric research, 36(5), Zachary, W., Campbell, G. E., Laughery, K. R., Glenn, F. & Cannon-Bowers, J. A. (2001). The application of human modeling technology to the design, evaluation and operation of complex systems. In E. Salas (Ed.), Advances in human performance and cognitive engineering research (pp ). US: Elsevier Science/JAI Press. Cooke et al. 167 Team Coordination
182 Zanone, P. G. & Kelso, J. A. (1992). Evolution of behavioral attractors with learning: Nonequilibrium phase transitions. Journal of Experimental Psychology: Human Perception and Performance, 18(2), Zanone, P. G. & Kelso, J. A. S. (1997). Coordination dynamics of learning and transfer: Collective and component levels. Journal of Experimental Psychology: Human Perception and Performance, 23(5), Zaror, G., & Guastello, S. J. (2000). Self-organization and leadership emergence: A crosscultural replication. Nonlinear Dynamics, Psychology, and Life Sciences, 4(1), Cooke et al. 168 Team Coordination
183 6.0 ACKNOWLEDGEMENTS We would like to acknowledge the assistance of a number of individuals who helped in various capacities with this project. They include Olena Connor, Janie DeJoode, Ben Fasano, Steven James, Preston Kiekel, Ben Schaub, Roger Schvaneveldt, Steven Shope, Eugene Slutskiy, and Tom Taylor. We are also grateful for the guidance of AFOSR Cognition and Decision Making program managers, Bob Sorkin and Jerome Busemeyer. Cooke et al. 169 Team Coordination
184 7.0 GLOSSARY ACT-R Adaptive Control of Thought-Rational AFOSR Air Force Office of Scientific Research AFRL Air Force Research Laboratory ASU - Arizona State University AVO Air Vehicle Operator CAST Coordinated Awareness of Situations by Teams CERI Cognitive Engineering Research Institute CERTT Cognitive Engineering Research on Team Tasks CRADA Cooperative Research and Development Agreement DEMPC Data Exploitation, Mission, Planning, and Communication Operator DST Dynamical Systems Theory DURIP Defense University Research Instrumentation Program Effective Radius Area surrounding a waypoint in which airspeed and altitude restrictions are in effect and camera is operable F Feedback initiated H Hurst exponent I Information initiated IG Intrinsic geometry KNOT Knowledge Network Organization Tool (Computer Software) IPO Input-process-output MURI Multi-disciplinary University Research Initiative N Negotiation initiated NASA TLX National Aeronautics and Space Administration Task Load Index NMSU New Mexico State University NTE Non-talking Experimenter; a second experimenter who logs the coordination of the teams. Unlike the talking-experimenter the NTE does not call in ad-hoc targets or communicate over the head-sets with teams. ONR Office of Naval Research PALM Performance and Learning Models Pathfinder Psychological scaling technique used for representing human judgments in graphical form PLO Payload Operator Predator Air Force Unmanned Aerial Vehicle Referent Network Pathfinder network representing ideal knowledge, generated by experimenters or empirically from expert data ROZ Entry Restricted Operating Zone SA Situation Awareness SART Situational Awareness Rating Technique SMM Shared mental model STE Synthetic Task Environment TIPI Ten Item Personality Inventory TSA Team situation awareness UAV Uninhabited Aerial Vehicle Waypoint A named landmark on a map Cooke et al. 170 Team Coordination
185 Subscore 8.0 APPENDICES Appendix A Components of Individual and Team Performance Scores Subscore Subscore Numerator Transformation Denominator Weight Relative Weight AVO Alarm Penalty AVO Alarm Duration missiontotalsecs subscore^ Warning Penalty AVO Warning Duration missiontotalsecs subscore^ Course Dev Penalty From Flgt_Sum.rds, Sum totalroutelength - of all Sum0fDev AVO Rte Seq Penalty Planned WPs not Visited** + Visted WPs not Planned - WPs can't make* total wps planned - WPs can't make* PLO Alarm Penalty PLO Alarm Duration missiontotalsecs subscore^ Warning Penalty PLO Warning Duration missiontotalsecs subscore^ Duplicate Good totalgood - film - Photos Penalty totalgoodunique Missed or Slow totalgoodunique missiontotalsecs/60 1-subscore Photo Penalty Bad Photo Penalty Bad Photos Film DEMPC Alarm Penalty DEMPC Alarm Duration missiontotalsecs subscore^ Warning Penalty DEMPC Warning missiontotalsecs subscore^.5 Duration Missed CWPs Not unique total wps Critical WPs not planned - Planned Penalty planned Alarm WPs Penalty Hazard/Lost WPs unique total wps - Planned planned Rte Seq Plan Penalty Rte Seq Plan Violation total wps planned TEAM Alarm Penalty TEAM Alarm Duration missiontotalsecs subscore^ Warning Penalty TEAM Warning Duration missiontotalsecs subscore^ Missed or Slow Crit critical_reached missiontotalsecs/60 1-subscore WPs Penalty Missed or Slow totalgoodunique missiontotalsecs/60 1-subscore Photos Penalty *WPs can't make = total wps planned - the number in the DEMPC route that signifies the last waypoint hit by AVO and planned by DEMPC ** Planned WPs not visited is not the same number as noted by the rapid file. It is the number of planned WPs not visited out of the unique WPs planned - 3 Cooke et al. 171 Team Coordination
186 Appendix B Pathfinder Referent Networks In previous studies, a logical referent network generated by the experimenters served as the key with which taskwork knowledge was evaluated. In Experiment 1, empirical referents were derived for the AVO, PLO, DEMPC, and Team based on the taskwork knowledge networks of the top five performing (determined with the original performance scores) individuals (or teams) over the first three experiments conducted in the UAV-STE. For example, in constructing the AVO empirical referent, we gathered the taskwork networks of the five highest performing AVOs across three experiments (N = 68). The links in the AVO empirical referent reflected the links contained in the majority (i.e., at least three) of the top five performing AVO networks. The team networks, from the top five performing teams, used in constructing the team empirical referent were the teams holistic networks, which were generated from the taskwork ratings collected at the team level. Alternative approaches to determining the team networks include 1) averaging individual ratings in order to construct a network representative of the team knowledge and 2) using the union of the links in the three individual networks as the team network. We felt that the team networks generated from the holistic ratings were most representative of the teams knowledge whereas the two alternative approaches did not seem as appropriate for teams with different roles. The basis for deriving new referents empirically stemmed from the notion that experimenters knowledge of the task is likely more extensive and developed across all roles and thus, may not serve as a proper comparison against participants who are less experienced and knowledgeable of other roles. The empirically derived referents are listed below in Figures Figure 45. AVO empirical taskwork referent. Cooke et al. 172 Team Coordination
187 Figure 46. PLO empirical taskwork referent. Figure 47. DEMPC empirical taskwork referent. Cooke et al. 173 Team Coordination
188 Figure 48. Team empirical taskwork referent. Cooke et al. 174 Team Coordination
189 Appendix C Teamwork Knowledge Questionnaire Instructions: You will be reading a mission scenario in which your team will need to achieve some goal. As you go through the scenario in your mind, think about what communications are absolutely necessary among all of the team members in order to achieve the stated goal. For example, does the AVO ever have to call the DEMPC about something? Using checkmarks, indicate on the attached scoring sheet which communications are absolutely necessary for your team to achieve the goal. Scenario: Intelligence calls in a new priority target to which you must proceed immediately. There are speed and altitude restrictions at the target. You must successfully photograph the target in order to move on to the next target. At a minimum, what communications are absolutely necessary in order to accomplish this goal and be ready to move on to the next target? (check those that apply) AVO communicates altitude to PLO AVO communicates speed to PLO AVO communicates course heading to PLO AVO communicates altitude to DEMPC AVO communicates speed to DEMPC AVO communicates course heading to DEMPC PLO communicates camera settings to AVO PLO communicates photo results to AVO PLO communicates camera settings to DEMPC PLO communicates photo results to DEMPC DEMPC communicates target name to AVO DEMPC communicates flight restrictions to AVO DEMPC communicates target type (e.g., nuclear plant) to AVO DEMPC communicates target name to PLO DEMPC communicates flight restrictions to PLO DEMPC communicates target type (e.g., nuclear plant) to PLO Cooke et al. 175 Team Coordination


190 Appendix D Cast Roadblocks used in Experiment 1 Cooke et al. 176 Team Coordination

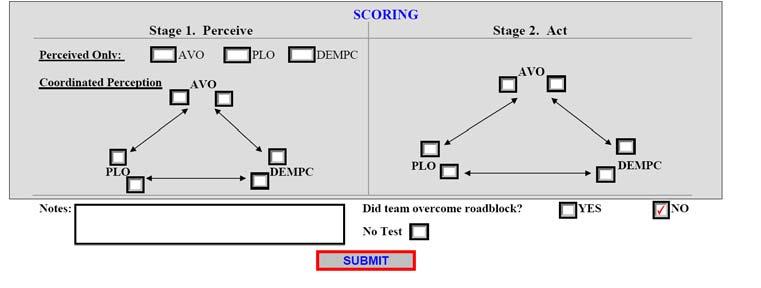

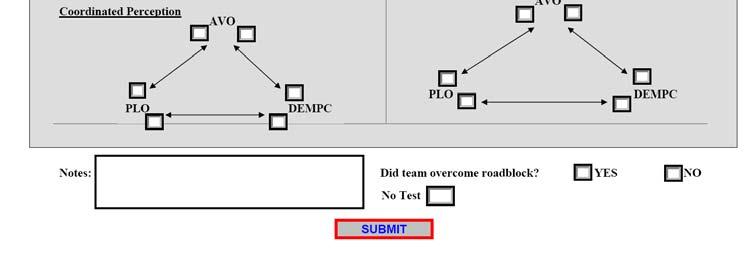
191 Cooke et al. 177 Team Coordination

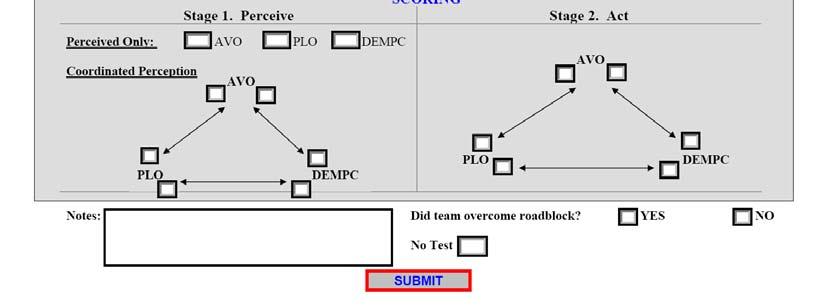
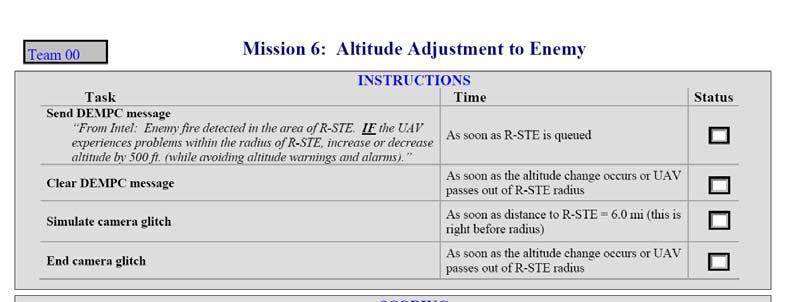
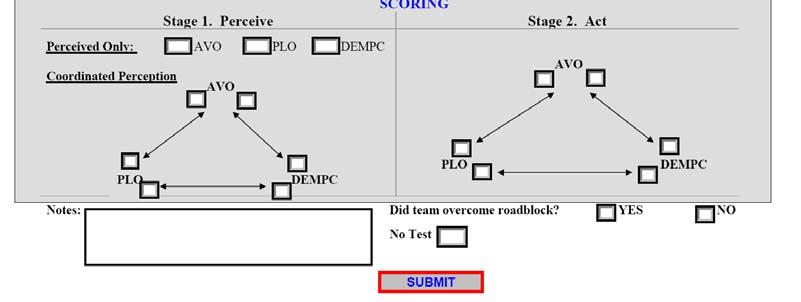
192 Cooke et al. 178 Team Coordination

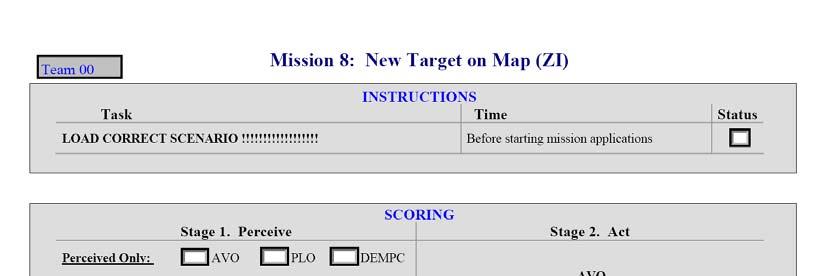
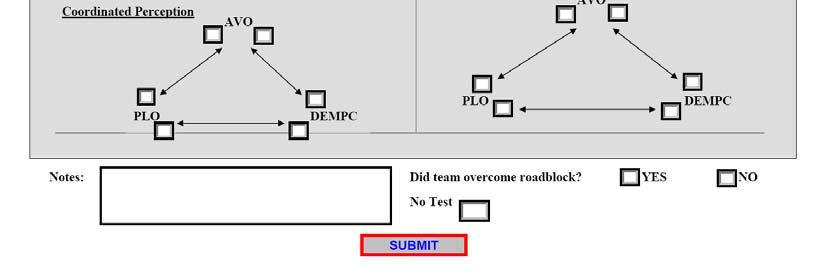
193 Cooke et al. 179 Team Coordination
194 Appendix E Experiment 1 Debriefing Questions Demographic Questions 1. Team Number 2. Job 3. Rank 4. Major 5. Aviation Experience 6. Ethnicity 7. Class (i.e., Freshmen) 8. Gender 9. GPA Miscellaneous Questions (Scale: 0-disagree to 4-agree) 10. I enjoyed participating in this study 11. I enjoyed the team task part of this study 12. I would welcome the opportunity to participate in this study in the future 13. I like to be part of a team 14. I was a successful member of the team 15. I performed well on this task 16. At least one of my team members didn t pull his/her weight 17. During the missions, a variety of unexpected events occurred. My team handled them well 18. When I came back for the second session it took me a while to become reacquainted with the task 19. When I came back for the second session it took me a while to become reacquainted with the team 20. When I came back for the second session my team worked just as well in the beginning of second session as my team did at the end of the first session 21. How experienced are you at playing video games as a team in an interactive manner (e.g., over the internet or with multiple people playing on the same computer or TV)? Videogame Experience Question (Open-ended) If you have experience playing videogames as a team, what type of videogames have you played the most (give name and brief description)? Second Session Performance Question (Open-ended) Is there anything that could have helped you perform better, or get you back up to speed, at the start of the second session (e.g., more training, the addition of specific information on your displays, etc)? Cooke et al. 180 Team Coordination
195 Appendix F Experiment 2 Debriefing Questions Demographic Questions 1. Team Number 2. Job 3. Rank 4. Major 5. Aviation Experience 6. Ethnicity 7. Class (i.e., Freshmen) 8. Gender 9. GPA Miscellaneous Questions (Scale: 0-disagree to 4-agree) 10. I enjoyed participating in this study 11. I enjoyed the team task part of this study 12. I would welcome the opportunity to participate in this study in the future 13. I like to be part of a team 14. I was a successful member of the team 15. I performed well on this task 16. At least one of my team members didn t pull his/her weight 17. During the missions, a variety of unexpected events occurred. My team handled them well 18. When I came back for the second session it took me a while to become reacquainted with the task 19. When I came back for the second session it took me a while to become reacquainted with the team 20. When I came back for the second session my team worked just as well in the beginning of second session as my team did at the end of the first session 21. How experienced are you at playing video games as a team in an interactive manner (e.g., over the internet or with multiple people playing on the same computer or TV)? Videogame Experience Question (Open-ended) If you have experience playing videogames as a team, what type of videogames have you played the most (give name and brief description)? Second Session Performance Question (Open-ended) Is there anything that could have helped you perform better, or get you back up to speed, at the start of the second session (e.g., more training, the addition of specific information on your displays, etc)? Cooke et al. 181 Team Coordination
196 Appendix G Experiment 1 Ten Item Personality Inventory (TIPI) Team Number: Gender: M F Here are a number of personality traits that may or may not apply to you. Please write a number next to each statement to indicate the extent to which you agree or disagree with that statement. You should rate the extent to which the pair of traits applies to you, even if one characteristic applies more strongly than the other. 1 = Disagree strongly 2 = Disagree moderately 3 = Disagree a little 4 = Neither agree nor disagree 5 = Agree a little 6 = Agree moderately 7 = Agree strongly I see myself as: 1. Extraverted, enthusiastic. 2. Critical, quarrelsome. 3. Dependable, self-disciplined. 4. Anxious, easily upset. 5. Open to new experiences, complex. 6. Reserved, quiet. 7. Sympathetic, warm. 8. Disorganized, careless. 9. Calm, emotionally stable. 10. Conventional, uncreative. Cooke et al. 182 Team Coordination
197 Appendix H Experiment 1 Team Member Exchange Quality Questionnaire Directions: Please indicate the appropriate rating for each individual on your team including yourself. Use the scale that is drawn below. Thank you. 5=I completely agree 4=I partially agree 3=I neither agree nor disagree 2=I partially disagree 1=I completely disagree 1. This team member often made suggestions about better work methods to other team members. AVO PLO DEMPC 2. This team member often let other team members know when they had done something that made their job easier (or harder). AVO PLO DEMPC 3. This team member was flexible about switching job responsibilities to help team members. AVO PLO DEMPC 4. This team member acted as the leader of the group during the missions. AVO PLO DEMPC 5. This team member acted as the leader of the group during the knowledge sessions. AVO PLO DEMPC Cooke et al. 183 Team Coordination
198 Appendix I Experiment 1 Personality and Performance As a secondary question, we were interested in the impact of individual team member personality on team performance and how team interactions learned in the context of one team might carry over to another team. Specifically, we wondered if dysfunctional team behavior resulting from the presence in Session 1 of a team member with unique personality characteristics would transfer to new teams that host one of the non-aberrant team members from Session 1. To measure personality we utilized the Ten Item Personality Inventory (TIPI). The TIPI, which is based on the Big Five, was chosen after careful consideration; we were in need of a valid and short individual personality measurement tool. This survey initiates ten statements that begin, I see myself as: followed by two descriptors; subjects respond using a seven-point scale 1=disagree strongly and 5=agree strongly. Test-retest reliabilities for this measure range from.62 to.77 (Gosling, Rentfrow, & Swann, 2003). This measure is reproduced in Appendix G. In this section we report the results stemming from this measure. The TIPI was completed by a total of 81 individuals (8 short-intact teams, 4 short-mixed, 6 longintact, and 9 long-mixed) at the end of session 2. Due to the Team Composition manipulation, we had to track the team numbers for the mixed teams to see if we had TIPI responses from each of the members of their originating team. In some cases, only one or two of the team members of an originating team returned to complete the second session with a new team, therefore we did not have the complete set of TIPI responses for some session 1 teams. In other words, for the session 1 analyses we had a smaller number of mixed teams than for the Session 2 analyses. Of the 13 session 2 mixed teams that had completed the TIPI, we had responses from all three team members for only three of the session 1 short-mixed teams and five of the session 1 long-mixed teams. Only these eight teams were included in the Session 1 analyses because the aim was to look at the impact of individual team member personality on team performance in session one. Therefore, the Session 1 analyses presented here includes 8 short-intact teams, 3 short-mixed, 6 long-intact, and 5 long-mixed) We calculated Chi-square tests to assess whether the classification of high and low performance and teams with high vs. low coordination scores at Mission 4 is dependent on personality characteristics. Teams were split into high and low performance groups and high and low process groups using a median split on each of dependent measures, team performance and mean coordination ratings across targets. Additionally, we identified individuals that reported scores outside of two standard deviations from the mean on any of the Big-Five personality traits, and categorized teams based on whether at least one or none of the members fit this criterion. The data are summarized in contingency tables to illustrate the distribution of outlying personality characteristics across performance and process rating groups (see Tables 63 and 64). Table 63 Outlying Personality Scores across High and Low Performance Groups Cooke et al. 184 Team Coordination
199 Team Members With Outlying Personality Score Performance At Least One None Low 2 9 High 6 5 Total 8 14 Table 64 Outlying Personality Scores across High and Low Process Groups Team Members With Outlying Personality Score Process ratings At Least One None Low 4 7 High 4 7 Total 8 14 The results of the Chi-Square tests indicate that the classification of high and low performing teams at Mission 4 is dependent on team personality composition (χ 2 (3, N = 22) = 3.14, p <.10). Conversely, the results indicated that the classification of high and low process ratings were independent of team personality composition (χ 2 (3, N = 22) = 0, p >.10). For Session 2, due to the nature of our mixed vs. intact manipulation, we analyzed the data in two stages. First, we looked at the intact teams. We tested whether the decrement in performance, process ratings, and coordination scores between Mission 4 and Mission 6 were dependent on team personality composition. The data used for these analyses included the eight short-intact teams and six long-intact teams. Once again, we categorized teams into two groups to indicate whether or not they contained a member who reported outlying personality characteristics. The results of the Chi-Square tests indicate that the classification of teams experiencing small and large decrements in performance is independent of team personality composition (χ 2 (3, N = 14) =.31, p >.10). Similarly, the classification of teams experiencing small and large decrements in process ratings and coordination scores does not depend on team personality composition (χ 2 (3, N = 14) = 1.93, p >.10 and χ 2 (3, N = 14) =.31, p >.10, respectively). Tables illustrates the distribution of individuals with outlying personality scores across large and small decrements in team performance, process ratings, and coordination scores. Table 65 Outlying Personality Scores across High and Low Team Performance Decrements (Intact Teams) Team Members With Outlying Personality Score Team Performance At Least One None Low 2 5 High 3 4 Total 5 9 Cooke et al. 185 Team Coordination
200 Table 66 Outlying Personality Scores across High and Low Process Rating Decrements (Intact Teams) Team Members With Outlying Personality Score Process ratings At Least One None Low 4 3 High 1 6 Total 5 9 Table 67 Outlying Personality Scores across High and Low Coordination Decrements (Intact Teams) Team Members With Outlying Personality Score Coordination Scores At Least One None Low 2 5 High 3 4 Total 5 9 Next, we looked at the mixed teams. We tested whether the decrement in performance, process ratings, and coordination scores between Mission 4 and Mission 6 were dependent on team personality composition. The data used for the remaining analyses included the session 2 data for the mixed teams (four short-mixed and nine long-mixed). The mixed teams were categorized into one of three groups. If, during Session 2, a mixed team contained a team member that had reported outlying personality scores, then they were categorized as currently containing an outlying team member (Current). If, during Session 2, a mixed team did not include any outlying team members, but was comprised of at least one member that had previously (in Session 1) worked with an outlying team member, then they were categorized as previously containing an outlying team member (Previous). If, during Session 2, a mixed team did not include any outlying team members (Current), and was not comprised of any members that had worked with an outlying team member during Session 1 (Previous), then the team was characterized as including no outlying team members (None). Table 68 illustrates the how the mixed teams were categorized into these three groups. Table 68 Distribution of Outlying Personality Score (Mixed Teams) Team Members With Outlying Personality Score Current Previous None The following analyses were calculated to systematically compare these groups. First, we compared the Current group with the None groups, and the results of the Chi-Square tests Cooke et al. 186 Team Coordination
201 indicate that the classification of teams experiencing small and large decrements in performance is dependent on team personality composition (χ 2 (3, N = 10) = 3.6, p <.10). Conversely, the classification of teams experiencing small and large decrements in process ratings and coordination scores does not depend on team personality composition (χ 2 (3, N = 10) =.4, p >.10 and χ 2 (3, N = 10) =.4, p >.10, respectively). Tables illustrates the distribution of individuals with outlying personality scores across large and small decrements in team performance, process ratings, and coordination scores. Table 69 Outlying Personality Scores across High and Low Team Performance Decrements (Mixed Teams) Team Members With Outlying Personality Score Team Performance Current None Low 1 4 High 4 1 Total 5 5 Table 70 Outlying Personality Scores across High and Low Process Decrements (Mixed Teams) Team Members With Outlying Personality Score Process ratings Current None Low 2 3 High 3 2 Total 5 5 Table 71 Outlying Personality Scores across High and Low Coordination Decrements (Mixed Teams) Team Members With Outlying Personality Score Coordination Scores Current None Low 3 2 High 2 3 Total 5 5 Next, we compared the Current and Previous groups. The results of the Chi-Square tests indicate that the classification of teams suffering small and large decrements in performance is dependent on current and previous team members (χ 2 (3, N = 8) = 4.8, p <.10). Similarly, the classification of process rating decrements is dependent on current and previous team members (χ 2 (3, N = 8) = 4.8, p <.10). Additionally, the classification of coordination score decrements is dependent on current and previous team members (χ 2 (3, N = 8) = 4.8, p <.10). Tables illustrate the Cooke et al. 187 Team Coordination
202 distribution of individuals with outlying personality scores across performance, process rating, and coordination decrement categories. Table 72 Outlying Personality Scores across High and Low Team Performance Decrements (Mixed Teams) Team Members With Outlying Personality Score Team Performance Current Previous Low 1 3 High 4 0 Total 5 3 Table 73 Outlying Personality Scores across High and Low Process Decrements (Mixed Teams) Team Members With Outlying Personality Score Process ratings Current Previous Low 1 3 High 4 0 Total 5 3 Table 74 Outlying Personality Scores across High and Low Coordination Decrements (Mixed Teams) Team Members With Outlying Personality Score Coordination Scores Current Previous Low 4 0 High 1 3 Total 5 3 Lastly, we compared the Previous and None groups. The results of the Chi-Square tests indicate that the classification of teams suffering small and large decrements in performance is independent of previous team members (χ 2 (3, N = 8) =.686, p >.10). Similarly, the classification of process rating decrements is independent of previous team members (χ 2 (3, N = 8) = 1.6, p >.10). Additionally, the classification of coordination score decrements is independent of previous team members (χ 2 (3, N = 8) = 1.6, p >.10). Tables illustrate the distribution of team containing members that had previously worked with those reporting outlying personality scores across performance, process rating, and coordination decrement categories. Table 75 Cooke et al. 188 Team Coordination
203 Outlying Personality Scores across High and Low Team Performance Decrements (Mixed Teams) Team Members With Outlying Personality Score Team Performance None Previous Low 4 3 High 1 0 Total 5 3 Table 76 Outlying Personality Scores across High and Low Process Decrements (Mixed Teams) Team Members With Outlying Personality Score Process ratings None Previous Low 3 3 High 2 0 Total 5 3 Table 77 Outlying Personality Scores across High and Low Coordination Decrements (Mixed Teams) Team Members With Outlying Personality Score Coordination Scores None Previous Low 2 0 High 3 3 Total 5 3 Findings We hypothesized that teams with members who are outliers on personality traits may exhibit lower team performance and process ratings. The results indicate that Mission 4 performance was dependent on member personality traits, but the trend is in the opposite direction of what was expected. Higher performance was attained by teams with at least one team member with an extreme TIPI score. We assessed intact and mixed teams separately, expecting that teams with members that are outliers on TIPI personality traits may exhibit lower team performance, process ratings, and coordination scores o For intact teams performance, process, or coordination scores were independent of team member personality traits o For mixed teams, there was a greater performance decrement for teams with at least one outlying team member in Session 2 than for teams with no outlying team members in Session 2. Cooke et al. 189 Team Coordination
204 o For mixed teams there were also greater performance and process decrements for Session 2 teams with at least one current outlying team member than for teams with members exposed to an outlying team member in Session 1. o However, for mixed teams there was a greater coordination decrement for teaks with members exposed to an outlying team member in Session 1 than for teams with a current Session 2 outlying team member. Overall these results are interesting and support the intuition that team members with extreme personality characteristics can impact team performance (though in some cases for the better). However when teams remain intact (i.e., intact condition) there seems to be little effect of aberrant team members over time compared to teams with changing team composition. More interesting, is the suggestion that exposure to outlying team members on a previous team can be carried over to the new team and affect team coordination for that new team. Experiment 1 Team Member Exchange Quality We were interested in how individuals would rate the quality of their team-member exchange and how manipulation of Team Composition and Retention Interval may affect these ratings. We used a selection of items from Seers (1989) team-member exchange quality survey (see Appendix H). At the end of their second session, participants responded to a five item survey by indicating whether they and their team members 1) made suggestions about better work methods, 2) let other team members know when they had done something that made their job easier, 3) were flexible about switching job responsibilities, 4) acted as the leader of the group during the missions, and 5) acted as the leader of the group during the knowledge sessions. For each of the five items, participants responded by indicating on a five point scale whether these items were true of themselves and their two team members. The survey was administered to a total of 27 teams (7 short-intact, 4 short-mixed, 6 long-intact, 10 long-mixed); however, one individual out of these teams did not respond to any of the items, therefore, we report the results of a total of 80 participants. A second individual out of these teams responded to all five items as they pertained to their team members, but did not rate themselves on any of the five items; therefore, we report the results of 79 participants for the self-ratings. Overall, participants indicated that the quality of their team-member exchange was high. Participants reported themselves as having often made suggestions about better work methods (M = 4.04, SD = 0.88). They reported the same of their two team members (M = 3.92, SD = 1.04). Similarly, participants reported themselves and their team members as having let others know when others had done something to make their job easier (or harder) (M = 3.84, SD = 1.01 and M = 3.78, SD = 1.03, respectively). Participants also reported themselves and their team members as having been flexible about switching responsibilities to help team members (M = 3.74, SD = 1.0 and M = 3.65, SD = 1.05, respectively). Participants reported themselves as acting as a leader during the missions (M = 3.65, SD = 0.85). They reported the same for their team members (M = 3.51, SD = 1.07). Lastly, participants reported that they and their team members acted as leaders during the knowledge sessions as well (M = 3.59, SD = 0.99 and M = 3.65, SD = 1.03, respectively). Paired-sample t-tests were calculated to test for significant differences between participants selfratings and the ratings they assigned to their team members. Participants reported themselves Cooke et al. 190 Team Coordination
205 higher on flexibility (t(78) = 1.79, p =.08). There were no other significant differences between participants self-ratings and the ratings they had given to their team members. Next, the team-member exchange ratings were assessed relative to the experimental manipulations. First, the participants self-ratings were assessed. Team-member exchange ratings for each of the five items served as the dependent measures in the Team Composition (2) x Retention Interval (2) MANOVA with Team Composition and Retention Interval as the fixed factors. The MANOVA revealed no significant main effect of Team Composition, Retention Interval, or an interaction between Team Composition and Retention Interval. Next, the participants ratings of their team members contributions were assessed. Teammember exchange ratings for each of the five items served as the dependent measures in the Team Composition (2) x Retention Interval (2) MANOVA with Team Composition and Retention Interval as the fixed factors. The MANOVA revealed no significant main effect of Team Composition, Retention Interval, or an interaction between Team Composition and Retention Interval. Findings Overall, participants indicated that the quality of their team-member exchange was high. Participants rated themselves as highly as they rated their team members on the quality of their contributions to the team-member exchange. Participants rated themselves higher on flexibility. Ratings of team-member exchange quality were not affected by the experimental manipulations (Team Composition or Retention Interval). Cooke et al. 191 Team Coordination
206 Appendix J Basic Skills Training Checklist Have the following behaviors performed by the three team members in order and check them off as they are accomplished. With two experimenters, the DEMPC and AVO checks can be conducted in parallel with the PLO checks following COMMUNICATION CHECKS Everyone should put headsets on, including the experimenters. Experimenters talk to team members over the headsets conducting the following checks. Adjust microphones and instruct on push-to-talk button and intercom as needed. Experimenter queries each team member in turn: Experimenter can hear AVO AVO can hear Experimenter Experimenter can hear PLO PLO can hear experimenter Experimenter can hear DEMPC DEMPC can hear experimenter Experimenter queries each team member in turn: Experimenter can hear everyone AVO can hear PLO and DEMPC PLO can hear AVO and DEMPC DEMPC can hear AVO and PLO Instruct team members to push appropriate button to talk. AVO can talk to DEMPC only PLO can talk to AVO only DEMPC can talk to PLO only Remove and stow headsets. Start the UAV simulation (Training Mission- see Manual Section V). Ask the team members to do each of the following activities and check them off as they are observed. In both conditions, the participants should stay glued to their stations. DEMPC CHECKS As the Dempc, your job is to plan the UAV flight route. This is the initial route given to you by Intel. Every waypoint on this list corresponds to a point on your world map. You need to look through your list and identify all the necessary waypoints for your mission, such as ROZ entry/exits and targets. You also need to remove possible hazards and unnecessary waypoints. You want to get five waypoints that you plan to attend in a row so you can sequence them and send the route to the AVO. Remember, once you hit sequence Cooke et al. 192 Team Coordination
207 you cannot change any of the five waypoints that are highlighted. Start at the top of the list and identify the waypoints listed by running the cursor over the corresponding point on the map. All necessary waypoint information is found in your information window. [have Dempc do this until they reach BEB]. Delete waypoint BEB from the flight plan: Since BEB is a hazard you need to remove that point from your list. [ask if they remember how to delete a waypoint and show them if they need help] Insert waypoint BYU into the flight plan between MON and WIC BYU is a ROZ entry that s not listed in your initial route list. You must go through a ROZ entry before you take pictures of any targets within a ROZ box so you need to add this waypoint. [ask if they remember how to insert a waypoint and show them if they need help] Identify the effective radius of BYU Part of your job is to communicate all necessary information about waypoints to your team members, such as airspeed or altitude restrictions and the effective radius. Remember, as long as a waypoint has restrictions you will receive a hazard warning. You want to encourage your team to get through those waypoints as quickly as possible. [ask dempc to identify the effective radius] Sequence the plan until the following subset of 5 is highlighted: MAR, SAN, TKE, MON, BYU. Once you have five good waypoints you can hit the sequence button. Notice that once you sequence the route it shows up as a line on your world map. [help the dempc get the above five waypoint sequenced] Send this route Now that your waypoints are sequenced you can send this route to the AVO [have dempc hit send route button] AVO CHECKS As the AVO, your job is to fly the UAV. The first thing you need is the route from the Dempc. You can ask for this by hitting the request flight plan button or by verbally asking the DEMPC. Once the Dempc sends you the route it will show up on the moving map. Notice that the first waypoint on the map is MAR. You need to enter this point in the box labeled To Waypoint. [ask if AVO remembers how to cue a waypoint and put it into the To waypoint box. If not show them how]. Adjust course so that you are heading to the "To Waypoint," MAR. Keep adjusting course throughout checks to minimize deviation. Cooke et al. 193 Team Coordination
208 Once you have a waypoint in the to box, the to goal box will give you information on the bearing you need to set, the time and distance to the target, and your course deviation. You want to keep the deviation as low as possible. [ask the AVO if they remember how to adjust the course and if not show them] Change the queued waypoint to SAN. It is a good idea to have the queued waypoint ready to go. The next waypoint on your moving map is SAN. [ask the AVO if they remember how to que the waypoint and if not show them] Adjust airspeed between 100 & 200 Most of your waypoints will have restrictions on airspeed and altitude. You may need to get this information from the DEMPC. [have AVO ask dempc for restrictions and make sure the write them down. Ask if they remember how to adjust airspeed and if not show them.] Adjust altitude between 500 & 1000 [ask the AVO if they remember how adjust altitude and if not show them] Raise & lower flaps and landing gear You may need to adjust your flaps and landing gear. Your landing gear and flaps should be UP when your flying ABOVE 4000 ft. or you will slow the UAV. Gear and flaps should be DOWN when you re BELOW 1000 ft. [have the AVO practice raising and lowering the flaps and landing gear] Make SAN the new "To Waypoint" Once you are within the effective radius of MAR you can change the to waypoint to SAN. [ask AVO to change to waypoint ] Adjust course to head toward SAN. Keep adjusting course throughout checks to minimize deviation. Make sure AVO knows where to find Refuel button on the left side of the workstation. You need to keep an eye on your fuel. [ask AVO if they remember how to refuel and if not show them] The effective radius for SAN is 5. What does this mean? [make sure the AVO can tell you about the effective radius and if they don t understand then explain] Keep adjusting course to head toward SAN maintaining current airspeed and altitude. This is necessary for the PLO checks. Cooke et al. 194 Team Coordination
209 PLO CHECKS As the PLO, your job is to take pictures of targets. You may need to get information on upcoming targets from your team members. The upcoming waypoint SAN is a target. The effective radius is 5 miles. Find the photo requirements for this target. You need to scroll through the alphabetical target list until you find the waypoint. Called in targets are not listed but you can hit the current button and this will give you settings for the waypoint in the to waypoint box. [make sure the PLO knows how to get the required settings and if not show them.] Set the camera settings. The camera settings need to be accurate in order for the picture to be good. They type of camera you need is given in your required settings. The shutter speed and focus are based on the UAVs current airspeed and altitude settings. You will need to confirm these with the AVO. [have them refer to the cheat sheets to set properly]. The apperature is based on the light meter found on your second screen. The zoom is given in the required settings. Remember zoom x1 requires an altitude of 3000 ft or less and zoom x10 requires an altitude of 3000 feet or more. You may need to work with the AVO to get the altitude you need to take the picture. [make sure the PLO double checks to make sure all settings correct] The effective radius for SAN is 5. What does this mean? [makes sure PLO tells you that they need to be in effective radius to take picture] Take a picture. If it is good press accept. If it s not keep adjusting settings until it is. Once you are in the effective radius you can take a picture. You can check the quality of your picture against other pictures in the book at you station. Once you take a good picture remember to hit the accept button otherwise you will not get credit for the picture. [have PLO keep taking picture until it is good] Make sure PLO knows where to find Battery, Temperature, Lens and Film buttons on the left hand side of the workstation. If you have a warning the take picture button will turn red and you will not be able to take a photo. Also, remember that the UAV must be steady to take a picture. If the AVO is changing course, airspeed or altitude your take picture button will be red. Cooke et al. 195 Team Coordination
210 Appendix K Session 2 Skills Refresher Instructions 1. Gather participants in lobby and tell them: Each of you will be coming back to your station one at a time where we will make sure you recall how to perform your task. We have a list of items we need to make sure you are refreshed on before we start. You are welcome to ask questions but there may be some questions we can t answer. This should only take 5-10 minutes for each of you. Please hang out here until I call you back. 2. Start the training mission 3. One at a time, bring each team member into the participant room and sit them at their station in the order that they arrived. The other team members should be out in the lobby and the door by the restrooms should be shut. 4. Complete the skills refresher. Ask each question and give the participant some time to respond before telling them the answer. Do not refresh on how to coordinate with other team members. So, there may be some questions you can t answer. 5. When all team members have refreshed their skills, remind them of the following: Finishing the mission early they must call it in to Exp. Unexpected events may occur during the course of a mission: Do your best and consult your team. A Note about Scoring the Skills Refresher Put a check mark in the box indicating whether the participant needed no help, minor help, or major help on each item. In determining which to select, here are some guidelines: o No help required = Participants answers don t have to match our answers on the checklist perfectly. If they had the general idea and you just reiterate what it appears they already know. o Minor help/reminder required = The participant can t come up with an answer on his/her own and it just takes a little hint/reminder from the experimenter and then they remember the answer. o Much help/explanation required = The item had to be explained quite a bit or they were confused about it or gave a completely wrong answer to the question. Session 2 Skills Refresher Cooke et al. 196 Team Coordination
211 Administer the skills refresher to each participant individually in front of their console (with training mission running) while the other two participants wait in the waiting room. Check one of the three boxes to the right to indicate how much refreshing was required on each skill. AVO SKILL Q: What is your job? A: To fly the UAV Q: How do you communicate with other people? A: Press and hold green buttons Q: Where can you find the route you should follow on your screen? A: On the moving map on 2 nd screen (they can just point to it) Q: How do you go to a waypoint? A: Find the waypoint in the list, queue it, and hit New To Q: What does it mean to have a waypoint in the queued box? A: It is the waypoint you plan to visit next Q: Once you hit New To, what do you do? A: Adjust bearing (to match course) Q: How is effective radius relevant to you? A: It s where airspeed and altitude restrictions are in effect and where the UAV has to reach in order to visit or be at a waypoint Q: Does course deviation have to be zero? A: No, but it s best to try to keep it at zero Q: How do you adjust airspeed and altitude? A: Click the plus or minus signs and hit enter Q: How do you know whether gear and flaps should be up/down? A: Look at cheat sheet Q: How do you re-fuel? A: Press red button No Help Required Minor Help/Reminder Required Much Help/Explanation Required Cooke et al. 197 Team Coordination
212 Q: What should you do about the messages on your left display? A: Pay attention to them. They are messages from other UAVs or Intelligence TO YOU. Some may be important to your mission and may require you to take action. PLO SKILL Q: What is your job? A: To take photos of targets Q: How do you communicate with other people? A: Press and hold green buttons Q: How do you know where the UAV is going? A: Look at the right-most display in To box Q: How do you know if a WP is a target? A: Hit current. If req. setting present, then it is a target Q: If a target you have not reached yet does not appear to have required settings, what should you do? A: Wait until the UAV is going to the target and then hit current Q: How do you know if a picture is good or bad? A: Look in photo album to compare Q: What does alt. need to be for zoom x1 and x10? A: Below or above 3000 ft. respectively Q: How do you set camera settings? A: Match camera and focus w/ what required settings indicate. Set focus according to altitude and shutter speed to speed using cheat sheet. No Help Required Q: What do you do when you see an alarm? A: Press appropriate button on left Q: What should you do about the messages on your left display? Cooke et al. 198 Team Coordination Minor Help/Reminder Required Much Help/Explanation Required
213 A: Pay attention to them. They are messages from other UAVs or Intelligence TO YOU. Some may be important to your mission and may require you to take action. DEMPC SKILL Q: What is your job? A: To plan the route (coordinate and oversee the mission) Q: How do you communicate with other people? A: Press and hold green buttons Q: What are these things in the list names of? A: WP names that correspond to points on the world map Q: What types of WPs do you need to keep in your route? A: ROZ entries, exits, priority targets and targets Q: What are ROZ entries and exits? A: You must go through an entry first, then photo targets, then exit Q: What types of WPs should you remove from the route? A: Hazards, unnecessary WPs Q: How many good WPs should you get in a row before you hit sequence? A: 5 Each time you sequence, the first WP in the route list is deleted Q: Where do you look on your screens to confirm what WP your cursor is on? A: At the label in the info window Q: What should you do about priority targets? A: They should be visited first in that ROZ area Q: How do you send a route? A: Hit send after sequencing five good waypoints No Help Required Minor Help/Reminder Required Much Help/Explanation Required Cooke et al. 199 Team Coordination
214 Q: What should you do about the messages on your left display? A: Pay attention to them. They are messages from other UAVs or Intelligence TO YOU. Some may be important to your mission and may require you to take action. Cooke et al. 200 Team Coordination


215 Appendix L CAST Roadblocks used in Experiment 2 Cooke et al. 201 Team Coordination

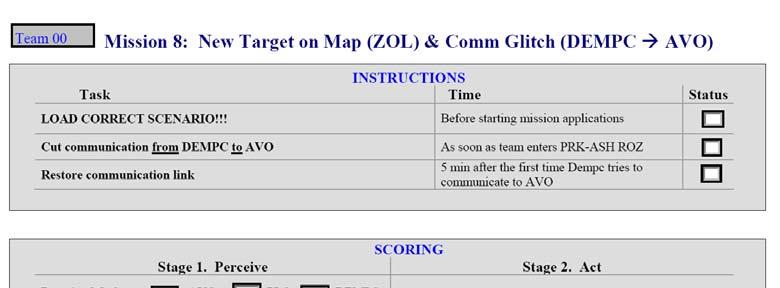
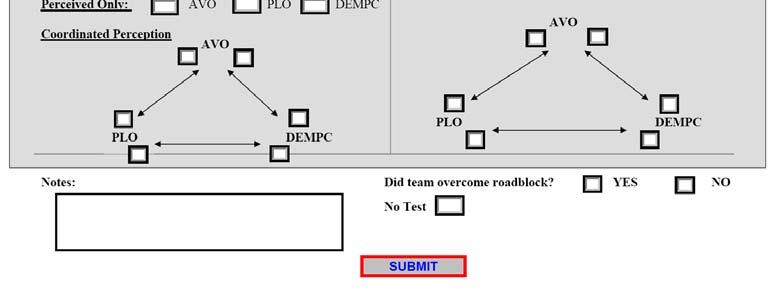
216 Cooke et al. 202 Team Coordination

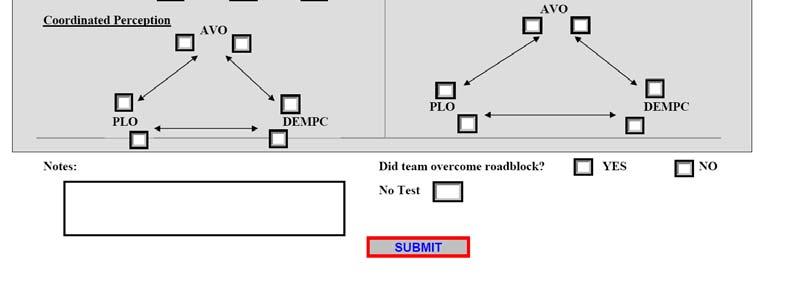
217 Cooke et al. 203 Team Coordination
218 Appendix M Experiment 2 Condition-Specific Scripted Activities CROSS-TRAINED HANDS ON TRAINING After team obtains 1 or 2 acceptable photos during hands-on training and with training mission still running: 1. Have DEMPC step out of room 2. Have AVO and PLO stand in front of DEMPC console 3. Follow the Basic Skills checklist and read the beginning of the DEMPC CHECKS 4. Follow each step on basic skills checklist and have AVO and PLO take turns physically completing the steps (see CROSS-TRAINED BASIC SKILLS CHECKLIST) 5. Complete as much of the checklist as possible in 5 MINUTES 6. Repeat with AVO console (AVO leave room, DEMPC and PLO stand in front of console). 7. Repeat with PLO console (PLO leave room, AVO and DEMPC stand in front of console). REMINDER: Have stopwatch ready and make sure to take no more than 5 minutes for each console. CROSS-TRAINED BASIC SKILLS CHECKLIST Use this skills checklist when doing the cross-training portion of the hands-on training for the cross-trained group. Follow each step and read bold text in quotes. Have the team take turns (as indicated) completing each task and help the team out as much as possible (i.e., tell them how to do the tasks). DEMPC CHECKS ask team to study screen as you read this The Dempc s job is to plan the UAV flight route. Every waypoint on this list corresponds to a point on the world map. The Dempc needs to look through Cooke et al. 204 Team Coordination
219 this list and identify all the necessary waypoints for your mission, such as ROZ entry/exits and targets. They also need to remove possible hazards and unnecessary waypoints. He/She tries to get five waypoints in a row that they plan to attend so they can sequence them and send the route to the AVO. AVO Insert waypoint MAR into the flight plan so it is the first point in the list MAR is a ROZ entry. MAR may be found further down in your initial route list so you could delete the points in the list until you get to MAR or you could just insert it again after the first slot (which is currently blank). You must go through a ROZ entry before you take pictures of any targets within a ROZ box so you need to add this waypoint. PLO Identify the restrictions and effective radius of SAN Part of the job is to communicate all necessary information about waypoints to the team such as airspeed or altitude restrictions and the effective radius. AVO Sequence the plan until the following subset of 5 is highlighted: MAR, SAN, TKE, MON, BYU instruct team how to do this. Once you have five good waypoints in a row you can hit the sequence button. Get the following waypoints in a row: MAR, SAN, TKE, MON, and BYU. Sequence the plan until those 5 waypoints show up in the box to the right of the sequence button. Be sure to have 5 good waypoints planned in a row (after the first slot) before hitting the sequence button, as each press of the sequence button will delete the waypoint listed in the first slot of your route list. Notice that once you sequence the route it shows up as a line on your world map." PLO Send this route Now that your waypoints are sequenced you can send this route to the AVO by hitting the send route button. Update AVO s map as needed, ensuring that the map always displays the current waypoint. That is, do not update AVO s map too soon, removing a waypoint that AVO is supposed to go but had not yet reached. AVO CHECKS ask team to study screen as you read this Cooke et al. 205 Team Coordination
220 The AVO s job is to fly the UAV. The first thing they need is the route from the DEMPC. He/she can ask for this by hitting the request flight plan button or by verbally asking the DEMPC. Once the DEMPC sends the route it will show up on the moving map. It can take DEMPC a few minutes at the start of a mission to plan the route and get this information. Notice that the first waypoint on the map is MAR. You need to enter this point in the box labeled To Waypoint. DEMPC Adjust course and head to the "To Waypoint," MAR. Keep adjusting course throughout to minimize deviation. Once you have a waypoint in the to box, the to goal box will give you information on the bearing you need to set, the time and distance to the target, and your course deviation. You want to keep the deviation as low as possible but it does not have to be zero in order for the PLO to take a good picture. Adjust course and head to MAR. Keep adjusting course to minimize deviation. PLO Change the queued waypoint to SAN It is a good idea to have the queued waypoint ready to go. The next waypoint on your moving map is SAN. DEMPC Adjust airspeed between 50 & 200 Most of your waypoints will have restrictions on airspeed and altitude. You may need to get this information from the DEMPC. Ask the DEMPC for the restrictions of the next few upcoming targets. You will want to write down information the DEMPC gives you. Do you remember how to adjust airspeed? PLO Adjust altitude between 500 & 1000 "Now adjust your altitude." DEMPC Make SAN the new "To Waypoint" Cooke et al. 206 Team Coordination
221 Because MAR is NOT a target, you can change the to waypoint to SAN once you are in effective radius of MAR. However, when flying to targets, you should not move on to the next waypoint until the PLO has clarified that a good picture has been taken. PLO Adjust course to head toward SAN. "Once you change the 'To Waypoint' to SAN you should first adjust the course and keep adjusting it to minimize deviation." DEMPC Make sure AVO knows where to find Refuel button on the left side of the workstation. The AVO needs to keep an eye on the fuel. PLO CHECKS ask team to study screen as you read this The PLO s job is to take pictures of targets. He/she can look at the to waypoint box on your second screen to find out where the UAV is heading. To find out if the waypoint is a target you can ask one of your teammates or scroll through the alphabetical target list under required settings until you find the waypoint or hit the current button under required settings. The current button will bring up any required settings for the waypoint in the to waypoint box. The PLO will only have required settings for waypoints that are targets. AVO Identify photo requirements. "The upcoming waypoint SAN is a target. Find the required settings for this target." DEMPC Set the camera settings. TELL DEMPC EXACTLY WHAT TO DO The camera settings need to be accurate in order for the picture to be good. The type of camera you need is given in your required settings. The shutter speed and focus are based on the UAVs current airspeed and altitude settings. Cooke et al. 207 Team Coordination
222 These need to be confirmed with the AVO. Refer to the cheat sheets to set the shutter speed and focus properly. The aperture is based on the light meter found on your second screen. Set the aperture to the same color as the light meter. This refers to the time of day. The zoom is given in the required settings. Remember zoom x1 requires an altitude of 3000 ft or less and zoom x10 requires an altitude of 3000 feet or more. You may need to work with the AVO to get the altitude you need to take the picture. AVO/DEMPC The effective radius for SAN is 5. The effective radius for SAN is 5. What does this mean? Remember, the UAV must be steady to take a picture. If the AVO is changing course, airspeed or altitude your take picture button will be red. AVO Take a picture. Once you are in the effective radius you can take a picture. You can check the quality of your picture against other pictures in the book at you station. Once you take a good picture remember to hit the accept button to remind yourself that you took a good picture. Be sure to tell your teammates when a good picture has been taken so they can move on to the next waypoint. DEMPC/AVO Make sure they know where to find Battery, Temperature, Lens and Film buttons on the left hand side of the workstation. If there is a warning, the take picture button will turn red and the PLO will not be able to take a photo. The Battery, Temperature, Lens, and Film buttons are on the left hand side of your workstation. These can be used to replenish resources when a warning or alarm goes off. After each mission (1-4): CROSS-TRAINED BETWEEN MISSIONS 1. Bring up score viewer on each participant console 2. NTE switch audio input to mikes and continue VHS recording 3. If Mission 1, then read scoring explanation (see manual) 4. Ask participants to discuss as a team: Cooke et al. 208 Team Coordination
223 a. What do you think you did right as a team? b. What do you think you can do to improve your performance in the next mission? 5. Discussion should not continue past 5 min. 6. Remind participants that they are allowed to look at their teammates screens during missions if they wish. Allow team a five minute break and set up for next mission (stop VHS recording and switch audio input back to intercom) PROCEDURAL HANDS ON TRAINING After team obtains 1 or 2 acceptable photos during hands-on training and with training mission still running (have stopwatch ready and complete in 15 minutes): 1. Attach a How to Coordinate cheat sheet to each participant console 2. Review the procedural phases. Start off by reading this: If you recall back to the last parts of the Powerpoint training you ll remember several slides instructing you on three important steps in communicating with each other. The three phases are the Information Phase, the Negotiation Phase, and the Feedback Phase. You should follow this pattern when communicating about an upcoming target as closely as possible and you will receive feedback on how well you are doing in following the pattern. Here is a hypothetical scenario: The DEMPC has spotted target SAN on his map, and plans to visit this target in order to get a photo. Tell DEMPC to place cursor over SAN The first phase is the Information Phase Ask the team what should happen and help them if necessary Answer: The DEMPC tells the AVO target name, restrictions and effective radius. DEMPC tells the PLO the target name and effective radius. The second phase is the Negotiation Phase Ask the team what should happen Cooke et al. 209 Team Coordination
224 Answer: The PLO tells the AVO whether that they need to be below of above 3000 feet. The AVO tells the PLO their airspeed and altitude before they reach the target (as far in advance as practical) The third phase is the Feedback Phase Ask the team what should happen Answer: The PLO tells both the AVO and DEMPC that a photo has been taken and that the team is free to move to the next waypoint. Try to follow this pattern as closely as possible. Try to be as clear and consistent as possible, but do not hesitate to ask your team for additional information if needed. There is another target after SAN target TKE. After SAN is photographed, the cycle repeats Tell DEMPC to place cursor over TKE (CHECK WHERE UAV IS If it is getting far from SAN, ASK NTE TO TURN UAV BACK TO SAN) Important repeat the above, but this time around, prompt the team to give you the answers. The first phase is the Information Phase Ask the team what should happen Answer: The DEMPC tells the AVO target name, restrictions and effective radius. DEMPC tells the PLO the target name and effective radius. The second phase is the Negotiation Phase Ask the team what should happen Answer: The PLO tells the AVO whether that they need to be below of above 3000 feet. The AVO tells the PLO their airspeed and altitude before they reach the target (as far in advance as practical) The third phase is the Feedback Phase Ask the team what should happen Answer: The PLO tells both the AVO and DEMPC that a photo has been taken and that the team is free to move to the next waypoint. There may be some cases were targets are very close to each other. Handle these as best you can, but remember to include the three phases for each Cooke et al. 210 Team Coordination
225 target in your communications. Let s try this one more time in the context of actually getting a photo of a target. Please put your headsets on and wait for my instructions. --Go back to the experimenter console and read this scenario: For this exercise, we re going to take another photo of SAN. Assume that we ve already passed the ROZ entry point for this target. NTE stay in participant room to assist if necessary SPEAK TO ALL TEAM MEMBERS: The first phase is the Information Phase. Prompt DEMPC to carry out this phase by reading restrictions to BOTH PLO and AVO. Be sure to give this information before you reach the target so the AVO and PLO can negotiate, but not so far in advance that you need to repeat the info. The second phase is the Negotiation Phase. Prompt the AVO and PLO to carry out this phase by having PLO share Zoom Req. and AVO sharing PLANNED airspeed and altitude. Be sure to share this information BEFORE you reach the target to allow the AVO to reach the desired speed and altitude and to allow the PLO to set the camera. The third phase is the Feedback Phase. Prompt the PLO to tell BOTH AVO and DEMPC that a successful photo was taken IMMEDIATELY AFTER it is taken and accepted. Be sure to tell the team that a photo was taken right after you accept it so that you may quickly move to the next target. During each mission (1-4): PROCEDURAL BETWEEN MISSIONS 1. TE (and NTE) monitor communications (monitor coordination logger) and note instances of where the team deviates from the procedural Model a. For example, during feedback phase, if PLO tells DEMPC that a good photo was taken, but did not tell AVO, note this. Cooke et al. 211 Team Coordination
226 2. Also keep track of instances of good coordination where the team followed the procedural model. After each mission (1-4): 1. Coordination Logger will output a coordination score based on process judgments 2. Bring up score viewer on each participant console 3. If Mission 1, then read scoring explanation (see manual) 4. Ask team if they have any questions 5. Now give team their coordination rating score which should have been indicated in the Coordination Logger 6. Read to team any instances where they deviated from the procedural model and also any instances where the team followed the procedural model well Allow the team a five minute break and set up for the next mission PERTURBED HANDS-ON TRAINING After team obtains 1 or 2 acceptable photos during hands-on training and with training mission still running, have team put headsets on and read the following to the team over the headsets: Before you start your first mission, we would like to quickly calibrate the communication system. We are picking up some intermittent static on several channels and we need your help to find them. Your task is to communicate with each other using the headsets to locate and identify the sources of the static. Use the intercom to communicate with your teammates and locate which team member is generating static and who hears it. There may be more than one of you who will experience or generate the static so try to search systematically to locate all sources. After you have found the source or sources of the static, reach a consensus, and report back to me. 1. AVO DEMPC (only DEMPC hears static when AVO communicates) --Monitor communications closely and flip AVO static switch only when DEMPC speaks to AVO 2. DEMPC PLO (only PLO hears static when DEMPC communicates) --Monitor communications closely and flip DEMPC static switch when PLO speaks to DEMPC only Cooke et al. 212 Team Coordination
227 3. PLO AVO (only AVO hears static when PLO communicates) --Monitor communications closely and flip PLO static switch only AVO speaks to PLO 4. DEMPC AVO (only AVO hears static when DEMPC communicates) --Monitor communications closely and flip DEMPC static switch when AVO speaks to DEMPC when only 5. PLO AVO & DEMPC (AVO & DEMPC hear static when PLO communicates) --Monitor communications closely and flip PLO static switch whenever AVO and/or DEMPC speaks to PLO 6. AVO & DEMPC PLO (only PLO hears static when AVO or DEMPC communicates) --Monitor communications closely and flip AVO & DEMPC static switches when PLO speaks to AVO or DEMPC only (not both at time) same 7. DEMPC AVO & PLO (AVO and PLO hear static when DEMPC communicates) --Monitor communications closely and flip DEMPC static switch whenever AVO and/or PLO speaks to DEMPC PERTURBED HANDS-ON TRAINING TIMES For each round, NTE records time it takes for team to find and report sources of static. Mark also whether team was correct or not. 1. AVO DEMPC Time: Correct? Y / N Notes: 2. DEMPC PLO Time: Correct? Y / N Notes: 3. PLO AVO Time: Correct? Y / N Notes: Cooke et al. 213 Team Coordination
228 4. DEMPC AVO Time: Correct? Y / N Notes: 5. PLO AVO & DEMPC Time: Correct? Y / N Notes: 6. AVO & DEMPC PLO Time: Correct? Y / N Notes: 7. DEMPC AVO & PLO Time: Correct? Y / N Notes: Cooke et al. 214 Team Coordination
229 Appendix N Experiment 2 Procedural Model Hardcopy Remember: Follow these steps as closely as possible during your missions Information Negotiation Feedback DEMPC AVO PLO AVO PLO PLO AVO DEMPC Cooke et al. 215 Team Coordination

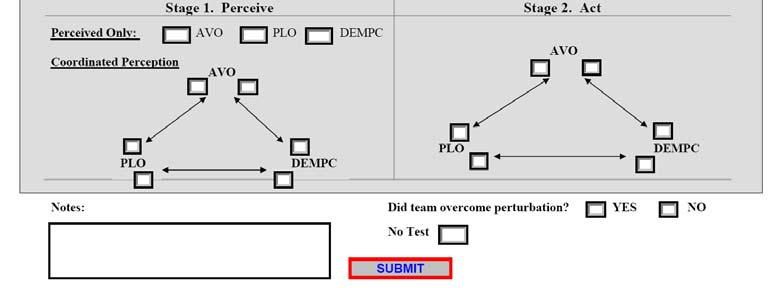
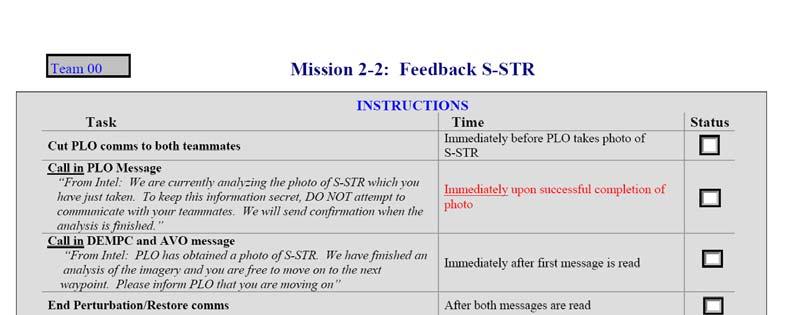
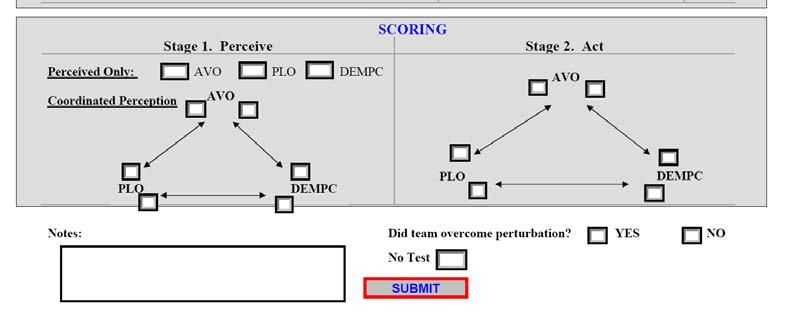
230 Appendix O Perturbations Used in Experiment 2 Cooke et al. 216 Team Coordination

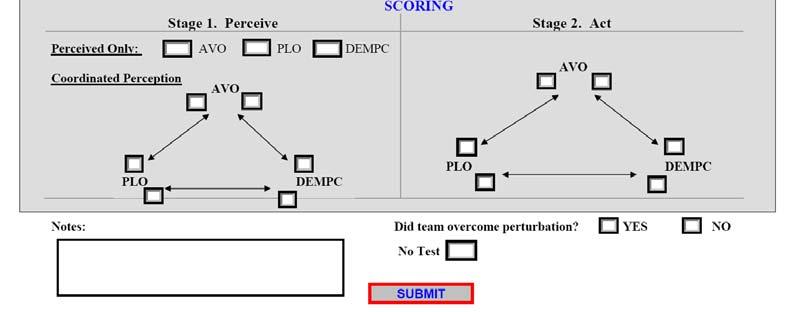
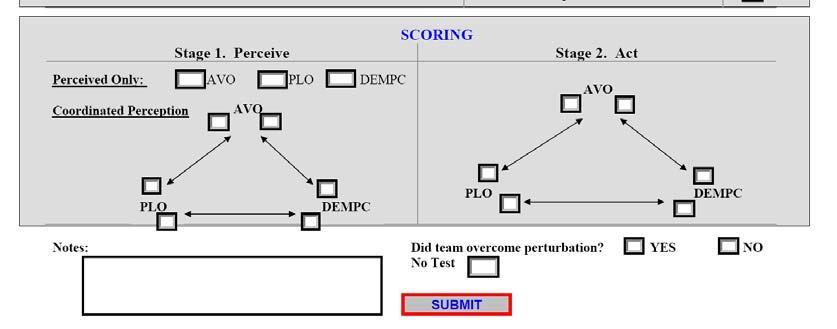
231 Cooke et al. 217 Team Coordination

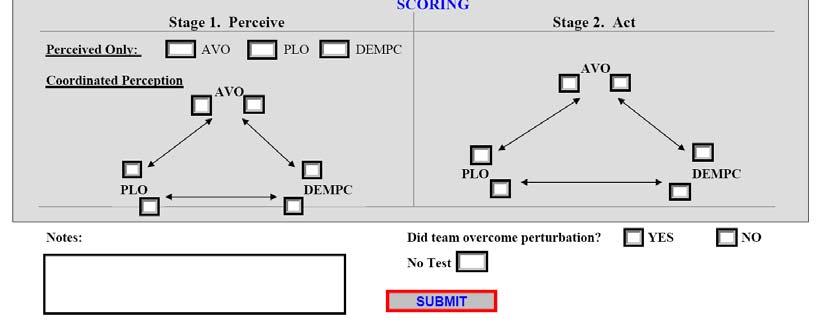
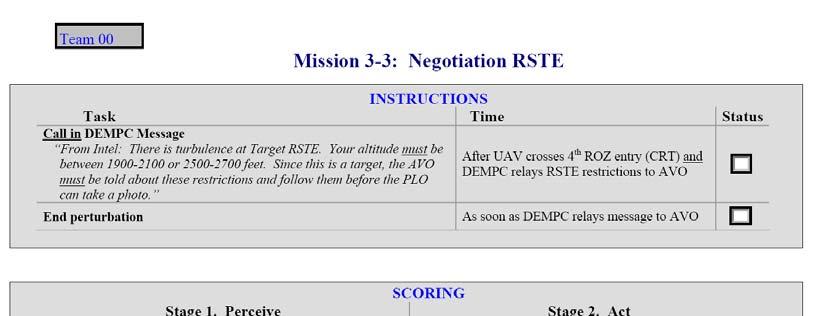
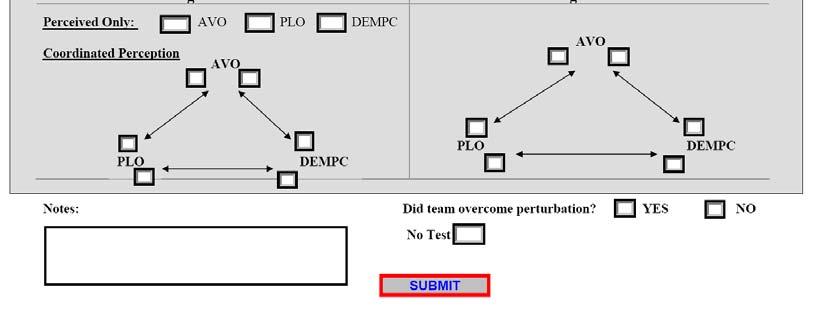
232 Cooke et al. 218 Team Coordination

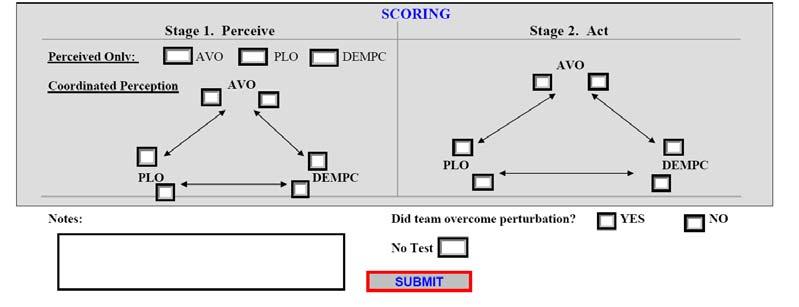
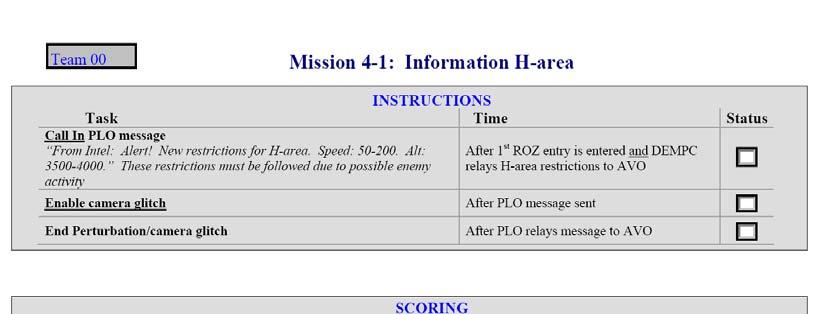
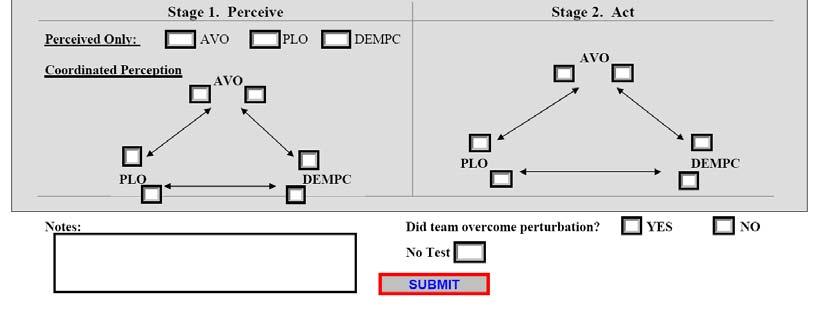
233 Cooke et al. 219 Team Coordination

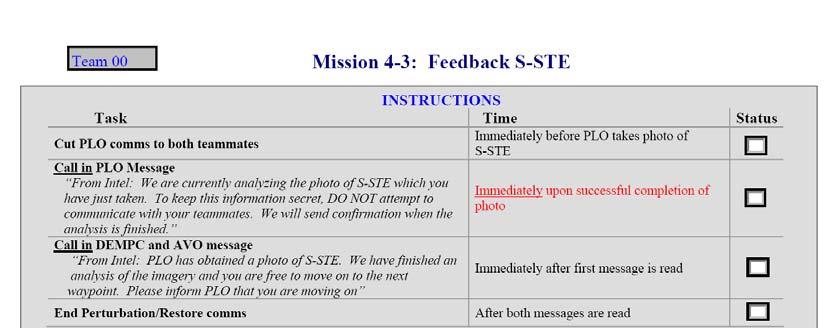
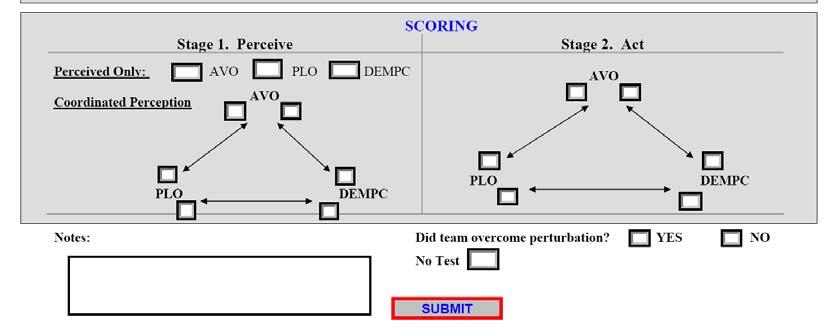
234 Cooke et al. 220 Team Coordination

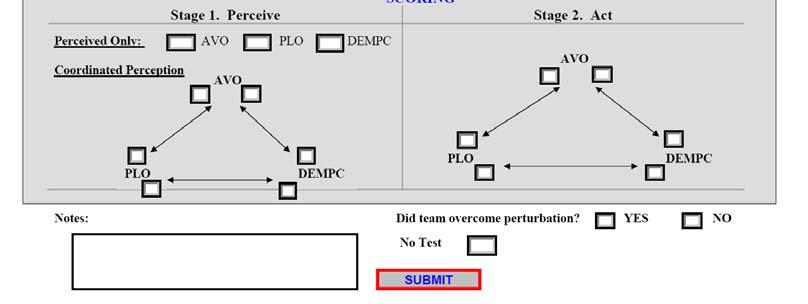
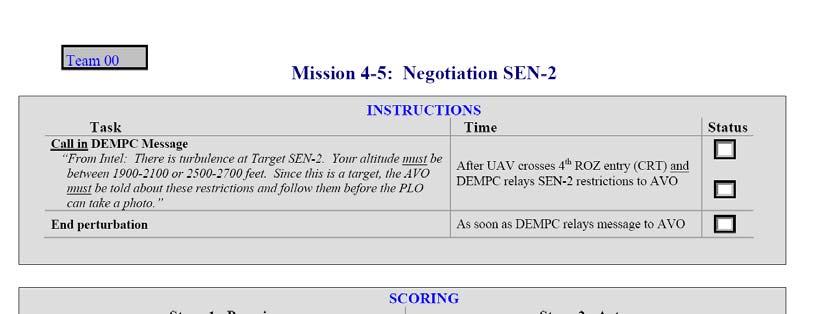
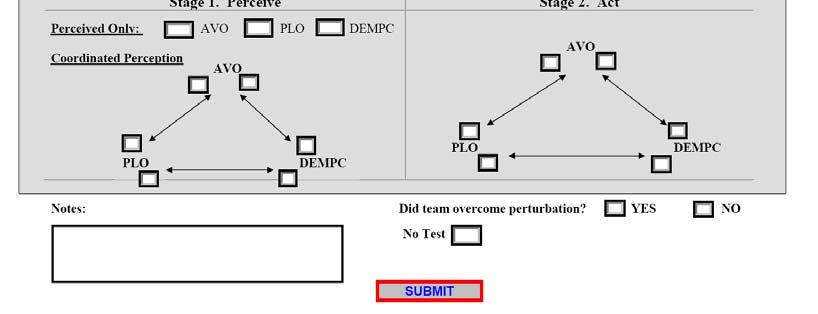
235 Cooke et al. 221 Team Coordination

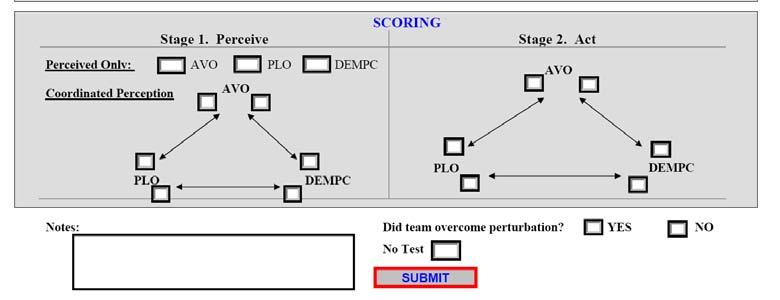
236 Cooke et al. 222 Team Coordination
Intelligent Agent Technology in Command and Control Environment
 Intelligent Agent Technology in Command and Control Environment Edward Dawidowicz 1 U.S. Army Communications-Electronics Command (CECOM) CECOM, RDEC, Myer Center Command and Control Directorate Fort Monmouth,
Module 12. Machine Learning. Version 2 CSE IIT, Kharagpur
 Module 12 Machine Learning 12.1 Instructional Objective The students should understand the concept of learning systems Students should learn about different aspects of a learning system Students should
AD (Leave blank) PREPARED FOR: U.S. Army Medical Research and Materiel Command Fort Detrick, Maryland
 PREPARED FOR: U.S. Army Medical Research and Materiel Command Fort Detrick, Maryland") AD (Leave blank) Award Number: W81XWH-09-1-0282 TITLE: Georgetown University and Hampton University Prostate Cancer Undergraduate Fellowship Program PRINCIPAL INVESTIGATOR: Anna Riegel, PhD CONTRACTING
AD (Leave blank) Award Number: W81XWH-09-1-0282 TITLE: Georgetown University and Hampton University Prostate Cancer Undergraduate Fellowship Program PRINCIPAL INVESTIGATOR: Anna Riegel, PhD CONTRACTING
ECE-492 SENIOR ADVANCED DESIGN PROJECT
 ECE-492 SENIOR ADVANCED DESIGN PROJECT Meeting #3 1 ECE-492 Meeting#3 Q1: Who is not on a team? Q2: Which students/teams still did not select a topic? 2 ENGINEERING DESIGN You have studied a great deal
NCEO Technical Report 27
 Home About Publications Special Topics Presentations State Policies Accommodations Bibliography Teleconferences Tools Related Sites Interpreting Trends in the Performance of Special Education Students
Major Milestones, Team Activities, and Individual Deliverables
 Major Milestones, Team Activities, and Individual Deliverables Milestone #1: Team Semester Proposal Your team should write a proposal that describes project objectives, existing relevant technology, engineering
Seminar - Organic Computing
 Seminar - Organic Computing Self-Organisation of OC-Systems Markus Franke 25.01.2006 Typeset by FoilTEX Timetable 1. Overview 2. Characteristics of SO-Systems 3. Concern with Nature 4. Design-Concepts
PROFESSIONAL TREATMENT OF TEACHERS AND STUDENT ACADEMIC ACHIEVEMENT. James B. Chapman. Dissertation submitted to the Faculty of the Virginia
 PROFESSIONAL TREATMENT OF TEACHERS AND STUDENT ACADEMIC ACHIEVEMENT by James B. Chapman Dissertation submitted to the Faculty of the Virginia Polytechnic Institute and State University in partial fulfillment
AGENDA LEARNING THEORIES LEARNING THEORIES. Advanced Learning Theories 2/22/2016
 AGENDA Advanced Learning Theories Alejandra J. Magana, Ph.D. admagana@purdue.edu Introduction to Learning Theories Role of Learning Theories and Frameworks Learning Design Research Design Dual Coding Theory
Lecture 1: Machine Learning Basics
 1/69 Lecture 1: Machine Learning Basics Ali Harakeh University of Waterloo WAVE Lab ali.harakeh@uwaterloo.ca May 1, 2017 2/69 Overview 1 Learning Algorithms 2 Capacity, Overfitting, and Underfitting 3
Application of Cognitive Load Theory to Developing a Measure of. Team Decision Efficiency. Joan H. Johnston
 Johnston, J., Fiore, S.M., Paris, C., & Smith, C. A. P. (in press). Application of Cognitive Load Theory to Developing a Measure of Team Decision Efficiency. Military Psychology. Application of Cognitive
Application of Virtual Instruments (VIs) for an enhanced learning environment
 for an enhanced learning environment") Application of Virtual Instruments (VIs) for an enhanced learning environment Philip Smyth, Dermot Brabazon, Eilish McLoughlin Schools of Mechanical and Physical Sciences Dublin City University Ireland
Application of Virtual Instruments (VIs) for an enhanced learning environment Philip Smyth, Dermot Brabazon, Eilish McLoughlin Schools of Mechanical and Physical Sciences Dublin City University Ireland
Probability and Statistics Curriculum Pacing Guide
 Unit 1 Terms PS.SPMJ.3 PS.SPMJ.5 Plan and conduct a survey to answer a statistical question. Recognize how the plan addresses sampling technique, randomization, measurement of experimental error and methods
A Game-based Assessment of Children s Choices to Seek Feedback and to Revise
 A Game-based Assessment of Children s Choices to Seek Feedback and to Revise Maria Cutumisu, Kristen P. Blair, Daniel L. Schwartz, Doris B. Chin Stanford Graduate School of Education Please address all
Designing a Rubric to Assess the Modelling Phase of Student Design Projects in Upper Year Engineering Courses
 Designing a Rubric to Assess the Modelling Phase of Student Design Projects in Upper Year Engineering Courses Thomas F.C. Woodhall Masters Candidate in Civil Engineering Queen s University at Kingston,
On-Line Data Analytics
 International Journal of Computer Applications in Engineering Sciences [VOL I, ISSUE III, SEPTEMBER 2011] [ISSN: 2231-4946] On-Line Data Analytics Yugandhar Vemulapalli #, Devarapalli Raghu *, Raja Jacob
The effects of a scientifically-based team resource management intervention for fire service teams
 196 Int. J. Human Factors and Ergonomics, Vol. 2, Nos. 2/3, 2013 The effects of a scientifically-based team resource management intervention for fire service teams Vera Hagemann* Department for Computer
Longitudinal Analysis of the Effectiveness of DCPS Teachers
 F I N A L R E P O R T Longitudinal Analysis of the Effectiveness of DCPS Teachers July 8, 2014 Elias Walsh Dallas Dotter Submitted to: DC Education Consortium for Research and Evaluation School of Education
BENCHMARK TREND COMPARISON REPORT:
 National Survey of Student Engagement (NSSE) BENCHMARK TREND COMPARISON REPORT: CARNEGIE PEER INSTITUTIONS, 2003-2011 PREPARED BY: ANGEL A. SANCHEZ, DIRECTOR KELLI PAYNE, ADMINISTRATIVE ANALYST/ SPECIALIST
On Human Computer Interaction, HCI. Dr. Saif al Zahir Electrical and Computer Engineering Department UBC
 On Human Computer Interaction, HCI Dr. Saif al Zahir Electrical and Computer Engineering Department UBC Human Computer Interaction HCI HCI is the study of people, computer technology, and the ways these
STABILISATION AND PROCESS IMPROVEMENT IN NAB
 STABILISATION AND PROCESS IMPROVEMENT IN NAB Authors: Nicole Warren Quality & Process Change Manager, Bachelor of Engineering (Hons) and Science Peter Atanasovski - Quality & Process Change Manager, Bachelor
CHAPTER V: CONCLUSIONS, CONTRIBUTIONS, AND FUTURE RESEARCH
 CHAPTER V: CONCLUSIONS, CONTRIBUTIONS, AND FUTURE RESEARCH Employees resistance can be a significant deterrent to effective organizational change and it s important to consider the individual when bringing
Oklahoma State University Policy and Procedures
 Oklahoma State University Policy and Procedures GUIDELINES TO GOVERN WORKLOAD ASSIGNMENTS OF FACULTY MEMBERS 2-0110 ACADEMIC AFFAIRS August 2014 INTRODUCTION 1.01 Oklahoma State University, as a comprehensive
STA 225: Introductory Statistics (CT)
") Marshall University College of Science Mathematics Department STA 225: Introductory Statistics (CT) Course catalog description A critical thinking course in applied statistical reasoning covering basic
Marshall University College of Science Mathematics Department STA 225: Introductory Statistics (CT) Course catalog description A critical thinking course in applied statistical reasoning covering basic
UK Institutional Research Brief: Results of the 2012 National Survey of Student Engagement: A Comparison with Carnegie Peer Institutions
 UK Institutional Research Brief: Results of the 2012 National Survey of Student Engagement: A Comparison with Carnegie Peer Institutions November 2012 The National Survey of Student Engagement (NSSE) has
On the Combined Behavior of Autonomous Resource Management Agents
 On the Combined Behavior of Autonomous Resource Management Agents Siri Fagernes 1 and Alva L. Couch 2 1 Faculty of Engineering Oslo University College Oslo, Norway siri.fagernes@iu.hio.no 2 Computer Science
CS Machine Learning
 CS 478 - Machine Learning Projects Data Representation Basic testing and evaluation schemes CS 478 Data and Testing 1 Programming Issues l Program in any platform you want l Realize that you will be doing
Software Maintenance
 1 What is Software Maintenance? Software Maintenance is a very broad activity that includes error corrections, enhancements of capabilities, deletion of obsolete capabilities, and optimization. 2 Categories
The IDN Variant Issues Project: A Study of Issues Related to the Delegation of IDN Variant TLDs. 20 April 2011
 The IDN Variant Issues Project: A Study of Issues Related to the Delegation of IDN Variant TLDs 20 April 2011 Project Proposal updated based on comments received during the Public Comment period held from
learning collegiate assessment]
![learning collegiate assessment]](/thumbs/71/66063392.jpg "learning collegiate assessment]") [ collegiate learning assessment] INSTITUTIONAL REPORT 2005 2006 Kalamazoo College council for aid to education 215 lexington avenue floor 21 new york new york 10016-6023 p 212.217.0700 f 212.661.9766
[ collegiate learning assessment] INSTITUTIONAL REPORT 2005 2006 Kalamazoo College council for aid to education 215 lexington avenue floor 21 new york new york 10016-6023 p 212.217.0700 f 212.661.9766
Maximizing Learning Through Course Alignment and Experience with Different Types of Knowledge
 Innov High Educ (2009) 34:93 103 DOI 10.1007/s10755-009-9095-2 Maximizing Learning Through Course Alignment and Experience with Different Types of Knowledge Phyllis Blumberg Published online: 3 February
TIMSS ADVANCED 2015 USER GUIDE FOR THE INTERNATIONAL DATABASE. Pierre Foy
 TIMSS ADVANCED 2015 USER GUIDE FOR THE INTERNATIONAL DATABASE Pierre Foy TIMSS Advanced 2015 orks User Guide for the International Database Pierre Foy Contributors: Victoria A.S. Centurino, Kerry E. Cotter,
ME 443/643 Design Techniques in Mechanical Engineering. Lecture 1: Introduction
 ME 443/643 Design Techniques in Mechanical Engineering Lecture 1: Introduction Instructor: Dr. Jagadeep Thota Instructor Introduction Born in Bangalore, India. B.S. in ME @ Bangalore University, India.
On-the-Fly Customization of Automated Essay Scoring
 Research Report On-the-Fly Customization of Automated Essay Scoring Yigal Attali Research & Development December 2007 RR-07-42 On-the-Fly Customization of Automated Essay Scoring Yigal Attali ETS, Princeton,
The Good Judgment Project: A large scale test of different methods of combining expert predictions
 The Good Judgment Project: A large scale test of different methods of combining expert predictions Lyle Ungar, Barb Mellors, Jon Baron, Phil Tetlock, Jaime Ramos, Sam Swift The University of Pennsylvania
THE DEPARTMENT OF DEFENSE HIGH LEVEL ARCHITECTURE. Richard M. Fujimoto
 THE DEPARTMENT OF DEFENSE HIGH LEVEL ARCHITECTURE Judith S. Dahmann Defense Modeling and Simulation Office 1901 North Beauregard Street Alexandria, VA 22311, U.S.A. Richard M. Fujimoto College of Computing
Activities, Exercises, Assignments Copyright 2009 Cem Kaner 1
 Patterns of activities, iti exercises and assignments Workshop on Teaching Software Testing January 31, 2009 Cem Kaner, J.D., Ph.D. kaner@kaner.com Professor of Software Engineering Florida Institute of
Commanding Officer Decision Superiority: The Role of Technology and the Decision Maker
 Commanding Officer Decision Superiority: The Role of Technology and the Decision Maker Presenter: Dr. Stephanie Hszieh Authors: Lieutenant Commander Kate Shobe & Dr. Wally Wulfeck 14 th International Command
Beyond the Blend: Optimizing the Use of your Learning Technologies. Bryan Chapman, Chapman Alliance
 901 Beyond the Blend: Optimizing the Use of your Learning Technologies Bryan Chapman, Chapman Alliance Power Blend Beyond the Blend: Optimizing the Use of Your Learning Infrastructure Facilitator: Bryan
Standards and Criteria for Demonstrating Excellence in BACCALAUREATE/GRADUATE DEGREE PROGRAMS
 Standards and Criteria for Demonstrating Excellence in BACCALAUREATE/GRADUATE DEGREE PROGRAMS World Headquarters 11520 West 119th Street Overland Park, KS 66213 USA USA Belgium Perú acbsp.org info@acbsp.org
Statistical Analysis of Climate Change, Renewable Energies, and Sustainability An Independent Investigation for Introduction to Statistics
 5/22/2012 Statistical Analysis of Climate Change, Renewable Energies, and Sustainability An Independent Investigation for Introduction to Statistics College of Menominee Nation & University of Wisconsin
An Introduction to Simio for Beginners
 An Introduction to Simio for Beginners C. Dennis Pegden, Ph.D. This white paper is intended to introduce Simio to a user new to simulation. It is intended for the manufacturing engineer, hospital quality
CyberCIEGE: An Extensible Tool for Information Assurance Education
 CyberCIEGE: An Extensible Tool for Information Assurance Education Cynthia E. Irvine, Senior Member, IEEE, Michael F. Thompson, and Ken Allen Abstract The purpose of CyberCIEGE is to create an extensible
Introduction to Modeling and Simulation. Conceptual Modeling. OSMAN BALCI Professor
 Introduction to Modeling and Simulation Conceptual Modeling OSMAN BALCI Professor Department of Computer Science Virginia Polytechnic Institute and State University (Virginia Tech) Blacksburg, VA 24061,
An Empirical Analysis of the Effects of Mexican American Studies Participation on Student Achievement within Tucson Unified School District
 An Empirical Analysis of the Effects of Mexican American Studies Participation on Student Achievement within Tucson Unified School District Report Submitted June 20, 2012, to Willis D. Hawley, Ph.D., Special
Promotion and Tenure Guidelines. School of Social Work
 Promotion and Tenure Guidelines School of Social Work Spring 2015 Approved 10.19.15 Table of Contents 1.0 Introduction..3 1.1 Professional Model of the School of Social Work...3 2.0 Guiding Principles....3
Virtual Teams: The Design of Architecture and Coordination for Realistic Performance and Shared Awareness
 Virtual Teams: The Design of Architecture and Coordination for Realistic Performance and Shared Awareness Bryan Moser, Global Project Design John Halpin, Champlain College St. Lawrence Introduction Global
SEDETEP Transformation of the Spanish Operation Research Simulation Working Environment
 SEDETEP Transformation of the Spanish Operation Research Simulation Working Environment Cdr. Nelson Ameyugo Catalán (ESP-NAVY) Spanish Navy Operations Research Laboratory (Gimo) Arturo Soria 287 28033
DIGITAL GAMING & INTERACTIVE MEDIA BACHELOR S DEGREE. Junior Year. Summer (Bridge Quarter) Fall Winter Spring GAME Credits.
 Fall Winter Spring GAME Credits.") DIGITAL GAMING & INTERACTIVE MEDIA BACHELOR S DEGREE Sample 2-Year Academic Plan DRAFT Junior Year Summer (Bridge Quarter) Fall Winter Spring MMDP/GAME 124 GAME 310 GAME 318 GAME 330 Introduction to Maya
DIGITAL GAMING & INTERACTIVE MEDIA BACHELOR S DEGREE Sample 2-Year Academic Plan DRAFT Junior Year Summer (Bridge Quarter) Fall Winter Spring MMDP/GAME 124 GAME 310 GAME 318 GAME 330 Introduction to Maya
USC VITERBI SCHOOL OF ENGINEERING
 USC VITERBI SCHOOL OF ENGINEERING APPOINTMENTS, PROMOTIONS AND TENURE (APT) GUIDELINES Office of the Dean USC Viterbi School of Engineering OHE 200- MC 1450 Revised 2016 PREFACE This document serves as
THE PENNSYLVANIA STATE UNIVERSITY SCHREYER HONORS COLLEGE DEPARTMENT OF MATHEMATICS ASSESSING THE EFFECTIVENESS OF MULTIPLE CHOICE MATH TESTS
 THE PENNSYLVANIA STATE UNIVERSITY SCHREYER HONORS COLLEGE DEPARTMENT OF MATHEMATICS ASSESSING THE EFFECTIVENESS OF MULTIPLE CHOICE MATH TESTS ELIZABETH ANNE SOMERS Spring 2011 A thesis submitted in partial
Development and Evaluation of a Virtual Terrain Board for Night Vision Goggle Training
 AFRL-RH-AZ-TR-2008-0024 Development and Evaluation of a Virtual Terrain Board for Night Vision Goggle Training DeForest Q. Joralmon Jeanette M. Dunham L-3 Communications 6030 S. Kent St. Mesa AZ 85212-6061
SOFTWARE EVALUATION TOOL
 SOFTWARE EVALUATION TOOL Kyle Higgins Randall Boone University of Nevada Las Vegas rboone@unlv.nevada.edu Higgins@unlv.nevada.edu N.B. This form has not been fully validated and is still in development.
PROVIDENCE UNIVERSITY COLLEGE
 BACHELOR OF BUSINESS ADMINISTRATION (BBA) WITH CO-OP (4 Year) Academic Staff Jeremy Funk, Ph.D., University of Manitoba, Program Coordinator Bruce Duggan, M.B.A., University of Manitoba Marcio Coelho,
Scenario Design for Training Systems in Crisis Management: Training Resilience Capabilities
 Scenario Design for Training Systems in Crisis Management: Training Resilience Capabilities Amy Rankin 1, Joris Field 2, William Wong 3, Henrik Eriksson 4, Jonas Lundberg 5 Chris Rooney 6 1, 4, 5 Department
Intellectual Property
 Intellectual Property Section: Chapter: Date Updated: IV: Research and Sponsored Projects 4 December 7, 2012 Policies governing intellectual property related to or arising from employment with The University
Sector Differences in Student Learning: Differences in Achievement Gains Across School Years and During the Summer
 Catholic Education: A Journal of Inquiry and Practice Volume 7 Issue 2 Article 6 July 213 Sector Differences in Student Learning: Differences in Achievement Gains Across School Years and During the Summer
School Size and the Quality of Teaching and Learning
 School Size and the Quality of Teaching and Learning An Analysis of Relationships between School Size and Assessments of Factors Related to the Quality of Teaching and Learning in Primary Schools Undertaken
Program Change Proposal:
 Program Change Proposal: Provided to Faculty in the following affected units: Department of Management Department of Marketing School of Allied Health 1 Department of Kinesiology 2 Department of Animal
EECS 571 PRINCIPLES OF REAL-TIME COMPUTING Fall 10. Instructor: Kang G. Shin, 4605 CSE, ;
 EECS 571 PRINCIPLES OF REAL-TIME COMPUTING Fall 10 Instructor: Kang G. Shin, 4605 CSE, 763-0391; kgshin@umich.edu Number of credit hours: 4 Class meeting time and room: Regular classes: MW 10:30am noon
Using GIFT to Support an Empirical Study on the Impact of the Self-Reference Effect on Learning
 80 Using GIFT to Support an Empirical Study on the Impact of the Self-Reference Effect on Learning Anne M. Sinatra, Ph.D. Army Research Laboratory/Oak Ridge Associated Universities anne.m.sinatra.ctr@us.army.mil
MGT/MGP/MGB 261: Investment Analysis
 UNIVERSITY OF CALIFORNIA, DAVIS GRADUATE SCHOOL OF MANAGEMENT SYLLABUS for Fall 2014 MGT/MGP/MGB 261: Investment Analysis Daytime MBA: Tu 12:00p.m. - 3:00 p.m. Location: 1302 Gallagher (CRN: 51489) Sacramento
VOL. 3, NO. 5, May 2012 ISSN Journal of Emerging Trends in Computing and Information Sciences CIS Journal. All rights reserved.
 Exploratory Study on Factors that Impact / Influence Success and failure of Students in the Foundation Computer Studies Course at the National University of Samoa 1 2 Elisapeta Mauai, Edna Temese 1 Computing
Running Head: STUDENT CENTRIC INTEGRATED TECHNOLOGY
 SCIT Model 1 Running Head: STUDENT CENTRIC INTEGRATED TECHNOLOGY Instructional Design Based on Student Centric Integrated Technology Model Robert Newbury, MS December, 2008 SCIT Model 2 Abstract The ADDIE
Certified Six Sigma Professionals International Certification Courses in Six Sigma Green Belt
 Certification Singapore Institute Certified Six Sigma Professionals Certification Courses in Six Sigma Green Belt ly Licensed Course for Process Improvement/ Assurance Managers and Engineers Leading the
Integrating simulation into the engineering curriculum: a case study
 Integrating simulation into the engineering curriculum: a case study Baidurja Ray and Rajesh Bhaskaran Sibley School of Mechanical and Aerospace Engineering, Cornell University, Ithaca, New York, USA E-mail:
THE ROLE OF TOOL AND TEACHER MEDIATIONS IN THE CONSTRUCTION OF MEANINGS FOR REFLECTION
 THE ROLE OF TOOL AND TEACHER MEDIATIONS IN THE CONSTRUCTION OF MEANINGS FOR REFLECTION Lulu Healy Programa de Estudos Pós-Graduados em Educação Matemática, PUC, São Paulo ABSTRACT This article reports
Measurement & Analysis in the Real World
 Measurement & Analysis in the Real World Tools for Cleaning Messy Data Will Hayes SEI Robert Stoddard SEI Rhonda Brown SEI Software Solutions Conference 2015 November 16 18, 2015 Copyright 2015 Carnegie
A Pilot Study on Pearson s Interactive Science 2011 Program
 Final Report A Pilot Study on Pearson s Interactive Science 2011 Program Prepared by: Danielle DuBose, Research Associate Miriam Resendez, Senior Researcher Dr. Mariam Azin, President Submitted on August
Analyzing the Usage of IT in SMEs
 IBIMA Publishing Communications of the IBIMA http://www.ibimapublishing.com/journals/cibima/cibima.html Vol. 2010 (2010), Article ID 208609, 10 pages DOI: 10.5171/2010.208609 Analyzing the Usage of IT
Using SAM Central With iread
 Using SAM Central With iread January 1, 2016 For use with iread version 1.2 or later, SAM Central, and Student Achievement Manager version 2.4 or later PDF0868 (PDF) Houghton Mifflin Harcourt Publishing
Unit 3. Design Activity. Overview. Purpose. Profile
 Unit 3 Design Activity Overview Purpose The purpose of the Design Activity unit is to provide students with experience designing a communications product. Students will develop capability with the design
10.2. Behavior models
 User behavior research 10.2. Behavior models Overview Why do users seek information? How do they seek information? How do they search for information? How do they use libraries? These questions are addressed
1. Programme title and designation International Management N/A
 PROGRAMME APPROVAL FORM SECTION 1 THE PROGRAMME SPECIFICATION 1. Programme title and designation International Management 2. Final award Award Title Credit value ECTS Any special criteria equivalent MSc
TEACHING AND EXAMINATION REGULATIONS (TER) (see Article 7.13 of the Higher Education and Research Act) MASTER S PROGRAMME EMBEDDED SYSTEMS
 (see Article 7.13 of the Higher Education and Research Act) MASTER S PROGRAMME EMBEDDED SYSTEMS") TEACHING AND EXAMINATION REGULATIONS (TER) (see Article 7.13 of the Higher Education and Research Act) 2015-2016 MASTER S PROGRAMME EMBEDDED SYSTEMS UNIVERSITY OF TWENTE 1 SECTION 1 GENERAL... 3 ARTICLE
TEACHING AND EXAMINATION REGULATIONS (TER) (see Article 7.13 of the Higher Education and Research Act) 2015-2016 MASTER S PROGRAMME EMBEDDED SYSTEMS UNIVERSITY OF TWENTE 1 SECTION 1 GENERAL... 3 ARTICLE
Classroom Assessment Techniques (CATs; Angelo & Cross, 1993)
") Classroom Assessment Techniques (CATs; Angelo & Cross, 1993) From: http://warrington.ufl.edu/itsp/docs/instructor/assessmenttechniques.pdf Assessing Prior Knowledge, Recall, and Understanding 1. Background
Classroom Assessment Techniques (CATs; Angelo & Cross, 1993) From: http://warrington.ufl.edu/itsp/docs/instructor/assessmenttechniques.pdf Assessing Prior Knowledge, Recall, and Understanding 1. Background
Visual CP Representation of Knowledge
 Visual CP Representation of Knowledge Heather D. Pfeiffer and Roger T. Hartley Department of Computer Science New Mexico State University Las Cruces, NM 88003-8001, USA email: hdp@cs.nmsu.edu and rth@cs.nmsu.edu
Practice Examination IREB
 IREB Examination Requirements Engineering Advanced Level Elicitation and Consolidation Practice Examination Questionnaire: Set_EN_2013_Public_1.2 Syllabus: Version 1.0 Passed Failed Total number of points
A GENERIC SPLIT PROCESS MODEL FOR ASSET MANAGEMENT DECISION-MAKING
 A GENERIC SPLIT PROCESS MODEL FOR ASSET MANAGEMENT DECISION-MAKING Yong Sun, a * Colin Fidge b and Lin Ma a a CRC for Integrated Engineering Asset Management, School of Engineering Systems, Queensland
College Pricing. Ben Johnson. April 30, Abstract. Colleges in the United States price discriminate based on student characteristics
 College Pricing Ben Johnson April 30, 2012 Abstract Colleges in the United States price discriminate based on student characteristics such as ability and income. This paper develops a model of college
Visit us at:
 White Paper Integrating Six Sigma and Software Testing Process for Removal of Wastage & Optimizing Resource Utilization 24 October 2013 With resources working for extended hours and in a pressurized environment,
A Note on Structuring Employability Skills for Accounting Students
 A Note on Structuring Employability Skills for Accounting Students Jon Warwick and Anna Howard School of Business, London South Bank University Correspondence Address Jon Warwick, School of Business, London
Knowledge management styles and performance: a knowledge space model from both theoretical and empirical perspectives
 University of Wollongong Research Online University of Wollongong Thesis Collection University of Wollongong Thesis Collections 2004 Knowledge management styles and performance: a knowledge space model
3. Improving Weather and Emergency Management Messaging: The Tulsa Weather Message Experiment. Arizona State University
 3. Improving Weather and Emergency Management Messaging: The Tulsa Weather Message Experiment Kenneth J. Galluppi 1, Steven F. Piltz 2, Kathy Nuckles 3*, Burrell E. Montz 4, James Correia 5, and Rachel
English Language Arts Summative Assessment
 English Language Arts Summative Assessment 2016 Paper-Pencil Test Audio CDs are not available for the administration of the English Language Arts Session 2. The ELA Test Administration Listening Transcript
Evidence for Reliability, Validity and Learning Effectiveness
 PEARSON EDUCATION Evidence for Reliability, Validity and Learning Effectiveness Introduction Pearson Knowledge Technologies has conducted a large number and wide variety of reliability and validity studies
Honors Mathematics. Introduction and Definition of Honors Mathematics
 Honors Mathematics Introduction and Definition of Honors Mathematics Honors Mathematics courses are intended to be more challenging than standard courses and provide multiple opportunities for students
Modified Systematic Approach to Answering Questions J A M I L A H A L S A I D A N, M S C.
 Modified Systematic Approach to Answering J A M I L A H A L S A I D A N, M S C. Learning Outcomes: Discuss the modified systemic approach to providing answers to questions Determination of the most important
Availability of Grants Largely Offset Tuition Increases for Low-Income Students, U.S. Report Says
 Wednesday, October 2, 2002 http://chronicle.com/daily/2002/10/2002100206n.htm Availability of Grants Largely Offset Tuition Increases for Low-Income Students, U.S. Report Says As the average price of attending
Ph.D. in Behavior Analysis Ph.d. i atferdsanalyse
 Program Description Ph.D. in Behavior Analysis Ph.d. i atferdsanalyse 180 ECTS credits Approval Approved by the Norwegian Agency for Quality Assurance in Education (NOKUT) on the 23rd April 2010 Approved
The Condition of College & Career Readiness 2016
 The Condition of College and Career Readiness This report looks at the progress of the 16 ACT -tested graduating class relative to college and career readiness. This year s report shows that 64% of students
Table of Contents. Internship Requirements 3 4. Internship Checklist 5. Description of Proposed Internship Request Form 6. Student Agreement Form 7
 Table of Contents Section Page Internship Requirements 3 4 Internship Checklist 5 Description of Proposed Internship Request Form 6 Student Agreement Form 7 Consent to Release Records Form 8 Internship
Executive Summary. DoDEA Virtual High School
 New York/Virginia/Puerto Rico District Dr. Terri L. Marshall, Principal 3308 John Quick Rd Quantico, VA 22134-1752 Document Generated On February 25, 2015 TABLE OF CONTENTS Introduction 1 Description of
Algebra 1, Quarter 3, Unit 3.1. Line of Best Fit. Overview
 Algebra 1, Quarter 3, Unit 3.1 Line of Best Fit Overview Number of instructional days 6 (1 day assessment) (1 day = 45 minutes) Content to be learned Analyze scatter plots and construct the line of best
Research Laboratory. United States Air Force EFFECTS OF FATIGUE ON SIMULATION- BASED TEAM DECISION MAKING PERFORMANCE
 AFRL-HE-BR-TR-2004-0020 United States Air Force Research Laboratory EFFECTS OF FATIGUE ON SIMULATION- BASED TEAM DECISION MAKING PERFORMANCE Christopher Barnes Michael Coovert Donald Harville HUMAN EFFECTIVENESS
Summary / Response. Karl Smith, Accelerations Educational Software. Page 1 of 8
 Summary / Response This is a study of 2 autistic students to see if they can generalize what they learn on the DT Trainer to their physical world. One student did automatically generalize and the other
DESIGNPRINCIPLES RUBRIC 3.0
 DESIGNPRINCIPLES RUBRIC 3.0 QUALITY RUBRIC FOR STEM PHILANTHROPY This rubric aims to help companies gauge the quality of their philanthropic efforts to boost learning in science, technology, engineering
Individual Differences & Item Effects: How to test them, & how to test them well
 Individual Differences & Item Effects: How to test them, & how to test them well Individual Differences & Item Effects Properties of subjects Cognitive abilities (WM task scores, inhibition) Gender Age
STUDENT LEARNING ASSESSMENT REPORT
 STUDENT LEARNING ASSESSMENT REPORT PROGRAM: Sociology SUBMITTED BY: Janine DeWitt DATE: August 2016 BRIEFLY DESCRIBE WHERE AND HOW ARE DATA AND DOCUMENTS USED TO GENERATE THIS REPORT BEING STORED: The