INSTITUTIONAL RESEARCH STUDY ACT College Student Needs Assessment Survey Fall February 27, Qin Zhang and Heather A.
|
|
|
- Shannon Young
- 5 years ago
- Views:
Transcription

1 INSTITUTIONAL RESEARCH STUDY ACT College Student Needs Assessment Survey Fall 2007 February 27, 2009 By Qin Zhang and Heather A. Kelly Office of Institutional Research and Planning University of Delaware
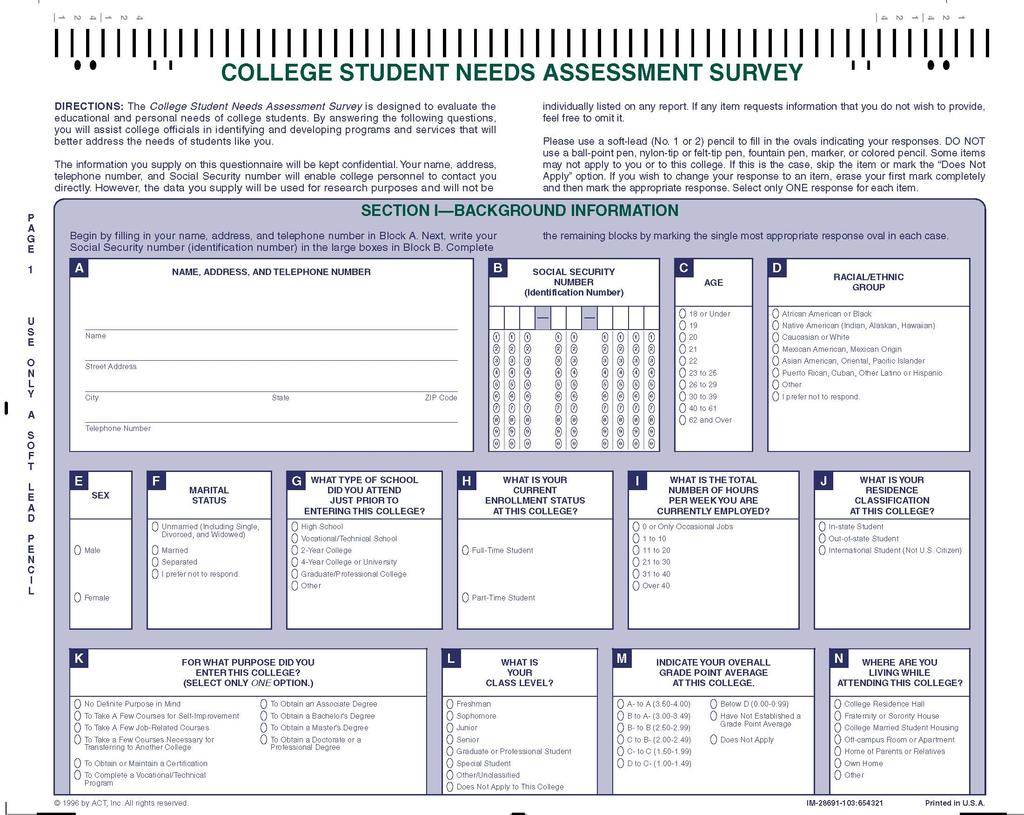
2 Institutional Research Study ACT College Student Needs Assessment Survey Fall 2007 Qin Zhang and Heather A. Kelly In summer 2007, the Office of Admissions and the Office of Institutional Research and Planning administered the ACT College Student Needs Assessment Survey during new student orientation in order to capture the current and changing needs and expectations of entering freshmen. In particular, this survey serves to identify students career and life goals, as well as their education and personal needs over the course of their academic career. Methodology The Needs Survey was included in the packet of materials distributed to students at DelaWorld (Appendix A). Among 3,592 first-time freshmen on the Newark campus, a total of 1,540 students returned surveys to the Office of Institutional Research and Planning. A response rate of 43 percent was achieved. The data was not collected through a random sample of the actual first-time freshmen population. However, given the sizable number of participants in the survey, the data provides useful information. A comparison of the demographic profiles of survey respondents with that of the actual population reveals that attributes of the actual population are represented fairly well by the respondents (Appendix B). An examination of demographic groupings for the student populations in 2004 and 2007 suggests some noticeable changes in terms of the characteristics of the student population. The proportion of non-residents has increased in 2007 to 71% compared to 64% in There is also a decrease in the number of white students from 84% in 2004 to 78% in Findings Similar to results from the 2004 Needs Survey, prior to entering the University of Delaware, 93% of respondents attended high school while 5% of respondents attended a four-year college or university. The remaining students (2%) attended a vocational school or a 2-year college prior to coming to the University. The vast majority (77%) of students were currently employed and worked a range of hours from 1 to 10 hours per week to over 40 hours per week, down two percentage points from Obtaining a Bachelor s degree continues to be the most cited purpose for entering the University. Seventy-eight percent of students indicated that they wanted to pursue a Bachelor s degree, compared to 79% in In addition, approximately 8% had no definite purpose in mind, unchanged from Table 1 on the following page provides more detail.
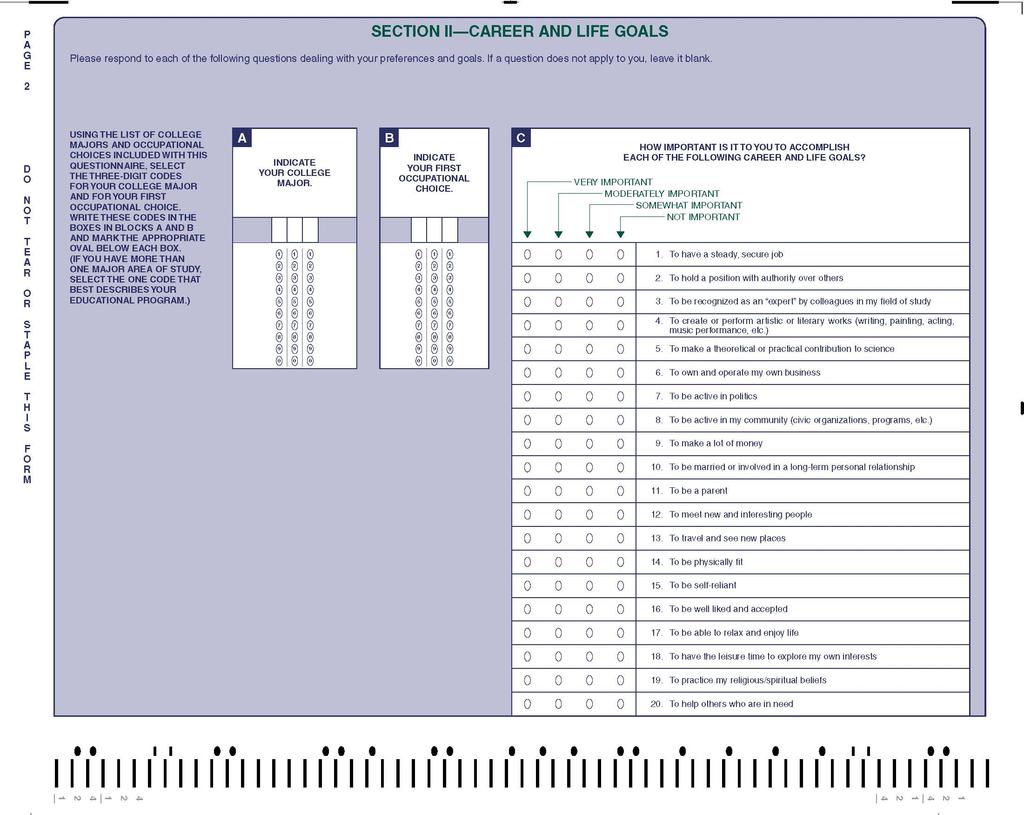
3 IRS ACT Needs Assessment Survey Table1. Purpose for Entering University of Delaware Purpose Percent To obtain a Bachelor s Degree 78.3% No definite purpose in mind 8.1% To obtain a Master s Degree 6.9% To obtain a Doctorate Degree or Professional Degree 3.7% Other 1.9% To obtain an Associate Degree 1.2% Approximately 10% of respondents were undecided on their college major and approximately 12% were undecided on their occupational choice. In 2004, 14% of students were undecided on their college major and 15% were undecided on their occupational choice. The top five college majors mentioned were Business Administration and Management, Elementary Education, Biology, Mechanical Engineering, and Nursing (Table 2). In comparison to 2004, Mechanical Engineering replaced Psychology as one of the top five college majors. Similar to 2004, the top five first occupational choices were Business Administration and Management, Elementary Education, Nursing, Pre-Medicine, and Physical Therapy (Table 3). Table 2. Top Five College Majors Top Five College Majors Percent Business Administration and Management 18.6% Elementary Education 6.4% Biology 5.2% Mechanical Engineering 3.4% Nursing 3.3% Table 3. Top Five Occupational Choices Top Five Occupational Choices Percent Business Administration and Management 18.5% Elementary Education 5.1% Nursing 4.2% Pre-Medicine 3.0% Physical Therapy 2.9% Career and Life Goals In the 2007 Needs Survey, respondents were asked to indicate how important it is to accomplish 20 different career and life goals. As in 2004, being able to relax and enjoy life and having a steady and secure job are the two goals most often cited by students, with close to 98% indicating either of them were very to moderately important. The goal of being self-reliant was listed as very important or moderately important by 97% of students, followed by meeting new and interesting people (95% combined), and having the leisure time to explore own interests - 2 -
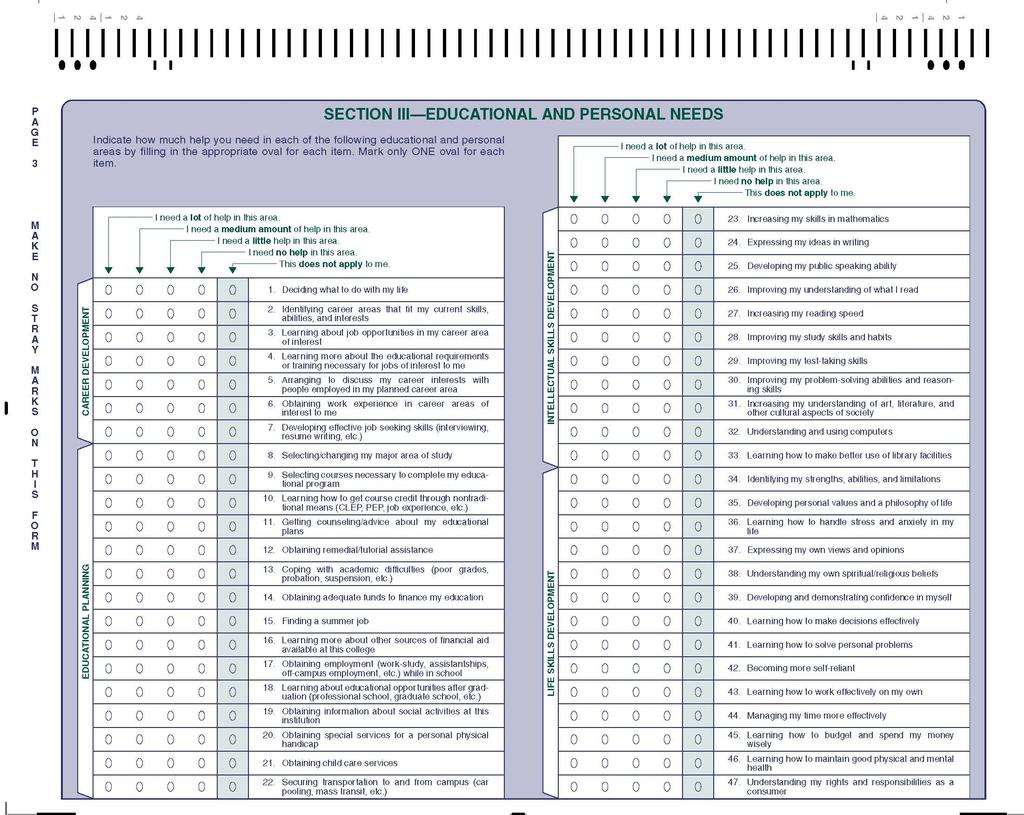
4 IRS ACT Needs Assessment Survey (94% combined). Interestingly enough, these same five goals stood out in the previous 2004 survey. Table 4 summarizes the frequency distribution of the overall responses to these goals. Table 4. Importance of Career and Life Goals Very Important Moderately Important Somewhat Important Not Important 1. To have a steady, secure job 89.2% 8.5% 2.0% 0.3% 2. To hold a position with authority over others 12.7% 42.8% 32.7% 11.7% 3. To be recognized as an expert by colleagues in my field of study 33.1% 43.4% 19.6% 4.0% 4. To create or perform artistic or literary works (writing, painting, acting, music performance, etc.) 9.6% 12.2% 29.1% 49.1% 5. To make a theoretical or practical contribution to science 8.2% 16.9% 27.1% 47.8% 6. To own and operate my own business 14.8% 24.8% 30.2% 30.2% 7. To be active in politics 4.7% 12.7% 32.7% 49.9% 8. To be active in my community (civic organizations, programs, etc.) 19.9% 38.1% 34.9% 7.0% 9. To make a lot of money 36.2% 44.6% 15.6% 3.5% 10. To be married or involved in a long-term personal relationship 66.5% 24.6% 7.2% 1.7% 11. To be a parent 60.2% 25.1% 9.9% 4.8% 12. To meet new and interesting people 67.2% 27.9% 4.5% 0.3% 13. To travel and see new places 60.7% 28.3% 9.9% 1.1% 14. To be physically fit 59.7% 33.0% 7.0% 0.3% 15. To be self-reliant 69.4% 28.0% 2.4% 0.2% 16. To be well liked and accepted 49.6% 39.8% 9.5% 1.0% 17. To be able to relax and enjoy life 80.2% 17.7% 2.0% 0.1% 18. To have the leisure time to explore my own interests 61.8% 32.1% 5.9% 0.2% 19. To practice my religious/spiritual beliefs 23.7% 24.7% 30.0% 21.6% 20. To help others who are in need 45.6% 38.7% 14.6% 1.1% Educational and Personal Needs Career Development The 2007 Needs Survey also asks respondents to assess the level of help they will need in 59 different educational and personal growth areas. These 59 areas are broken down into five subgroups: career development, educational planning, intellectual skills development, life skills development, and personal development. Table 5 summarizes the level of help needed in the seven areas of the career development subgroup. Five of the seven areas were identified by more than 50% of respondents as areas where they need a medium to a lot of help. These areas included obtaining work experience (73% combined), learning about job opportunities (69% - 3 -
5 IRS ACT Needs Assessment Survey combined), arranging to discuss my career interests with people employed in similar career area (66% combined), learning more about the educational requirements or training necessary for jobs of interest (65% combined), and developing effective job seeking skills (57% combined). The same five areas had been identified in the 2004 survey; however, except for the area of developing effective job seeking skills, the survey responses show an increasing number of students who needed a medium to a lot help in the other four areas compared to 2004 (Figure 1). Table 5. Educational and Personal Needs: Career Development Level of help A lot Medium Little None Does Not Apply 1. Deciding what to do with my life 9.5% 30.8% 39.8% 18.5% 1.3% 2. Identifying career areas that fit my current skills, abilities, and interests 11.1% 35.5% 36.3% 16.3% 0.8% 3. Learning about job opportunities in my career area of interest 23.7% 45.1% 25.3% 5.5% 0.4% 4. Learning more about the educational requirements or training necessary for jobs of interest to me 18.8% 46.0% 29.5% 5.1% 0.6% 5. Arranging to discuss my career interests with people employed in my planned career area 18.9% 46.9% 27.9% 5.5% 0.8% 6. Obtaining work experience in career areas of interest to me 27.4% 45.9% 21.4% 4.8% 0.6% 7. Developing effective job seeking skills (interviewing, resume writing, etc.) 16.9% 40.2% 34.3% 7.7% 0.9% Figure 1. Top Five Areas of Career Development 80% 60% 71% 73% 66% 69% 66% 65% 60% 60% 57% 57% 40% 20% 0% Obtaining work experience Learning about job opportunities Arranging to discuss career interests Learning educational requirements and training Developing effective job seeking skills Educational Planning Table 6 summarizes the level of help needed in the fifteen areas of the educational planning subgroup. Among the areas of the educational planning subgroup, two areas were identified by - 4 -
6 IRS ACT Needs Assessment Survey more than 50% of respondents as areas where they need a medium to a lot of help. The two areas were learning about educational opportunities after graduation (59% combined) and selecting courses necessary to complete educational program (59% combined). Other areas of concern where respondents indicated they need a medium to a lot of help included getting counseling and advice about educational plans (49% combined), obtaining information abut social activities (48% combined), and obtaining employment while in school (44% combined). The proportion of students who need a medium to a lot help has increased in all the above areas since 2004, except the area of obtaining employment (Figure 2). Table 6. Educational and Personal Needs: Educational Planning Level of help A lot Medium Little None Does Not Apply 8. Selecting/changing my major area of study 10.7% 18.9% 25.2% 29.0% 16.1% 9. Selecting courses necessary to complete my educational program 17.7% 40.9% 33.9% 6.5% 1.1% 10. Learning how to get course credit through nontraditional means (CLEP, PEP, job experience, etc.) 11.4% 29.3% 29.6% 16.8% 12.9% 11. Getting counseling/advice about my educational plans 11.2% 38.2% 38.7% 10.0% 1.9% 12. Obtaining remedial/tutorial assistance 3.6% 21.7% 44.9% 23.9% 6.0% 13. Coping with academic difficulties (poor grades, probation, suspension, etc.) 3.1% 12.3% 32.9% 38.9% 12.8% 14. Obtaining adequate funds to finance my education 16.0% 25.4% 28.2% 23.6% 6.8% 15. Finding a summer job 6.8% 16.2% 24.3% 44.7% 8.0% 16. Learning more about other sources of financial aid available at this college 17.5% 23.0% 31.1% 22.3% 6.1% 17. Obtaining employment (work-study, assistantships, off-campus employment, etc.) while in school 16.5% 27.9% 30.2% 21.3% 4.1% 18. Learning about educational opportunities after graduation (professional school, graduate school, etc.) 19.2% 39.6% 30.1% 8.9% 2.1% 19. Obtaining information about social activities at this institution 9.4% 38.9% 38.0% 11.9% 1.7% 20. Obtaining special services for a personal physical handicap 0.7% 4.1% 7.0% 24.4% 63.8% 21. Obtaining child care services 0.8% 3.2% 5.3% 20.1% 70.6% 22. Securing transportation to and from campus (car pooling, mass transit, etc.) 3.7% 12.4% 24.1% 29.9% 29.9% - 5 -
7 IRS ACT Needs Assessment Survey Figure 2. Top Five Areas of Educational Planning 60% 40% 58% 59% 59% 53% 49% 48% 45% 44% 44% 44% 20% 0% Learning about educational opportunities after graduation Selecting courses necessary to complete educational program Obtaining information about social activities Getting counseling and advice about educational plans Obtaining employment while in school Intellectual Skills Development Table 7 summarizes the level of help needed in the eleven areas of the intellectual skills development subgroup. Among the areas of the intellectual skills development subgroup, two areas were selected by more than 50% of respondents as areas where they need a medium to a lot of help. These two areas were developing public speaking ability (55% combined) and improving study skills and habits (50% combined). Other areas of concern where respondents indicated they need a medium to a lot of help included increasing skills in mathematics (48% combined), improving test-taking skills (47% combined), and expressing ideas in writing (40% combined). The proportion of students who need a medium to a lot help has increased in all the above areas since 2004, except the area of expressing ideas in writing (Figure 3). Table 7. Educational and Personal Needs: Intellectual Skills Development Level of help A lot Medium Little None Does Not Apply 23. Increasing my skills in mathematics 16.7% 30.8% 34.2% 17.1% 1.1% 24. Expressing my ideas in writing 9.7% 29.9% 37.4% 21.6% 1.4% 25. Developing my public speaking ability 20.2% 34.7% 30.6% 13.5% 0.9% 26. Improving my understanding of what I read 8.2% 27.7% 39.9% 23.1% 1.1% 27. Increasing my reading speed 12.5% 25.7% 31.7% 28.7% 1.4% 28. Improving my study skills and habits 14.5% 35.8% 35.8% 13.2% 0.7% 29. Improving my test-taking skills 14.8% 32.4% 36.9% 15.1% 0.9% 30. Improving my problem-solving abilities and reasoning skills 8.0% 26.5% 45.6% 19.1% 0.9% - 6 -
8 IRS ACT Needs Assessment Survey Table 7. Educational and Personal Needs: Intellectual Skills Development (continued) Level of help A lot Medium Little None Does Not Apply 31. Increasing my understanding of art, literature, and other cultural aspects of society 6.8% 25.9% 43.2% 21.7% 2.4% 32. Understanding and using computers 5.5% 21.2% 40.0% 31.7% 1.5% 33. Learning how to make better use of library facilities 5.5% 27.9% 44.5% 21.1% 1.0% Figure 3. Top Five Areas of Intellectual Skills Development 60% 40% 55% 52% 50% 45% 47% 48% 43% 41% 40% 40% 20% 0% Developing public speaking ability Improving study skills and habits Improving test-taking skills Increasing skills in mathematics Expressing ideas in writing Life Skills Development Table 8 summarizes the level of help needed in the fourteen areas of the life skills development subgroup. Among the areas of the life skills development subgroup, four areas were identified by more than 30% of respondents as areas where they need a medium to a lot of help. These four areas included managing time more effectively (40% combined), learning how to budget and spend money wisely (36% combined), learning how to handle stress and anxiety (32% combined), and identifying strengths, abilities, and limitations (30% combined). The proportion of students who need a medium to a lot of help has increased in all these areas since 2004 (Figure 4). Table 8. Educational and Personal Needs: Life Skills Development Level of help A lot Medium Little None Does Not Apply 34. Identifying my strengths, abilities, and limitations 5.6% 24.8% 46.7% 21.8% 0.9% 35. Developing personal values and a philosophy of life 2.9% 14.3% 40.5% 40.9% 1.4% - 7 -
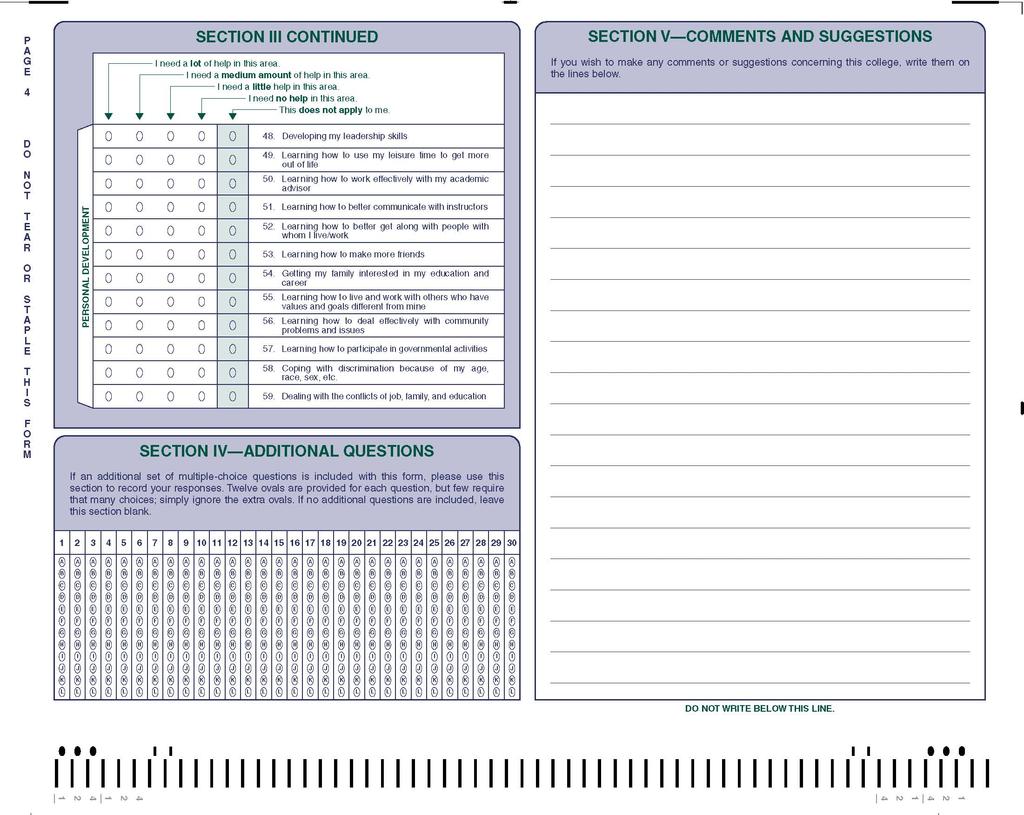
9 IRS ACT Needs Assessment Survey Table 8. Educational and Personal Needs: Life Skills Development (continued) Level of help A lot Medium Little None Does Not Apply 36. Learning how to handle stress and anxiety in my life 10.4% 21.5% 40.2% 26.6% 1.3% 37. Expressing my own views and opinions 3.4% 17.6% 37.4% 39.7% 1.9% 38. Understanding my own spiritual/religious beliefs 1.9% 8.0% 24.8% 59.5% 5.8% 39. Developing and demonstrating confidence in myself 6.6% 19.0% 36.1% 36.4% 1.9% 40. Learning how to make decisions effectively 5.3% 19.9% 43.9% 29.7% 1.2% 41. Learning how to solve personal problems 3.4% 13.8% 39.3% 41.9% 1.6% 42. Becoming more self-reliant 5.1% 19.0% 39.5% 35.0% 1.5% 43. Learning how to work effectively on my own 4.4% 18.0% 39.1% 37.3% 1.2% 44. Managing my time more effectively 12.3% 27.8% 37.6% 21.4% 0.9% 45. Learning how to budget and spend my money wisely 10.9% 24.7% 37.7% 25.8% 0.9% 46. Learning how to maintain good physical and mental health 5.1% 19.1% 39.1% 35.3% 1.3% 47. Understanding my rights and responsibilities as a consumer 3.7% 15.9% 42.5% 36.4% 1.5% Figure 4. Top Five Areas of Life Skills Development 50% 40% 30% 20% 10% 0% 40% 36% Manage time more effectively 36% 31% Learn how to budget and spend money wisely 32% 28% Learn how to handle stress and anxiety % 26% Identify strengths, abilities, and limitations 26% 24% Develop and demonstrate confidence in myself Personal Development Table 9 summarizes the level of help needed in the twelve areas of the personal development subgroup. More than 30% of respondents indicated they need a medium to a lot of help in three of the areas of the personal development subgroup. These areas were learning how to work effectively with academic advisor (40% combined), developing leadership skills (31% combined), and learning how to better communicate with instructors (31% combined). A comparison of these three areas in 2004 with that in 2007 indicates an increase in the level of help needed (Figure 5). Other areas of interest where respondents indicated they need a medium - 8 -
10 IRS ACT Needs Assessment Survey to a lot of help include learning how to participate in governmental activities (21% combined) and learning how to use leisure time to get more out of life (24% combined). Table 9. Educational and Personal Needs: Personal Development Level of help A lot Medium Little None Does Not Apply 48. Developing my leadership skills 4.7% 26.6% 41.0% 26.6% 1.1% 49. Learning how to use my leisure time to get more out of life 4.8% 18.8% 42.6% 32.8% 1.0% 50. Learning how to work effectively with my academic advisor 7.4% 32.7% 40.3% 17.5% 2.1% 51. Learning how to better communicate with instructors 5.5% 25.5% 43.2% 24.0% 1.7% 52. Learning how to better to get along with people with whom I live/work 2.5% 12.9% 40.7% 42.1% 1.9% 53. Learning how to make more friends 2.5% 13.6% 36.8% 45.4% 1.7% 54. Getting my family interested in my education and career 2.5% 6.1% 25.0% 63.7% 2.7% 55. Learning how to live and work with others who have values and goals different from mine 1.9% 9.7% 38.5% 48.3% 1.6% 56. Learning how to deal effectively with community problems and issues 0.9% 11.3% 44.0% 42.0% 1.7% 57. Learning how to participate in governmental activities 3.9% 17.5% 36.7% 36.6% 5.3% 58. Coping with discrimination because of my age, race, sex, etc. 1.1% 4.7% 22.3% 62.0% 9.8% 59. Deal with the conflicts of job, family, and education 2.2% 10.8% 35.7% 47.4% 3.9% 40% 30% 20% Figure 5. Top Five Areas of Personal Development 40% 31% 30% 31% 31% 27% 24% 24% 24% 21% 10% 0% Learn to work effectively with academic advisor Learn to develop leadership skills Learn to better communicate with instructors Learn to participate in governmental activities Learn to use leisure time to get more out of life
11 IRS ACT Needs Assessment Survey A further summary of the mean scores for the level of help needed in all the above 59 areas by ethnicity, gender, and residence status are presented in Appendices C, D, and E, respectively. Readers will be able to see how the scores differ across these subgroups. ********** This report has discussed the primary findings of the 2007 ACT College Student Needs Assessment Survey. If you have any questions or need additional information, please contact the Office of Institutional Research and Planning
12 Appendix A ACT College Student Needs Assessment Survey
13
14
15
16
17 Appendix B Demographics of ACT College Students Needs Assessment Survey Respondents versus Actual Population for Newark Campus Entering First-Time Freshmen Fall 2007 and Fall 2004 Survey Administrations Category Respondents (n=1,540) Population (n=3,592) Respondents (n=2,382) Population (n=3,385) Female 60.0% 59.6% 61.0% 58.5% Male 40.0% 40.4% 39.0% 41.5% Mean Age 18 years 18 years 18 years 18 years White 80.1% 78.1% 81.6% 84.3% African-American 6.0% 6.2% 5.5% 5.9% Hispanic 5.8% 6.9% 4.0% 4.8% Asian 3.2% 4.7% 3.5% 3.4% Native American 0.1% 0.1% 0.3% 0.2% Other 1.8% 4.0% 1.2% 0.4% Resident 31.5% 29.5% 33.7% 36.4% Non-resident 68.5% 70.5% 66.2% 63.6% Full-time 99.6% 99.4% 99.9% 99.7% Part-time 0.4% 0.6% 0.1% 0.3% On-campus 91.5% 93.5% 90.7% 92.4% Off-campus 8.6% 6.5% 9.3% 7.6%
18 Appendix C Ethnicity Analysis Table 1. Importance of Career and Life Goals by Ethnicity African Black (AA) Native American (NA) Caucasian, White (CA) Mexican Mexican Origin (MA) Asian Oriental, Pacific Islander (AS) Puerto Rican, Cuban, Other Latino or Hispanic (PR) 1. To have a steady, secure job *AS *AS 3.96*AS 2. To hold a position with authority over others *OT To be recognized as an expert by colleagues in my field of study To create or perform artistic or literary works (writing, painting, acting, music performance, etc.) *MA To make a theoretical or practical contribution to science 2.08*CA To own and operate my own business 2.74*CA, OT *CA 2.59*CA To be active in politics To be active in my community (civic organizations, programs, etc.) 2.96*NA, CA, AS *NA 3.29*NA *NA To make a lot of money 3.40*CA, OT Other (OT)
19 Table 1. Importance of Career and Life Goals by Ethnicity (continued) African Black (AA) Native American (NA) Caucasian, White (CA) 3.61*AA, Mexican Mexican Origin (MA) Asian Oriental, Pacific Islander (AS) Puerto Rican, Cuban, Other Latino or Hispanic (PR) 3.53*AA, 10. To be married or involved in a longterm personal relationship AS, OT OT To be a parent 3.44*AA, 3.48*AA, OT 3.71*OT 3.34 OT To meet new and interesting people To travel and see new places To be physically fit To be self-reliant 3.82*CA, PR To be well liked and accepted Other (OT) 3.43*AA, PR To be able to relax and enjoy life To have the leisure time to explore my own interests To practice my religious/spiritual 3.02*CA, beliefs PR To help others who are in need *CA Mean scores: 4=Very Important, 3=Moderately Important, 2=Somewhat Important, 1=Not Important * Mean difference between ethnicity group(s) indicated is significant at the.05 level
20 1. Deciding what to do with my life Table 2. Educational and Personal Needs: Career Development by Ethnicity African Black (AA) Native American (NA) Caucasian, White (CA) Mexican Mexican Origin (MA) Asian Oriental, Pacific Islander (AS) Puerto Rican, Cuban, Other Latino or Hispanic (PR) Other (OT) 2.58*AA, NA, CA 2.41*NA *NA Identifying career areas that fit my current skills, abilities, and interests Learning about job opportunities in my career area of interest Learning more about the educational requirements or training necessary for jobs of interest to me *CA 2.95*CA Arranging to discuss my career interests with people employed in my planned career area *CA 2.99*CA Obtaining work experience in career areas of interest to me Developing effective job seeking skills (interviewing, resume writing, etc.) *CA, MA *AA, CA, MA, OT Mean scores: 4=Need a lot of help; 3=Need a medium amount of help; 2=Need a little help; 1=Need no help; 0=Does not apply * Mean difference between ethnicity group(s) indicated is significant at the.05 level
21 Table 3. Educational and Personal Needs: Educational Planning by Ethnicity African Black (AA) Native American (NA) Caucasian, White (CA) Mexican Mexican Origin (MA) Asian Oriental, Pacific Islander (AS) Puerto Rican, Cuban, Other Latino or Hispanic (PR) 8. Selecting/changing my major area of study Selecting courses necessary to complete my educational program *CA Learning how to get course credit through non-traditional means (CLEP, PEP, job experience, etc.) Other (OT) 2.52*AA, CA, PR *NA, 2.75*NA, CA, OT CA Getting counseling/advice about my educational plans Obtaining remedial/tutorial assistance 2.11*CA *CA 2.17*CA Coping with academic difficulties (poor grades, probation, suspension, etc.) 1.72*CA *CA, OT Obtaining adequate funds to finance my education 2.85*CA, PR *CA *CA 15. Finding a summer job 2.17*CA *CA 1.87*CA 2.12*CA 16. Learning more about other sources of financial aid available at this college 2.89*CA, PR *CA Obtaining employment (work-study, assistantships, off-campus employment, etc.) while in school 2.54*CA *CA 2.63*CA 2.67*CA
22 Table 3. Educational and Personal Needs: Educational Planning by Ethnicity (continued) African Black (AA) Native American (NA) Caucasian, White (CA) Mexican Mexican Origin (MA) Asian Oriental, Pacific Islander (AS) Puerto Rican, Cuban, Other Latino or Hispanic (PR) 18. Learning about educational opportunities after graduation (professional school, graduate school, etc.) 2.84*CA *CA 2.92*CA Obtaining information about social activities at this institution 2.60*CA *CA Obtaining special services for a personal physical handicap 0.84*CA, MA, PR, *MA AA Obtaining child care services *CA Securing transportation to and from campus (car pooling, mass transit, etc.) Other (OT) 1.77*CA, OT *CA Mean scores: 4=Need a lot of help; 3=Need a medium amount of help; 2=Need a little help; 1=Need no help; 0=Does not apply * Mean difference between ethnicity group(s) indicated is significant at the.05 level
23 Table 4. Educational and Personal Needs: Intellectual Skills Development by Ethnicity African Black (AA) Native American (NA) Caucasian, White (CA) Mexican Mexican Origin (MA) Asian Oriental, Pacific Islander (AS) Puerto Rican, Cuban, Other Latino or Hispanic (PR) 23. Increasing my skills in mathematics 2.78*CA, 2.75*CA AS Expressing my ideas in writing 2.52*CA, OT Developing my public speaking ability *CA Improving my understanding of what I read 2.42*CA, MA *CA 2.45*CA, MA Increasing my reading speed 2.47*CA, OT *CA, OT Improving my study skills and habits 2.84*CA, OT *CA Improving my test-taking skills 3.43*CA, 2.86*CA PR, OT 2.72*CA Improving my problem-solving abilities and reasoning skills 2.48*CA *CA 2.58*CA, OT Increasing my understanding of art, literature, and other cultural aspects of society 2.30*CA *CA, OT 2.33*CA Understanding and using computers *AA Learning how to make better use of 2.30*MA, 2.27*MA, library facilities OT OT 1.89 Mean scores: 4=Need a lot of help; 3=Need a medium amount of help; 2=Need a little help; 1=Need no help; 0=Does not apply * Mean difference between ethnicity group(s) indicated is significant at the.05 level Other (OT)
24 Table 5. Educational and Personal Needs: Life Skills Development by Ethnicity African Black (AA) Native American (NA) Caucasian, White (CA) Mexican Mexican Origin (MA) Asian Oriental, Pacific Islander (AS) Puerto Rican, Cuban, Other Latino or Hispanic (PR) 34. Identifying my strengths, abilities, and limitations *CA 2.38*CA Developing personal values and a philosophy of life Learning how to handle stress and anxiety in my life Expressing my own views and opinions *AA, CA, MA Understanding my own spiritual/religious beliefs Developing and demonstrating confidence in myself *AA, OT Learning how to make decisions effectively *AA, CA Learning how to solve personal problems *AA, CA, MA, PR, OT 1.92*CA Becoming more self-reliant *CA 2.14*CA Learning how to work effectively on my own 2.02*CA, MA *CA, MA, OT 2.09*CA, MA Managing my time more effectively 2.63*CA *CA Learning how to budget and spend my money wisely 2.49*CA *CA 2.19 Other (OT)
25 Table 5. Educational and Personal Needs: Life Skills Development by Ethnicity (continued) African Black (AA) Native American (NA) Caucasian, White (CA) Mexican Mexican Origin (MA) Asian Oriental, Pacific Islander (AS) Puerto Rican, Cuban, Other Latino or Hispanic (PR) 46. Learning how to maintain good physical and mental health *CA, OT Understanding my rights and responsibilities as a consumer 2.04*CA *CA 2.05*CA 1.85 Mean scores: 4=Need a lot of help; 3=Need a medium amount of help; 2=Need a little help; 1=Need no help; 0=Does not apply * Mean difference between ethnicity group(s) indicated is significant at the.05 level Other (OT)
26 Table 6. Educational and Personal Needs: Personal Development by Ethnicity African Black (AA) Native American (NA) Caucasian, White (CA) Mexican Mexican Origin (MA) Asian Oriental, Pacific Islander (AS) Puerto Rican, Cuban, Other Latino or Hispanic Other (PR) (OT) Developing my leadership skills *CA, OT 49. Learning how to use my leisure time to *CA 2.19*CA 1.85 get more out of life 50. Learning how to work effectively with 2.49*CA *CA 2.52*CA 2.19 my academic advisor 51. Learning how to better communicate 2.33*CA, *CA, 2.43*CA, 1.89 with instructors OT OT OT 52. Learning how to better to get along 1.83*MA *MA with people with whom I live/work 53. Learning how to make more friends Getting my family interested in my 1.54*CA *CA 1.56*CA 1.59 education and career 55. Learning how to live and work with others who have values and goals different from mine 56. Learning how to deal effectively with community problems and issues 57. Learning how to participate in governmental activities 58. Coping with discrimination because of my age, race, sex, etc. 59. Deal with the conflicts of job, family, and education *AS *CA *CA 1.40*CA *CA *CA Mean scores: 4=Need a lot of help; 3=Need a medium amount of help; 2=Need a little help; 1=Need no help; 0=Does not apply * Mean difference between ethnicity group(s) indicated is significant at the.05 level
27 Appendix D Gender Analysis Table 1. Importance of Career and Life Goals by Gender Male Female 1. To have a steady, secure job To hold a position with authority over others 2.65* To be recognized as an expert by colleagues in my field of study To create or perform artistic or literary works (writing, painting, acting, * music performance, etc.) 5. To make a theoretical or practical contribution to science 2.00* To own and operate my own business 2.44* To be active in politics 1.81* To be active in my community (civic organizations, programs, etc.) * 9. To make a lot of money 3.25* To be married or involved in a long-term personal relationship To be a parent ** 12. To meet new and interesting people * 13. To travel and see new places * 14. To be physically fit To be self-reliant To be well liked and accepted ** 17. To be able to relax and enjoy life To have the leisure time to explore my own interests To practice my religious/spiritual beliefs * 20. To help others who are in need * Mean scores: 4=Very Important 3=Moderately Important 2=Somewhat Important 1=Not Important * scores are significantly higher, p<.01 ** scores significantly higher, <.05
28 Table 2. Educational and Personal Needs: Career Development by Gender Male Female 1. Deciding what to do with my life Identifying career areas that fit my current skills, abilities, and interests Learning about job opportunities in my career area of interest Learning more about the educational requirements or training necessary for * jobs of interest to me 5. Arranging to discuss my career interests with people employed in my ** planned career area 6. Obtaining work experience in career areas of interest to me Developing effective job seeking skills (interviewing, resume writing, etc.) * Mean scores: 4=Need a lot of help; 3=Need a medium amount of help; 2=Need a little help; 1=Need no help; 0=Does not apply * scores are significantly higher, p<.01 ** scores significantly higher, <.05
29 Table 3. Educational and Personal Needs: Educational Planning by Gender Male Female 8. Selecting/changing my major area of study Selecting courses necessary to complete my educational program * 10. Learning how to get course credit through non-traditional means (CLEP, PEP, job experience, etc.) 11. Getting counseling/advice about my educational plans Obtaining remedial/tutorial assistance Coping with academic difficulties (poor grades, probation, suspension, 1.63* 1.48 etc.) 14. Obtaining adequate funds to finance my education Finding a summer job Learning more about other sources of financial aid available at this college 17. Obtaining employment (work-study, assistantships, off-campus * employment, etc.) while in school 18. Learning about educational opportunities after graduation * (professional school, graduate school, etc.) 19. Obtaining information about social activities at this institution * 20. Obtaining special services for a personal physical handicap Obtaining child care services Securing transportation to and from campus (car pooling, mass transit, etc.) Mean scores: 4=Need a lot of help; 3=Need a medium amount of help; 2=Need a little help; 1=Need no help; 0=Does not apply * scores are significantly higher, p<.01 ** scores significantly higher, <.05
30 Table 4. Educational and Personal Needs: Intellectual Skills Development by Gender Male Female 23. Increasing my skills in mathematics * 24. Expressing my ideas in writing Developing my public speaking ability * 26. Improving my understanding of what I read Increasing my reading speed 2.31* Improving my study skills and habits 2.58* Improving my test-taking skills * 30. Improving my problem-solving abilities and reasoning skills * 31. Increasing my understanding of art, literature, and other cultural aspects of society 32. Understanding and using computers * 33. Learning how to make better use of library facilities Mean scores: 4=Need a lot of help; 3=Need a medium amount of help; 2=Need a little help; 1=Need no help; 0=Does not apply * scores are significantly higher, p<.01 ** scores significantly higher, <.05
31 Table 5. Educational and Personal Needs: Life Skills Development by Gender Male Female 34. Identifying my strengths, abilities, and limitations ** 35. Developing personal values and a philosophy of life Learning how to handle stress and anxiety in my life * 37. Expressing my own views and opinions * 38. Understanding my own spiritual/religious beliefs Developing and demonstrating confidence in myself * 40. Learning how to make decisions effectively * 41. Learning how to solve personal problems * 42. Becoming more self-reliant ** 43. Learning how to work effectively on my own Managing my time more effectively Learning how to budget and spend my money wisely * 46. Learning how to maintain good physical and mental health * 47. Understanding my rights and responsibilities as a consumer Mean scores: 4=Need a lot of help; 3=Need a medium amount of help; 2=Need a little help; 1=Need no help; 0=Does not apply * scores are significantly higher, p<.01 ** scores significantly higher, <.05
32 Table 6. Educational and Personal Needs: Personal Development by Gender Male Female 48. Developing my leadership skills Learning how to use my leisure time to get more out of life Learning how to work effectively with my academic advisor 2.32** Learning how to better communicate with instructors Learning how to better to get along with people with whom I live/work 53. Learning how to make more friends Getting my family interested in my education and career Learning how to live and work with others who have values and goals different from mine 56. Learning how to deal effectively with community problems and issues Learning how to participate in governmental activities Coping with discrimination because of my age, race, sex, etc Deal with the conflicts of job, family, and education Mean scores: 4=Need a lot of help; 3=Need a medium amount of help; 2=Need a little help; 1=Need no help; 0=Does not apply * scores are significantly higher, p<.01 ** scores significantly higher, <.05
33 Appendix E Residence Status Analysis Table 1. Importance of Career and Life Goals by Residence Status Non- Resident Resident 1. To have a steady, secure job To hold a position with authority over others ** 3. To be recognized as an expert by colleagues in my field of study * 4. To create or perform artistic or literary works (writing, painting, acting, music performance, etc.) 5. To make a theoretical or practical contribution to science To own and operate my own business To be active in politics To be active in my community (civic organizations, programs, etc.) ** 9. To make a lot of money To be married or involved in a long-term personal relationship * 11. To be a parent * 12. To meet new and interesting people * 13. To travel and see new places * 14. To be physically fit * 15. To be self-reliant To be well liked and accepted * 17. To be able to relax and enjoy life ** 18. To have the leisure time to explore my own interests To practice my religious/spiritual beliefs To help others who are in need * Mean scores: 4=Very Important 3=Moderately Important 2=Somewhat Important 1=Not Important * scores are significantly higher, p<.01 ** scores significantly higher, <.05
34 Table 2. Educational and Personal Needs: Career Development by Residence Status Non- Resident Resident 1. Deciding what to do with my life Identifying career areas that fit my current skills, abilities, and interests 3. Learning about job opportunities in my career area of interest ** 4. Learning more about the educational requirements or training necessary for jobs of interest to me 5. Arranging to discuss my career interests with people employed in my planned career area 6. Obtaining work experience in career areas of interest to me Developing effective job seeking skills (interviewing, resume writing, etc.) * Mean scores: 4=Need a lot of help; 3=Need a medium amount of help; 2=Need a little help; 1=Need no help; 0=Does not apply * scores are significantly higher, p<.01 ** scores significantly higher, <.05
35 Table 3. Educational and Personal Needs: Educational Planning by Residence Status Non- Resident Resident 8. Selecting/changing my major area of study Selecting courses necessary to complete my educational program Learning how to get course credit through non-traditional means (CLEP, PEP, job experience, etc.) 11. Getting counseling/advice about my educational plans * 12. Obtaining remedial/tutorial assistance ** 13. Coping with academic difficulties (poor grades, probation, suspension, etc.) 14. Obtaining adequate funds to finance my education Finding a summer job * 16. Learning more about other sources of financial aid available at this college 17. Obtaining employment (work-study, assistantships, off-campus * employment, etc.) while in school 18. Learning about educational opportunities after graduation * (professional school, graduate school, etc.) 19. Obtaining information about social activities at this institution * 20. Obtaining special services for a personal physical handicap 0.63* Obtaining child care services 0.51** Securing transportation to and from campus (car pooling, mass transit, etc.) * Mean scores: 4=Need a lot of help; 3=Need a medium amount of help; 2=Need a little help; 1=Need no help; 0=Does not apply * scores are significantly higher, p<.01 ** scores significantly higher, <.05
36 Table 4. Educational and Personal Needs: Intellectual Skills Development by Residence Status Non- Resident Resident 23. Increasing my skills in mathematics Expressing my ideas in writing Developing my public speaking ability Improving my understanding of what I read ** 27. Increasing my reading speed Improving my study skills and habits Improving my test-taking skills Improving my problem-solving abilities and reasoning skills Increasing my understanding of art, literature, and other cultural aspects of society 32. Understanding and using computers Learning how to make better use of library facilities ** Mean scores: 4=Need a lot of help; 3=Need a medium amount of help; 2=Need a little help; 1=Need no help; 0=Does not apply * scores are significantly higher, p<.01 ** scores significantly higher, <.05
37 Table 5. Educational and Personal Needs: Life Skills Development by Residence Status Non- Resident Resident 34. Identifying my strengths, abilities, and limitations Developing personal values and a philosophy of life Learning how to handle stress and anxiety in my life Expressing my own views and opinions ** 38. Understanding my own spiritual/religious beliefs Developing and demonstrating confidence in myself * 40. Learning how to make decisions effectively Learning how to solve personal problems Becoming more self-reliant Learning how to work effectively on my own ** 44. Managing my time more effectively Learning how to budget and spend my money wisely ** 46. Learning how to maintain good physical and mental health Understanding my rights and responsibilities as a consumer Mean scores: 4=Need a lot of help; 3=Need a medium amount of help; 2=Need a little help; 1=Need no help; 0=Does not apply * scores are significantly higher, p<.01 ** scores significantly higher, <.05
38 Table 6. Educational and Personal Needs: Personal Development by Residence Status Non- Resident Resident 48. Developing my leadership skills Learning how to use my leisure time to get more out of life Learning how to work effectively with my academic advisor Learning how to better communicate with instructors Learning how to better to get along with people with whom I live/work 53. Learning how to make more friends Getting my family interested in my education and career Learning how to live and work with others who have values and goals different from mine 56. Learning how to deal effectively with community problems and issues 57. Learning how to participate in governmental activities Coping with discrimination because of my age, race, sex, etc Deal with the conflicts of job, family, and education Mean scores: 4=Need a lot of help; 3=Need a medium amount of help; 2=Need a little help; 1=Need no help; 0=Does not apply * scores are significantly higher, p<.01 ** scores significantly higher, <.05
Demographic Survey for Focus and Discussion Groups
 Appendix F Demographic Survey for Focus and Discussion Groups Demographic Survey--Lesbian, Gay, and Bisexual Discussion Group Demographic Survey Faculty with Disabilities Discussion Group Demographic Survey
Status of Women of Color in Science, Engineering, and Medicine
 Status of Women of Color in Science, Engineering, and Medicine The figures and tables below are based upon the latest publicly available data from AAMC, NSF, Department of Education and the US Census Bureau.
NATIONAL SURVEY OF STUDENT ENGAGEMENT (NSSE)
") NATIONAL SURVEY OF STUDENT ENGAGEMENT (NSSE) 2008 H. Craig Petersen Director, Analysis, Assessment, and Accreditation Utah State University Logan, Utah AUGUST, 2008 TABLE OF CONTENTS Executive Summary...1
NATIONAL SURVEY OF STUDENT ENGAGEMENT (NSSE) 2008 H. Craig Petersen Director, Analysis, Assessment, and Accreditation Utah State University Logan, Utah AUGUST, 2008 TABLE OF CONTENTS Executive Summary...1
National Survey of Student Engagement The College Student Report
 The College Student Report This is a facsimile of the NSSE survey (available at nsse.iub.edu/links/surveys). The survey itself is administered online. 1. During the current school year, about how often
Iowa School District Profiles. Le Mars
 Iowa School District Profiles Overview This profile describes enrollment trends, student performance, income levels, population, and other characteristics of the public school district. The report utilizes
Effective Recruitment and Retention Strategies for Underrepresented Minority Students: Perspectives from Dental Students
 Critical Issues in Dental Education Effective Recruitment and Retention Strategies for Underrepresented Minority Students: Perspectives from Dental Students Naty Lopez, Ph.D.; Rose Wadenya, D.M.D., M.S.;
PUBLIC INFORMATION POLICY
 CALIFORNIA STATE POLYTECHNIC UNIVERSITY, POMONA Landscape Architecture College of Environmental Design PUBLIC INFORMATION POLICY Landscape Architecture Accreditation Board (LAAB) accredited programs are
Supply and Demand of Instructional School Personnel
 Supply and Demand of Instructional School Personnel Presentation to the 82 nd Annual Virginia Middle and High School Principals Conference and Exposition Mrs. Patty S. Pitts Assistant Superintendent of
Port Graham El/High. Report Card for
 School: District: Kenai Peninsula Grades: K - 12 School Enrollment: 20 Title I School? No Title 1 Program: Accreditation: Report Card for 2008-2009 A Title 1 school receives federal money in support low-achieving
Transportation Equity Analysis
 2015-16 Transportation Equity Analysis Each year the Seattle Public Schools updates the Transportation Service Standards and bus walk zone boundaries for use in the upcoming school year. For the 2014-15
National Survey of Student Engagement Spring University of Kansas. Executive Summary
 National Survey of Student Engagement Spring 2010 University of Kansas Executive Summary Overview One thousand six hundred and twenty-one (1,621) students from the University of Kansas completed the web-based
Segmentation Study of Tulsa Area Higher Education Needs Ages 36+ March Prepared for: Conducted by:
 Segmentation Study of Tulsa Area Higher Education Needs Ages 36+ March 2004 * * * Prepared for: Tulsa Community College Tulsa, OK * * * Conducted by: Render, vanderslice & Associates Tulsa, Oklahoma Project
Facts and Figures Office of Institutional Research and Planning
 Facts and Figures 2008-2009 Office of Institutional Research and Planning Office of Institutional Research Fall 2009 Facts at a Glance Credit Headcount Enrollments Headcount Ethnicity Headcount Percent
EMPLOYMENT APPLICATION Legislative Counsel Bureau and Nevada Legislature 401 S. Carson Street Carson City, NV Equal Opportunity Employer
 EMPLOYMENT APPLICATION Legislative Counsel Bureau and Nevada Legislature 401 S. Carson Street Carson City, NV 89701-4747 Equal Opportunity Employer Read Instructions Before Proceeding I am applying for
Institution of Higher Education Demographic Survey
 Institution of Higher Education Demographic Survey Data from all participating institutions are aggregated for the comparative studies by various types of institutional characteristics. For that purpose,
UW-Waukesha Pre-College Program. College Bound Take Charge of Your Future!
 UW-Waukesha Pre-College Program College Bound 2017 Take Charge of Your Future! This is a great program to increase your knowledge on various subjects. Students will be engaged in workshops and hands-on
Student Mobility Rates in Massachusetts Public Schools
 Student Mobility Rates in Massachusetts Public Schools Introduction The Massachusetts Department of Elementary and Secondary Education (ESE) calculates and reports mobility rates as part of its overall
National Survey of Student Engagement (NSSE)
") National Survey of Student Engagement (NSSE) (First-Year and Senior Students) Response Rates: Spring 2003 51% Spring 2007 79% Spring 2010 64% Spring 2014 60% This is a facsimile of the U.S. English version
National Survey of Student Engagement (NSSE) (First-Year and Senior Students) Response Rates: Spring 2003 51% Spring 2007 79% Spring 2010 64% Spring 2014 60% This is a facsimile of the U.S. English version
STEM Academy Workshops Evaluation
 OFFICE OF INSTITUTIONAL RESEARCH RESEARCH BRIEF #882 August 2015 STEM Academy Workshops Evaluation By Daniel Berumen, MPA Introduction The current report summarizes the results of the research activities
NATIONAL SURVEY OF STUDENT ENGAGEMENT
 NATIONAL SURVEY OF STUDENT ENGAGEMENT (NSSE 2004 Results) Perspectives from USM First-Year and Senior Students Office of Academic Assessment University of Southern Maine Portland Campus 780-4383 Fall 2004
Evaluation of Teach For America:
 EA15-536-2 Evaluation of Teach For America: 2014-2015 Department of Evaluation and Assessment Mike Miles Superintendent of Schools This page is intentionally left blank. ii Evaluation of Teach For America:
Educational Attainment
 A Demographic and Socio-Economic Profile of Allen County, Indiana based on the 2010 Census and the American Community Survey Educational Attainment A Review of Census Data Related to the Educational Attainment
An Empirical Analysis of the Effects of Mexican American Studies Participation on Student Achievement within Tucson Unified School District
 An Empirical Analysis of the Effects of Mexican American Studies Participation on Student Achievement within Tucson Unified School District Report Submitted June 20, 2012, to Willis D. Hawley, Ph.D., Special
Los Angeles City College Student Equity Plan. Signature Page
 Los Angeles City College Student Equity Plan Signature Page Los Angeles Community College Los Angeles City College President, Board of Trustees Date District Chancellor: College President: Academic Senate
KENT STATE UNIVERSITY
 KENT STATE UNIVERSITY Regents STARTALK Teacher Leadership Academy: Chinese, Russian Director: Brian J. Baer / Co-director: Theresa A. Minick Program Dates: Thursday, July 7 - Saturday, July 16 Summer 2016
John F. Kennedy Middle School
 John F. Kennedy Middle School CUPERTINO UNION SCHOOL DISTRICT Steven Hamm, Principal hamm_steven@cusdk8.org School Address: 821 Bubb Rd. Cupertino, CA 95014-4938 (408) 253-1525 CDS Code: 43-69419-6046890
Missouri 4-H University of Missouri 4-H Center for Youth Development
 Missouri 4-H University of Missouri 4-H Center for Youth Development Missouri 4-H Key Award Purpose To Encourage: A quality educational programs for all members. A safe environment where all youth feel
University of Utah. 1. Graduation-Rates Data a. All Students. b. Student-Athletes
 University of Utah FRESHMAN-COHORT GRADUATION RATES All Students Student-Athletes # 2009-10 Graduation Rate 64% 64% Four-Class Average 61% 64% Student-Athlete Graduation Success Rate 87% 1. Graduation-Rates
Shelters Elementary School
 Shelters Elementary School August 2, 24 Dear Parents and Community Members: We are pleased to present you with the (AER) which provides key information on the 23-24 educational progress for the Shelters
Organization Profile
 Preview Form This is an example of the application questions with which you will be presented. It is recommended that you compose the answers to the paragraph questions in a word processing program and
2005 National Survey of Student Engagement: Freshman and Senior Students at. St. Cloud State University. Preliminary Report.
 National Survey of Student Engagement: Freshman and Senior Students at St. Cloud State University Preliminary Report (December, ) Institutional Studies and Planning National Survey of Student Engagement
National Survey of Student Engagement (NSSE) Temple University 2016 Results
 Temple University 2016 Results") Introduction The National Survey of Student Engagement (NSSE) is administered by hundreds of colleges and universities every year (560 in 2016), and is designed to measure the amount of time and effort
Introduction The National Survey of Student Engagement (NSSE) is administered by hundreds of colleges and universities every year (560 in 2016), and is designed to measure the amount of time and effort
Application and Admission Process
 Application and Admission Process The Graziadio School seeks students with excellent academic and career potential, highly motivated self-starters who thrive on challenge. We carefully select each new
Updated: December Educational Attainment
 Updated: Educational Attainment Among 25- to 29-year olds, the proportions who have attained a high school education, some college, or a bachelor s degree are all rising, according to longterm trends.
Undergraduates Views of K-12 Teaching as a Career Choice
 Undergraduates Views of K-12 Teaching as a Career Choice A Report Prepared for The Professional Educator Standards Board Prepared by: Ana M. Elfers Margaret L. Plecki Elise St. John Rebecca Wedel University
File Print Created 11/17/2017 6:16 PM 1 of 10
 Success - Key Measures Graduation Rate: 4-, 5-, and 6-Year 9. First-time, full-time entering, degree-seeking, students enrolled in a minimum of 12 SCH their first fall semester who have graduated from
Cooper Upper Elementary School
 LIVONIA PUBLIC SCHOOLS http://cooper.livoniapublicschools.org 215-216 Annual Education Report BOARD OF EDUCATION 215-16 Colleen Burton, President Dianne Laura, Vice President Tammy Bonifield, Secretary
What Is The National Survey Of Student Engagement (NSSE)?
?") National Survey of Student Engagement (NSSE) 2000 Results for Montclair State University What Is The National Survey Of Student Engagement (NSSE)? US News and World Reports Best College Survey is due next
National Survey of Student Engagement (NSSE) 2000 Results for Montclair State University What Is The National Survey Of Student Engagement (NSSE)? US News and World Reports Best College Survey is due next
Frank Phillips College. Accountability Report
 Frank Phillips College Accountability Report January 2016 Accountability System, January 2016 1 of 22 Participation - Key Measures Enrollment 1. Fall Headcount (Unduplicated) Fall 2000 Fall 2014 Fall 2015
World s Best Workforce Plan
 2017-18 World s Best Workforce Plan District or Charter Name: PiM Arts High School, 4110-07 Contact Person Name and Position Matt McFarlane, Executive Director In accordance with Minnesota Statutes, section
The Demographic Wave: Rethinking Hispanic AP Trends
 The Demographic Wave: Rethinking Hispanic AP Trends Kelcey Edwards & Ellen Sawtell AP Annual Conference, Las Vegas, NV July 19, 2013 Exploring the Data Hispanic/Latino US public school graduates The Demographic
UK Institutional Research Brief: Results of the 2012 National Survey of Student Engagement: A Comparison with Carnegie Peer Institutions
 UK Institutional Research Brief: Results of the 2012 National Survey of Student Engagement: A Comparison with Carnegie Peer Institutions November 2012 The National Survey of Student Engagement (NSSE) has
Graduate Division Annual Report Key Findings
 Graduate Division 2010 2011 Annual Report Key Findings Trends in Admissions and Enrollment 1 Size, selectivity, yield UCLA s graduate programs are increasingly attractive and selective. Between Fall 2001
Coming in. Coming in. Coming in
 212-213 Report Card for Glenville High School SCHOOL DISTRICT District results under review by the Ohio Department of Education based upon 211 findings by the Auditor of State. Achievement This grade combines
Wisconsin 4 th Grade Reading Results on the 2015 National Assessment of Educational Progress (NAEP)
") Wisconsin 4 th Grade Reading Results on the 2015 National Assessment of Educational Progress (NAEP) Main takeaways from the 2015 NAEP 4 th grade reading exam: Wisconsin scores have been statistically flat
Wisconsin 4 th Grade Reading Results on the 2015 National Assessment of Educational Progress (NAEP) Main takeaways from the 2015 NAEP 4 th grade reading exam: Wisconsin scores have been statistically flat
Strategic Plan Dashboard Results. Office of Institutional Research and Assessment
 29-21 Strategic Plan Dashboard Results Office of Institutional Research and Assessment Binghamton University Office of Institutional Research and Assessment Definitions Fall Undergraduate and Graduate
APPLICANT INFORMATION. Area Code: Phone: Area Code: Phone:
 MARQUETTE UNIVERSITY HEALTH CAREERS OPPORTUNITY PROGRAM College Science Enrichment Program (CSEP) & Pre-Enrollment Support Program (PESP) Website: http://www.mu.edu/hcop INSTRUCTIONS: Please type or print
SASKATCHEWAN MINISTRY OF ADVANCED EDUCATION
 SASKATCHEWAN MINISTRY OF ADVANCED EDUCATION Report March 2017 Report compiled by Insightrix Research Inc. 1 3223 Millar Ave. Saskatoon, Saskatchewan T: 1-866-888-5640 F: 1-306-384-5655 Table of Contents
This survey is intended for Pitt Public Health graduates from December 2013, April 2014, June 2014, and August EOH: MPH. EOH: PhD.
 Pitt Public Health Exit Survey This survey will ask you questions about your program and the services provided by the Office of Student Affairs, as well as your overall assessment of the Graduate School
Application for Full-Time Freshman Admission
 Application for Full-Time Freshman Admission About You Biographical Information Name Fill in legal name exactly as it appears on official documents. Are you a New York State resident? First/given name
SFY 2017 American Indian Opportunities and Industrialization Center (AIOIC) Equity Direct Appropriation
 Equity Direct Appropriation") SFY 2017 American Indian Opportunities and Industrialization Center (AIOIC) Equity Direct Appropriation Report to the Legislature as required by 2016 Minnesota Session Laws, Chapter 189, H.F. 2749, Article
SFY 2017 American Indian Opportunities and Industrialization Center (AIOIC) Equity Direct Appropriation Report to the Legislature as required by 2016 Minnesota Session Laws, Chapter 189, H.F. 2749, Article
Bellevue University Admission Application
 Bellevue University Admission Application Bellevue University is an open admissions university. Once you submit your application, we will begin the process of evaluating your credits and developing your
Principal vacancies and appointments
 Principal vacancies and appointments 2009 10 Sally Robertson New Zealand Council for Educational Research NEW ZEALAND COUNCIL FOR EDUCATIONAL RESEARCH TE RŪNANGA O AOTEAROA MŌ TE RANGAHAU I TE MĀTAURANGA
Table of Contents. Internship Requirements 3 4. Internship Checklist 5. Description of Proposed Internship Request Form 6. Student Agreement Form 7
 Table of Contents Section Page Internship Requirements 3 4 Internship Checklist 5 Description of Proposed Internship Request Form 6 Student Agreement Form 7 Consent to Release Records Form 8 Internship
Cooper Upper Elementary School
 LIVONIA PUBLIC SCHOOLS www.livoniapublicschools.org/cooper 213-214 BOARD OF EDUCATION 213-14 Mark Johnson, President Colleen Burton, Vice President Dianne Laura, Secretary Tammy Bonifield, Trustee Dan
Psychometric Research Brief Office of Shared Accountability
 August 2012 Psychometric Research Brief Office of Shared Accountability Linking Measures of Academic Progress in Mathematics and Maryland School Assessment in Mathematics Huafang Zhao, Ph.D. This brief
Lesson M4. page 1 of 2
 Lesson M4 page 1 of 2 Miniature Gulf Coast Project Math TEKS Objectives 111.22 6b.1 (A) apply mathematics to problems arising in everyday life, society, and the workplace; 6b.1 (C) select tools, including
Annual Report to the Public. Dr. Greg Murry, Superintendent
 Annual Report to the Public Dr. Greg Murry, Superintendent 1 Conway Board of Education Ms. Susan McNabb Mr. Bill Clements Mr. Chuck Shipp Mr. Carl Barger Dr. Adam Lamey Dr. Quentin Washispack Mr. Andre
TRANSFER APPLICATION: Sophomore Junior Senior
 : Sophomore Junior Senior 2714 W Augusta Phone: 773.534.9718 Fax: 773.534.4022 Email: admissions@chiarts.org Web: www.chiarts.org CPS Mail Run: G.S.R. #35 FRESHMAN APPLICATION STEPS Thank you for your
New Jersey Institute of Technology Newark College of Engineering
 New Jersey Institute of Technology Newark College of Engineering AND IN ELECTRICAL AND COMPUTER ENGINEERING Program Review Last Update: Nov. 23, 2005 MISSION STATEMENTS DOCTOR OF PHILOSOPHY IN ELECTRICAL
ILLINOIS DISTRICT REPORT CARD
 -6-525-2- HAZEL CREST SD 52-5 HAZEL CREST SD 52-5 HAZEL CREST, ILLINOIS and federal laws require public school districts to release report cards to the public each year. 2 7 ILLINOIS DISTRICT REPORT CARD
ILLINOIS DISTRICT REPORT CARD
 -6-525-2- Hazel Crest SD 52-5 Hazel Crest SD 52-5 Hazel Crest, ILLINOIS 2 8 ILLINOIS DISTRICT REPORT CARD and federal laws require public school districts to release report cards to the public each year.
University of Arizona
 Annual Report Submission View Questionnaire (Edit) University of Arizona Annual Report Submission for the year 2009. Report has been submitted 1 times. Report was last submitted on 11/30/2009 7:12:09 PM.
Women, Minorities, and Persons with Disabilities in Science and Engineering
 2017 Women, Minorities, and Persons with Disabilities in Science and Engineering Emilda B. Rivers, Deputy Director National Center for Science and Engineering Statistics National Science Foundation www.nsf.gov/statistics
5 Programmatic. The second component area of the equity audit is programmatic. Equity
 5 Programmatic Equity It is one thing to take as a given that approximately 70 percent of an entering high school freshman class will not attend college, but to assign a particular child to a curriculum
BENCHMARK TREND COMPARISON REPORT:
 National Survey of Student Engagement (NSSE) BENCHMARK TREND COMPARISON REPORT: CARNEGIE PEER INSTITUTIONS, 2003-2011 PREPARED BY: ANGEL A. SANCHEZ, DIRECTOR KELLI PAYNE, ADMINISTRATIVE ANALYST/ SPECIALIST
Fostering Equity and Student Success in Higher Education
 Fostering Equity and Student Success in Higher Education Laura I Rendón Professor Emerita University of Texas-San Antonio Presentation at NTCC 22 nd Annual Fall Leadership Conference Gainsesville, TX September
Serving Country and Community: A Study of Service in AmeriCorps. A Profile of AmeriCorps Members at Baseline. June 2001
 Serving Country and Community: A Study of Service in AmeriCorps Cambridge, MA Lexington, MA Hadley, MA Bethesda, MD Washington, DC Chicago, IL Cairo, Egypt Johannesburg, South Africa A Profile of AmeriCorps
Data Diskette & CD ROM
 Data File Format Data Diskette & CD ROM Texas Assessment of Academic Skills Fall 2002 through Summer 2003 Exit Level Test Administrations Attention Macintosh Users To accommodate Macintosh systems a delimiter
The Condition of College & Career Readiness 2016
 The Condition of College and Career Readiness This report looks at the progress of the 16 ACT -tested graduating class relative to college and career readiness. This year s report shows that 64% of students
Sunnyvale Middle School School Accountability Report Card Reported Using Data from the School Year Published During
 Sunnyvale Middle School School Accountability Report Card Reported Using Data from the 2014-15 School Year Published During 2015-16 By February 1 of each year, every school in California is required by
Appendix K: Survey Instrument
 Journal of Southeast Asian American Education and Advancement Volume Article 12 2011 Appendix K: Survey Instrument Wayne E. Wright University of Texas, San Antonio, wewright@purdue.edu Sovicheth Boun The
Office of Institutional Effectiveness 2012 NATIONAL SURVEY OF STUDENT ENGAGEMENT (NSSE) DIVERSITY ANALYSIS BY CLASS LEVEL AND GENDER VISION
 DIVERSITY ANALYSIS BY CLASS LEVEL AND GENDER VISION") Office of Institutional Effectiveness 2012 NATIONAL SURVEY OF STUDENT ENGAGEMENT (NSSE) DIVERSITY ANALYSIS BY CLASS LEVEL AND GENDER VISION We seek to become recognized for providing bright and curious
Office of Institutional Effectiveness 2012 NATIONAL SURVEY OF STUDENT ENGAGEMENT (NSSE) DIVERSITY ANALYSIS BY CLASS LEVEL AND GENDER VISION We seek to become recognized for providing bright and curious
Basic Skills Initiative Project Proposal Date Submitted: March 14, Budget Control Number: (if project is continuing)
") Basic Skills Initiative Project Proposal 2016-2017 Date Submitted: March 14, 2016 Check One: New Proposal: Continuing Project: X Budget Control Number: (if project is continuing) Control # 87-413 - EOPS
Basic Skills Initiative Project Proposal 2016-2017 Date Submitted: March 14, 2016 Check One: New Proposal: Continuing Project: X Budget Control Number: (if project is continuing) Control # 87-413 - EOPS
Student Support Services Evaluation Readiness Report. By Mandalyn R. Swanson, Ph.D., Program Evaluation Specialist. and Evaluation
 Student Support Services Evaluation Readiness Report By Mandalyn R. Swanson, Ph.D., Program Evaluation Specialist and Bethany L. McCaffrey, Ph.D., Interim Director of Research and Evaluation Evaluation
GRADUATE STUDENTS Academic Year
 Financial Aid Information for GRADUATE STUDENTS Academic Year 2017-2018 Your Financial Aid Award This booklet is designed to help you understand your financial aid award, policies for receiving aid and
The following resolution is presented for approval to the Board of Trustees. RESOLUTION 16-
 1. Adoption of Wright State 2016 Campus Completion Plan The following resolution is presented for approval to the Board of Trustees. RESOLUTION 16- WHEREAS, Section 3345.81 of the Ohio Revised Code requires
https://secure.aacte.org/apps/peds/print_all_forms.php?view=report&prin...
 1 of 35 4/25/2012 9:56 AM A» 2011 PEDS» Institutional Data inst id: 3510 Institutional Data A_1 Institutional Information This information will be used in all official references to your institution. Institution
California State University, Los Angeles TRIO Upward Bound & Upward Bound Math/Science
 Application must be completed in black or blue ink only. STUDENT INFORMATION Name: Social Security # - - First Middle Last Address: Apt.# Phone: ( ) City: State: Zip Code: Date of Birth: Place of Birth:
(Includes a Detailed Analysis of Responses to Overall Satisfaction and Quality of Academic Advising Items) By Steve Chatman
 By Steve Chatman") Report #202-1/01 Using Item Correlation With Global Satisfaction Within Academic Division to Reduce Questionnaire Length and to Raise the Value of Results An Analysis of Results from the 1996 UC Survey
Report #202-1/01 Using Item Correlation With Global Satisfaction Within Academic Division to Reduce Questionnaire Length and to Raise the Value of Results An Analysis of Results from the 1996 UC Survey
46 Children s Defense Fund
 Nationally, about 1 in 15 teens ages 16 to 19 is a dropout. Fewer than two-thirds of 9 th graders in Florida, Georgia, Louisiana and Nevada graduate from high school within four years with a regular diploma.
Bachelor of Arts in Gender, Sexuality, and Women's Studies
 Bachelor of Arts in Gender, Sexuality, and Women's Studies 1 Bachelor of Arts in Gender, Sexuality, and Women's Studies Summary of Degree Requirements University Requirements: MATH 0701 (4 s.h.) and/or
Freshman Admission Application 2016
 We are pleased that you have requested application materials from Governors State University. We recommend that you review all program requirements carefully. Major requirements may vary. Please review
EDUCATING TEACHERS FOR CULTURAL AND LINGUISTIC DIVERSITY: A MODEL FOR ALL TEACHERS
 New York State Association for Bilingual Education Journal v9 p1-6, Summer 1994 EDUCATING TEACHERS FOR CULTURAL AND LINGUISTIC DIVERSITY: A MODEL FOR ALL TEACHERS JoAnn Parla Abstract: Given changing demographics,
A Guide to Finding Statistics for Students
 San Joaquin Valley Statistics http://pegasi.us/sjstats/ 1 of 2 6/12/2010 5:00 PM A Guide to Finding Statistics for Students CV Stats Home By Topic By Area About the Valley About this Site Population Agriculture
1.0 INTRODUCTION. The purpose of the Florida school district performance review is to identify ways that a designated school district can:
 1.0 INTRODUCTION 1.1 Overview Section 11.515, Florida Statutes, was created by the 1996 Florida Legislature for the purpose of conducting performance reviews of school districts in Florida. The statute
Race, Class, and the Selective College Experience
 Race, Class, and the Selective College Experience Thomas J. Espenshade Alexandria Walton Radford Chang Young Chung Office of Population Research Princeton University December 15, 2009 1 Overview of NSCE
A Snapshot of the Graduate School
 A Snapshot of the Graduate School Prepared for the Research Council February 6, 2009 John R. Mullin, Ph.D., FAICP Dean of the Graduate School University of Massachusetts Amherst Graduate School Purpose
Kansas Adequate Yearly Progress (AYP) Revised Guidance
 Revised Guidance") Kansas State Department of Education Kansas Adequate Yearly Progress (AYP) Revised Guidance Based on Elementary & Secondary Education Act, No Child Left Behind (P.L. 107-110) Revised May 2010 Revised May
Kansas State Department of Education Kansas Adequate Yearly Progress (AYP) Revised Guidance Based on Elementary & Secondary Education Act, No Child Left Behind (P.L. 107-110) Revised May 2010 Revised May
SCHOOL. Wake Forest '93. Count
 Count ID 43 256 VALID N 256 Q.1A ACTIVITIES YEAR FOLLOWING GRADUATION? Primary Employed full-time 157 61.6% Employed part-time 12 4.7% Unemployed, by choice 3 1.2% Unemployed, seeking employment 7 2.7%
Idaho Public Schools
 Advanced Placement: Student Participation 13.5% increase in the number of students participating between 25 and 26 In 26: 3,79 Idaho Public School Students took AP Exams In 25: 3,338 Idaho Public School
ACHE DATA ELEMENT DICTIONARY as of October 6, 1998
 ACHE DATA ELEMENT DICTIONARY as of October 6, 1998 Element Title: Reference Numbers: Institution FICE Code FICE ST010, GR010 The identification number for each reporting institution will be the institution's
SMILE Noyce Scholars Program Application
 ONLINE POST-BABACCALAUREATE TEACHER PREPARATION PROGRAM SMILE yce Scholars Program Application Introduction: Rio Salado College is soliciting applicants for the Science and Math Innovative Learning Environments
Meeting these requirements does not guarantee admission to the program.
 .Eastern Connecticut State University, School of Education & Professional Studies Committee on Admission and Retention in Education (CARE) UNDERGRADUATE ELEMENTARY Teacher Certification Application Application
Raw Data Files Instructions
 Raw Data Files Instructions Colleges will report the above information for students in the Main Cohort for each of the reporting timeframes and the system will calculate the sub cohorts and metrics based
12-month Enrollment
 12-month Enrollment 2016-17 Institution: Potomac State College of West Virginia University (237701) Overview 12-month Enrollment Overview The 12-Month Enrollment component collects unduplicated student
NATIONAL SURVEY OF STUDENT ENGAGEMENT
 NATIONAL SURVEY OF STUDENT ENGAGEMENT 2010 Benchmark Comparisons Report OFFICE OF INSTITUTIONAL RESEARCH & PLANNING To focus discussions about the importance of student engagement and to guide institutional
School Performance Plan Middle Schools
 SY 2012-2013 School Performance Plan Middle Schools 734 Middle ALternative Program @ Lombard, Principal Roger Shaw (Interim), Executive Director, Network Facilitator PLEASE REFER TO THE SCHOOL PERFORMANCE
Section V Reclassification of English Learners to Fluent English Proficient
 Section V Reclassification of English Learners to Fluent English Proficient Understanding Reclassification of English Learners to Fluent English Proficient Decision Guide: Reclassifying a Student from
Long Beach Unified School District
 Long Beach Unified School District Male Academy Closing The Achievement Gap Targeted Intervention College Board A Dream Deferred The Future of African American Education Conference April 25, 2012 Presented