Transitioning to New Science Standards: Targeted Support for Elementary Teachers. Participant s Guide
|
|
|
- Amber Price
- 5 years ago
- Views:
Transcription

1 Transitioning to New Science Standards: Targeted Support for Elementary Teachers Participant s Guide
2 Transitioning to New Science Standards: Targeted Support for Elementary Teachers Day 1 Objective: Participants will be provided with an opportunity to learn the new Arkansas K-12 Science Standards and develop an understanding of science and engineering practices with the focus on the practice of Developing and Using Models. Agenda Morning Survey Overview of NGSS: How do I read and understand the structure of NGSS? Connecting the Elements: 3-Dimensional Learning Tale of Two GOOD Classrooms Recognizing the Practices in Instruction Afternoon KLEWS Chart Sideways Force Investigation Use Models to Predict & Develop Evidence Textual Evidence Gots and Needs Exit Slip Day 2 Objectives: Participants will able to define and provide examples of Practice Six (Constructing Explanations and Designing Solutions) and Practice Seven (Engaging in Argument from Evidence). Participants will increase their understanding of the coherence between ELA and science practices. Agenda Morning Review Gots and Needs Pre-Assess Practices Six and Seven Pendulum Experience and Investigation Create a Scientific Explanation Afternoon Tweak the Scientific Explanation Fishbowl Examine Scientific Explanations ELA Connections Progressions of Practices Six and Seven Gots and Needs Exit Slip 1
3 Day 3 Objectives: Participants will be able to support sense-making in students by creating prompts to elicit productive student thinking in the domains of prior knowledge, gathering data, making sense of data, and metacognition. Agenda Morning Review Gots and Needs, Share Goal for the Day Focusing on the Essences of Thinking: Prior Knowledge, Gathering Data, Making Sense of Data, and Metacognition Afternoon Focusing on Types of Student Work Creating Prompts to Elicit Student Thinking Planning for Implementation Post-Survey 2
4 Participant Handouts Table of Contents Day One Pg # Three Dimensions of the Framework for K-12 Science Education from NGSS@NSTA 4 Progressions of the Science & Engineering Practices from NGSS@NSTA 6 Performance Expectation for 4-PS3 Energy 14 Vignette A. Mr. Cole 15 Vignette B. Ms. Rivera 17 Forces and Motion Formative Assessment 20 Sideways Forces and Rolling Objects Textual Evidence 21 Engaging Students in Scientific Practices: What does constructing and revising models 23 look like in the classroom? Day Two Practice Six and Seven Definition from Appendix F of NGSS 27 Pairs Read Strategy 28 Pendulum Reading 29 Framework for Scientific Explanation 31 Sample CER Rubric 33 Carousel/Gallery Walk Strategy 34 Adapted Language Frames for Argumentation in Science 36 Fishbowl Strategy 37 Sample Scientific Explanations 38 Compare CCSS ELA and NGSS Practice 7 39 Day 3 Student Composition Notebook Sample (16 pages) 40 How People Learn 56 Cell Notebook Entry 57 Magnet Notebook Entry 60 Shadow Notebook Entry 62 Student Notebook Entry Types with eight student examples 65 Some Prompts and Mechanisms for Eliciting Student Thinking 75 Implementation Form 77 3
5 Three Dimensions of the Framework for K-12 Science Education Being Used to Develop the Next Generation Science Standards (NGSS) Asking Questions and Defining Problems A practice of science is to ask and refine questions that lead to descriptions and explanations of how the natural and designed world works and which can be empirically tested. Engineering questions clarify problems to determine criteria for successful solutions and identify constraints to solve problems about the designed world. Both scientists and engineers also ask questions to clarify the ideas of others. Planning and Carrying Out Investigations Scientists and engineers plan and carry out investigations in the field or laboratory, working collaboratively as well as individually. Their investigations are systematic and require clarifying what counts as data and identifying variables or parameters. Engineering investigations identify the effectiveness, efficiency, and durability of designs under different conditions. Analyzing and Interpreting Data Scientific investigations produce data that must be analyzed in order to derive meaning. Because data patterns and trends are not always obvious, scientists use a range of tools including tabulation, graphical interpretation, visualization, and statistical analysis to identify the significant features and patterns in the data. Scientists identify sources of error in the investigations and calculate the degree of certainty in the results. Modern technology makes the collection of large data sets much easier, providing secondary sources for analysis. Engineering investigations include analysis of data collected in the tests of designs. This allows comparison of different solutions and determines how well each meets specific design criteria that is, which design best solves the problem within given constraints. Like scientists, engineers require a range of tools to identify patterns within data and interpret the results. Advances in science make analysis of proposed solutions more efficient and effective. Scientific and Engineering Practices Developing and Using Models A practice of both science and engineering is to use and construct models as helpful tools for representing ideas and explanations. These tools include diagrams, drawings, physical replicas, mathematical representations, analogies, and computer simulations. Modeling tools are used to develop questions, predictions and explanations; analyze and identify flaws in systems; and communicate ideas. Models are used to build and revise scientific explanations and proposed engineered systems. Measurements and observations are used to revise models and designs. Constructing Explanations and Designing Solutions The products of science are explanations and the products of engineering are solutions. The goal of science is the construction of theories that provide explanatory accounts of the world. A theory becomes accepted when it has multiple lines of empirical evidence and greater explanatory power of phenomena than previous theories. The goal of engineering design is to find a systematic solution to problems that is based on scientific knowledge and models of the material world. Each proposed solution results from a process of balancing competing criteria of desired functions, technical feasibility, cost, safety, aesthetics, and compliance with legal requirements. The optimal choice depends on how well the proposed solutions meet criteria and constraints. Engaging in Argument from Evidence Argumentation is the process by which explanations and solutions are reached. In science and engineering, reasoning and argument based on evidence are essential to identifying the best explanation for a natural phenomenon or the best solution to a design problem. Scientists and engineers use argumentation to listen to, compare, and evaluate competing ideas and methods based on merits. Scientists and engineers engage in argumentation when investigating a phenomenon, testing a design solution, resolving questions about measurements, building data models, and using evidence to identify strengths and weaknesses of claims. Using Mathematics and Computational Thinking In both science and engineering, mathematics and computation are fundamental tools for representing physical variables and their relationships. They are used for a range of tasks such as constructing simulations; statistically analyzing data; and recognizing, expressing, and applying quantitative relationships. Mathematical and computational approaches enable scientists and engineers to predict the behavior of systems and test the validity of such predictions. Statistical methods are frequently used to identify significant patterns and establish correlational relationships. Obtaining, Evaluating, and Communicating Information Scientists and engineers must be able to communicate clearly and persuasively the ideas and methods they generate. Critiquing and communicating ideas individually and in groups is a critical professional activity. Communicating information and ideas can be done in multiple ways: using tables, diagrams, graphs, models, and equations as well as orally, in writing, and through extended discussions. Scientists and engineers employ multiple sources to acquire information that is used to evaluate the merit and validity of claims, methods, and designs. 4 Developed by NSTA based on content from the Framework for K-12 Science Education and supporting documents for the May 2012 Public Draft of the NGSS
6 Disciplinary Core Ideas in Physical Science Disciplinary Core Ideas in Life Science Disciplinary Core Ideas in Earth and Space Science Disciplinary Core Ideas in Engineering, Technology, and the Application of Science PS1: Matter and Its Interactions PS1.A: Structure and Properties of Matter PS1.B: Chemical Reactions PS1.C: Nuclear Processes PS2: Motion and Stability: Forces and Interactions PS2.A: Forces and Motion PS2.B: Types of Interactions PS2.C: Stability and Instability in Physical Systems PS3: Energy PS3.A: Definitions of Energy PS3.B: Conservation of Energy and Energy Transfer PS3.C: Relationship Between Energy and Forces PS3.D: Energy in Chemical Processes and Everyday Life PS4: Waves and Their Applications in Technologies for Information Transfer PS4.A: Wave Properties PS4.B: Electromagnetic Radiation PS4.C: Information Technologies and Instrumentation LS1: From Molecules to Organisms: Structures and Processes LS1.A: Structure and Function LS1.B: Growth and Development of Organisms LS1.C: Organization for Matter and Energy Flow in Organisms LS1.D: Information Processing LS2: Ecosystems: Interactions, Energy, and Dynamics LS2.A: Interdependent Relationships in Ecosystems LS2.B: Cycles of Matter and Energy Transfer in Ecosystems LS2.C: Ecosystem Dynamics, Functioning, and Resilience LS2.D: Social Interactions and Group Behavior LS3: Heredity: Inheritance and Variation of Traits LS3.A: Inheritance of Traits LS3.B: Variation of Traits LS4: Biological Evolution: Unity and Diversity LS4.A: Evidence of Common Ancestry and Diversity LS4.B: Natural Selection LS4.C: Adaptation LS4.D: Biodiversity and Humans ESS1: Earth s Place in the Universe ESS1.A: The Universe and Its Stars ESS1.B: Earth and the Solar System ESS1.C: The History of Planet Earth ESS2: Earth s Systems ESS2.A: Earth Materials and Systems ESS2.B: Plate Tectonics and Large-Scale System Interactions ESS2.C: The Roles of Water in Earth s Surface Processes ESS2.D: Weather and Climate ESS2.E: Biogeology ESS3: Earth and Human Activity ESS3.A: Natural Resources ESS3.B: Natural Hazards ESS3.C: Human Impacts on Earth Systems ESS3.D: Global Climate Change ETS1: Engineering Design ETS1.A: Defining and Delimiting an Engineering Problem ETS1.B: Developing Possible Solutions ETS1.C: Optimizing the Design Solution ETS2: Links Among Engineering, Technology, Science, and Society ETS2.A: Interdependence of Science, Engineering, and Technology ETS2.B: Influence of Engineering, Technology, and Science on Society and the Natural World 5 Patterns Observed patterns of forms and events guide organization and classification, and they prompt questions about relationships and the factors that influence them. Cause and Effect: Mechanism and Explanation Events have causes, sometimes simple, sometimes multifaceted. A major activity of science is investigating and explaining causal relationships and the mechanisms by which they are mediated. Such mechanisms can then be tested across given contexts and used to predict and explain events in new contexts. Crosscutting Concepts Scale, Proportion, and Quantity In considering phenomena, it is critical to recognize what is relevant at different measures of size, time, and energy and to recognize how changes in scale, proportion, or quantity affect a system s structure or performance. Systems and System Models Defining the system under study specifying its boundaries and making explicit a model of that system provides tools for understanding and testing ideas that are applicable throughout science and engineering. Energy and Matter: Flows, Cycles, and Conservation Tracking fluxes of energy and matter into, out of, and within systems helps one understand the systems possibilities and limitations. Structure and Function The way in which an object or living thing is shaped and its substructure determine many of its properties and functions. Stability and Change For natural and built systems alike, conditions of stability and determinants of rates of change or evolution of a system are critical elements of study.
7 Science & Engineering Practices Asking Questions and Defining Problems A practice of science is to ask and refine questions that lead to descriptions and explanations of how the natural and designed world(s) works and which can be empirically tested. Engineering questions clarify problems to determine criteria for successful solutions and identify constraints to solve problems about the designed world. Both scientists and engineers also ask questions to clarify ideas. K 2 Condensed Practices 3 5 Condensed Practices 6 8 Condensed Practices 9 12 Condensed Practices Asking questions and defining problems in K 2 builds on prior experiences and progresses to simple descriptive questions that can be tested. Ask questions based on observations to find more information about the natural and/or designed world(s). Asking questions and defining problems in 3 5 builds on K 2 experiences and progresses to specifying qualitative relationships. Ask questions about what would happen if a variable is changed. Asking questions and defining problems in 6 8 builds on K 5 experiences and progresses to specifying relationships between variables, clarify arguments and models. Ask questions that arise from careful observation of phenomena, models, or unexpected results, to clarify and/or seek additional information. Ask questions to identify and/or clarify evidence and/or the premise(s) of an argument. Ask questions to determine relationships between independent and dependent variables and relationships in models.. Ask questions to clarify and/or refine a model, an explanation, or an engineering problem. Asking questions and defining problems in 9 12 builds on K 8 experiences and progresses to formulating, refining, and evaluating empirically testable questions and design problems using models and simulations. Ask questions that arise from careful observation of phenomena, or unexpected results, to clarify and/or seek additional information. Ask questions that arise from examining models or a theory, to clarify and/or seek additional information and relationships. Ask questions to determine relationships, including quantitative relationships, between independent and dependent variables. Ask questions to clarify and refine a model, an explanation, or an engineering problem. Ask and/or identify questions that can be answered by an investigation. Identify scientific (testable) and non-scientific (non-testable) questions. Ask questions that can be investigated and predict reasonable outcomes based on patterns such as cause and effect relationships. Ask questions that require sufficient and appropriate empirical evidence to answer. Ask questions that can be investigated within the scope of the classroom, outdoor environment, and museums and other public facilities with available resources and, when appropriate, frame a hypothesis based on observations and scientific principles. Evaluate a question to determine if it is testable and relevant. Ask questions that can be investigated within the scope of the school laboratory, research facilities, or field (e.g., outdoor environment) with available resources and, when appropriate, frame a hypothesis based on a model or theory. 6 Ask questions that challenge the premise(s) of an argument or the interpretation of a data set. Ask and/or evaluate questions that challenge the premise(s) of an argument, the interpretation of a data set, or the suitability of the design. Define a simple problem that can be solved through the development of a new or improved object or tool. Use prior knowledge to describe problems that can be solved. Define a simple design problem that can be solved through the development of an object, tool, process, or system and includes several criteria for success and constraints on materials, time, or cost. Define a design problem that can be solved through the development of an object, tool, process or system and includes multiple criteria and constraints, including scientific knowledge that may limit possible solutions. Define a design problem that involves the development of a process or system with interacting components and criteria and constraints that may include social, technical and/or environmental considerations. Developed by NSTA using information from Appendix F of the Next Generation Science Standards 2011, 2012, 2013 Achieve, Inc.
8 7 Science & Engineering Practices Developing and Using Models A practice of both science and engineering is to use and construct models as helpful tools for representing ideas and explanations. These tools include diagrams, drawings, physical replicas, mathematical representations, analogies, and computer simulations. Modeling tools are used to develop questions, predictions and explanations; analyze and identify flaws in systems; and communicate ideas. Models are used to build and revise scientific explanations and proposed engineered systems. Measurements and observations are used to revise models and designs. K 2 Condensed Practices 3 5 Condensed Practices 6 8 Condensed Practices 9 12 Condensed Practices Modeling in K 2 builds on prior experiences and progresses to include using and developing models (i.e., diagram, drawing, physical replica, diorama, dramatization, or storyboard) that represent concrete events or design solutions. Modeling in 3 5 builds on K 2 experiences and progresses to building and revising simple models and using models to represent events and design solutions. Modeling in 6 8 builds on K 5 experiences and progresses to developing, using, and revising models to describe, test, and predict more abstract phenomena and design systems. Modeling in 9 12 builds on K 8 experiences and progresses to using, synthesizing, and developing models to predict and show relationships among variables between systems and their components in the natural and designed world(s). Distinguish between a model and the actual object, process, and/or events the model represents. Compare models to identify common features and differences. Identify limitations of models. Evaluate limitations of a model for a proposed object or tool. Evaluate merits and limitations of two different models of the same proposed tool, process, mechanism, or system in order to select or revise a model that best fits the evidence or design criteria. Design a test of a model to ascertain its reliability. Develop and/or use a model to represent amounts, relationships, relative scales (bigger, smaller), and/or patterns in the natural and designed world(s). Collaboratively develop and/or revise a model based on evidence that shows the relationships among variables for frequent and regular occurring events. Develop a model using an analogy, example, or abstract representation to describe a scientific principle or design solution. Develop and/or use models to describe and/or predict phenomena. Develop or modify a model based on evidence to match what happens if a variable or component of a system is changed. Use and/or develop a model of simple systems with uncertain and less predictable factors. Develop and/or revise a model to show the relationships among variables, including those that are not observable but predict observable phenomena. Develop and/or use a model to predict and/or describe phenomena. Develop a model to describe unobservable mechanisms. Develop, revise, and/or use a model based on evidence to illustrate and/or predict the relationships between systems or between components of a system. Develop and/or use multiple types of models to provide mechanistic accounts and/or predict phenomena, and move flexibly between model types based on merits and limitations. Develop a simple model based on evidence to represent a proposed object or tool. Develop a diagram or simple physical prototype to convey a proposed object, tool, or process. Use a model to test cause and effect relationships or interactions concerning the functioning of a natural or designed system. Develop and/or use a model to generate data to test ideas about phenomena in natural or designed systems, including those representing inputs and outputs, and those at unobservable scales. Develop a complex model that allows for manipulation and testing of a proposed process or system. Develop and/or use a model (including mathematical and computational) to generate data to support explanations, predict phenomena, analyze systems, and/or solve problems. Developed by NSTA using information from Appendix F of the Next Generation Science Standards 2011, 2012, 2013 Achieve, Inc.
9 Science & Engineering Practices Planning and Carrying Out Investigations Scientists and engineers plan and carry out investigations in the field or laboratory, working collaboratively as well as individually. Their investigations are systematic and require clarifying what counts as data and identifying variables or parameters. Engineering investigations identify the effectiveness, efficiency, and durability of designs under different conditions. K 2 Condensed Practices 3 5 Condensed Practices 6 8 Condensed Practices 9 12 Condensed Practices Planning and carrying out investigations to answer questions or test solutions to problems in K 2 builds on prior experiences and progresses to simple investigations, based on fair tests, which provide data to support explanations or design solutions. With guidance, plan and conduct an investigation in collaboration with peers (for K). Plan and conduct an investigation collaboratively to produce data to serve as the basis for evidence to answer a question. Evaluate different ways of observing and/or measuring a phenomenon to determine which way can answer a question. Make observations (firsthand or from media) and/or measurements to collect data that can be used to make comparisons. Make observations (firsthand or from media) and/or measurements of a proposed object or tool or solution to determine if it solves a problem or meets a goal. Make predictions based on prior experiences. Planning and carrying out investigations to answer questions or test solutions to problems in 3 5 builds on K 2 experiences and progresses to include investigations that control variables and provide evidence to support explanations or design solutions. Plan and conduct an investigation collaboratively to produce data to serve as the basis for evidence, using fair tests in which variables are controlled and the number of trials considered. Evaluate appropriate methods and/or tools for collecting data. Make observations and/or measurements to produce data to serve as the basis for evidence for an explanation of a phenomenon or test a design solution. Make predictions about what would happen if a variable changes. Test two different models of the same proposed object, tool, or process to determine which better meets criteria for success. Planning and carrying out investigations in 6-8 builds on K-5 experiences and progresses to include investigations that use multiple variables and provide evidence to support explanations or solutions. Plan an investigation individually and collaboratively, and in the design: identify independent and dependent variables and controls, what tools are needed to do the gathering, how measurements will be recorded, and how many data are needed to support a claim. Conduct an investigation and/or evaluate and/or revise the experimental design to produce data to serve as the basis for evidence that meet the goals of the investigation. Evaluate the accuracy of various methods for collecting data. Collect data to produce data to serve as the basis for evidence to answer scientific questions or test design solutions under a range of conditions. Collect data about the performance of a proposed object, tool, process, or system under a range of conditions. Developed by NSTA using information from Appendix F of the Next Generation Science Standards 2011, 2012, 2013 Achieve, Inc. Planning and carrying out investigations in 9-12 builds on K-8 experiences and progresses to include investigations that provide evidence for and test conceptual, mathematical, physical, and empirical models. Plan an investigation or test a design individually and collaboratively to produce data to serve as the basis for evidence as part of building and revising models, supporting explanations for phenomena, or testing solutions to problems. Consider possible variables or effects and evaluate the confounding investigation s design to ensure variables are controlled. Plan and conduct an investigation individually and collaboratively to produce data to serve as the basis for evidence, and in the design: decide on types, how much, and accuracy of data needed to produce reliable measurements and consider limitations on the precision of the data (e.g., number of trials, cost, risk, time), and refine the design accordingly. Plan and conduct an investigation or test a design solution in a safe and ethical manner including considerations of environmental, social, and personal impacts. Select appropriate tools to collect, record, analyze, and evaluate data. Make directional hypotheses that specify what happens to a dependent variable when an independent variable is manipulated. Manipulate variables and collect data about a complex model of a proposed process or system to identify failure points or improve performance relative to criteria for success or other variables. 8
10 Science & Engineering Practices Analyzing and Interpreting Data Scientific investigations produce data that must be analyzed in order to derive meaning. Because data patterns and trends are not always obvious, scientists use a range of tools including tabulation, graphical interpretation, visualization, and statistical analysis to identify the significant features and patterns in the data. Scientists identify sources of error in the investigations and calculate the degree of certainty in the results. Modern technology makes the collection of large data sets much easier, providing secondary sources for analysis. Engineering investigations include analysis of data collected in the tests of designs. This allows comparison of different solutions and determines how well each meets specific design criteria that is, which design best solves the problem within given constraints. Like scientists, engineers require a range of tools to identify patterns within data and interpret the results. Advances in science make analysis of proposed solutions more efficient and effective. K 2 Condensed Practices 3 5 Condensed Practices 6 8 Condensed Practices 9 12 Condensed Practices Analyzing data in K 2 builds on prior experiences and progresses to collecting, recording, and sharing observations. Record information (observations, thoughts, and ideas). Use and share pictures, drawings, and/or writings of observations. Use observations (firsthand or from media) to describe patterns and/or relationships in the natural and designed world(s) in order to answer scientific questions and solve problems. Compare predictions (based on prior experiences) to what occurred (observable events). Analyze data from tests of an object or tool to determine if it works as intended. Analyzing data in 3 5 builds on K 2 experiences and progresses to introducing quantitative approaches to collecting data and conducting multiple trials of qualitative observations. When possible and feasible, digital tools should be used. Represent data in tables and/or various graphical displays (bar graphs, pictographs, and/or pie charts) to reveal patterns that indicate relationships. Analyze and interpret data to make sense of phenomena, using logical reasoning, mathematics, and/or computation. different groups in order to discuss similarities and differences in their findings. Analyze data to refine a problem statement or the design of a proposed object, tool, or process. Use data to evaluate and refine design solutions. Analyzing data in 6 8 builds on K 5 experiences and progresses to extending quantitative analysis to investigations, distinguishing between correlation and causation, and basic statistical techniques of data and error analysis. Construct, analyze, and/or interpret graphical displays of data and/or large data sets to identify linear and nonlinear relationships. Use graphical displays (e.g., maps, charts, graphs, and/or tables) of large data sets to identify temporal and spatial relationships. Distinguish between causal and correlational relationships in data. Analyze and interpret data to provide evidence for phenomena. Apply concepts of statistics and probability (including mean, median, mode, and variability) to analyze and characterize data, using digital tools when feasible. Consider limitations of data analysis (e.g., measurement error), and/or seek to improve precision and accuracy of data with better technological tools and methods (e.g., multiple trials). Analyze and interpret data to determine similarities and differences in findings. Analyze data to define an optimal operational range for a proposed object, tool, process or system that best meets criteria for success. Developed by NSTA using information from Appendix F of the Next Generation Science Standards 2011, 2012, 2013 Achieve, Inc. Analyzing data in 9 12 builds on K 8 experiences and progresses to introducing more detailed statistical analysis, the comparison of data sets for consistency, and the use of models to generate and analyze data. Analyze data using tools, technologies, and/or models (e.g., computational, mathematical) in order to make valid and reliable scientific claims or determine an optimal design solution. Apply concepts of statistics and probability (including determining function fits to data, slope, intercept, and correlation coefficient for linear fits) to scientific and engineering questions and problems, using digital tools when feasible. Consider limitations of data analysis (e.g., measurement error, sample selection) when analyzing and interpreting data. Compare and contrast various types of data sets (e.g., self-generated, archival) to examine consistency of measurements and observations. Evaluate the impact of new data on a working explanation and/or model of a proposed process or system. Analyze data to identify design features or characteristics of the components of a proposed process or system to optimize it relative to criteria for success. 9
11 10 Science & Engineering Practices Using Mathematics and Computational Thinking In both science and engineering, mathematics and computation are fundamental tools for representing physical variables and their relationships. They are used for a range of tasks such as constructing simulations; solving equations exactly or approximately; and recognizing, expressing, and applying quantitative relationships. Mathematical and computational approaches enable scientists and engineers to predict the behavior of systems and test the validity of such predictions. K 2 Condensed Practices 3 5 Condensed Practices 6 8 Condensed Practices 9 12 Condensed Practices Mathematical and computational thinking in K 2 builds on prior experience and progresses to recognizing that mathematics can be used to describe the natural and designed world(s). Mathematical and computational thinking in 3 5 builds on K 2 experiences and progresses to extending quantitative measurements to a variety of physical properties and using computation and mathematics to analyze data and compare alternative design solutions. Mathematical and computational thinking in 6 8 builds on K 5 experiences and progresses to identifying patterns in large data sets and using mathematical concepts to support explanations and arguments. Decide when to use qualitative vs. quantitative data. Mathematical and computational thinking in 9-12 builds on K-8 and experiences and progresses to using algebraic thinking and analysis, a range of linear and nonlinear functions including trigonometric functions, exponentials and logarithms, and computational tools for statistical analysis to analyze, represent, and model data. Simple computational simulations are created and used based on mathematical models of basic assumptions. Decide if qualitative or quantitative data are best to determine whether a proposed object or tool meets criteria for success. Use counting and numbers to identify and describe patterns in the natural and designed world(s). Organize simple data sets to reveal patterns that suggest relationships. Use digital tools (e.g., computers) to analyze very large data sets for patterns and trends. Create and/or revise a computational model or simulation of a phenomenon, designed device, process, or system. Describe, measure, and/or compare quantitative attributes of different objects and display the data using simple graphs. Describe, measure, estimate, and/or graph quantities such as area, volume, weight, and time to address scientific and engineering questions and problems. Use mathematical representations to describe and/or support scientific conclusions and design solutions. Use mathematical, computational, and/or algorithmic representations of phenomena or design solutions to describe and/or support claims and/or explanations. Use quantitative data to compare two alternative solutions to a problem. Create and/or use graphs and/or charts generated from simple algorithms to compare alternative solutions to an engineering problem. Create algorithms (a series of ordered steps) to solve a problem. Apply mathematical concepts and/or processes (such as ratio, rate, percent, basic operations, and simple algebra) to scientific and engineering questions and problems. Use digital tools and/or mathematical concepts and arguments to test and compare proposed solutions to an engineering design problem. Apply techniques of algebra and functions to represent and solve scientific and engineering problems. Use simple limit cases to test mathematical expressions, computer programs, algorithms, or simulations of a process or system to see if a model makes sense by comparing the outcomes with what is known about the real world. Apply ratios, rates, percentages, and unit conversions in the context of complicated measurement problems involving quantities with derived or compound units (such as mg/ml, kg/m3, acre-feet, etc.). Developed by NSTA using information from Appendix F of the Next Generation Science Standards 2011, 2012, 2013 Achieve, Inc.
12 Science & Engineering Practices Constructing Explanations and Designing Solutions The end-products of science are explanations and the end-products of engineering are solutions. The goal of science is the construction of theories that provide explanatory accounts of the world. A theory becomes accepted when it has multiple lines of empirical evidence and greater explanatory power of phenomena than previous theories. The goal of engineering design is to find a systematic solution to problems that is based on scientific knowledge and models of the material world. Each proposed solution results from a process of balancing competing criteria of desired functions, technical feasibility, cost, safety, aesthetics, and compliance with legal requirements. The optimal choice depends on how well the proposed solutions meet criteria and constraints. K 2 Condensed Practices 3 5 Condensed Practices 6 8 Condensed Practices 9 12 Condensed Practices Constructing explanations and designing solutions in K 2 builds on prior experiences and progresses to the use of evidence and ideas in constructing evidence-based accounts of natural phenomena and designing solutions. Use information from observations (firsthand and from media) to construct an evidence-based account for natural phenomena. Use tools and/or materials to design and/or build a device that solves a specific problem or a solution to a specific problem. Generate and/or compare multiple solutions to a problem. Constructing explanations and designing solutions in 3 5 builds on K 2 experiences and progresses to the use of evidence in constructing explanations that specify variables that describe and predict phenomena and in designing multiple solutions to design problems. Construct an explanation of observed relationships (e.g., the distribution of plants in the back yard). Use evidence (e.g., measurements, observations, patterns) to construct or support an explanation or design a solution to a problem. Identify the evidence that supports particular points in an explanation. Apply scientific ideas to solve design problems. Generate and compare multiple solutions to a problem based on how well they meet the criteria and constraints of the design solution. Constructing explanations and designing solutions in 6 8 builds on K 5 experiences and progresses to include constructing explanations and designing solutions supported by multiple sources of evidence consistent with scientific ideas, principles, and theories. Construct an explanation that includes qualitative or quantitative relationships between variables that predict(s) and/or describe(s) phenomena. Construct an explanation using models or representations. Construct a scientific explanation based on valid and reliable evidence obtained from sources (including the students own experiments) and the assumption that theories and laws that describe the natural world operate today as they did in the past and will continue to do so in the future. Apply scientific ideas, principles, and/or evidence to construct, revise and/or use an explanation for realworld phenomena, examples, or events. Apply scientific reasoning to show why the data or evidence is adequate for the explanation or conclusion. Apply scientific ideas or principles to design, construct, and/or test a design of an object, tool, process or system. Undertake a design project, engaging in the design cycle, to construct and/or implement a solution that meets specific design criteria and constraints. Optimize performance of a design by prioritizing criteria, making tradeoffs, testing, revising, and retesting. Developed by NSTA using information from Appendix F of the Next Generation Science Standards 2011, 2012, 2013 Achieve, Inc. Constructing explanations and designing solutions in 9 12 builds on K 8 experiences and progresses to explanations and designs that are supported by multiple and independent student-generated sources of evidence consistent with scientific ideas, principles, and theories. Make a quantitative and/or qualitative claim regarding the relationship between dependent and independent variables. Construct and revise an explanation based on valid and reliable evidence obtained from a variety of sources (including students own investigations, models, theories, simulations, peer review) and the assumption that theories and laws that describe the natural world operate today as they did in the past and will continue to do so in the future. Apply scientific ideas, principles, and/or evidence to provide an explanation of phenomena and solve design problems, taking into account possible unanticipated effects. Apply scientific reasoning, theory, and/or models to link evidence to the claims to assess the extent to which the reasoning and data support the explanation or conclusion. Design, evaluate, and/or refine a solution to a complex real-world problem, based on scientific knowledge, student-generated sources of evidence, prioritized criteria, and tradeoff considerations. 11
13 Science & Engineering Practices Engaging in Argument from Evidence Argumentation is the process by which evidence-based conclusions and solutions are reached. In science and engineering, reasoning and argument based on evidence are essential to identifying the best explanation for a natural phenomenon or the best solution to a design problem. Scientists and engineers use argumentation to listen to, compare, and evaluate competing ideas and methods based on merits. Scientists and engineers engage in argumentation when investigating a phenomenon, testing a design solution, resolving questions about measurements, building data models, and using evidence to evaluate claims. K 2 Condensed Practices 3 5 Condensed Practices 6 8 Condensed Practices 9 12 Condensed Practices Engaging in argument from evidence in K 2 builds on prior experiences and progresses to comparing ideas and representations about the natural and designed world(s). Identify arguments that are supported by evidence. Distinguish between explanations that account for all gathered evidence and those that do not. Analyze why some evidence is relevant to a scientific question and some is not. Distinguish between opinions and evidence in one s own explanations. Engaging in argument from evidence in 3 5 builds on K 2 experiences and progresses to critiquing the scientific explanations or solutions proposed by peers by citing relevant evidence about the natural and designed world(s). Compare and refine arguments based on an evaluation of the evidence presented. Distinguish among facts, reasoned judgment based on research findings, and speculation in an explanation. Engaging in argument from evidence in 6 8 builds on K 5 experiences and progresses to constructing a convincing argument that supports or refutes claims for either explanations or solutions about the natural and designed world(s). Compare and critique two arguments on the same topic and analyze whether they emphasize similar or different evidence and/or interpretations of facts. Engaging in argument from evidence in 9 12 builds on K 8 experiences and progresses to using appropriate and sufficient evidence and scientific reasoning to defend and critique claims and explanations about the natural and designed world(s). Arguments may also come from current scientific or historical episodes in science. Compare and evaluate competing arguments or design solutions in light of currently accepted explanations, new evidence, limitations (e.g., trade-offs), constraints, and ethical issues. Evaluate the claims, evidence, and/or reasoning behind currently accepted explanations or solutions to determine the merits of arguments. Listen actively to arguments to indicate agreement or disagreement based on evidence, and/or to retell the main points of the argument. Respectfully provide and receive critiques from peers about a proposed procedure, explanation or model.by citing relevant evidence and posing specific questions. Respectfully provide and receive critiques about one s explanations, procedures, models and questions by citing relevant evidence and posing and responding to questions that elicit pertinent elaboration and detail. Respectfully provide and/or receive critiques on scientific arguments by probing reasoning and evidence and challenging ideas and conclusions, responding thoughtfully to diverse perspectives, and determining what additional information is required to resolve contradictions. 12 Construct an argument with evidence to support a claim. Construct and/or support an argument with evidence, data, and/or a model. cause and effect. Construct, use, and/or present an oral and written argument supported by empirical evidence and scientific reasoning to support or refute an explanation or a model for a phenomenon or a solution to a problem. Construct, use, and/or present an oral and written argument or counter-arguments based on data and evidence. Make a claim about the effectiveness of an object, tool, or solution that is supported by relevant evidence. Make a claim about the merit of a solution to a problem by citing relevant evidence about how it meets the criteria and constraints of the problem. Make an oral or written argument that supports or refutes the advertised performance of a device, process, or system, based on empirical evidence concerning whether or not the technology meets relevant criteria and constraints. Evaluate competing design solutions based on jointly developed and agreed-upon design criteria. Developed by NSTA using information from Appendix F of the Next Generation Science Standards 2011, 2012, 2013 Achieve, Inc. Make and defend a claim based on evidence about the natural world or the effectiveness of a design solution that reflects scientific knowledge, and studentgenerated evidence. Evaluate competing design solutions to a real-world problem based on scientific ideas and principles, empirical evidence, and/or logical arguments regarding relevant factors (e.g. economic, societal, environmental, ethical considerations).

14 Science & Engineering Practices Obtaining, Evaluating, and Communicating Information Scientists and engineers must be able to communicate clearly and persuasively the ideas and methods they generate. Critiquing and communicating ideas individually and in groups is a critical professional activity. Communicating information and ideas can be done in multiple ways: using tables, diagrams, graphs, models, and equations as well as orally, in writing, and through extended discussions. Scientists and engineers employ multiple sources to obtain information that is used to evaluate the merit and validity of claims, methods, and designs. K 2 Condensed Practices 3 5 Condensed Practices 6 8 Condensed Practices 9 12 Condensed Practices Obtaining, evaluating, and communicating information in K 2 builds on prior experiences and uses observations and texts to communicate new information. Read grade-appropriate texts and/or use media to obtain scientific and/or technical information to determine patterns in and/or evidence about the natural and designed world(s). Obtaining, evaluating, and communicating information in 3 5 builds on K 2 experiences and progresses to evaluating the merit and accuracy of ideas and methods. Read and comprehend grade-appropriate complex texts and/or other reliable media to summarize and obtain scientific and technical ideas and describe how they are supported by evidence. ompare and/or combine across complex texts and/or other reliable media to support the engagement in other scientific and/or engineering practices. Obtaining, evaluating, and communicating information in 6 8 builds on K 5 experiences and progresses to evaluating the merit and validity of ideas and methods. Critically read scientific texts adapted for classroom use to determine the central ideas and/or obtain scientific and/or technical information to describe patterns in and/or evidence about the natural and designed world(s). Obtaining, evaluating, and communicating information in 9 12 builds on K 8 experiences and progresses to evaluating the validity and reliability of the claims, methods, and designs. Critically read scientific literature adapted for classroom use to determine the central ideas or conclusions and/or to obtain scientific and/or technical information to summarize complex evidence, concepts, processes, or information presented in a text by paraphrasing them in simpler but still accurate terms. Describe how specific images (e.g., a diagram showing how a machine works) support a scientific or engineering idea. Combine information in written text with that contained in corresponding tables, diagrams, and/or charts to support the engagement in other scientific and/or engineering practices. Integrate qualitative and/or quantitative scientific and/or technical information in written text with that contained in media and visual displays to clarify claims and findings. Compare, integrate and evaluate sources of information presented in different media or formats (e.g., visually, quantitatively) as well as in words in order to address a scientific question or solve a problem. 13 Obtain information using various texts, text features (e.g., headings, tables of contents, glossaries, electronic menus, icons), and other media that will be useful in answering a scientific question and/or supporting a scientific claim. Obtain and combine information from books and/or other reliable media to explain phenomena or solutions to a design problem. Gather, read, synthesize information from multiple appropriate sources and assess the credibility, accuracy, and possible bias of each publication and methods used, and describe how they are supported or not supported by evidence. Evaluate data, hypotheses, and/or conclusions in scientific and technical texts in light of competing information or accounts. Gather, read, and evaluate scientific and/or technical information from multiple authoritative sources, assessing the evidence and usefulness of each source. Evaluate the validity and reliability of and/or synthesize multiple claims, methods, and/or designs that appear in scientific and technical texts or media reports, verifying the data when possible. Communicate information or design ideas and/or solutions with others in oral and/or written forms using models, drawings, writing, or numbers that provide detail about scientific ideas, practices, and/or design ideas. Communicate scientific and/or technical information orally and/or in written formats, including various forms of media and may include tables, diagrams, and charts. information (e.g. about a proposed object, tool, process, system) in writing and/or through oral presentations. Communicate scientific and/or technical information or ideas (e.g. about phenomena and/or the process of development and the design and performance of a proposed process or system) in multiple formats (including orally, graphically, textually, and mathematically). Developed by NSTA using information from Appendix F of the Next Generation Science Standards 2011, 2012, 2013 Achieve, Inc.
15 4-PS3 Energy Students who demonstrate understanding can: 4-PS3-1. Use evidence to construct an explanation relating the speed of an object to the energy of that object. [Assessment Boundary: Assessment does not include quantitative measures of changes in the speed of an object or on any precise or quantitative definition of energy.] 4-PS3-2. Make observations to provide evidence that energy can be transferred from place to place by sound, light, heat, and electric currents. [Assessment Boundary: Assessment does not include quantitative measurements of energy.] 4-PS3-3. Ask questions and predict outcomes about the changes in energy that occur when objects collide. [Clarification Statement: Emphasis is on the change in the energy due to the change in speed, not on the forces, as objects interact.] [Assessment Boundary: Assessment does not include quantitative measurements of energy.] 4-PS3-4. Apply scientific ideas to design, test, and refine a device that converts energy from one form to another.* [Clarification Statement: Examples of devices could include electric circuits that convert electrical energy into motion energy of a vehicle, light, or sound; and, a passive solar heater that converts light into heat. Examples of constraints could include the materials, cost, or time to design the device.] [Assessment Boundary: Devices should be limited to those that convert motion energy to electric energy or use stored energy to cause motion or produce light or sound.] SEP DCI CCC Asking Questions and Defining Problems Asking questions and defining problems in grades 3 5 builds on grades K 2 experiences and progresses to specifying qualitative relationships. Ask questions that can be investigated and predict reasonable outcomes based on patterns such as cause and effect relationships. (4-PS3-3) Planning and Carrying Out Investigations Planning and carrying out investigations to answer questions or test solutions to problems in 3 5 builds on K 2 experiences and progresses to include investigations that control variables and provide evidence to support explanations or design solutions. Make observations to produce data to serve as the basis for evidence for an explanation of a phenomenon or test a design solution. (4-PS3-2) Constructing Explanations and Designing Solutions Constructing explanations and designing solutions in 3 5 builds on K 2 experiences and progresses to the use of evidence in constructing explanations that specify variables that describe and predict phenomena and in designing multiple solutions to design problems. Use evidence (e.g., measurements, observations, patterns) to construct an explanation. (4-PS3-1) Apply scientific ideas to solve design problems. (4-PS3-4) PS3.A: Definitions of Energy The faster a given object is moving, the more energy it possesses. (4-PS3-1) Energy can be moved from place to place by moving objects or through sound, light, or electric currents. (4-PS3-2), (4-PS3-3) PS3.B: Conservation of Energy and Energy Transfer Energy is present whenever there are moving objects, sound, light, or heat. When objects collide, energy can be transferred from one object to another, thereby changing their motion. In such collisions, some energy is typically also transferred to the surrounding air; as a result, the air gets heated and sound is produced. (4-PS3-2), (4-PS3-3) Light also transfers energy from place to place. (4-PS3-2) Energy can also be transferred from place to place by electric currents, which can then be used locally to produce motion, sound, heat, or light. The currents may have been produced to begin with by transforming the energy of motion into electrical energy. (4-PS3-2), (4-PS3-4) PS3.C: Relationship Between Energy and Forces When objects collide, the contact forces transfer energy so as to change the objects motions. (4-PS3-3) PS3.D: Energy in Chemical Processes and Everyday Life The expression produce energy typically refers to the conversion of stored energy into a desired form for practical use. (4-PS3-4) ETS1.A: Defining Engineering Problems Possible solutions to a problem are limited by available materials and resources (constraints). The success of a designed solution is determined by considering the desired features of a solution (criteria). Different proposals for solutions can be compared on the basis of how well each one meets the specified criteria for success or how well each takes the constraints into account. (secondary to 4-PS3-4) Energy and Matter Energy can be transferred in various ways and between objects. (4-PS3-1), (4-PS3-2), (4-PS3-3), (4-PS3-4) Connections to Engineering, Technology, and Applications of Science Influence of Science, Engineering and Technology on Society and the Natural World Engineers improve existing technologies or develop new ones. (4-PS3-4) Connections to Nature of Science Science is a Human Endeavor Most scientists and engineers work in teams. (4-PS3-4) Science affects everyday life. (4-PS3-4) Connections to other DCIs in fourth grade: N/A Articulation of DCIs across grade-levels: K.PS2.B (4-PS3-3); K.ETS1.A (4-PS3-4); 2.ETS1.B (4-PS3-4); 3.PS2.A (4-PS3-3); 5.PS3.D (4-PS3-4); 5.LS1.C (4-PS3-4); MS.PS2.A (4-PS3-3); MS.PS2.B (4-PS3-2); MS.PS3.A (4-PS3-1), (4-PS3-2),(4-PS3-3), (4-PS3-4); MS.PS3.B (4-PS3-2), (4-PS3-3), (4-PS3-4); MS.PS3.C (4-PS3-3); MS.PS4.B (4-PS3-2); MS.ETS1.B (4-PS3-4); MS.ETS1.C (4-PS3-4) Common Core State Standards Connections: ELA/Literacy RI.4.1 Refer to details and examples in a text when explaining what the text says explicitly and when drawing inferences from the text. (4-PS3-1) RI.4.3 Explain events, procedures, ideas, or concepts in a historical, scientific, or technical text, including what happened and why, based on specific information in the text. (4-PS3-1) RI.4.9 Integrate information from two texts on the same topic in order to write or speak about the subject knowledgeably. (4-PS3-1) W.4.2 Write informative/explanatory texts to examine a topic and convey ideas and information clearly. (4-PS3-1) W.4.7 Conduct short research projects that build knowledge through investigation of different aspects of a topic. (4-PS3-2), (4-PS3-3), (4-PS3-4) W.4.8 Recall relevant information from experiences or gather relevant information from print and digital sources; take notes and categorize information, and provide a list of sources. (4-PS3-1), (4-PS3-2), (4-PS3-3), (4-PS3-4) W.4.9 Draw evidence from literary or informational texts to support analysis, reflection, and research. (4-PS3-1) Mathematics 4.OA.A.3 Solve multistep word problems posed with whole numbers and having whole-number answers using the four operations, including problems in which remainders must be interpreted. Represent these problems using equations with a letter standing for the unknown quantity. Assess the reasonableness of answers using mental computation and estimation strategies including rounding. (4-PS3-4) 14
16 Teacher A: Mr. Coles Background Mr. Coles teaches middle school science in a grade 6-8 building with a high English language learner population. His district has developed a K-12 scope and sequence and he uses the district pacing guide and recommended textbook to plan for instruction. Mr. Coles embraces his school's focus on using best practices. He posts the learning target at the front of the room for students every day. Last summer, he and his grade level team worked together to identify the five most important terms for each chapter as one strategy to help English language learners improve their achievement on standardized tests. This year, the school is focusing on the use of bell-ringer questions based on the state science test to improve the performance of all students on the test. Lesson 1 On the first day of the new chapter, Mr. Coles started class with a "bell-ringer" question linked to the district's state test posted on the Smart Board. Students begin every new class this way. After quickly reviewing responses and the correct answer, students were asked to take out the five key vocabulary terms they had defined as part of their homework to get ready to start their new chapter on food webs. Students had defined the following terms: producer, consumer, decomposer, food web, and conservation of matter and energy. He reviewed the definitions with students and wrote the terms on the Word Wall that would be up throughout the new chapter. Mr. Coles introduced the chapter by lecturing and showing a short video about producers, consumer, and decomposers in various ecosystems. As he taught, he filled in the blanks on his lecture note outline on the Smart Board and students filled in blanks on the same outline. During the video, students took notes focused on a few key questions about the living and non-living components of the ecosystem as well as the producers, consumers, and decomposers they noted in the various ecosystems. After the video, they had a whole class discussion focused on the questions. During the discussion, Mr. Coles added the names of a few different ecosystems to the Word Wall including desert, savanna, grassland, fresh water aquatic, marine, forest (deciduous, rainforest, and coniferous), and tundra. He also added living components and nonliving components to the Word Wall along with some examples of each. At the end of class, Mr. Coles asked students to summarize what they had learned by talking with a partner and then individually writing an exit slip. Students were given homework to read and answer two "Connect Questions" from the chapter in their textbook. Lesson 2 During the second class period, students studied food webs from the ecosystems they had seen in the video from the previous lesson. They labeled diagrams with the words: producer, consumer, and decomposer. Mr. Coles put up the same diagrams on the Smart Board and reviewed the correct answers and discussed how the food webs represented how matter cycles and energy flows through each ecosystem. Mr. Coles added matter cycles and energy flows to the Word Wall. At the end of class, Mr. Coles had students turn in their diagrams and assigned reading and questions from the next section in the textbook chapter. Lesson 3 During the third class period, students observed photos of decomposition jars just after they were created and made observations of how the jars looked initially. The first jar was made of rocks and soil; the second was bread and cheese, the third included a variety of fruits and vegetables, and the fourth was leaves and grass. Then Mr. Coles showed students the decomposition jars after two to three weeks of time. Students discussed their observations of the decomposition jars, identified the organisms (bacteria and fungi) that are often responsible for decomposition, and discussed the role of decomposition in the cycling of matter in an ecosystem. He emphasized that decomposers return matter like carbon to the soil, the air, and aquatic environments to be used 15
17 again by other organisms. Following the lab experience, Mr. Coles presented a short lecture about detritivores and that since matter is conserved, there are more organisms in the producers and decomposers categories and fewer organisms in the consumers category so that matter is conserved throughout the ecosystem. Students were assigned homework to complete a lab report due in two class periods that included a discussion of the role of decomposers in the cycling of matter in a food web. Lesson 4 After the "bell-ringer'' question, the fourth class period continued with a focus on the flow of energy in an ecosystem. Mr. Coles wanted students to understand that ecosystems need a constant source of energy since energy is continually transferred into the environment as heat. He emphasized that the total amount of energy was conserved, but that it became less usable when it became heat. To help him make these points, students were shown several representations in video, on the computer, and in text to help them understand that energy flows one-way through an ecosystem. They also read a short selection describing the flow of energy. He added the words, heat, sun, and geothermal to the Word Wall. At the end of class, students worked on their lab report and then were assigned a worksheet about the flow of energy in an ecosystem. Students summarized what they had learned so far about ecosystems on an exit slip. They had to use some of the words on the Word Wall in their responses and underline the words. Lesson 5 During the next class period, students were assigned different ecosystems and worked together to identify the living and nonliving components of the ecosystem, to describe the common producers, consumers, and decomposers found in the ecosystem, and to describe how matter cycled and energy flowed through their ecosystem. They were told they would present their diagrams to the whole class during the next class period as part of a review for the chapter test. Their diagrams had to be sent to Mr. Coles so he could display them on the Smart Board and all students in the small group had to participate in their presentation. The requirements for the presentation were given to students on a checklist. Lesson 6 After the "bell-ringer" for the sixth class period, students presented their ecosystems to one another and were given a review sheet for the chapter test. They were told that the test would include 30 multiple choice questions and five constructed response questions. They spent the last few minutes of class asking questions of Mr. Coles about what would be on the test. Lesson 7 During the final class period, students took a paper and pencil chapter test. Their homework assignment for the next chapter was posted on the Smart Board and included five new key vocabulary terms. 16
18 Teacher B: Ms. Rivera Background Ms. Rivera teaches middle school science in a 6-8 building with a high English language learner population. The district she teaches in works to provide all science teachers with the supports and resources they need to teach science effectively. Her school is focused on the implementation and use of teaching practices that support increased learning and achievement for all students. She and her colleagues share planning time throughout the week where they focus on the concepts and science and engineering practices they intend for students to develop through their lessons. Lesson 1 Ms. Rivera started her new science topic by having students think about the ideas they learned in the previous sequence of lessons and reflecting on the overarching questions of the unit, how do the living and nonliving parts of the environment interact with each other? What factors influence these interactions? She asked students to share their responses with au elbow partner. She asked each partner group to think about the completeness of their answers and what more information they might need to the answer the overarching unit questions more fully. Ms. Rivera then asked students to form small groups and she distributed video clips of various ecosystems on the class set of ipads. She asked each group to choose one image or video and identify the living and nonliving components of the ecosystem and describe the type of interactions between them. When students completed the activity, Mrs. Rivera asked students to report out on the type of interactions they described. Many of the interactions the students described among the living components focused on getting the food needed to survive. Ms. Rivera then asked them to tum to a partner and discuss the key question, What is it about food that makes it essential for life? When students finished their discussion, she asked that a representative from each table group go to the whiteboard and write their response to the key question. Ms. Rivera then facilitated a discussion where students identified that food is essential to all life as it contains both energy and matter. Before the bell rang, Ms. Rivera told students that as they move to lesson 2, they will focus on how matter and energy are transferred in ecosystems and one way in which scientists represent the transfer. Lesson 2a To begin Lesson 2, Ms. Rivera asked students to construct a simple food chain involving some food they ate last night. She then asked them to find a partner to explore various food webs to identify the components of the system as well their similarities and differences. As students studied the food webs, Ms. Rivera moved from group to group and asked questions such as: I ) What do you notice is similar in all the food webs?, 2) What do you notice about the direction of all the arrows?, 3) Where is the matter going?, and 4) What is happening to the energy? Students determined that all the food webs have plants that are eaten by smaller animals with an example of a large carnivore/predator and fungi and/or bacteria as decomposers. Ms. Rivera recognized the common student idea that herbivores are small animals and carnivores are large animals. She will make sure that students have a chance to revisit that idea later in her instructional sequence. After this experience, students applied the ideas of producers, consumers, and decomposers to one of the food webs and shared their results with a group of two students seated near them. At the end of the class period, Ms. Rivera acknowledged that the students have seen lots of examples of how organisms interact with each other and their environment to live, grow, and reproduce. She told students that this idea will be further explored during the next lesson. Lesson 2b At the beginning of the class period, Ms. Rivera indicated that today's lesson, like the previous lesson, would focus on food webs. However, in this lesson they would think about and develop a more sophisticated model for how matter and energy are transferred in ecosystems. She then had the students form groups of three and construct a food web. She handed out a set of cards with pictures of organisms and set of arrow cards (blue 17
19 arrows for matter and yellow arrows for energy) and asked students to create a model that showed how matter and energy are transferred from organism to organism. She then had them add ideas about interactions with nonliving components including water, soil, air, and energy from the sun. Once students completed their food web, Ms. Rivera wondered aloud with the class about the exactness of their models and if the same amount of matter and energy flows equally from organism to organism. She told students they would conduct an investigation about the interactions in an ecosystem, represented by the terraria and decomposition jars they constructed at the beginning of the ecosystem unit. They had been collecting mass and temperature data about their terraria and decompositions jars over the past few weeks. They would use findings from this investigation to inform and possibly revise the model they had just created. At the beginning of the investigation, students were asked to make a prediction concerning the number of plants and animals as well as the relative masses in the terrarium they would be studying. She asked the students to form investigation groups and handed out the investigation protocol. The investigation required students to identify all the components of the ecosystem and determine what aspects of the system they would measure. As a result, each group identified, counted, and took the mass of the living components. Students also made observations of the nonliving factors in the environment. At the end of class, Ms. Rivera told students that during the next class period they would analyze the data they just collected keeping in the mind that the goal was to use this information to develop a more sophisticated model of an ecosystem. Lesson 2c During the next class period, Ms. Rivera asked students to pool their data by entering it into a class spreadsheet. Once the spreadsheet was complete, Ms. Rivera asked students to create a bar graph in their notebooks that showed how the mass and numbers of the plants and animals from their studies compared. She also had them graph their mass and temperature data. She then asked students to use a strategy to help them make sense of the data, by first having students identify patterns in the data and then thinking about what it means and how it relates to their earlier predictions. Ms. Rivera asked students what they noticed about the data and what questions arose as a result of their observations. Students pointed out the fact that there were many more plants than arthropods. She asked students to come up with a tentative explanation in their notebooks that described why there are many more plants than animals in their samples. She asked them to consider how matter and energy transfer from organism to organism and that if all matter and energy is transferred how the various masses between the plants and animals might look different. At the close of the period Ms. Rivera told students that in the next class they will relate these results to the ecosystem models they constructed and think about how these results inform their current thinking of energy and matter transfer in ecosystems. Lesson 3 To begin this lesson, Ms. Rivera asked students to find a partner and share their tentative explanations. Each partner shared her/his explanation and then asked for feedback from her/his partner. Once all students have shared and given feedback, they were instructed to consider the feedback they just received and revise their explanation accordingly. The students then completed a series of short readings to develop a more complete explanation of how matter and energy shape patterns in interactions between living and nonliving parts of ecosystems. The readings focused on energy transfer and how not all energy flows from one organism to the other, as a large portion is transferred to heat and cannot be passed on. Another reading focused on matter cycling, specifically carbon, within an ecosystem. After reading, Ms. Rivera asked students to go back to the ecosystem models they constructed during the last class period and revise them based on information from their investigations and readings. Ms. Rivera supported students in making connections among the different student ideas by asking questions that helped them to appropriately link science ideas together. She asked questions such as: I) What happens to matter as it cycles through the food web?, 2) What happens to energy as it flows through the food web?, 3) What are the interactions between the living and nonliving components of the ecosystem, and 3) In order for an ecosystem to function, why are there so many more plants (producers) than animals (consumers)? Toward the end of class, she picked three groups of students to share their models. She 18
20 asked the class to look for similarities and differences in models and posed questions. Her questions stimulated discussion and helped to resolve discrepancies that occurred in observations of the models and with the short passages they read earlier in the class. She then asked all students to think about how they would revise their models based on the discussion they just had. Before the bell rings, Ms. Rivera asked students to complete a quick-write in their notebooks to answer the question, Why do you think there were many more plants than animals in the ecosystem you studied yesterday? Lesson 4 At the start of lesson 4, Ms. Rivera took students to the computer lab to work with an online learning platform that simulates the transfer of matter and energy in an ecosystem. She told students that this simulation would require them to apply what they learned in the last three class periods to investigate how changing factors in one population affect other species in a food web and how the factors could influence the ecosystem. The simulation focused specifically on how increasing or decreasing the amount of producers, consumers, or decomposers affects the overall health and function of the ecosystem. The simulation involved three organisms; grass, sheep, and wolves. Students were asked to predict what would happen to the other populations if one of the three is increased or decreased. Besides controlling the number of organisms present at any given time, students controlled other variables such as energy gain from food, reproductive rates, and growth rates. Students then tested their predictions. Ms. Rivera guided the use of the simulation and asked key questions such as: I) What patterns are you noticing when you compare the mass and numbers of organisms in different feeding relationships?, 2) What is happening to much of the energy at each level of the food chain?, 3) Why does an ecosystem need a constant source of energy coming into it?, 4) Why are decomposers so important in an ecosystem?, and 5) What do you think would happen to the soil in some of your simulations when all the grass was eaten? Students represented the data from the simulation in a table and described how reproductive rates and growth rates of one organism influenced the number of organisms of another type. At the end of class, Ms. Rivera told students that they would use the same knowledge and skills they applied to the construction of their model of an ecosystem and in the simulation to complete an assessment task during the next class period. Lesson 5 Ms. Rivera welcomed students back to class and discussed the assessment task. She provided instructions for the task and reviewed the scoring rubric. Students then individually demonstrated their understanding of how matter and energy are transferred in ecosystems. Specifically, students constructed two models of ecosystems using provided data, represented both the living and nonliving components, and used arrows to represent the transfer of matter and energy between organisms, then used the models to describe interactions based on various scenarios. The purpose was to show how energy decreases when flowing through an ecosystem and needs a renewed supply from the sun and how matter is recycled by decomposers. Toward the end of class, when all students had completed the assessment, she asked the students to once again be thinking about the ideas they learned thus far in the unit and how they might answer the overarching unit questions differently now that they have completed this chapter. She asked student to share with the class how their thinking has changed as a result of learning about energy and matter transfer in ecosystems. 19
21 Formative Assessment Read each statement and circle the one that best describes force. A pull is different than a force. A pull is a force and a push is something else. A force is either a push or a pull. Force & Motion Pushes and pulls are forces. There is also another type of force that holds things in place. Forces are neither pushes nor pulls. They are something else. Please draw a model and write an explanation about force and motion. 20
22 SidewaysForcesandRollingObjects: OriginalVersionofText Weseerollingobjectseveryday,suchsoccerballsandmarbles.Often,itisimportantto knowhowtouseaforce(apushorpull)tomovetheseobjectsinacertaindirection such asaimingasoccerballatagoal. Peoplesometimeshavetroubleusingforcestomoverollingobjectsinparticulardirections, however.forexample,somepeoplethinkthatwhenyouapplyaquicksidewaysforcetoa rollingobjectthatitmakesanl shaped(90degree)turn(seefigure1).butthisisn twhat happens.instead,theobjectendsupmovingdiagonally.whyisthis? Figure1.ARollingObjectisPushedFromtheSide Toscientists,thereasonforthediagonalmotionisbasedonanimportantscientific concept.thereasonwhytherollingobjectmovesthiswayafterthepushisbecauseofthe ideathatasidewaysforceonlychangesanobject ssidewaysmotion.tobetterunderstand thisidea,wewilllookatanexample. ExampleofaSidewaysForceonaRollingMarble sspeedanddirection Imaginethatamarbleismovingwithaspeedof3centimeterspersecond(cm/sec) towardsawall.awindowistothesideofthemarble.unexpectedly,themarbleispushed byastrongsidewayspuffofair(seefigure2).whathappens? Figure2.AMarbleisPushedFromtheSide Objectisrollingalong thelineinthisdirection Quicksidewayspush YES! NO! Speedof3cm/sectowardswall Sidewayspush! Window Wall 21
23 Movementtowardsthewall. Sincethemarble sspeedof3cm/secisnotasidewaysspeed,the3cm/secspeedisn t affectedbythesidewayspuffofair.thismeansthemarblekeepsmovingwithaspeedof3 cm/sectowardsthewall. Movementtowardsthewindow. Accordingtoourrule,becausethepuffofairpushessidewaysonthemarble,itchangesthe sidewaysspeedofthemarble.thismeansthatthemarblewillnowmovewithanew sidewaysspeedtowardsthewindow. Whathappenseverysecondthatthemarblemoves. Let simaginethatthenewsidewaysspeedofthemarbleis1cm/sec(towardsthe window).whatisthepathofthemarbleafterbeingpushed? Figure3.Themovementofthemarble(afterthepush)inonesecond Wall 1cm towards window Window Positiononesecondlater 3cmtowardswall Originalposition AsshowninFigure3,inonesecond,themarblemoves3centimeterstowardsthewall,and alsomoves1centimetertowardsthewindow.sinceitmovesbothtowardsthewalland towardsthewindow,itnowmovesdiagonally! Thisdiagonalmotionwillcontinue,andsoeverysecondthemarblewillroll3centimeters towardsthewalland1centimetertowardsthewindow. Sonowwehaveouranswer.Themarblemovesdiagonallyafterbeingpushedbya sidewayspuffofair(aforce)becauseitkeepsitsoriginalmotion,butitalsoreceivesanew sidewaysmotion.andit sallbasedonthescientificideathatasidewaysforceonlychanges anobject ssidewaysmotion. 22
 now in development will be based on A Framework for K 12 Science")
 a limited number of core ideas of science, (2) the integration or coupling of core ideas and scientific and engineering practices, (3)")
24 Engaging Students in Scientific Practices: What does constructing and revising models look like in the science classroom? Understanding A Framework for K 12 Science Education By Joseph Krajcik and Joi Merritt The Next Generation Science Standards (NGSS) now in development will be based on A Framework for K 12 Science Education released by the National Research Council last summer. The NGSS will use four key ideas from the Framework: (1) a limited number of core ideas of science, (2) the integration or coupling of core ideas and scientific and engineering practices, (3) crosscutting concepts, and (4) the development of the core ideas, scientific practices, and crosscutting concepts over time. In the December issue of The Science Teacher, Rodger Bybee provided an overview of the Scientific and Engineering practices and showed how they are a refinement and further articulation of what it means to do scientific inquiry in the science classroom (2011). The Framework identifies seven scientific and engineering practices that should be used in science classrooms. These practices reflect the multiple ways in which scientists explore and understand the world and the multiple ways in which engineers solve problems. These practices include: Asking questions (for science) and defining problems (for engineering) Developing and using models Planning and carrying out investigations Analyzing and interpreting data Using mathematics, information and computer technology, and computational thinking Constructing explanations (for science) and designing solutions (for engineering) Engaging in argument from evidence Obtaining, evaluating, and communicating information In this article, we look in-depth at scientific practice #2 developing, evaluating, and revising scientific models to explain and predict phenomena and what it means for classroom teaching. Models provide scientists and engineers with tools for thinking, to visualize and make sense of phenomena and experience, or to develop possible solutions to design problems (NRC 2011). Models are external representations of mental concepts. Models can include diagrams, three-dimensional physical structures, computer simulations, mathematical formulations, and analogies. It is challenging for learners to understand that all models only approximate and simplify how the entities they represent work, yet models provide a powerful tool of explaining phenomena. It s critical that a model be consistent with the evidence that exists, and that different models are appropriate in different situations depending on what is being explained. If the model cannot account for the evidence, then the model should be abandoned (Schwarz et al. 2009). A Framework for K 12 Science Education states that by the end of the 12th grade students should be able to: Construct drawings or diagrams as representations of events or systems Represent and explain phenomena with multiple types of models and move flexibly between model types when different ones are most useful for different purposes. Discuss the limitations and precision of a model as the representation of a system, process, or design and suggest ways in which the model might be improved to better fit available evidence or better reflect 23
25 a design s specifications. Refine a model in light of empirical evidence or criticism to improve its quality and explanatory power. Use (provided) computer simulations or simulations developed with simple simulation tools as a tool for understanding and investigating aspects of a system, particularly those not readily visible to the naked eye. Make and use a model to test a design, or aspects of a design, and to compare the effectiveness of different design solutions. (NRC 2011, p. 3-20). What does this practice mean for classroom instruction? What does it mean that the practices of modeling will be blended with core ideas? Perhaps the biggest change the modeling practice brings to classroom teaching is the expectation for students to construct and revise models based on new evidence to predict and explain phenomena and to test solutions to various design problems in the context of learning and using core ideas. Students will be engaged in what it means to do science because this is one major activity that drives scientific work and thinking. Often in science class, students are given the final, canonical scientific model that scientists have developed over numerous years, and little time is spent showing them the evidence for the model or allowing them to construct models that will explain phenomena. As a result, often learners do not see a difference between the scientific model and the phenomena the model is predicting and explaining, or the value of the model for explaining and finding solutions. The Framework emphasizes that multiple models might explain a phenomena and that students should improve models to fit new evidence. It is important that science teachers engage students in the modeling process. What do modeling practices look like in the classroom? What are teachers expected to do in their teaching? It is important for students to construct models that explain phenomena, show how their models are consistent with their evidence, and explain the limitations of those models. Following is one example of what this might look like in a middle school classroom. Imagine a sixth-grade class engaged in exploring core ideas from the Framework s PS1.A: Gases and liquids are made of molecules or inert atoms that are moving about relative to each other. In a liquid, the molecules are constantly in contact with others; in a gas, they are widely spaced except when they happen to collide. (NRC 2011, p. 5-4). Blending this core idea with the practice of constructing and revising models, students could be asked to draw a model of how the odor gets from the source to your nose (Merritt and Krajcik 2012; Merritt 2010). Students are asked to complete the task described in Figure 1. Figure 1. Drawing a model of an odor. Imagine that you have a special instrument that allows you to see what makes up odor. The large circle in the drawing below represents a spot that is magnified many times, so you can see it up close. Create a model of what you would see if you could focus on one tiny spot in the area between the jar and your nose. Label the parts of your model, so someone who looks at it will know what the parts represent. Figure 2. A student model at the initial stage. 24
26 Figure 3. A student s second attempt at drawing a model of air and odor. Figure 4. A student s model at the end of the unit. an eight-week unit that focuses on Core Idea PS1.A. In each case, students need to include a key, the drawing, and an explanation of the drawing. Students construct their first model on the first day of the unit. Students walk into class, and the teacher opens a container that contains a strong odor (typically menthol) and asks the students to make a drawing (a representation) of how the odor gets from the container to their noses. The students have had no formal instruction on the particle nature of matter. All they are expected to do is draw a feasible model consistent with the evidence they might see if they had a very powerful instrument that would allow them to see the odor. Typically at this initial stage, students models do not match the scientific model. This is perfectly okay as long as the student model is reasonable and feasible. As previously reported (Novick and Nussbaum 1978), students initially draw a continuous or cloud model to represent the air and the odor. Figure 2, page 11, shows an example of what students typically draw. Next, students complete a series of investigations in which they explore properties of gases. For instance, they use syringes to experience that gases are compressible and expandable: You can add gas to or remove it from a container with a fixed volume without changing the shape of the container. Using these and related experiences, students are again challenged to create a new model of matter to explain how an odor can get from a source to their noses and what they would see if they had a special instrument that sees odor. Now, however, their models must be consistent with the evidence they have regarding the properties of gases (i.e., gases can be expanded and compressed and can be added to or taken away from a container with a fixed volume). As Figure 3 shows, students now draw models that are more particulate in nature. Although this model is still not consistent with the full scientific model, it has features consistent with scientific models. The student now visualizes air and odor to consist of tiny particles too small to see; the particles have space between them and travel in straight lines until they collide with other particles. There are some concerns with the model. For instance, the model shows particles that collide with the imaginary side of the magnified section. The model, however, is consistent with the evidence the student has collected: that a gas can be compressed, expanded, and added to or taken away from a container with a fixed volume. Throughout the unit, students continue to collect additional evidence about the properties of gases. For instance, students explore the effect of temperature on how fast a gas travels by investigating the time it takes ammonia vapor to change indicator paper blue when a test tube containing drops of ammonia is in a warm versus cool water bath. 25
27 students have developed their own models, through careful scaffolding by the teacher, they also develop a class consensus model and explore computer simulations to develop a rich and integrated model of the structure of gases, liquids, and solids as being particulate in nature. As Figure 4 indicates, at the end of the unit most students have developed models more consistent with the scientific model. The model in Figure 4 shows that gases (air and odor) are made up of tiny particles too small to see, have space between them, move and collide into each other, and change direction as a result of these collisions. There is no indication of the particles colliding with the imaginary walls of the magnified section. Moreover, the student clearly points out there is nothing between the particles. These understandings form a foundation that can be used to build more sophisticated models of the structure of matter. What is important to realize in these examples is that these student models account for all the evidence they have regarding the properties of gases. The student was not told the features of the particle model but rather developed the particle model through carefully supported modeling activities in which students built models based upon evidence. This is the major feature of the modeling practice: developing and revising models. Concluding Comment Because A Framework for K 12 Science Education emphasizes fewer ideas developed across K 12 science curriculum and blended with the use of scientific practices and crosscutting elements, Next Generation Science Standards will present a more coherent view of science education that will engage students in the process of doing science. The U.S. science curriculum has long suffered from being disconnected and presenting too many ideas too superficially, often leaving students with disconnected ideas that cannot be used to solve problems and explain phenomena they encounter in their everyday world. John Dewey expressed this concern in 1910, and we continue to strive so that students learn science in a more coherent manner. Science teaching has suffered because science has been so frequently presented just as so much readymade knowledge, so much subject-matter of fact and law, rather than as the effective method of inquiry into any subject-matter. (Dewey 1910) By focusing on big ideas blended with practices and crosscutting elements over time, the Framework and Next Generation Science Standards strive to avoid shallow coverage of a large number of topics and allow more time for students to explore and examine ideas in greater depth and use those ideas to understand phenomena they encounter in their lives, while engaging in an effective method of inquiry. The modeling practices and the example described in this article demonstrate science teaching as effective method of inquiry into any subject-matter. This focus on fewer ideas blended with scientific and engineering practices will allow teachers and students time to do science by engaging in a range of scientific practices, including creating and revising models that can explain phenomena and that change as more evidence is collected. Imagine the type of student who emerges from 12th-grade science education after repeatedly experiencing instruction since elementary school that supported them in constructing and revising models to explain phenomena! These students will form a different breed of high school graduates who view science as an effective method of inquiry and who will serve as productive 21st-century citizens to create a sustainable planet. n Joseph Krajcik (Krajcik@msu.edu) is a professor of science education, and Joi Merritt (jmerritt@msu.edu) is a postdoctoral researcher focusing on science education, both at Michigan State University. Krajcik served as Design Team Lead for the Framework and currently serves as Design Team Lead for the Next Generation Science Standards. References Bybee, R Scientific and engineering practices in K 12 classrooms: Understanding A Framework for K 12 Science Education. Science and Children 49 (4): Dewey, J Science as subject matter and method. Science 31 (787): Merritt, J Tracking students understanding of the particle nature of matter. Unpublished doctoral dissertation. University of Michigan, Ann Arbor, MI. Merritt, J., and J.S. Krajcik Supporting students in building a particle model of matter. In Structural Concepts of Matter in Science Education (forthcoming), eds. G. Tsaparlis and H. Sevian. Dordrecht, Netherlands: Springer. National Research Council (NRC) A framework for K 12 science education: Practices, crosscutting concepts, and core ideas. Washington, DC: National Academies Press. Novick, S., and J. Nussbaum Junior high school pupils understanding of the particulate nature of matter: An interview study. Science Education 62 (3): Schwarz, C., B. Reiser, E. Davis, L. Kenyon, A. Acher, D. Fortus, Y. Shwartz, B. Hug, and J.S. Krajcik Developing a learning progression for scientific modeling: Making scientific modeling accessible and meaningful for learners. Journal of Research in Science Teaching 46 (1):
28 APPENDIX F Science and Engineering Practices in the NGSS Practice 6 Constructing Explanations and Designing Solutions The goal of science is to construct explanations for the causes of phenomena. Students are expected to construct their own explanations, as well as apply standard explanations they learn about from their teachers or reading. The Framework states the following about explanation: The goal of science is the construction of theories that provide explanatory accounts of the world. A theory becomes accepted when it has multiple lines of empirical evidence and greater explanatory power of phenomena than previous theories. (NRC Framework, 2012, p. 52) An explanation includes a claim that relates how a variable or variables relate to another variable or a set of variables. A claim is often made in response to a question and in the process of answering the question; scientists often design investigations to generate data. The goal of engineering is to solve problems. Designing solutions to problems is a systematic process that involves defining the problem, then generating, testing, and improving solutions. This practice is described in the Framework as follows. Asking students to demonstrate their own understanding of the implications of a scientific idea by developing their own explanations of phenomena, whether based on observations they have made or models they have developed, engages them in an essential part of the process by which conceptual change can occur. In engineering, the goal is a design rather than an explanation. The process of developing a design is iterative and systematic, as is the process of developing an explanation or a theory in science. Engineers activities, however, have elements that are distinct from those of scientists. These elements include specifying constraints and criteria for desired qualities of the solution, developing a design plan, producing and testing models or prototypes, selecting among alternative design features to optimize the achievement of design criteria, and refining design ideas based on the performance of a prototype or simulation. (NRC Framework, 2012, p ) Practice 7 Engaging in Argument from Evidence The study of science and engineering should produce a sense of the process of argument necessary for advancing and defending a new idea or an explanation of a phenomenon and the norms for conducting such arguments. In that spirit, students should argue for the explanations they construct, defend their interpretations of the associated data, and advocate for the designs they propose. (NRC Framework, 2012, p. 73) Argumentation is a process for reaching agreements about explanations and design solutions. In science, reasoning and argument based on evidence are essential in identifying the best explanation for a natural phenomenon. In engineering, reasoning and argument are needed to identify the best solution to a design problem. Student engagement in scientific argumentation is critical if students are to understand the culture in which scientists live, and how to apply science and engineering for the benefit of society. As such, argument is a process based on evidence and reasoning that leads to explanations acceptable by the scientific community and design solutions acceptable by the engineering community. Argument in science goes beyond reaching agreements in explanations and design solutions. Whether investigating a phenomenon, testing a design, or constructing a model to provide a mechanism for an explanation, students are expected to use argumentation to listen to, compare, and evaluate competing ideas and methods based on their merits. Scientists and engineers engage in argumentation when investigating a phenomenon, testing a design solution, resolving questions about measurements, building data models, and using evidence to evaluate claims. 27
29 Pairs Read Strategy Pairs Read is a way for two students to complete a reading assignment. This reading structure can be used for fiction and nonfiction texts. The students are asked to take turns reading a selection. One student reads aloud a small section and then the other student orally summarizes what was read. This strategy is more about the oral summarization than the actual reading. The student reading is usually busy decoding words and loses focus on comprehending the content. The student summarizing can focus on the content being read without the struggle of decoding words. Generally, students of similar reading ability are paired together. Sometimes a more competent reader is paired with a less competent one, and the more able reader reads aloud and the less able follows along. This enables the less able reader to follow the text visually with little or no pressure. It is important that pairs are seated in a way to foster this type of reading. When possible seat students side by side, facing opposite directions. This setup will allow the mouth and ear to be closer to one another. Therefore, the noise level will not need to be very high. Also, students are able to make eye contact during the summarization part of the strategy. DIRECTIONS: 1. The teacher divides a reading passage into sections. 2. The pair decides who is student A and who is student B 3. Student A reads the first assigned reading section while student B listens and follows along in the text. 4. Student B orally summarizes what student A has just read. 5. Then, student B reads the next assigned reading section while student A listens and follows along in the text. 6. Student A orally summarizes what student B has just read. 7. This rotation continues until the text is completely read and summarized. OPTIONS: Teacher may want to stop groups periodically to develop whole class group notes on the board. The teacher will want to do the writing so the students can concentrate on what is being read. Later in the school year when the students are better at oral summarization, the teacher can add an additional task such as concept definition maps, note making, or written summaries. But at first, we want to concentrate on the skill of oral summarization. 28
30 Pendulum Reading A playground swing is usually supported by chains that are attached to fixed points at the top of the swing set. When the swing is raised and released, it will move freely back and forth due to the force of gravity on it. A swing is an example of a pendulum for it is an object hung from a fixed point that swings back and forth. The object that swings in a pendulum is called a bob. Galileo was the first to examine the pendulum s unique characteristics. The time it takes a pendulum to swing back to its original position is called the period of the pendulum. Galileo found that each pendulum has a constant period and that the pendulum passes twice through the arc during each period. For example, this is the time it takes a child being pushed in a swing to be pushed and then return back for another push. The period of the pendulum depends on the force of gravity, as well as the length of the pendulum. Today we know that the period of the pendulum will remain constant as long as the pendulum's angle is no greater than about 20 degrees, and even then, it is not completely precise. A pendulum moving along a greater arc traverses a greater distance and its velocity is greater. This is because it falls from a greater height and at a more acute angle. As a result of these factors, its speed is far greater. A longer string will take a greater amount of time to complete one swing than a shorter string, which you can see from the figure: it has to travel a larger distance for the same angle of swing. When you first hang a pendulum, it hangs straight down, toward the ground. To make a pendulum swing, you have to pull it to one side and let go. And when you let go, gravity (the force that pulls objects toward Earth) pulls the pendulum downward, while the string moves the pendulum to the side. Then, when the pendulum gets to the middle, it keeps swinging and goes up on the other side. Galileo made an intuitive leap that turns out to be approximately true, but not exactly so: he surmised that the length of the string is the only thing that determines the period. The exact mass of the bob isn t important, as long as it s sufficiently heavier than the string. Isaac Newton defined mass as the resistance to motion: the more mass an object has, the harder it will be to get it moving if it s at rest, or to change its direction or bring it to a stop if it s already in motion. He also recognized that the larger the mass, the greater the gravitational attraction that object will possess. 29

31 For our pendulum, the resistance to motion as the bob swings back and forth is proportional to its mass, but so is the force acting on the bob due to gravity. With the same proportionality for both cause the force and effect, the mass drops out of the picture! Resistance to Motion Mass Gravity Gravity is what keeps the pendulum swinging, not what makes it stop. When the pendulum is at the very top of its swing it is motionless for that split second, but it is at its highest point. So it has no kinetic energy (KE), but it does have potential energy (PE). Kinetic energy is energy possessed by a body by virtue of its movement. Potential energy is the energy possessed by an object due to its position or state. On the way down the pendulum speeds up and trades PE for KE, thanks to gravity pulling it down. At the bottom of its swing it is moving as fast as it ever will, but is at its lowest point. So it has all KE but no PE. And on the way back up it slows down and trades speed for height. So again, back at the top of its swing it is all KE and no PE. In an ideal (i.e., no friction) world, the pendulum would swing forever, repeatedly trading KE for PE and vice-versa. But in real life there is friction, and friction causes losses of momentum (mass * velocity). In the case of the pendulum the two sources of loss are air resistance (friction between the pendulum and the air it's moving through) and the friction at the pendulum's pivot point (the hinge). The air resistance is at its maximum when the pendulum is moving fastest (the bottom) and zero when it's stationary (at the top). In an apparatus with multiple pendulums you can create interesting wave patterns if each pendulum has a slightly different length of string, and the relative lengths consistently increase along the apparatus. This means the period of oscillation isn t going to be the same for each pendulum, even though they all swing through the same angle. The exact relationship between string lengths is designed to create the illusion of a wave; in addition, as the pendulums slow down due to air resistance, the pattern changes. The pendulums begin together, but because they have different periods of oscillation, they quickly fall out of sync but because of the specific relationship between the lengths of the pendulum strings, they create fascinating wave patterns. 30
32 FRAMEWORK FOR SCIENTIFIC EXPLANATION McNeill &Krajcik Presented at NSTA 2011 WHY SCIENTIFIC EXPLANATIONS AND ARGUMENTS? Science education reform efforts call for students to develop scientific processes and skills through inquiry (American Association for the Advancement of Science, 1993; National Research Council, 1996). One prominent inquiry practice in both the standards documents and research literature is the construction, analysis, and communication of scientific arguments. We believe that argument construction should be an important part of science class for multiple reasons. First, research into scientists practices portrays a picture where scientists construct arguments or explanations including weighing evidence, interpreting text, and evaluating claims (Driver, Newton & Osborne, 2000). Second, previous research in science education has found that having students engage in argumentation may change or refine their image of science as well as enhances their understanding of the nature of science (Bell & Linn, 2000). Third, constructing arguments can enhance student understanding of the science content (Driver, Newton & Osborne, 2000) as well as their ability to write in science (McNeill & Krajcik, 2006). Finally, assessing students scientific arguments can help make their thinking visible both in terms of their understanding of the science content and their scientific reasoning (McNeill & Krajcik, 2007; McNeill & Krajcik, 2008a). WHAT IS A SCIENTIFIC EXPLANATION? A scientific explanation is a written or oral response to a question that requires students to analyze data and interpret that data with regard to scientific knowledge. Our explanation framework includes four components: claim, evidence, reasoning and rebuttal. While we break down arguments into these four components for students, our ultimate goal is to help students to create a cohesive argument in which all components are linked together. Yet we have found that first breaking arguments down into the components can ultimately help students create cohesive arguments. In the following section, we describe three components of a scientific argument. Claim The claim is a testable statement or conclusion that answers the original question. The claim is the simplest part of an argument and often the part students find the easiest to include as well as to identify when they are critiquing other peoples arguments. One of the purposes in focusing on scientific arguments is to help students include more than a claim in their writing. 31
33 Evidence The evidence is scientific data that supports the student s claim. This data can come from an investigation that students complete or from another source, such as observations, reading material, archived data, or other sources of information. The data needs to be both appropriate and sufficient to support the claim. When introducing evidence to students, we suggest discussing appropriate data in terms of whether the data supports the claim. A good argument only uses data that supports the claim in answer to the original question. Students should also consider whether or not they have sufficient data. When introducing this concept to students, we suggest discussing sufficient data in terms of whether they have enough data. When students are selecting their data to use as evidence, they should consider both whether it is appropriate to support their claim and whether they have enough data to support their claim. We have found that this can be difficult for students. While they realize that they should include data as evidence, they are not necessarily sure which data to use or how much data to use. Reasoning Reasoning is a justification that shows why the data counts as evidence to support the claim and includes appropriate scientific principles. The reasoning ties in the scientific background knowledge or scientific theory that justifies making the claim and choosing the appropriate evidence. We have found that students have a difficult time including the entire reasoning component. Often students simply make a general link between the claim and evidence. You want to help students learn to include the scientific background knowledge that allowed them to make that connection between claim and evidence. K12 Alliance/WestEd 32
34 Claim A statement or conclusion that answers the original question/problem. Sample CER Rubric with Content Answer Example McNeill & Krajcik (2007) LEVEL Does not make a claim, or Makes an accurate but makes an inaccurate claim. incomplete claim. States none of the liquids are the same Vague statement, like some of the or specifies the wrong solids. liquids are the same. Makes an accurate and complete claim. Explicitly states, Liquids 1 and 4 are the same substance. Evidence Scientific data that supports the claim. The data needs to be appropriate and sufficient to support the claim. Reasoning A justification that connects the evidence to the claim. It shows why the data counts as evidence by using appropriate and sufficient scientific principles. Does not provide evidence, or only provides inappropriate evidence (Evidence that does not support claim). Provides inappropriate data, like the mass is the same or provides vague evidence, like the data table is my evidence. Does not provide reasoning, or only provides inappropriate reasoning. Provides an inappropriate reasoning statement like they are like the fat and soap we used in class or does not provide any reasoning. Provides appropriate, but insufficient evidence to support claim. May include some inappropriate evidence. Provides 1 or 2 of the following pieces of evidence of evidence: the density, melting point, and color of liquids 1 and 4 are the same. May also include inappropriate evidence, like mass. Provides reasoning that connects the evidence to the claim. May include some scientific principles or justifications for why the evidence supports the claim, but not sufficient. Repeats the density, melting point and color are the same and states that this shows they are the same substance. Or provides and incomplete generalization about properties, like mass is not a property so it does not count. Provides appropriate and sufficient evidence to support claim. Provides all 3 of the following pieces of evidence: the density, melting point, and color of liquids 1 and 4 are the same. Provides reasoning that connects the evidence to the claim. Includes appropriate and sufficient scientific principles to explain why the evidence supports the claim. 33 Includes a complete generalization that density, melting point, and color are all properties. Same substances have the same properties. Since liquids 1 and 4 have the same properties they are the same substances.
35 Carousel Strategy DESCRIPTION: The Carousel is a cooperative learning strategy in which student groups brainstorm and discuss information provided on charts around the room. The charts can provide scaffolding for new information to be learned, student created work to be evaluated, or existing information to be reviewed. This strategy promotes movement, guided practice, conversation, and reflection. This technique allows for small group discussion followed by whole class reflection. Each small cooperative group moves about the room stopping at various stations/charts. Teachers will assign a specific period of time for each station/chart depending on the task to be completed at each stop (usually 1-3 minutes). Each station chart might include an open-ended question, student created work to be discussed or evaluated using a rubric, or other content related information. Examples of tasks to complete at the charts might be to discusses the information, brainstorm answers or solutions, and write down responses within a given amount of time or evaluate information using a rubric. When the teacher carousels students, or rotates the groups to new locations, they repeat the exercise with a new question. This time students must read the responses from the previous group(s) before they begin to write down new ideas. Directions: 1. Pick at least 5 related topics or concepts and write each one on one piece of flip chart paper (at the top). Also, this could be student work, questions, pictures, or passages. 2. Number the posters and post them in order around your room. 3. Assign each student a number from one to five (or however many topics you have). 4. Ask all students to move to the paper labeled with their assigned number. 5. Give each group a different-colored marker to record their information. Option: This feedback can also be written and displayed on post-its. 6. Give the groups about 1-3 minutes to write on the flip chart paper everything they know or have learned about the topic. If they are not sure about their information, they can write a "?" by it. 7. When time's up, the groups rotate to the next number. 8. They read what other groups have written, make corrections or additions, and add any new information they know. 9. The process repeats until the groups have rotated through all the topics. 10. Wrap up the brainstorming session by having a discussion about the topics on each piece of chart paper and reading/discussing what each group wrote, answering questions as you go. 11. Have your students organize the information from the brainstorming session by using a graphic organizer, writing a summary, or doing a gallery walk, recording useful information. OPTIONS: Students quickly rotate back through stations to view their peers responses. 34
36 Have each group share with the entire class the highlights of three ideas/concepts from the last poster they viewed. Other visuals may be used instead of student work (i.e., photographs pertaining to a topic, quotations, math problems, chart paper with questions or prompts, etc.) Post questions or topics across the top of the poster and have groups list two or three ideas or responses on the chart using different colored markers or pens. Have students walk around the room with a specific task (i.e., making notes, scoring with a rubric, using post-its to give feedback, etc.) as they view each item. Ask your students to write a one-sentence summary over what they think is the most important information about each topic (instead of just writing freely). Ask students to plan their own carousel brainstorming review. They determine the key topics, write them on the charts, and organize the groups. Students can also write questions about things that other groups wrote (existing answers/notes about the topic/question). Provide sentence frames Provide a rubric to guide students observations. Examples that you might use in your classroom: Before beginning a lesson on the civil rights era, you might post the names of some key people and events from this time in history to draw out students background knowledge. Upon finishing The Diary of Anne Frank, you might choose to pose different critical thinking questions about the novel as a means to review the story. After a unit on plants, you might post guiding questions about the major topics covered in the unit to review the material. Students post a math problem, science explanation, poem, or etc. for other students to provide feedback and/or use rubric to evaluate with feedback. RESOURCES:
37 Adapted Language Frames for Argumentation Leading to a Scientific Explanation Adapted from Foss and Frey, The Art of Argumentation. Science and Children 47 (3), (2009) Claim Testable statement or conclusion that answers the original question. Evidence Appropriate and sufficient to support the claim. (investigation., observations, reading, or other sources) Reasoning Justification for why the data counts as evidence. Use scientific background information to link claim and evidence. Offering a counter-claim or rebuttal Scientists include disagreements with current ideas when making a claim. Asking for evidence: Clarify Inviting Speculation Reaching Consensus Supports when creating an Explanation I claim. Specific frame: e.g. The burrowing owl population is decreasing due to. Open frame: The is due to. My question was. My claim is. Evidence for my claim is and. I observed. The evidence is enough to support the claim because. The evidence is the right evidence for my claim because. Science reading about is similar to my claim and the evidence. Two other sources and had similar results. Therefore, the evidence for my claim is supported by and. I disagree with claim because. Supports when questioning someone else s claim I have a question about. Does have more? What causes to? Can you show where you found the evidence for? Why did you select the evidence used? I wonder what would happen if? I have a question about. Let s find out how we can test samples for? We want to test to find out. If I change then I think will happen. I wonder why? How would this be different if? What do you think will happen if? Supports when reaching a group or class consensus about a claim. I agree because. We agree on. We do not agree on. 36
38 Fishbowl Strategy How To Definition: The Fishbowl strategy is used in a way in which a few students model a skill or task while other students observe the process. The strategy gives students an opportunity to hear the experiences, ideas, and feedback of current students who are actively engaged in conversation around a specific concept or skill. Fishbowl activities force participants to listen actively to the experiences and perspectives of a specific group of people. Students are to listen for explanation of thinking as well as concept information. Student fishbowl discussions usually are most successful when they are informal. Remember that the fishbowl students have not had an opportunity to develop comfort with the participants of your class or workshop. The fishbowl strategy can be used as a guided-practice structure, review, or modeling. Directions: 1. Select two or more students (student groups) to be in the fishbowl. 2. Instruct the rest of the students to sit or stand around them to watch as the teacher instructs the students inside the fishbowl. 3. Provide an observation sheet or task for student observers to complete. 4. Inside the bowl, guide the conversation and highlight key strategies for observers. 5. Review or build on the key information the fishbowl addressed. One important ground rule must guide the participation of the observers: During the course of the fishbowl, observers are not allowed to speak. Their job is to listen and learn from the fishbowl students. Mention that the observers will have an opportunity to discuss any issues that emerge in later processing dialogue. Options: Allow the observers to select a particular student to watch during the fishbowl to keep the observers actively participating. Allow fishbowl participants to phone a friend or seek help from other fish. Allow time for fishbowl participants to discuss, question, or practice prior to conducting fishbowl. Provide sentence or question frames to aid discussion prior to participating in the fishbowl. 37
39 Sample Scientific Explanations Student #1 The length determines the swing. The data table shows that this is true. The mass might change it too if you have the right data to show it. We did not test that. Student #2 The length of the pendulum determines the pendulum s swing. The data in our experiment shows that the pendulum period decreases as the string length decreased. We ran the same test with different masses and found no big change. Student #3 The length of the pendulum determines the pendulum s period. We used 3 different string lengths of 10, 20, and 40 cm. We made sure to keep the drop angle the same and we calculated that a 10cm pendulum had 72 swings/minute. As we went down to 20 cm and 40 cm, the swings decreased to 56 and 42 swings/minute respectfully. We repeated the experiment using a bob with a smaller mass and the periods were the same. The pendulum length determines the distance the pendulum travels and therefore affects the total amount of friction and slows the down the pendulum. And now for something completely different. Student #4 The pendulum completes the period in a shorter length of time when the bob s mass is greater. Our evidence showed that when 2 pendulums were dropped from the same height, the pendulum with greater mass completed a period in a shorter length of time. This indicated that a greater mass on the bob will cause the pendulum to swing faster. This disproves Newton and Galileo. 38
40 39 CCSS ELA Argumentation Text Text Type and Purposes #1 (Grade 8) Write arguments to support claims with clear reasons and relevant evidence. a. Introduce claims and acknowledge and distinguish the claims from alternate or opposing claims and organize the reasons and evidence logically. b. Support claims with logical reasoning and relevant evidence, using accurate, credible sources and demonstrating an understanding of the topic or text. c. Use words, phrases and clauses to create cohesion and clarify the relationships among claims, reasons and evidence. d. Establish and maintain a formal style. e. Provide a concluding statement or section that follows from and supports the argument presented Compare CCSS ELA and Science/Engineering Practice 7 CCSS ELA Opinion Text Text Type and Purposes #1 (Grade 4) Write opinion pieces on topics or texts, supporting a point of view with reasons and information. a. Introduce a topic or text clearly, state an opinion and create an organizational structure in which related ideas are grouped to support the writer s purpose. b. Provide reasons that are supported by facts and details. c. Link opinion and reasons using words and phrases (e.g., for instance, in order to, in addition). d. Provide a concluding statement or section related to the opinion presented. Science and Engineering Practice 7 Engaging in Argument from Evidence (Grades 3-5) Engaging in argument from evidence in 3 5 builds on K 2 experiences and progresses to critiquing the scientific explanations or solutions proposed by peers by citing relevant evidence about the natural and designed world(s). Compare and refine arguments based on an evaluation of the evidence presented. Distinguish among facts, reasoned judgment based on research findings, and speculation in an explanation. Respectfully provide and receive critiques from peers about a proposed procedure, explanation, or model by citing relevant evidence and posing specific questions. Construct and/or support an argument with evidence, data, and/or a model. Use data to evaluate claims about cause and effect. Make a claim about the merit of a solution to a problem by citing relevant evidence about how it meets the criteria and constraints of the problem.
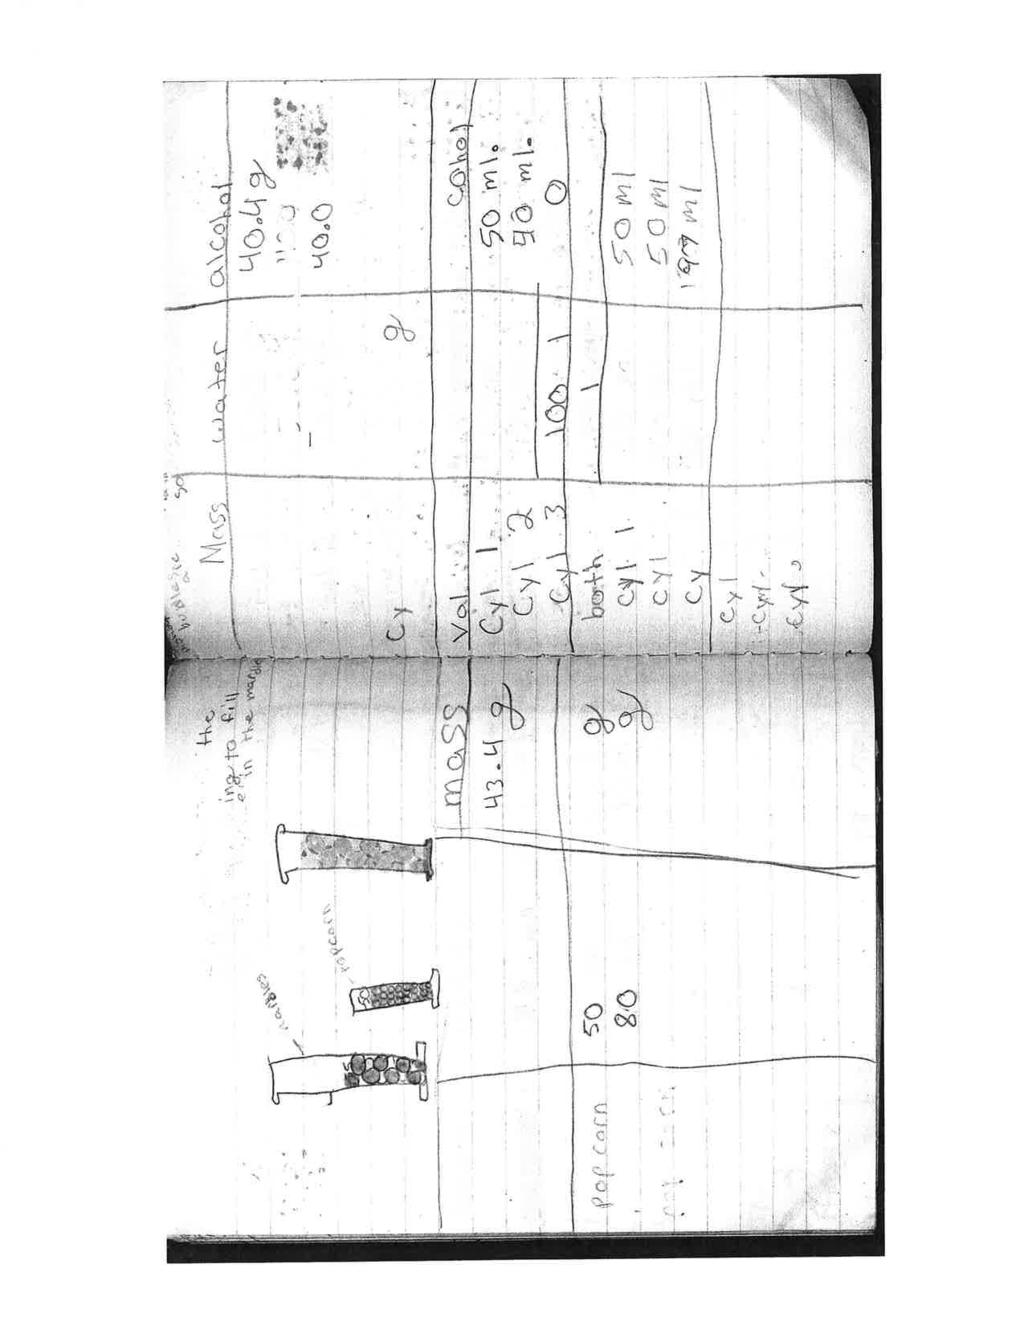
41 40
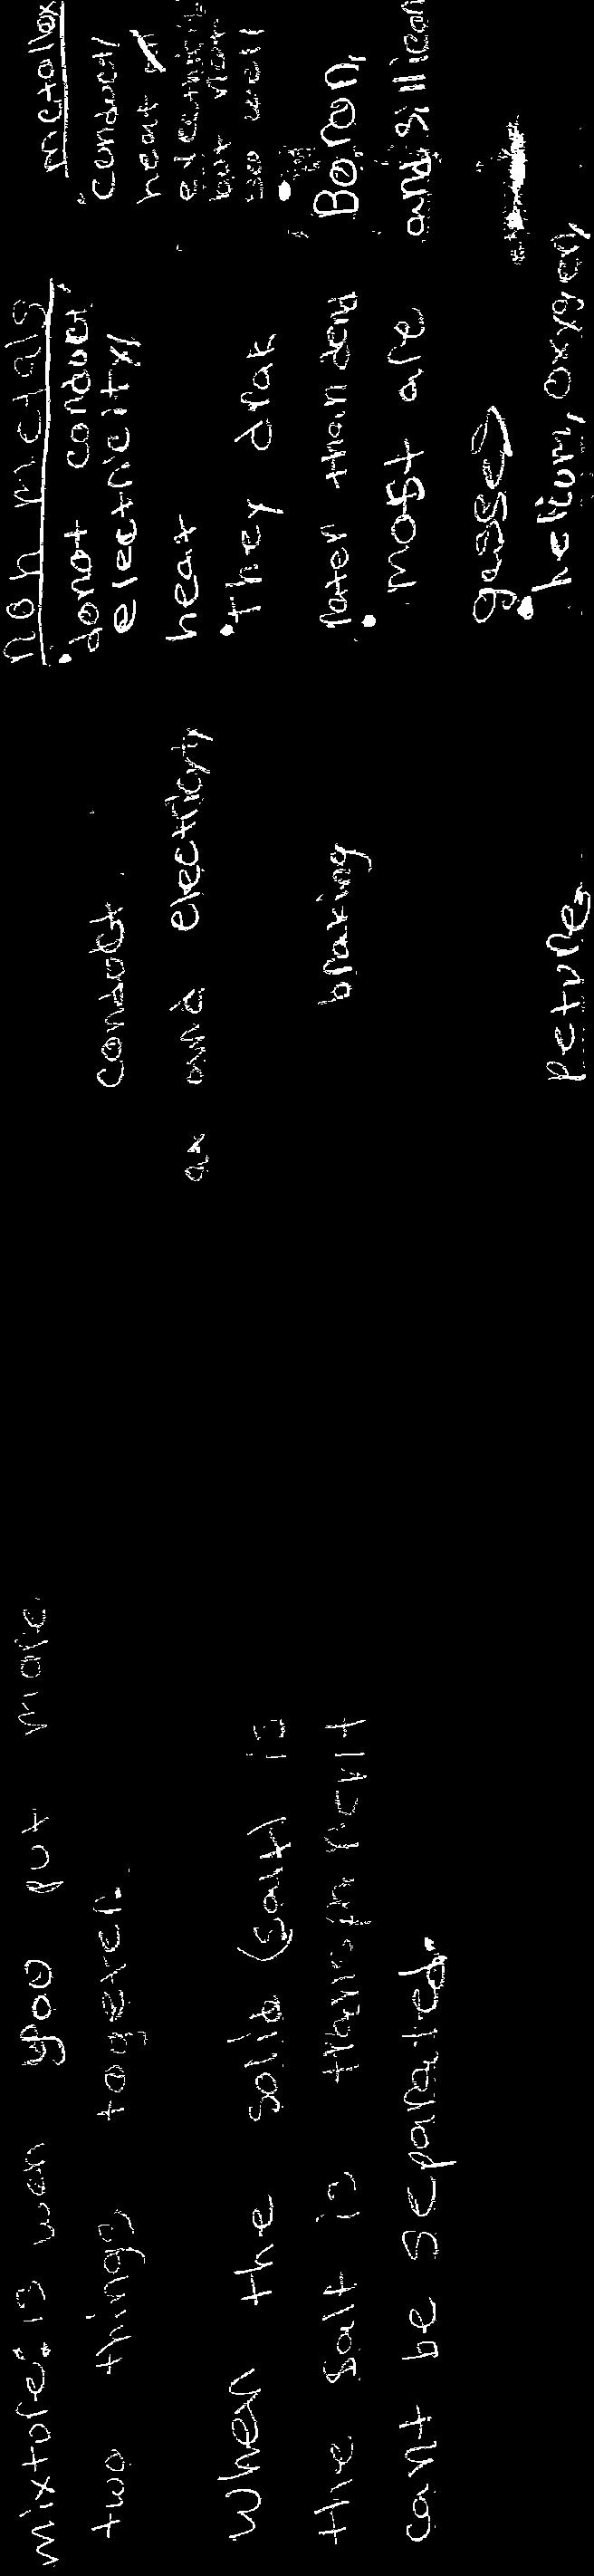
42 41
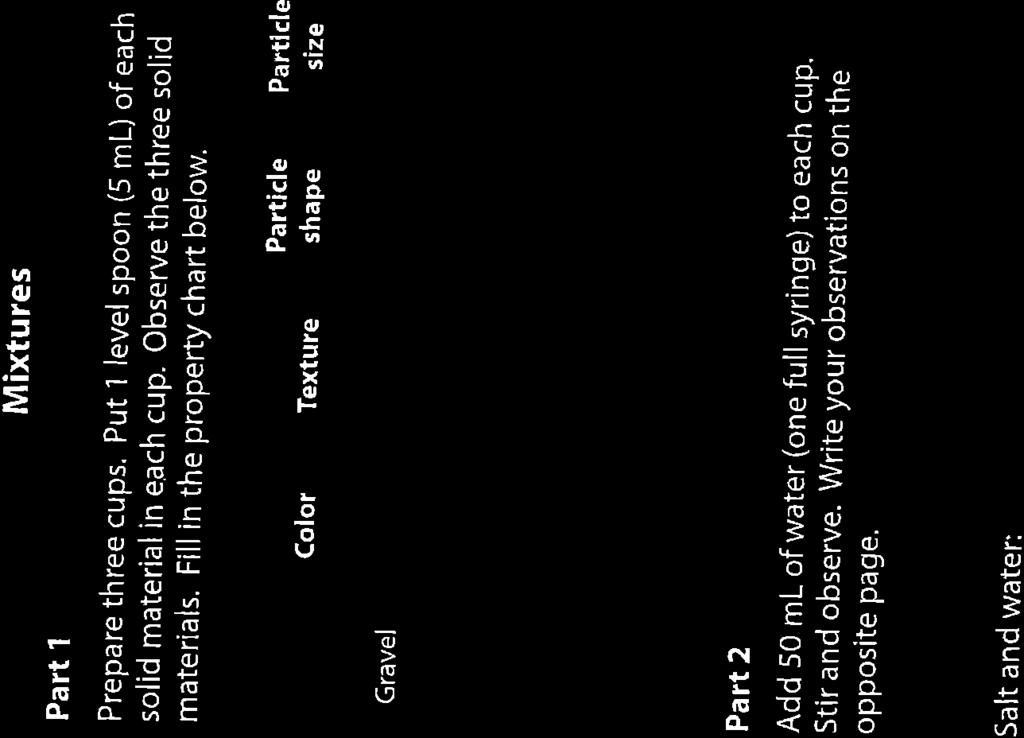
43 42
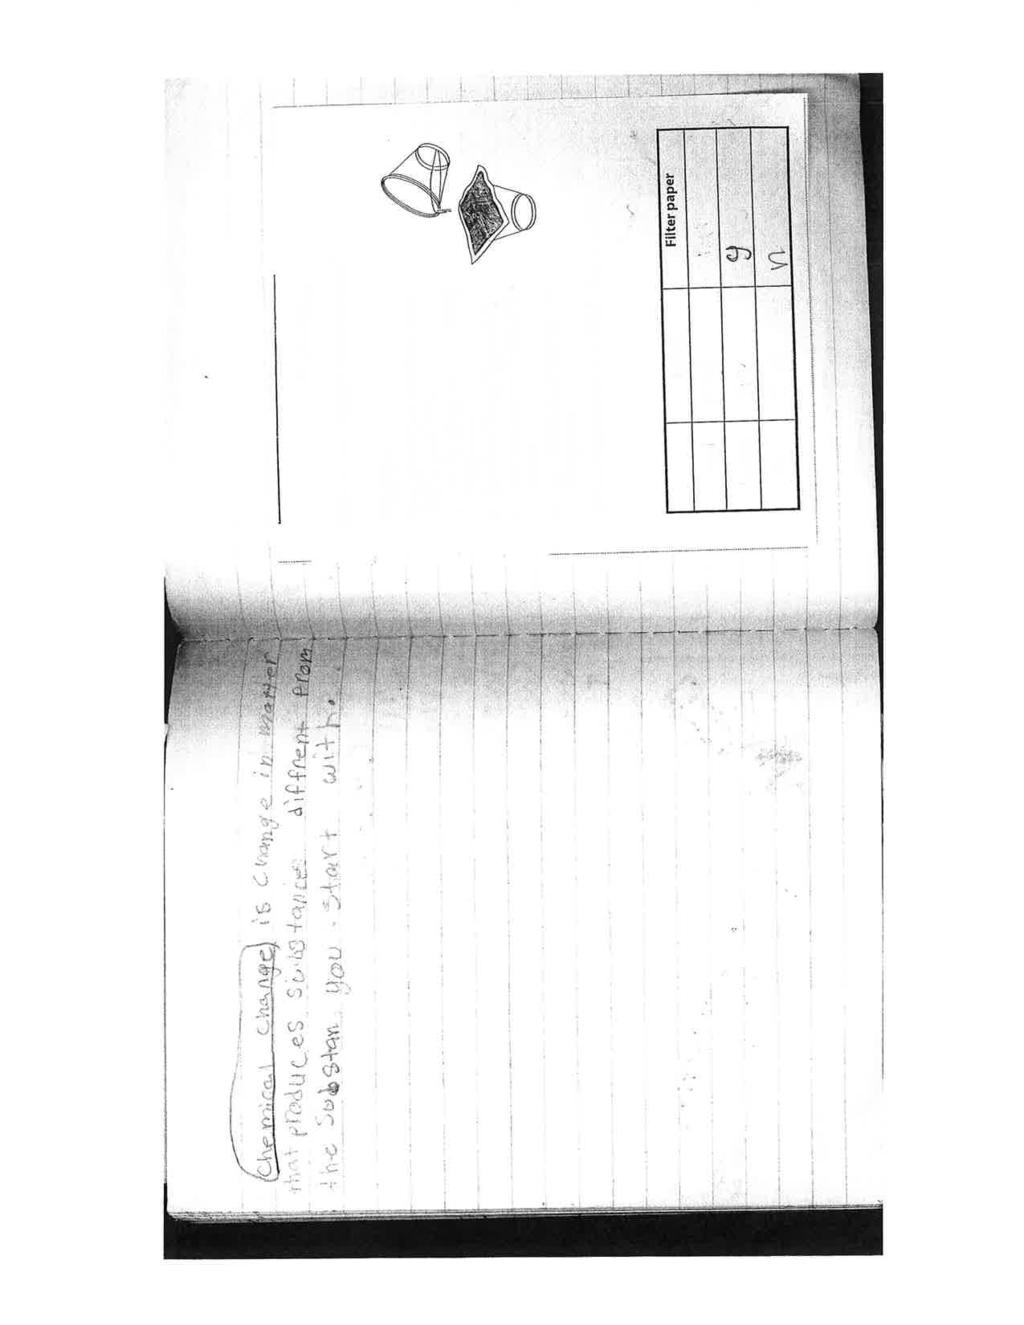
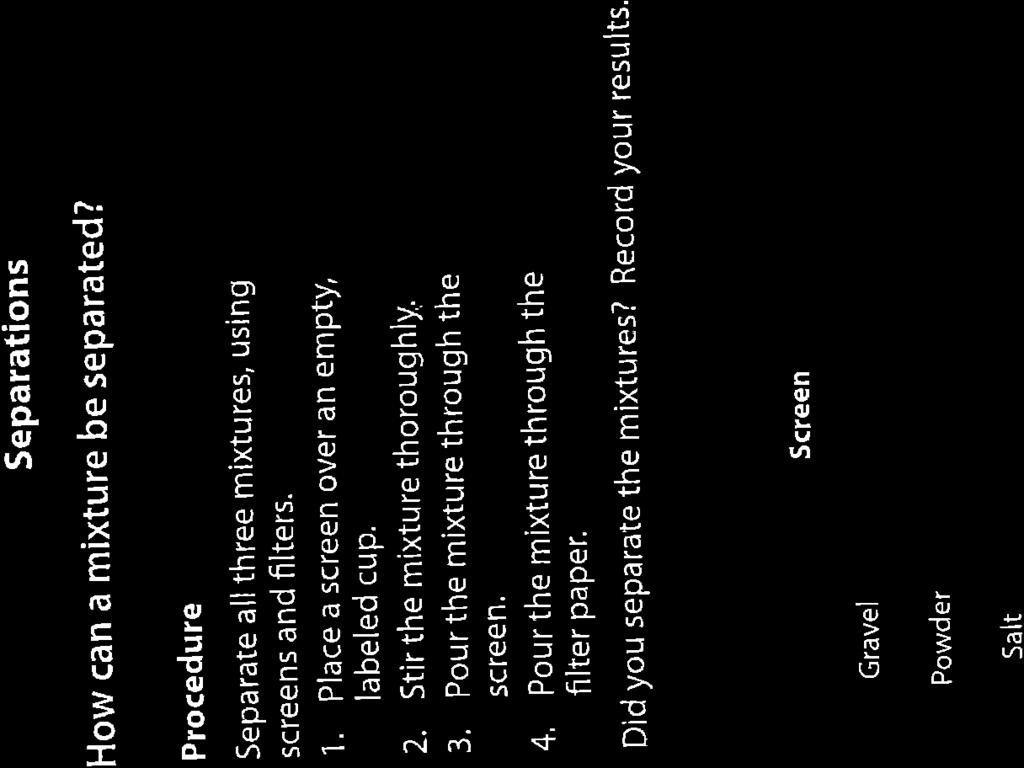
44 43

45 44
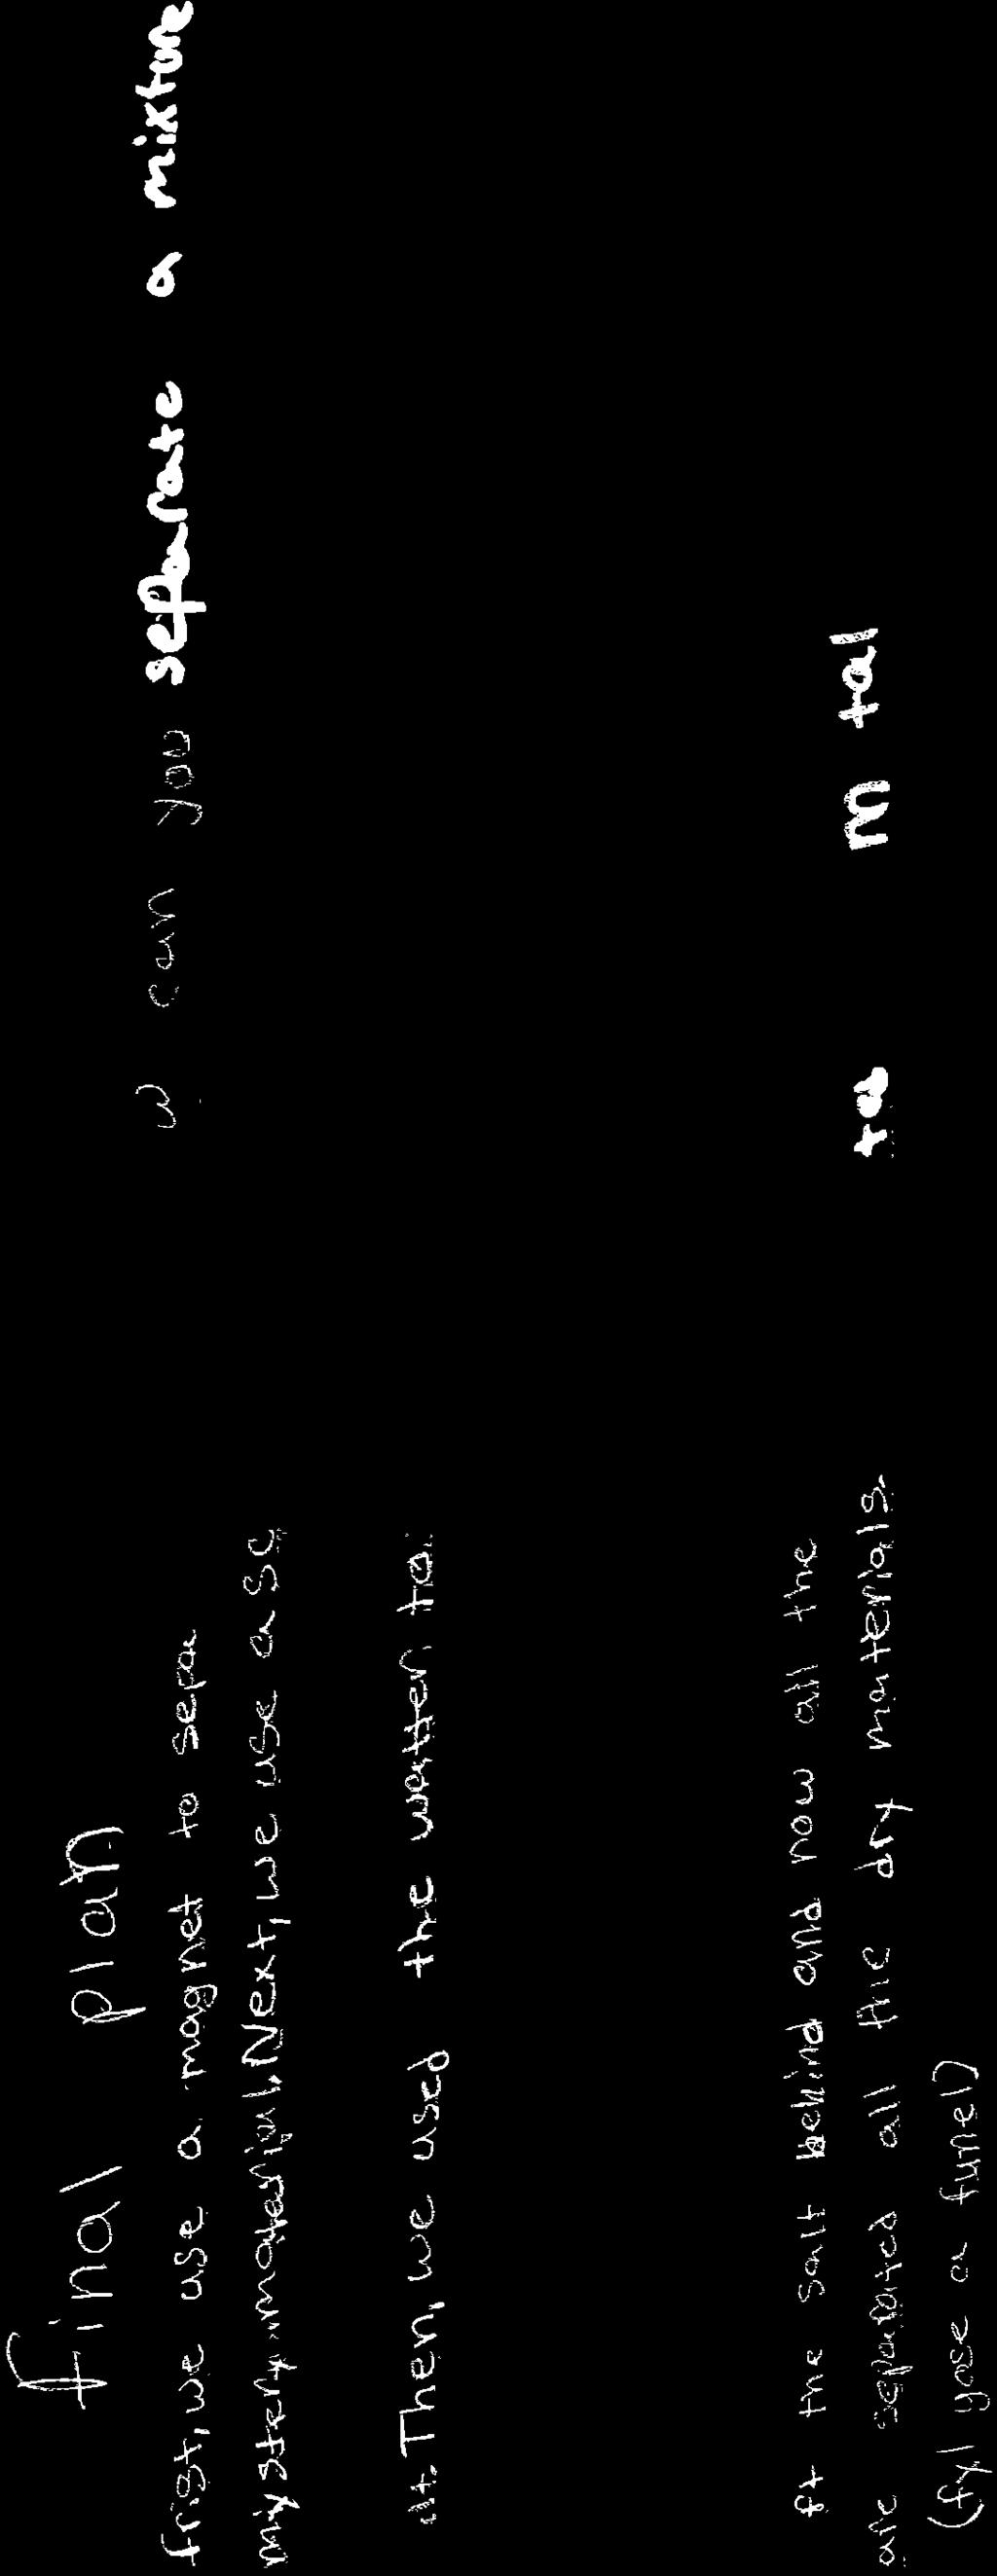
46 45
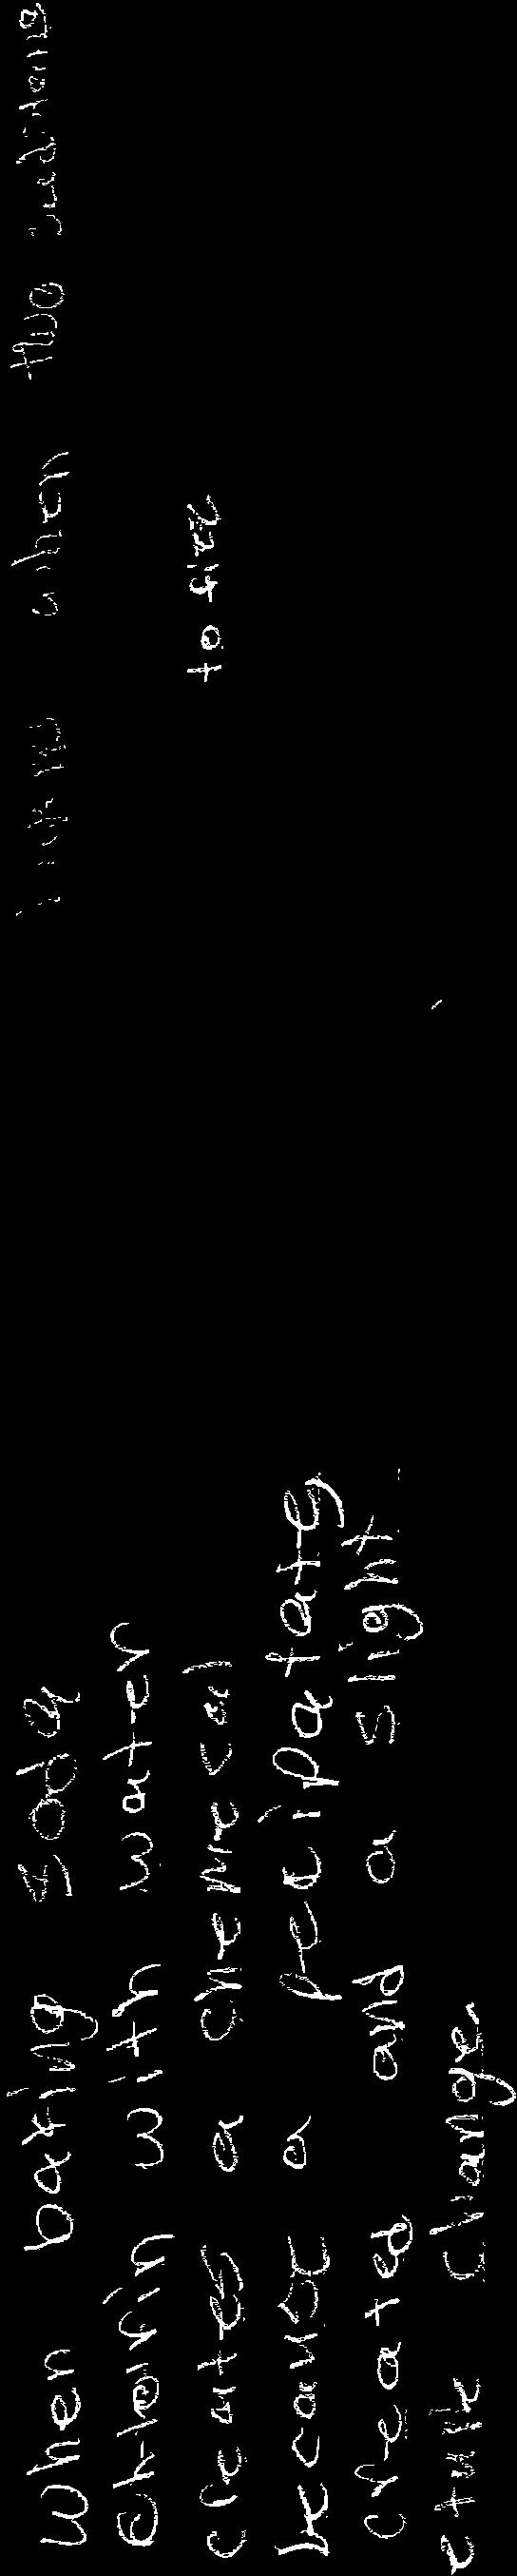
47 46
48 47
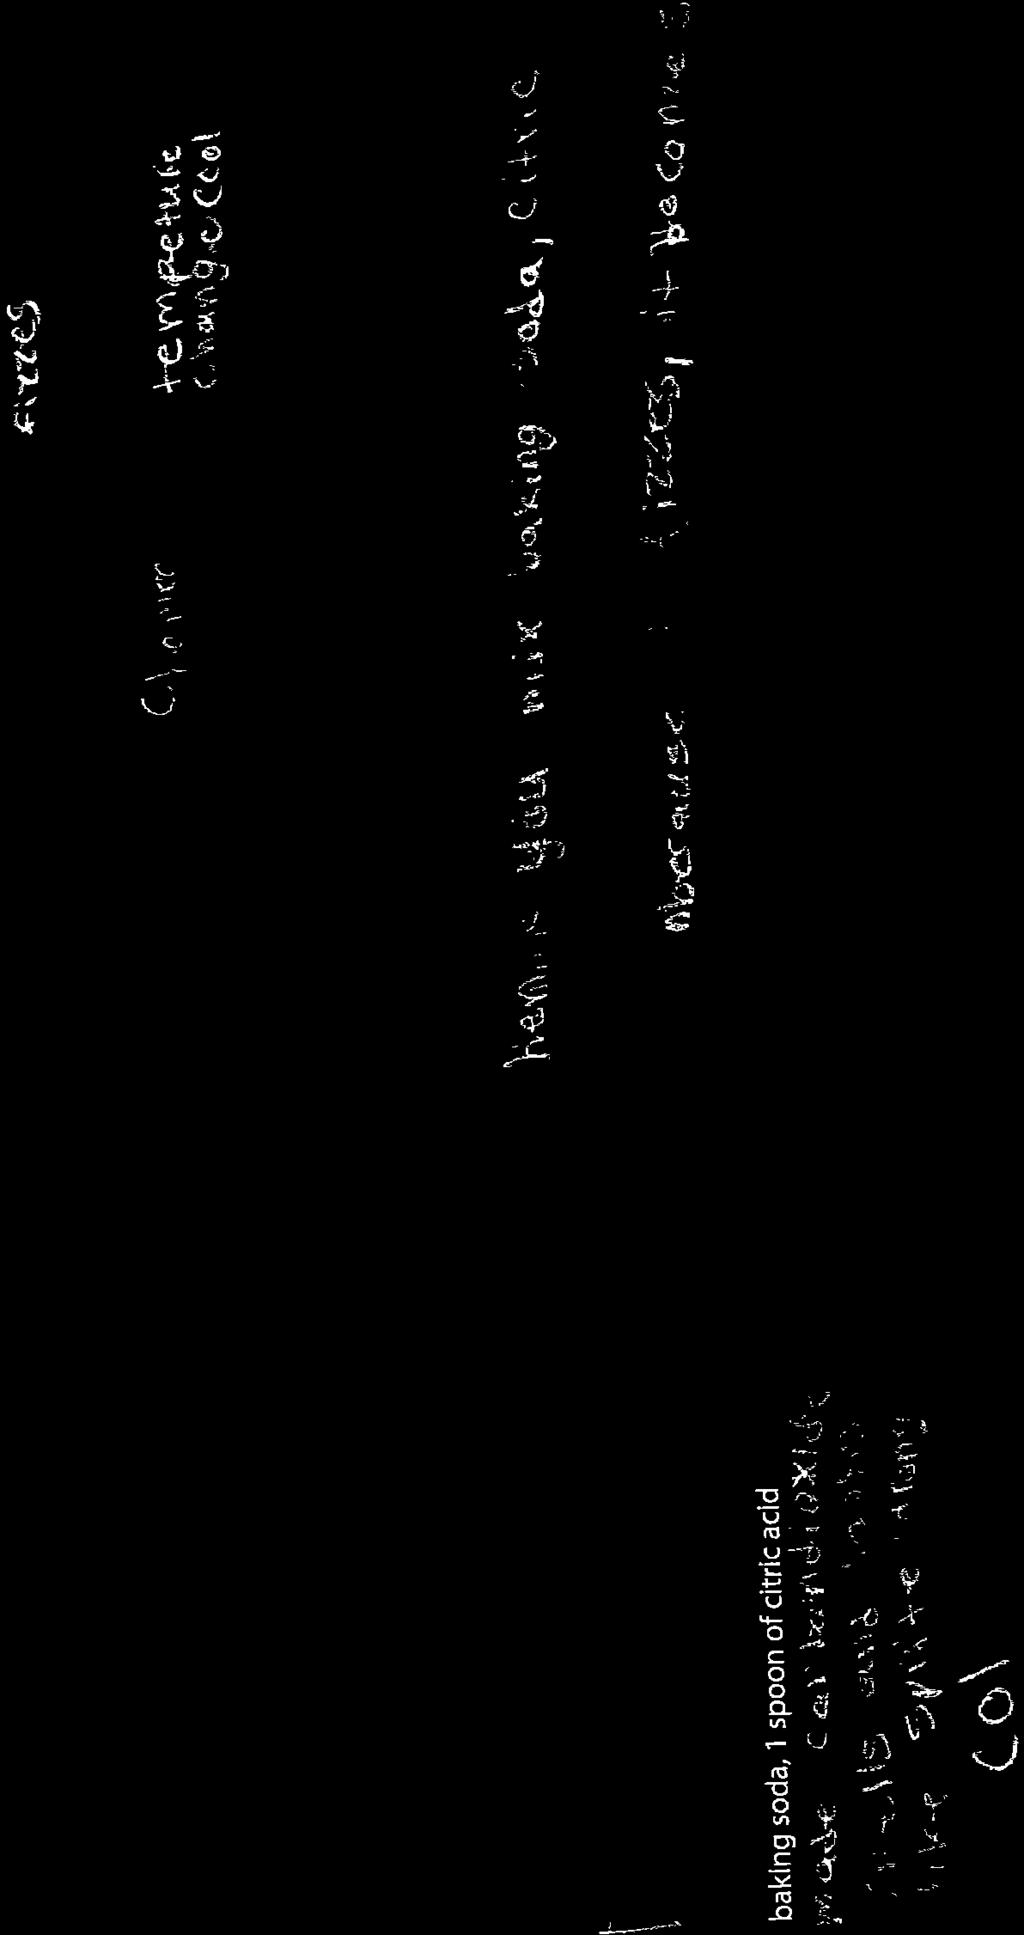
49 48
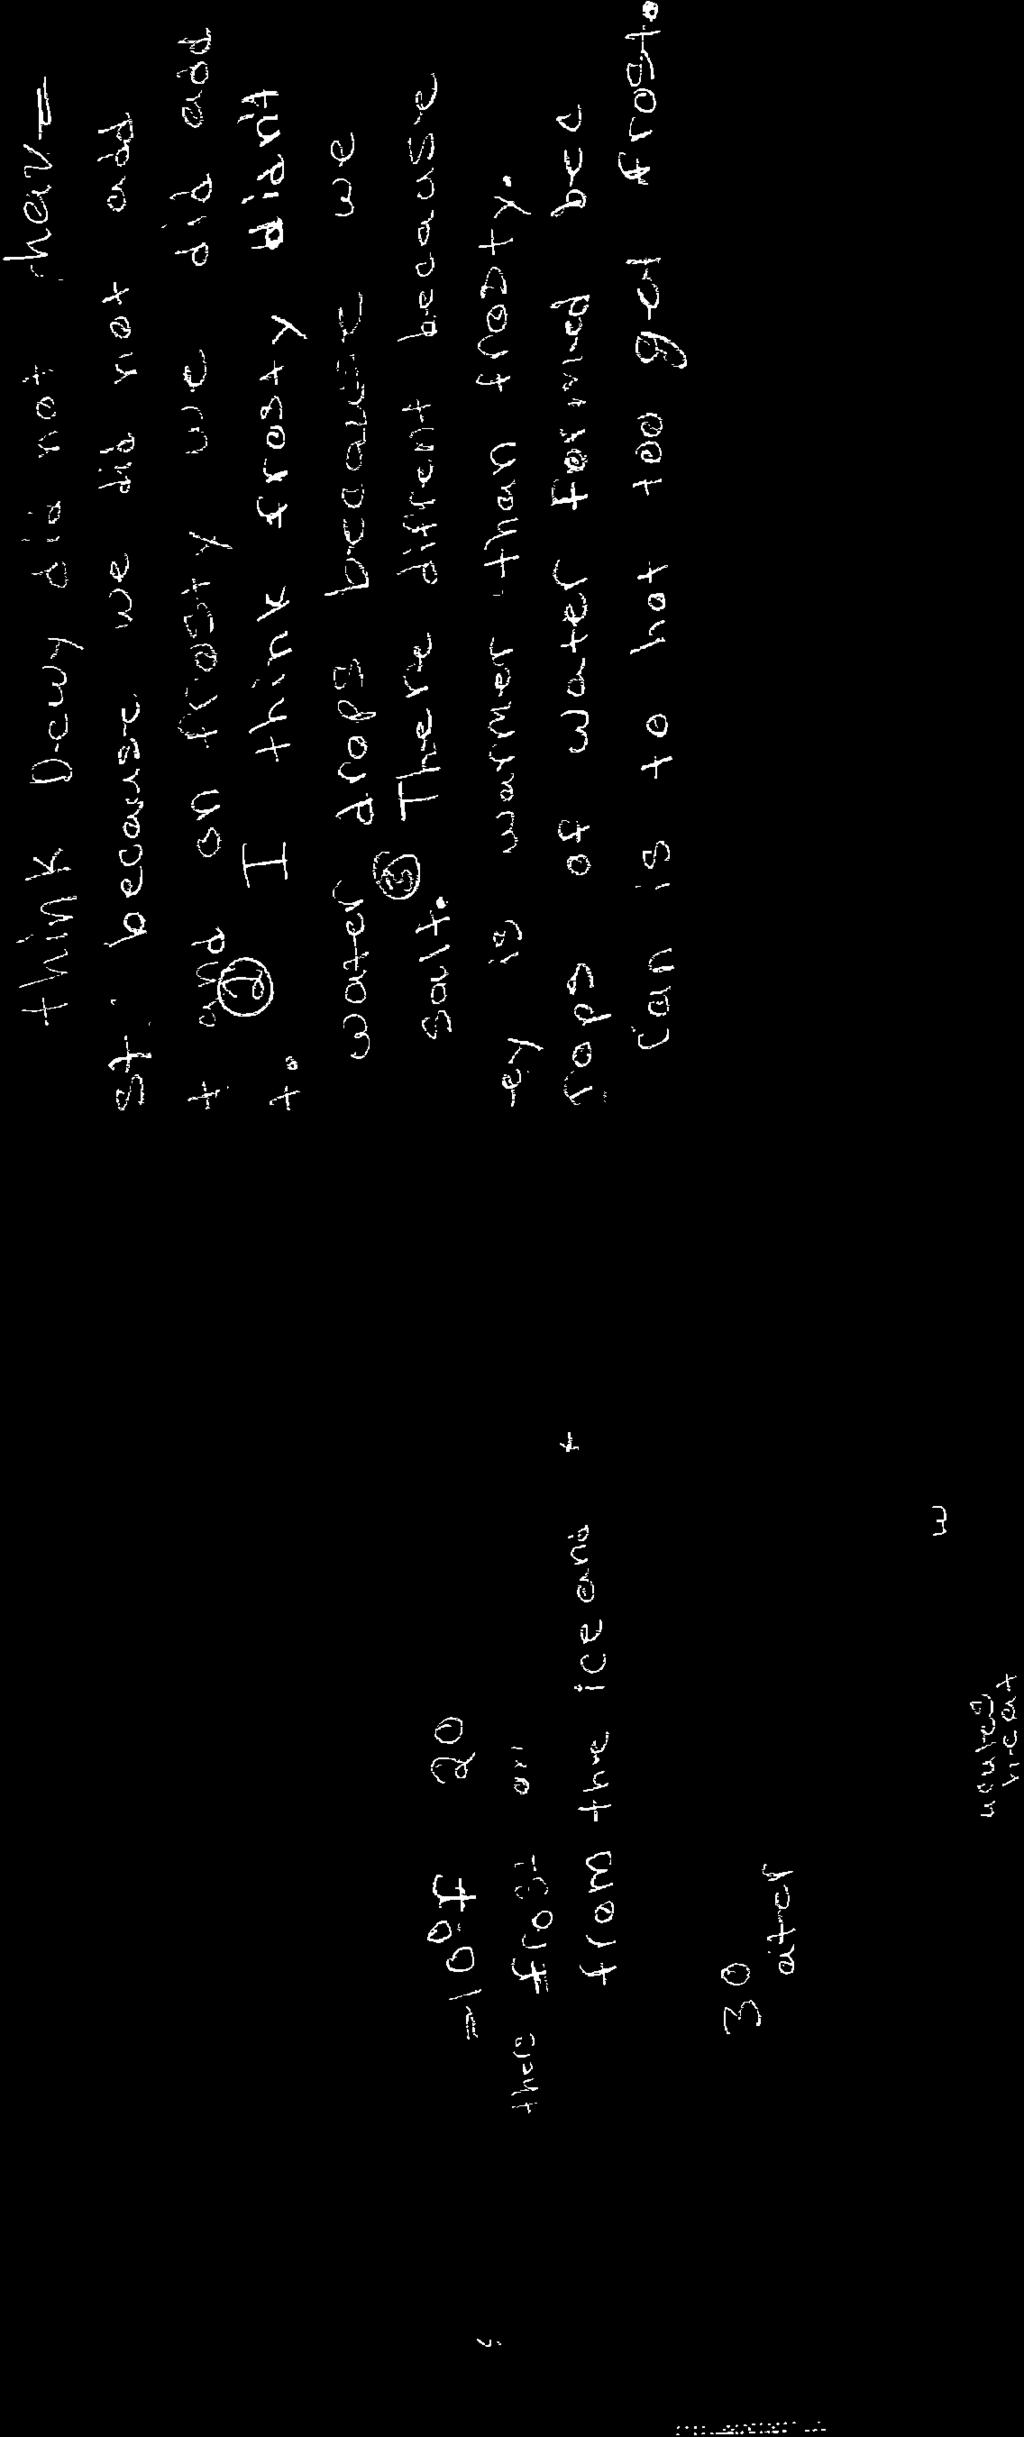
50 49
51 50
52 51
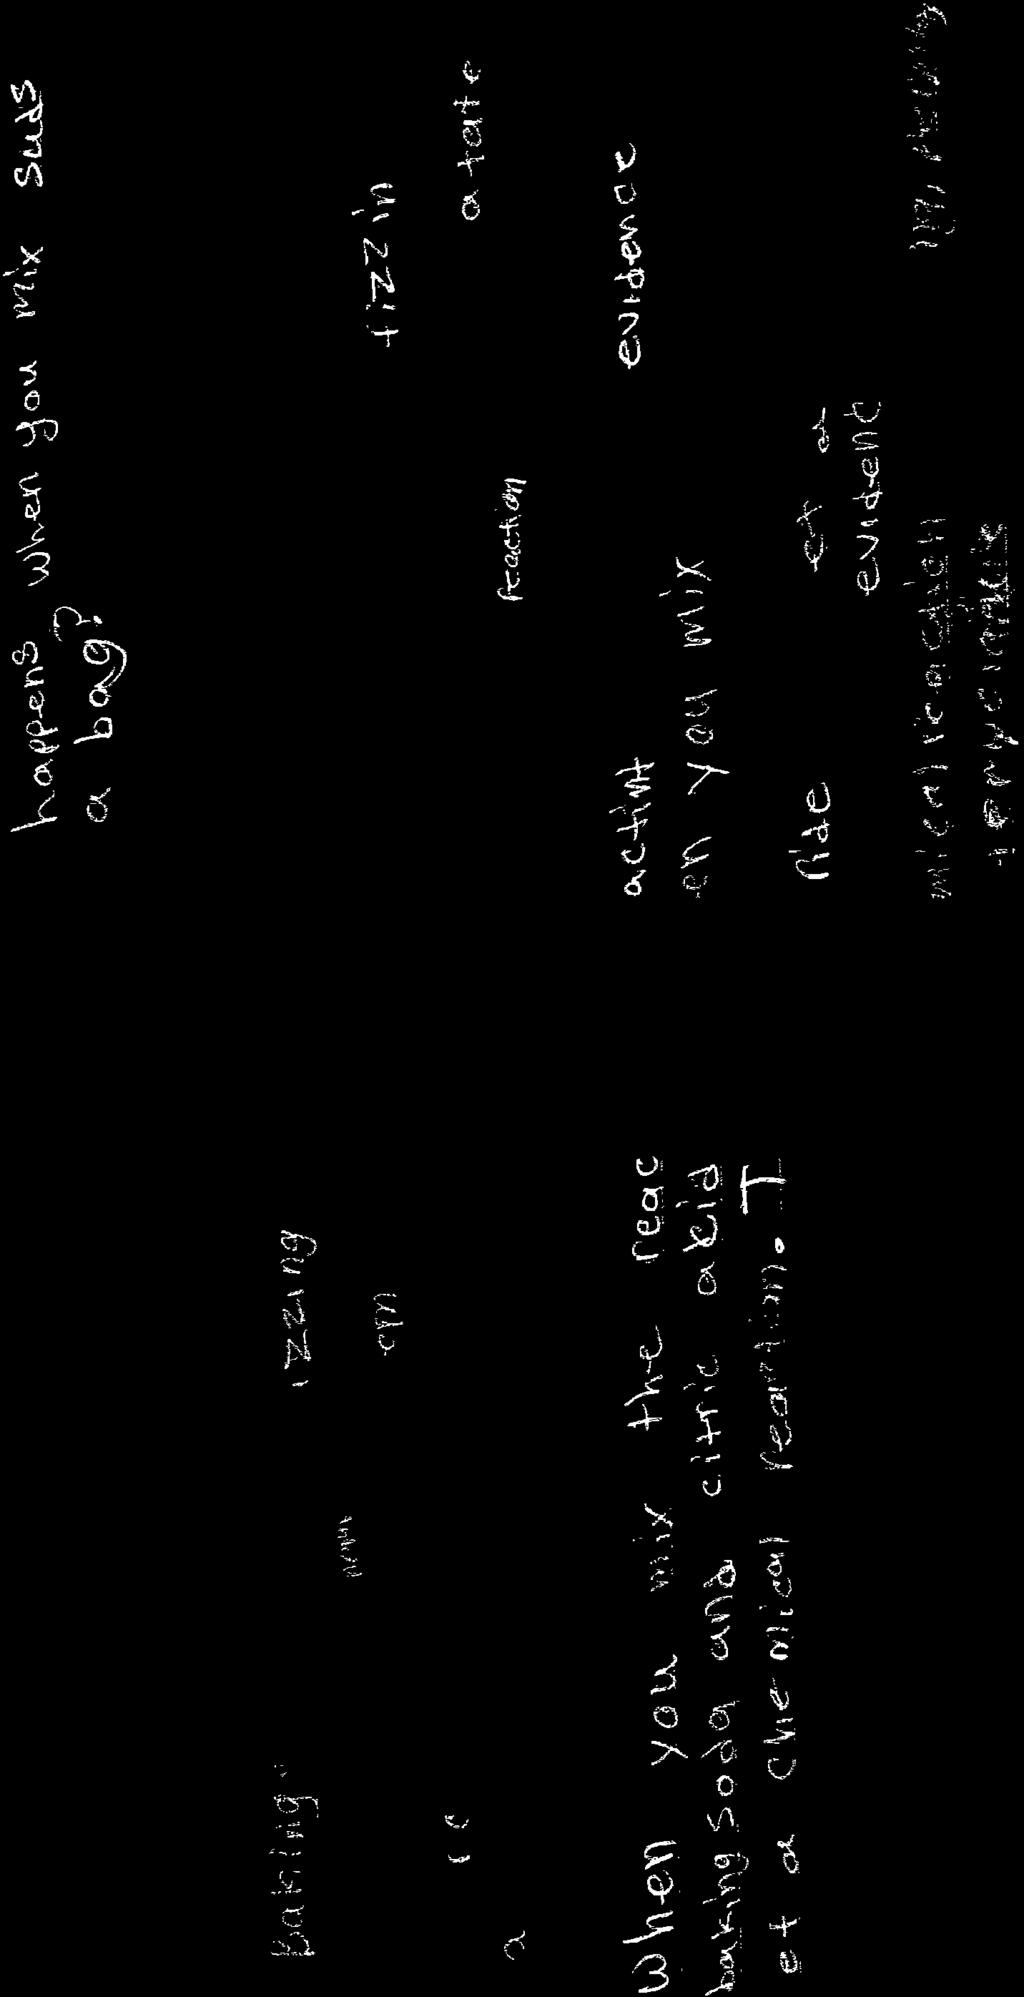
53 52
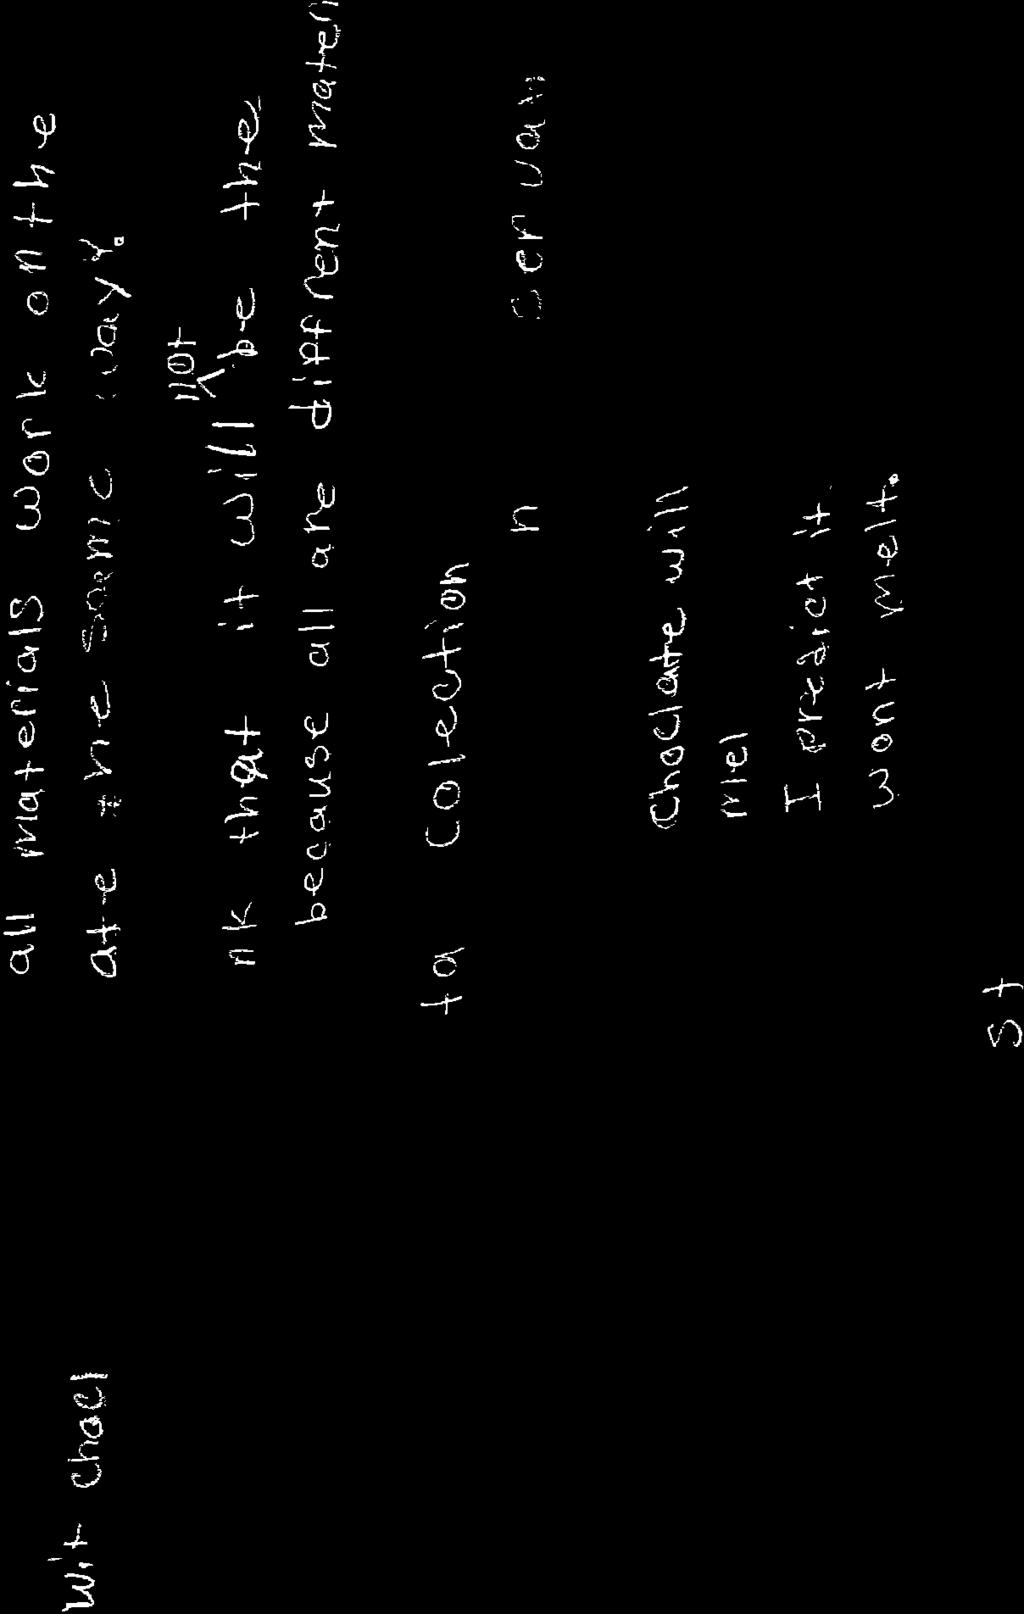
54 53
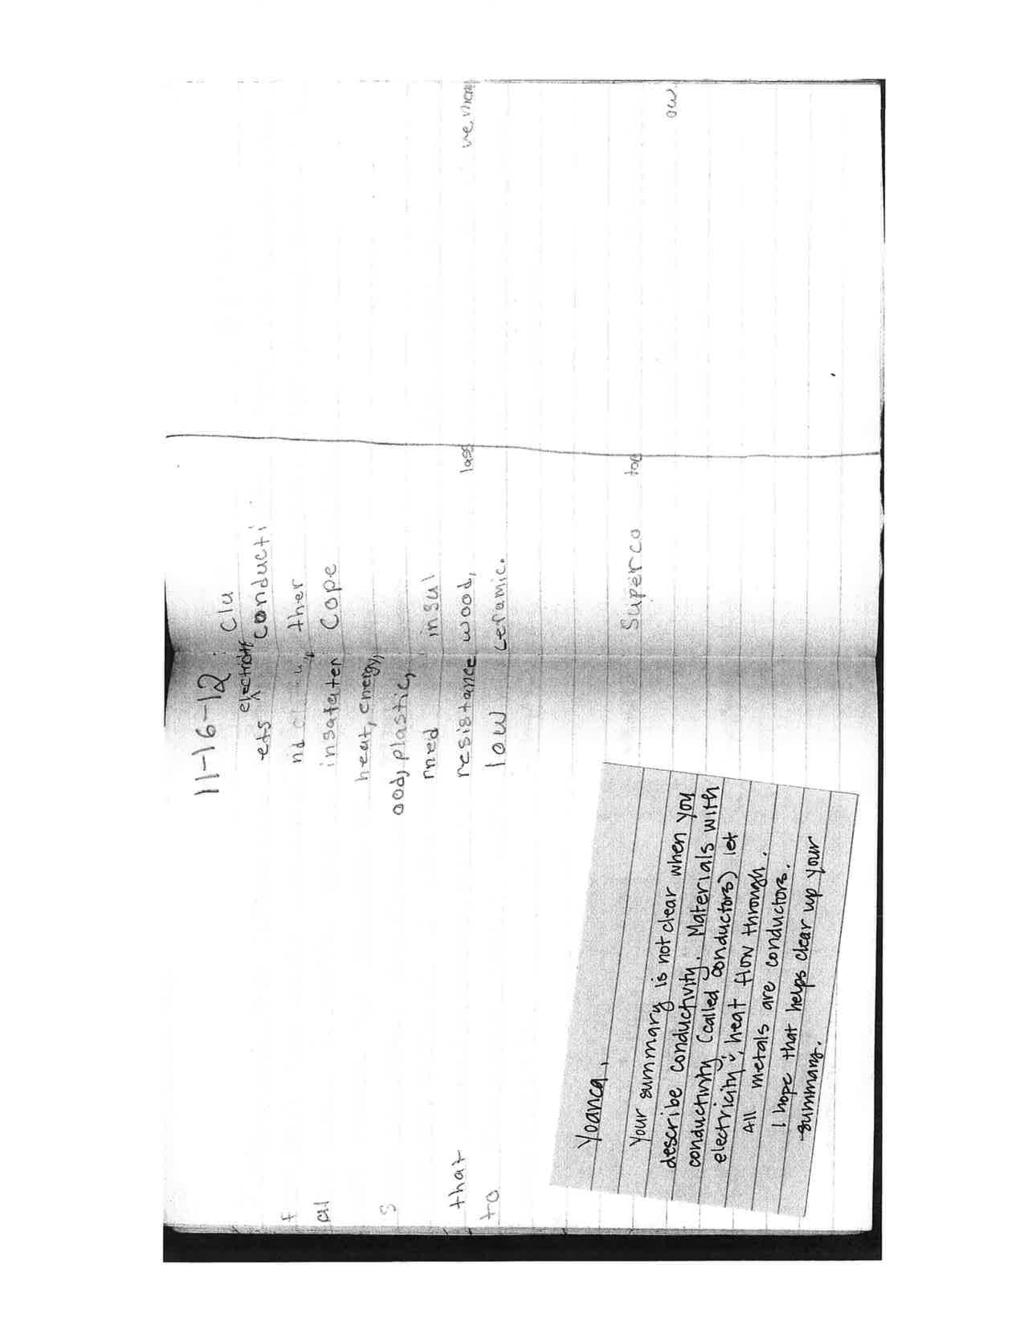
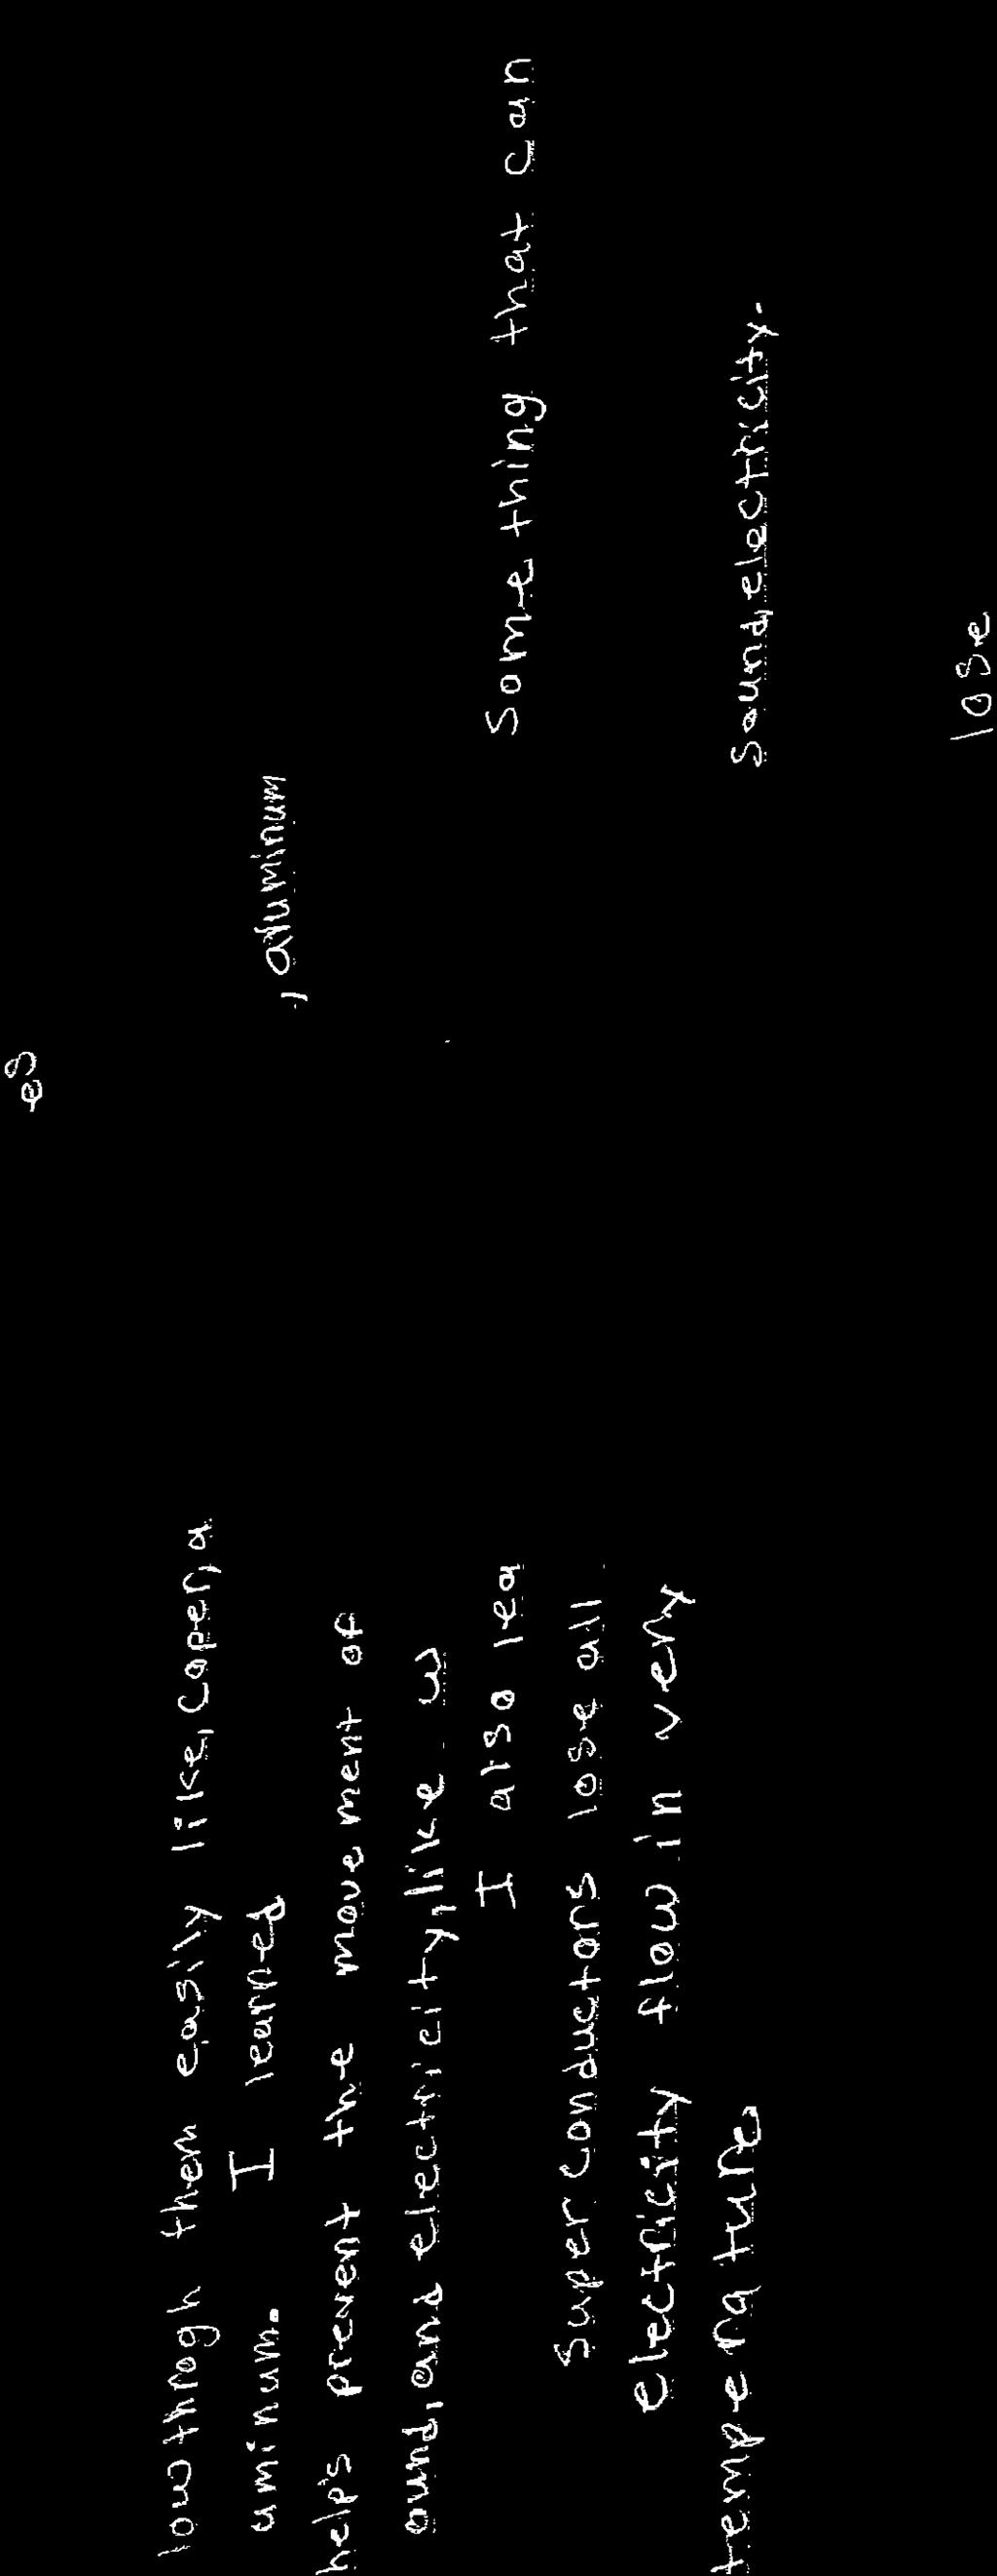
55 54
56 55
57 56 Handout #4
58 Day 1: Monday, November 4, 2011 HO Question: What is similar and different about plant and animal cells? Why are they similar, why are they different? Prompt: Write and draw what you know about animal and plant cells. Cells are small things. Plant and animal cells are different. Plant cells have chloroplasts. Plants make their food. Plants need sunlight and water. Plant cells are simpler. I have blood cells. Reading Notes All living things are made out of one or more cells Cells carry out the function of life Cells have organelles Plant cells have cell walls and are rectangular Plant cells have chloroplasts to help make food Animal cells are different shapes. Animal cells don t have cell walls Both plant and animal cells have: o Plasma cell membrane o Nucleus o Mitochondria o Cytoplasm Prompt: Pick one note and write about why you think it is important. Animal cells don t have cell walls. I m not sure what a cell wall is. Why don t animals have them? Compare with your neighbor and add one new idea Cell walls enable plants to stand up. That must be why animal cells don t have them. I think animals have backbones. 57

 Prompt: Use your drawings from the")

59 Day 2: Tuesday, November 5, 2011 Prompt: observe a cheek cell and cell of a lily leaf under the microscope. Draw and label what you observe. Microscope Drawings (400x) Prompt: Use your drawings from the text to label the part of the cell. Cell Drawings from page 73 My cells don t look like this. Are they supposed to be square? How come I can t see all the stuff in my drawigs? 58
60 Prompt: Compare and contrast your microscope drawing with the drawing in the text. What do you notice? Use notes from your reading to answer this question. From my reading notes, the microscope lab and the drawings, I know that plants and animals are made out of cells. They both have organelles like: nucleus, mitochondria, cell membrane, vacuoles, cytoplasm. Only plant cells have chloroplasts and a cell wall. The plant cell is rectangular and the animal cell is round. In the microscope I could only see some of the organelles that are in the pictures. The diagram showed more. Prompt: What are you thinking about now? I thought plants were simpler, but I don t think so anymore because of the drawing and looking at it through the microscope. I know that plants and animal cells have similar organelles and different organelles, but I don t know why. I wonder if all cells look like the ones we looked at? 59
61 Day 1: October 2, 2011 HO Question: What do magnets stick to? Prompt: Predict which of the following items a magnet will stick to. Item Chair legs Table top Whiteboard Brads Paper clips String A Penny Scissors Rock Rubber band Washer Yes/No Yes Yes Yes Yes yes no yes yes no no yes Prompt: Record your data in a T-chart Item chair leg String Paper clip Brad A Penny Whiteboard Scissors Rock Table top Washer Rubber band Yes/No yes No Yes No No no Yes No No Yes No Prompt: What surprised you about your results? Why? I thought a brad would stick because it is a metal. The paper clip stuck and that s a metal so I m confused Prompt: Compare your data with your partner and together develop a rule that tells what a magnet will stick to. What is your evidence? 60
62 Magnets will stick to any silver or gray metal. My evidence is that only the silver and gray metals in my chart stuck to the magnet. The brad is metal, but did not stick to the magnet. Prompt: Challenge your rule. Here are 4 more items. Will they stick to your magnet? Item Classroom door Soda Can Stainless steel fork Steel Nail Yes/No Yes No No Yes Prompt: Summarize your results Magnets will stick to some metals and not others. The color does not seem to matter because the classroom door was yellow, the soda can was red and the fork was silver. Prompt: I thought Now I know I wonder I thought that magnets stuck to all metals. Now I know that they only stick to some metals and won t stick to stuff that isn t made of metal. I wonder what is different about some metals that makes a magnet stick to them. 61


63 Day 1: October 28, 2011 HO What do you remember about how the sun moves (from our last lesson)? What are shadows and what causes them? Shadows are people or objects refleckded off the sun. At 11:00 am, students have traced their shadow in chalk on the playground. Make a drawing of what your shadow looked like at 11:00 am. Predict what you think your shadow will look like at 2:00 pm. Do not forget to include N, S, W, and E in your drawing. 62

64 Students went back out and looked at their shadows at 2:00 pm and tracked their shadows on the ground again. They made additional drawings. I thought that my shadow was going to be on the opposite side but I was wrong. The sun was not where I thought it was going to be. 63

65 Day 2: October 29, 2011 Prompt: How did the sun s position and motion affect your shadow? Shaddows cange size depending on the time of day it is. When the sun is in the east than your saddow will be in the west. I now know that whereever the sun is my shaddow will be on the opposite side. I am blocking the suns light and that makes the shaddow. I don t know why the shaddow gets taller or smaller. Day 3: October 30, 2011 Prompt: Where do shadows come from and what causes them to change? Include a drawing in your explanation. 64
66 Science Notebook Entry Types Science notebooks contain information about the students classroom experiences and are used much as scientists would, before, during, and after all investigations. They are a place where students formulate and record their questions, make predictions, record data, procedures, and results, compose reflections, and communicate findings. Most importantly, notebooks provide a place for students to record new concepts they have learned. By reviewing hundreds of actual student notebooks, a group of education leaders from Washington State explored how teachers were asking students to record their ideas in their science notebooks. Analysis of the student work revealed eight distinct strategies or entry types, used most frequently by practicing K12 teachers. This handout describes those eight entry types and offers a rationale for why a teacher might select a given entry type. The companion website - illustrates each entry type with multiple samples of student work stored in a searchable online database. The samples come from students of all grade levels, demographic groups, and geographic regions. Drawings Entry Type Tables, Charts, and Graphs Definition and Purpose Definition Student generated drawings of materials, scientific investigation set-up, observations, or concepts. Three common types of drawings used in science notebooks include: 1. Sketches: Informal pictures of objects or concepts created with little detail. 2. Scientific Illustrations: Detailed, accurate, labeled drawings of observations or concepts. 3. Technical Drawings: A record of a product in such detail that someone could create the product from the drawings. Purpose Students use drawings to make their thinking and observations of concrete or abstract ideas visible. Drawings access diverse learning styles, allow entry to the writing process for special needs students and emergent writers, and assist in vocabulary development (e.g. oral explanations, group discussions, labels). Definition Formats for recording and organizing data, results, and observations. Purpose Students use tables and charts to organize information in a form that is easily read and understood. Recording data in these forms facilitates record keeping. Students use graphs to compare and analyze data, display patterns and trends, and synthesize information to communicate results. Science Notebook Entry Types 1 11/8/
67 Graphic Organizers Notes and Practice Problems Reflective and Analytical Entries Inserts Investigation Formats Writing Frames Definition Tools that illustrate connections among and between ideas, objects, and information. Examples include, but are not limited to, Venn diagrams, Box and-t charts, and concept maps. Purpose Graphic organizers help students organize ideas to recognize and to communicate connections and relationships. Definition A record of ideas, observations, or descriptions of information from multiple sources, including but not limited to direct instruction, hands-on experiences, videos, readings, research, demonstrations, solving equations, responding to guiding questions, or developing vocabulary. Purpose Students use notes and practice problems to construct meaning and practice skills for current use and future reference. Definition A record of a student s own thoughts and ideas, including, but not limited to initial ideas, self-generated questions, reflections, data analysis, reactions, application of knowledge to new situations, and conclusions. Purpose Students use reflective and analytical entries to think about scientific content from their own perspective, make sense of data, ask questions about their ideas and learning processes, and clarify and revise their thinking. Definition Inserts are artifacts placed within a notebook, including, but not limited to photographs, materials (e.g. flower petals, crystals, chromatography results), and supplemental readings (e.g. newspaper clippings). Purpose Students use inserts to document and to enrich their learning. Definition Scaffolds to guide students through a controlled investigation, field investigation, or design process. Examples include, but are not limited to investigation planning sheets or science writing heuristics. Purpose Students use investigation formats to guide their thinking and writing while they design and conduct investigations. Students also use these formats to reflect on and discuss their findings and ideas. Definition Writing prompts used to focus a student s thinking. Examples include, but are not limited to, I smelled I felt I observed, My results show, The variable I will change is, or I think that because. Purpose Students use frames to organize their ideas, prompt their thinking, and structure their written response. Frames help students become more proficient in scientific writing and less reliant upon the prompts. Science Notebook Entry Types 1 11/8/
68 Drawing 67

69 Tables, Charts, and Graphs 68
70 Graphic Organizers 69

71 Notes and Practice Problems 70

72 Reflective and Analytical Entries 71
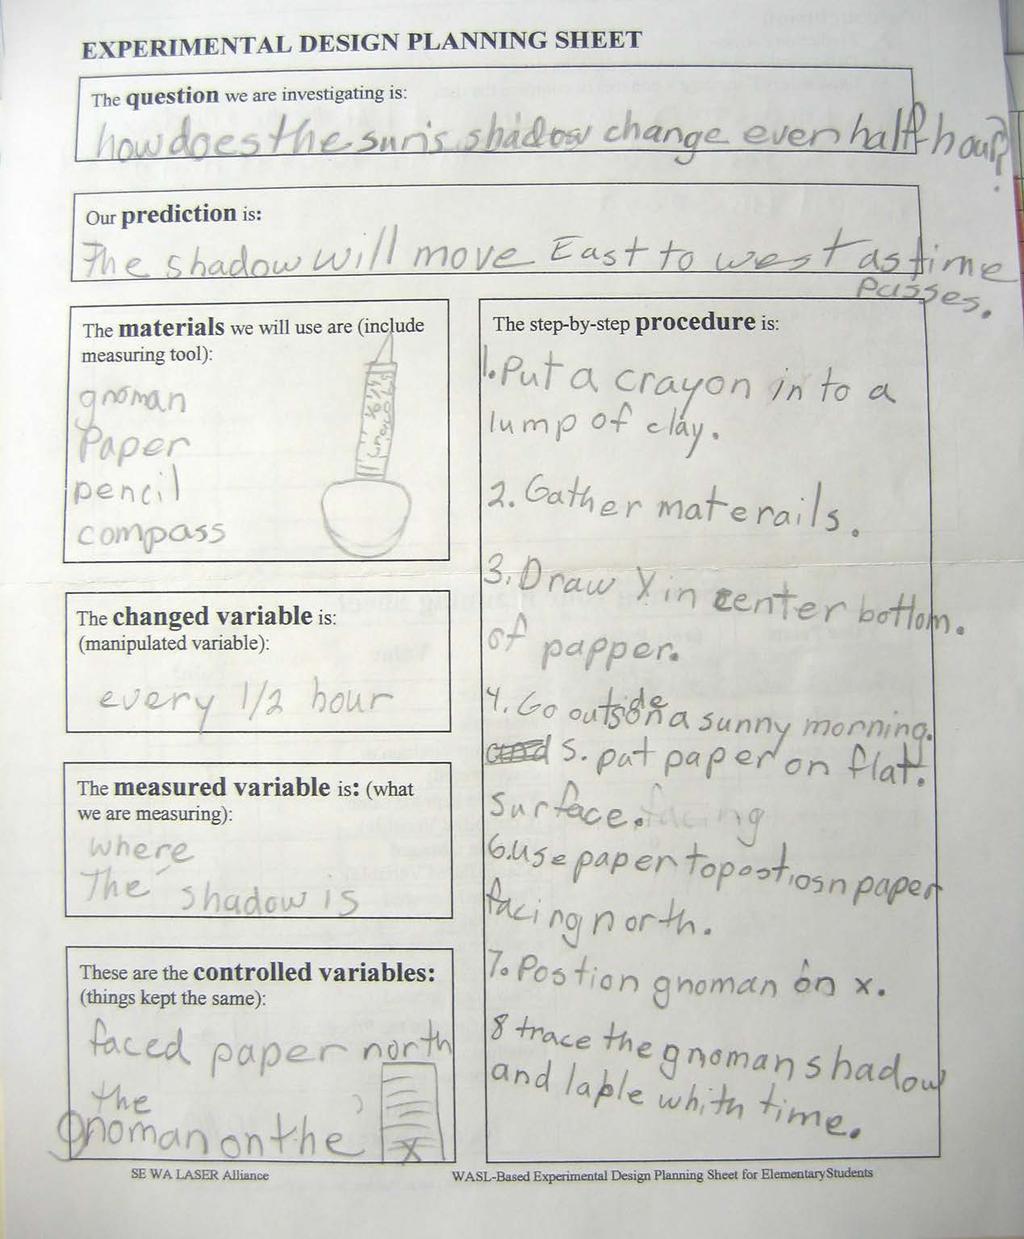
73 Inserts 72

74 Investigation Formats 73

75 t Writing Frames 74
How to Read the Next Generation Science Standards (NGSS)
") How to Read the Next Generation Science Standards (NGSS) The Next Generation Science Standards (NGSS) are distinct from prior science standards in three essential ways. 1) Performance. Prior standards
How to Read the Next Generation Science Standards (NGSS) The Next Generation Science Standards (NGSS) are distinct from prior science standards in three essential ways. 1) Performance. Prior standards
Teaching NGSS in Elementary School Third Grade
 LIVE INTERACTIVE LEARNING @ YOUR DESKTOP Teaching NGSS in Elementary School Third Grade Presented by: Ted Willard, Carla Zembal-Saul, Mary Starr, and Kathy Renfrew December 17, 2014 6:30 p.m. ET / 5:30
This Performance Standards include four major components. They are
 Environmental Physics Standards The Georgia Performance Standards are designed to provide students with the knowledge and skills for proficiency in science. The Project 2061 s Benchmarks for Science Literacy
Rendezvous with Comet Halley Next Generation of Science Standards
 Next Generation of Science Standards 5th Grade 6 th Grade 7 th Grade 8 th Grade 5-PS1-3 Make observations and measurements to identify materials based on their properties. MS-PS1-4 Develop a model that
Arizona s English Language Arts Standards th Grade ARIZONA DEPARTMENT OF EDUCATION HIGH ACADEMIC STANDARDS FOR STUDENTS
 Arizona s English Language Arts Standards 11-12th Grade ARIZONA DEPARTMENT OF EDUCATION HIGH ACADEMIC STANDARDS FOR STUDENTS 11 th -12 th Grade Overview Arizona s English Language Arts Standards work together
Statewide Framework Document for:
 Statewide Framework Document for: 270301 Standards may be added to this document prior to submission, but may not be removed from the framework to meet state credit equivalency requirements. Performance
Probability and Statistics Curriculum Pacing Guide
 Unit 1 Terms PS.SPMJ.3 PS.SPMJ.5 Plan and conduct a survey to answer a statistical question. Recognize how the plan addresses sampling technique, randomization, measurement of experimental error and methods
AGS THE GREAT REVIEW GAME FOR PRE-ALGEBRA (CD) CORRELATED TO CALIFORNIA CONTENT STANDARDS
 CORRELATED TO CALIFORNIA CONTENT STANDARDS") AGS THE GREAT REVIEW GAME FOR PRE-ALGEBRA (CD) CORRELATED TO CALIFORNIA CONTENT STANDARDS 1 CALIFORNIA CONTENT STANDARDS: Chapter 1 ALGEBRA AND WHOLE NUMBERS Algebra and Functions 1.4 Students use algebraic
AGS THE GREAT REVIEW GAME FOR PRE-ALGEBRA (CD) CORRELATED TO CALIFORNIA CONTENT STANDARDS 1 CALIFORNIA CONTENT STANDARDS: Chapter 1 ALGEBRA AND WHOLE NUMBERS Algebra and Functions 1.4 Students use algebraic
Algebra 1, Quarter 3, Unit 3.1. Line of Best Fit. Overview
 Algebra 1, Quarter 3, Unit 3.1 Line of Best Fit Overview Number of instructional days 6 (1 day assessment) (1 day = 45 minutes) Content to be learned Analyze scatter plots and construct the line of best
Disciplinary Literacy in Science
 Disciplinary Literacy in Science 18 th UCF Literacy Symposium 4/1/2016 Vicky Zygouris-Coe, Ph.D. UCF, CEDHP vzygouri@ucf.edu April 1, 2016 Objectives Examine the benefits of disciplinary literacy for science
Dublin City Schools Broadcast Video I Graded Course of Study GRADES 9-12
 Philosophy The Broadcast and Video Production Satellite Program in the Dublin City School District is dedicated to developing students media production skills in an atmosphere that includes stateof-the-art
Grade 4. Common Core Adoption Process. (Unpacked Standards)
") Grade 4 Common Core Adoption Process (Unpacked Standards) Grade 4 Reading: Literature RL.4.1 Refer to details and examples in a text when explaining what the text says explicitly and when drawing inferences
Grade 4 Common Core Adoption Process (Unpacked Standards) Grade 4 Reading: Literature RL.4.1 Refer to details and examples in a text when explaining what the text says explicitly and when drawing inferences
INSTRUCTIONAL FOCUS DOCUMENT Grade 5/Science
 Exemplar Lesson 01: Comparing Weather and Climate Exemplar Lesson 02: Sun, Ocean, and the Water Cycle State Resources: Connecting to Unifying Concepts through Earth Science Change Over Time RATIONALE:
PAGE(S) WHERE TAUGHT If sub mission ins not a book, cite appropriate location(s))
 WHERE TAUGHT If sub mission ins not a book, cite appropriate location(s))") Ohio Academic Content Standards Grade Level Indicators (Grade 11) A. ACQUISITION OF VOCABULARY Students acquire vocabulary through exposure to language-rich situations, such as reading books and other
Ohio Academic Content Standards Grade Level Indicators (Grade 11) A. ACQUISITION OF VOCABULARY Students acquire vocabulary through exposure to language-rich situations, such as reading books and other
Self Study Report Computer Science
 Computer Science undergraduate students have access to undergraduate teaching, and general computing facilities in three buildings. Two large classrooms are housed in the Davis Centre, which hold about
Science Fair Project Handbook
 Science Fair Project Handbook IDENTIFY THE TESTABLE QUESTION OR PROBLEM: a) Begin by observing your surroundings, making inferences and asking testable questions. b) Look for problems in your life or surroundings
Extending Place Value with Whole Numbers to 1,000,000
 Grade 4 Mathematics, Quarter 1, Unit 1.1 Extending Place Value with Whole Numbers to 1,000,000 Overview Number of Instructional Days: 10 (1 day = 45 minutes) Content to Be Learned Recognize that a digit
Biome I Can Statements
 Biome I Can Statements I can recognize the meanings of abbreviations. I can use dictionaries, thesauruses, glossaries, textual features (footnotes, sidebars, etc.) and technology to define and pronounce
Radius STEM Readiness TM
 Curriculum Guide Radius STEM Readiness TM While today s teens are surrounded by technology, we face a stark and imminent shortage of graduates pursuing careers in Science, Technology, Engineering, and
SAT MATH PREP:
 SAT MATH PREP: 2015-2016 NOTE: The College Board has redesigned the SAT Test. This new test will start in March of 2016. Also, the PSAT test given in October of 2015 will have the new format. Therefore
Document number: 2013/ Programs Committee 6/2014 (July) Agenda Item 42.0 Bachelor of Engineering with Honours in Software Engineering
 Agenda Item 42.0 Bachelor of Engineering with Honours in Software Engineering") Document number: 2013/0006139 Programs Committee 6/2014 (July) Agenda Item 42.0 Bachelor of Engineering with Honours in Software Engineering Program Learning Outcomes Threshold Learning Outcomes for Engineering
Document number: 2013/0006139 Programs Committee 6/2014 (July) Agenda Item 42.0 Bachelor of Engineering with Honours in Software Engineering Program Learning Outcomes Threshold Learning Outcomes for Engineering
Grade 6: Correlated to AGS Basic Math Skills
 Grade 6: Correlated to AGS Basic Math Skills Grade 6: Standard 1 Number Sense Students compare and order positive and negative integers, decimals, fractions, and mixed numbers. They find multiples and
5.1 Sound & Light Unit Overview
 5.1 Sound & Light Unit Overview Enduring Understanding: Sound and light are forms of energy that travel and interact with objects in various ways. Essential Question: How is sound energy transmitted, absorbed,
The College Board Redesigned SAT Grade 12
 A Correlation of, 2017 To the Redesigned SAT Introduction This document demonstrates how myperspectives English Language Arts meets the Reading, Writing and Language and Essay Domains of Redesigned SAT.
Facing our Fears: Reading and Writing about Characters in Literary Text
 Facing our Fears: Reading and Writing about Characters in Literary Text by Barbara Goggans Students in 6th grade have been reading and analyzing characters in short stories such as "The Ravine," by Graham
FIGURE IT OUT! MIDDLE SCHOOL TASKS. Texas Performance Standards Project
 FIGURE IT OUT! MIDDLE SCHOOL TASKS π 3 cot(πx) a + b = c sinθ MATHEMATICS 8 GRADE 8 This guide links the Figure It Out! unit to the Texas Essential Knowledge and Skills (TEKS) for eighth graders. Figure
Statewide Framework Document for:
 Statewide Framework Document for: 260102 Standards may be added to this document prior to submission, but may not be removed from the framework to meet state credit equivalency requirements. Performance
MADERA SCIENCE FAIR 2013 Grades 4 th 6 th Project due date: Tuesday, April 9, 8:15 am Parent Night: Tuesday, April 16, 6:00 8:00 pm
 MADERA SCIENCE FAIR 2013 Grades 4 th 6 th Project due date: Tuesday, April 9, 8:15 am Parent Night: Tuesday, April 16, 6:00 8:00 pm Why participate in the Science Fair? Science fair projects give students
AGENDA LEARNING THEORIES LEARNING THEORIES. Advanced Learning Theories 2/22/2016
 AGENDA Advanced Learning Theories Alejandra J. Magana, Ph.D. admagana@purdue.edu Introduction to Learning Theories Role of Learning Theories and Frameworks Learning Design Research Design Dual Coding Theory
Statistical Analysis of Climate Change, Renewable Energies, and Sustainability An Independent Investigation for Introduction to Statistics
 5/22/2012 Statistical Analysis of Climate Change, Renewable Energies, and Sustainability An Independent Investigation for Introduction to Statistics College of Menominee Nation & University of Wisconsin
The lab is designed to remind you how to work with scientific data (including dealing with uncertainty) and to review experimental design.
 and to review experimental design.") Name: Partner(s): Lab #1 The Scientific Method Due 6/25 Objective The lab is designed to remind you how to work with scientific data (including dealing with uncertainty) and to review experimental design.
Name: Partner(s): Lab #1 The Scientific Method Due 6/25 Objective The lab is designed to remind you how to work with scientific data (including dealing with uncertainty) and to review experimental design.
Unit: Human Impact Differentiated (Tiered) Task How Does Human Activity Impact Soil Erosion?
 Task How Does Human Activity Impact Soil Erosion?") The following instructional plan is part of a GaDOE collection of Unit Frameworks, Performance Tasks, examples of Student Work, and Teacher Commentary. Many more GaDOE approved instructional plans are
The following instructional plan is part of a GaDOE collection of Unit Frameworks, Performance Tasks, examples of Student Work, and Teacher Commentary. Many more GaDOE approved instructional plans are
Preparing for NGSS: Planning and Carrying Out Investigations
 LIVE INTERACTIVE LEARNING @ YOUR DESKTOP Preparing for NGSS: Planning and Carrying Out Investigations Presented by: Rick Duschl October 9, 2012 6:30 p.m. 8:00 p.m. Eastern time 9 NSTA Learning Center 9,500+
EQuIP Review Feedback
 EQuIP Review Feedback Lesson/Unit Name: On the Rainy River and The Red Convertible (Module 4, Unit 1) Content Area: English language arts Grade Level: 11 Dimension I Alignment to the Depth of the CCSS
Digital Media Literacy
 Digital Media Literacy Draft specification for Junior Cycle Short Course For Consultation October 2013 2 Draft short course: Digital Media Literacy Contents Introduction To Junior Cycle 5 Rationale 6 Aim
Math 96: Intermediate Algebra in Context
 : Intermediate Algebra in Context Syllabus Spring Quarter 2016 Daily, 9:20 10:30am Instructor: Lauri Lindberg Office Hours@ tutoring: Tutoring Center (CAS-504) 8 9am & 1 2pm daily STEM (Math) Center (RAI-338)
Livermore Valley Joint Unified School District. B or better in Algebra I, or consent of instructor
 Livermore Valley Joint Unified School District DRAFT Course Title: AP Macroeconomics Grade Level(s) 11-12 Length of Course: Credit: Prerequisite: One semester or equivalent term 5 units B or better in
Lecture 1: Machine Learning Basics
 1/69 Lecture 1: Machine Learning Basics Ali Harakeh University of Waterloo WAVE Lab ali.harakeh@uwaterloo.ca May 1, 2017 2/69 Overview 1 Learning Algorithms 2 Capacity, Overfitting, and Underfitting 3
Update on Standards and Educator Evaluation
 Update on Standards and Educator Evaluation Briana Timmerman, Ph.D. Director Office of Instructional Practices and Evaluations Instructional Leaders Roundtable October 15, 2014 Instructional Practices
Prentice Hall Literature Common Core Edition Grade 10, 2012
 A Correlation of Prentice Hall Literature Common Core Edition, 2012 To the New Jersey Model Curriculum A Correlation of Prentice Hall Literature Common Core Edition, 2012 Introduction This document demonstrates
Program Alignment Worksheet High School
 Program Alignment Worksheet High School Publisher Name Pearson Program Title Prentice Hall Biology (Miler/Levine) 2010; Event Based Science 2005 Computer Based? Requires Internet? Target Grades 9 12 Steps
Full text of O L O W Science As Inquiry conference. Science as Inquiry
 Page 1 of 5 Full text of O L O W Science As Inquiry conference Reception Meeting Room Resources Oceanside Unifying Concepts and Processes Science As Inquiry Physical Science Life Science Earth & Space
Cal s Dinner Card Deals
 Cal s Dinner Card Deals Overview: In this lesson students compare three linear functions in the context of Dinner Card Deals. Students are required to interpret a graph for each Dinner Card Deal to help
Timeline. Recommendations
 Introduction Advanced Placement Course Credit Alignment Recommendations In 2007, the State of Ohio Legislature passed legislation mandating the Board of Regents to recommend and the Chancellor to adopt
Lesson M4. page 1 of 2
 Lesson M4 page 1 of 2 Miniature Gulf Coast Project Math TEKS Objectives 111.22 6b.1 (A) apply mathematics to problems arising in everyday life, society, and the workplace; 6b.1 (C) select tools, including
Rover Races Grades: 3-5 Prep Time: ~45 Minutes Lesson Time: ~105 minutes
 Rover Races Grades: 3-5 Prep Time: ~45 Minutes Lesson Time: ~105 minutes WHAT STUDENTS DO: Establishing Communication Procedures Following Curiosity on Mars often means roving to places with interesting
Achievement Level Descriptors for American Literature and Composition
 Achievement Level Descriptors for American Literature and Composition Georgia Department of Education September 2015 All Rights Reserved Achievement Levels and Achievement Level Descriptors With the implementation
EGRHS Course Fair. Science & Math AP & IB Courses
 EGRHS Course Fair Science & Math AP & IB Courses Science Courses: AP Physics IB Physics SL IB Physics HL AP Biology IB Biology HL AP Physics Course Description Course Description AP Physics C (Mechanics)
Degree Qualification Profiles Intellectual Skills
 Degree Qualification Profiles Intellectual Skills Intellectual Skills: These are cross-cutting skills that should transcend disciplinary boundaries. Students need all of these Intellectual Skills to acquire
Teaching a Laboratory Section
 Chapter 3 Teaching a Laboratory Section Page I. Cooperative Problem Solving Labs in Operation 57 II. Grading the Labs 75 III. Overview of Teaching a Lab Session 79 IV. Outline for Teaching a Lab Session
GUIDE CURRICULUM. Science 10
 Science 10 Arts Education Business Education English Language Arts Entrepreneurship Family Studies Health Education International Baccalaureate Languages Mathematics Personal Development and Career Education
DIGITAL GAMING & INTERACTIVE MEDIA BACHELOR S DEGREE. Junior Year. Summer (Bridge Quarter) Fall Winter Spring GAME Credits.
 Fall Winter Spring GAME Credits.") DIGITAL GAMING & INTERACTIVE MEDIA BACHELOR S DEGREE Sample 2-Year Academic Plan DRAFT Junior Year Summer (Bridge Quarter) Fall Winter Spring MMDP/GAME 124 GAME 310 GAME 318 GAME 330 Introduction to Maya
DIGITAL GAMING & INTERACTIVE MEDIA BACHELOR S DEGREE Sample 2-Year Academic Plan DRAFT Junior Year Summer (Bridge Quarter) Fall Winter Spring MMDP/GAME 124 GAME 310 GAME 318 GAME 330 Introduction to Maya
All Systems Go! Using a Systems Approach in Elementary Science
 All Systems Go! CAST November Tracey Ramirez Professional Learning Facilitator The Charles A. Dana Center What we do and how we do it The Dana Center collaborates with others locally and nationally to
Teaching Literacy Through Videos
 Teaching Literacy Through Videos Elizabeth Stavis Reading Intervention Specialist RR Teacher Santa Clara Unified Jenny Maehara Elementary Literacy Specialist RR Teacher Santa Clara Unified February 9,
What is PDE? Research Report. Paul Nichols
 What is PDE? Research Report Paul Nichols December 2013 WHAT IS PDE? 1 About Pearson Everything we do at Pearson grows out of a clear mission: to help people make progress in their lives through personalized
Florida Mathematics Standards for Geometry Honors (CPalms # )
") A Correlation of Florida Geometry Honors 2011 to the for Geometry Honors (CPalms #1206320) Geometry Honors (#1206320) Course Standards MAFS.912.G-CO.1.1: Know precise definitions of angle, circle, perpendicular
A Correlation of Florida Geometry Honors 2011 to the for Geometry Honors (CPalms #1206320) Geometry Honors (#1206320) Course Standards MAFS.912.G-CO.1.1: Know precise definitions of angle, circle, perpendicular
Physical Features of Humans
 Grade 1 Science, Quarter 1, Unit 1.1 Physical Features of Humans Overview Number of instructional days: 11 (1 day = 20 30 minutes) Content to be learned Observe, identify, and record the external features
Practical Research. Planning and Design. Paul D. Leedy. Jeanne Ellis Ormrod. Upper Saddle River, New Jersey Columbus, Ohio
 SUB Gfittingen 213 789 981 2001 B 865 Practical Research Planning and Design Paul D. Leedy The American University, Emeritus Jeanne Ellis Ormrod University of New Hampshire Upper Saddle River, New Jersey
Dublin City Schools Mathematics Graded Course of Study GRADE 4
 I. Content Standard: Number, Number Sense and Operations Standard Students demonstrate number sense, including an understanding of number systems and reasonable estimates using paper and pencil, technology-supported
Designing a Rubric to Assess the Modelling Phase of Student Design Projects in Upper Year Engineering Courses
 Designing a Rubric to Assess the Modelling Phase of Student Design Projects in Upper Year Engineering Courses Thomas F.C. Woodhall Masters Candidate in Civil Engineering Queen s University at Kingston,
On Human Computer Interaction, HCI. Dr. Saif al Zahir Electrical and Computer Engineering Department UBC
 On Human Computer Interaction, HCI Dr. Saif al Zahir Electrical and Computer Engineering Department UBC Human Computer Interaction HCI HCI is the study of people, computer technology, and the ways these
What can I learn from worms?
 What can I learn from worms? Stem cells, regeneration, and models Lesson 7: What does planarian regeneration tell us about human regeneration? I. Overview In this lesson, students use the information that
Learning Disability Functional Capacity Evaluation. Dear Doctor,
 Dear Doctor, I have been asked to formulate a vocational opinion regarding NAME s employability in light of his/her learning disability. To assist me with this evaluation I would appreciate if you can
Mathematics subject curriculum
 Mathematics subject curriculum Dette er ei omsetjing av den fastsette læreplanteksten. Læreplanen er fastsett på Nynorsk Established as a Regulation by the Ministry of Education and Research on 24 June
Analyzing Linguistically Appropriate IEP Goals in Dual Language Programs
 Analyzing Linguistically Appropriate IEP Goals in Dual Language Programs 2016 Dual Language Conference: Making Connections Between Policy and Practice March 19, 2016 Framingham, MA Session Description
Major Milestones, Team Activities, and Individual Deliverables
 Major Milestones, Team Activities, and Individual Deliverables Milestone #1: Team Semester Proposal Your team should write a proposal that describes project objectives, existing relevant technology, engineering
Classroom Connections Examining the Intersection of the Standards for Mathematical Content and the Standards for Mathematical Practice
 Classroom Connections Examining the Intersection of the Standards for Mathematical Content and the Standards for Mathematical Practice Title: Considering Coordinate Geometry Common Core State Standards
Developing an Assessment Plan to Learn About Student Learning
 Developing an Assessment Plan to Learn About Student Learning By Peggy L. Maki, Senior Scholar, Assessing for Learning American Association for Higher Education (pre-publication version of article that
Technical Manual Supplement
 VERSION 1.0 Technical Manual Supplement The ACT Contents Preface....................................................................... iii Introduction....................................................................
Higher education is becoming a major driver of economic competitiveness
 Executive Summary Higher education is becoming a major driver of economic competitiveness in an increasingly knowledge-driven global economy. The imperative for countries to improve employment skills calls
TU-E2090 Research Assignment in Operations Management and Services
 Aalto University School of Science Operations and Service Management TU-E2090 Research Assignment in Operations Management and Services Version 2016-08-29 COURSE INSTRUCTOR: OFFICE HOURS: CONTACT: Saara
Maximizing Learning Through Course Alignment and Experience with Different Types of Knowledge
 Innov High Educ (2009) 34:93 103 DOI 10.1007/s10755-009-9095-2 Maximizing Learning Through Course Alignment and Experience with Different Types of Knowledge Phyllis Blumberg Published online: 3 February
California Department of Education English Language Development Standards for Grade 8
 Section 1: Goal, Critical Principles, and Overview Goal: English learners read, analyze, interpret, and create a variety of literary and informational text types. They develop an understanding of how language
Abc Of Science 8th Grade
 Abc Of 8th Grade Free PDF ebook Download: Abc Of 8th Grade Download or Read Online ebook abc of science 8th grade in PDF Format From The Best User Guide Database In addition, some courses such as 7th grade
Creating Coherent Inquiry Projects to Support Student Cognition and Collaboration in Physics
 Creating Coherent Inquiry Projects to Support Student Cognition and Collaboration in Physics 6 Douglas B. Clark, Arizona State University S. Raj Chaudhury, Christopher Newport University As a physics teacher,
STA 225: Introductory Statistics (CT)
") Marshall University College of Science Mathematics Department STA 225: Introductory Statistics (CT) Course catalog description A critical thinking course in applied statistical reasoning covering basic
Marshall University College of Science Mathematics Department STA 225: Introductory Statistics (CT) Course catalog description A critical thinking course in applied statistical reasoning covering basic
Scientific Inquiry Test Questions
 Test Questions Free PDF ebook Download: Test Questions Download or Read Online ebook scientific inquiry test questions in PDF Format From The Best User Guide Database Understandings about scientific inquiry
Common Core State Standards for English Language Arts
 Reading Standards for Literature 6-12 Grade 9-10 Students: 1. Cite strong and thorough textual evidence to support analysis of what the text says explicitly as well as inferences drawn from the text. 2.
Planting Seeds, Part 1: Can You Design a Fair Test?
 Planting Seeds, Part 1: Can You Design a Fair Test? In this investigation, your team will choose 2 or 3 seeds in order to design an investigation to learn something more about them. First, you will need
learning collegiate assessment]
![learning collegiate assessment]](/thumbs/71/66063392.jpg "learning collegiate assessment]") [ collegiate learning assessment] INSTITUTIONAL REPORT 2005 2006 Kalamazoo College council for aid to education 215 lexington avenue floor 21 new york new york 10016-6023 p 212.217.0700 f 212.661.9766
[ collegiate learning assessment] INSTITUTIONAL REPORT 2005 2006 Kalamazoo College council for aid to education 215 lexington avenue floor 21 new york new york 10016-6023 p 212.217.0700 f 212.661.9766
Edexcel GCSE. Statistics 1389 Paper 1H. June Mark Scheme. Statistics Edexcel GCSE
 Edexcel GCSE Statistics 1389 Paper 1H June 2007 Mark Scheme Edexcel GCSE Statistics 1389 NOTES ON MARKING PRINCIPLES 1 Types of mark M marks: method marks A marks: accuracy marks B marks: unconditional
LOUISIANA HIGH SCHOOL RALLY ASSOCIATION
 LOUISIANA HIGH SCHOOL RALLY ASSOCIATION Literary Events 2014-15 General Information There are 44 literary events in which District and State Rally qualifiers compete. District and State Rally tests are
First Grade Curriculum Highlights: In alignment with the Common Core Standards
 First Grade Curriculum Highlights: In alignment with the Common Core Standards ENGLISH LANGUAGE ARTS Foundational Skills Print Concepts Demonstrate understanding of the organization and basic features
Pre-Health Sciences Pathway to Advanced Diplomas and Degrees Program Standard
 Pre-Health Sciences Pathway to Advanced Diplomas and Degrees Program Standard The approved program standard for Pre- Health Sciences Pathway to Advanced Diplomas and Degrees program of instruction leading
Unit 3. Design Activity. Overview. Purpose. Profile
 Unit 3 Design Activity Overview Purpose The purpose of the Design Activity unit is to provide students with experience designing a communications product. Students will develop capability with the design
Fourth Grade. Reporting Student Progress. Libertyville School District 70. Fourth Grade
 Fourth Grade Libertyville School District 70 Reporting Student Progress Fourth Grade A Message to Parents/Guardians: Libertyville Elementary District 70 teachers of students in kindergarten-5 utilize a
Literature and the Language Arts Experiencing Literature
 Correlation of Literature and the Language Arts Experiencing Literature Grade 9 2 nd edition to the Nebraska Reading/Writing Standards EMC/Paradigm Publishing 875 Montreal Way St. Paul, Minnesota 55102
Guidelines for Writing an Internship Report
 Guidelines for Writing an Internship Report Master of Commerce (MCOM) Program Bahauddin Zakariya University, Multan Table of Contents Table of Contents... 2 1. Introduction.... 3 2. The Required Components
Grade 6: Module 2A Unit 2: Overview
 Grade 6: Module 2A Unit 2: Overview Analyzing Structure and Communicating Theme in Literature: If by Rudyard Kipling and Bud, Not Buddy In the first half of this second unit, students continue to explore
Physics 270: Experimental Physics
 2017 edition Lab Manual Physics 270 3 Physics 270: Experimental Physics Lecture: Lab: Instructor: Office: Email: Tuesdays, 2 3:50 PM Thursdays, 2 4:50 PM Dr. Uttam Manna 313C Moulton Hall umanna@ilstu.edu
Thesis-Proposal Outline/Template
 Thesis-Proposal Outline/Template Kevin McGee 1 Overview This document provides a description of the parts of a thesis outline and an example of such an outline. It also indicates which parts should be
Number of students enrolled in the program in Fall, 2011: 20. Faculty member completing template: Molly Dugan (Date: 1/26/2012)
") Program: Journalism Minor Department: Communication Studies Number of students enrolled in the program in Fall, 2011: 20 Faculty member completing template: Molly Dugan (Date: 1/26/2012) Period of reference
Program: Journalism Minor Department: Communication Studies Number of students enrolled in the program in Fall, 2011: 20 Faculty member completing template: Molly Dugan (Date: 1/26/2012) Period of reference
English Language Arts Missouri Learning Standards Grade-Level Expectations
 A Correlation of, 2017 To the Missouri Learning Standards Introduction This document demonstrates how myperspectives meets the objectives of 6-12. Correlation page references are to the Student Edition
Ph.D. in Behavior Analysis Ph.d. i atferdsanalyse
 Program Description Ph.D. in Behavior Analysis Ph.d. i atferdsanalyse 180 ECTS credits Approval Approved by the Norwegian Agency for Quality Assurance in Education (NOKUT) on the 23rd April 2010 Approved
STEP 1: DESIRED RESULTS
 GRADE 11, UNIT #1 AUTHORS: N. Battista, R. Gold, V. Larsen, M. Vacchio Revised by: S. Chan, M. Contino, P. Liebowitz, G. Milos, C. Vittiglio A.Whitney, P. Duffy, G. Changa, P. Liebowitz, H. Chan, S. Brosnihan,
Inquiry Learning Methodologies and the Disposition to Energy Systems Problem Solving
 Inquiry Learning Methodologies and the Disposition to Energy Systems Problem Solving Minha R. Ha York University minhareo@yorku.ca Shinya Nagasaki McMaster University nagasas@mcmaster.ca Justin Riddoch
Study Group Handbook
 Study Group Handbook Table of Contents Starting out... 2 Publicizing the benefits of collaborative work.... 2 Planning ahead... 4 Creating a comfortable, cohesive, and trusting environment.... 4 Setting
Teachers Guide Chair Study
 Certificate of Initial Mastery Task Booklet 2006-2007 School Year Teachers Guide Chair Study Dance Modified On-Demand Task Revised 4-19-07 Central Falls Johnston Middletown West Warwick Coventry Lincoln
What is Thinking (Cognition)?
?") What is Thinking (Cognition)? Edward De Bono says that thinking is... the deliberate exploration of experience for a purpose. The action of thinking is an exploration, so when one thinks one investigates,
What is Thinking (Cognition)? Edward De Bono says that thinking is... the deliberate exploration of experience for a purpose. The action of thinking is an exploration, so when one thinks one investigates,
Challenging Texts: Foundational Skills: Comprehension: Vocabulary: Writing: Disciplinary Literacy:
 These shift kits have been designed by the Illinois State Board of Education English Language Arts Content Area Specialists. The role of these kits is to provide administrators and teachers some background